 Neliswa Mpayipheli
 Anele Mpupa
 Ntakadzeni Edwin Madala
 Philiswa Nosizo Nomngongo
- 1Department of Chemical Sciences, University of Johannesburg, Doornfontein Campus, Johannesburg, South Africa
- 2Department of Science and Innovation-National Research Foundation South African Research Chair Initiative (DSI-NRF SARChI) in Nanotechnology for Water, University of Johannesburg, Doornfontein, South Africa
- 3Agricultural Research Council-Vegetable, Industrial and Medicinal Plants (ARC-VIMP), Pretoria, South Africa
- 4Department of Biochemistry and Microbiology, Faculty of Science, Engineering and Agriculture, University of Venda, Thohoyandou, South Africa
Introduction: The presence of pharmaceuticals and personal care products in environmental matrices is considered one of the major scientific concerns. Most of these substances are disposed of unchanged through wastewater treatment plants and sewage systems. Consequently, they are continuously introduced into the water systems and progressively contaminate surface, ground and drinking water. During the COVID-19 pandemic, a large number of emerging contaminants including parabens were released to the environment through various routes. In this study, the occurrence of parabens (methylparaben (MePB), ethylparaben (EtPB), propylparaben (PrPB), and butylparaben (BuPB) was investigated in wastewater samples from various wastewater treatment plants (WWTPs) and the receiving surface waters in KwaZulu Natal and Gauteng Provinces (South Africa).
Methods: The samples were collected between October 2020 and December 2021, covering the 2nd, 3rd and 4th waves of the COVID-19 pandemic. A solid phase extraction protocol with high-performance liquid chromatography was used to extract and enrich parabens before analysis.
Results and Discussion: Methylparaben (2.02–84.7 μg/L), EtPB (<0.24–24.8 μg/L), PrPB (<0.26–55.1 μg/L), and BuPB (<0.27–17.3 μg/L) were quantified in wastewater influent collected WWTPs of KwaZulu Natal Province. While <0.19–5.43 μg/L, <0.16–5.63 μg/L, <0.17–6.89 μg/L, and <0.19–5.32 μg/L for MePB, EtPB, PrPB, and BuPB, respectively, were quantified in effluent wastewater from the same province. The concentrations of MePB, EtPB, PrPB, and BuPB in influent wastewater from Gauteng Province were 2.58–123 μg/L, <0.24–33.6 μg/L, 3.77–73.4 μg/L and <0.27–85.8 μg/L, respectively. In effluent wastewater, concentrations ranging from 0.24–17.76 μg/L (MePB), <0.16–4.88 μg/L (EtPB), 0.69-12.5 μg/L (PrPB), and <0.19–4.726 μg/L (BuPB) were quantified. During the 4th wave, the concentrations of parabens in surface water were lower compared to the second and third waves of the pandemic. In general, the paraben residues in the surface of KwaZulu Natal Province (<0.08–16.4 μg/L) were higher than those in Gauteng Province (0.08-3.14 µg/L). Methylparaben and propylparaben were dominant in all investigated samples (wastewater and surface water), followed by ethylparaben. The ecotoxicological risk assessment was carried out for aquatic biota, which was estimated in terms of risk quotients (RQs). RQs for the target compounds in river water indicated that MePB and EtPB pose low risk, whereas PrPB and BuPB pose low to medium risk to aquatic organisms.
1 Introduction
Hydroalcoholic gels were used as essential basic tools to prevent and mitigate the spread of COVID-19 (Vazquez et al., 2022). The pandemic also prompted increased usage of hand soaps, sanitisers and disinfectants (Brandtner et al., 2021). The main ingredients of alcohol-based hand sanitisers (ABHS) include alcohols and additives such as colourants, stabilisers, fragrances, preservatives, and formaldehyde, among other compounds (Atolani et al., 2020; Musee et al., 2023). Additionally, the use of hand hygiene products, such as soap and alcohol-based hand sanitisers, significantly increased before and after patient contact in hospitals (Al-Tawfiq et al., 2019; Jing et al., 2020; Chirani et al., 2021).
Due to the extensive use of hand hygiene products and their continuous release into the environment through domestic and industrial wastewater, various preservatives have been detected in water, soil, and sediment (Li et al., 2015). Even though some of these preservatives are biodegradable, their continued use leads to pseudo-persistence in the environment (Marta-Sanchez et al., 2018). It has been reported that most preservatives are frequently found in river water at concentrations ranging from ng L−1 to μg L−1 (Galinaro et al., 2022). Additionally, preservatives have been commonly detected in human urine, implying that humans must be widely exposed to these compounds. They have also been detected in human breast tumours and placental tissues, suggesting they could persist in the body (Li et al., 2021; Adhikari et al., 2022).
Among these preservatives, parabens are hydroxybenzoate esters widely used as antimicrobial preservatives in various industrial products (Ajiboye et al., 2021). Due to their low production cost, worldwide regulatory acceptance, and high stability regarding a broad activity spectrum, parabens have been widely used as preservatives in cosmetics, pharmaceuticals, and foodstuffs (Haman et al., 2015; Ma et al., 2016; Wei et al., 2021). The most widely used parabens include methylparaben (MePB), ethylparaben (EtPB), propylparaben (PrPB), and butylparaben (BuPB) (Lu et al., 2019; Grover et al., 2021). Furthermore, MePB, EtPB, and PrPB are predominantly found in over-the-counter pharmaceuticals and cosmetics in the South African market (Musee et al., 2023). As a result of the outbreak of COVID-19, higher production and usage of pharmaceuticals and personal care products to prevent and control the spread of the pandemic may lead to high concentrations of parabens in water bodies. This suggests that the residue of parabens and other emerging contaminants in aquatic environments worldwide might be higher than before. Therefore, the occurrence and concentration of parabens in surface waters should be constantly monitored to assess the negative impacts caused by COVID-19. Recent studies have proven that wastewater treatment plants (WWTPs) are hotspots for emerging contaminant emissions, contributing to water pollution (Diaz-Sosa et al., 2020; Valdez-Carrillo et al., 2020; Saidulu et al., 2021).
The main aim of this study was to investigate and monitor the occurrence of parabens in influent and the effluent of various wastewater treatment plants (WWTPs) and the receiving waters in KwaZulu Natal and Gauteng Provinces (South Africa) during a year sampling campaign. The study aimed to estimate the release of parabens to natural water systems during the pandemic. A generic solid phase extraction protocol for the analyte enrichment and sample clean-up capable of retaining parabens was applied. The extracts were analysed by liquid chromatography coupled to a diode array detector (HPLC-DAD), which allowed the quantification of parabens. Secondly, the ecological risk assessment of parabens against different aquatic species in surface water based on the risk quotient (RQ) was studied. To my knowledge, no research has focused on the occurrence and distribution of parabens in South African water bodies during COVID-19 outbreaks. The sampling was conducted between October 2020 and December 2022, coinciding with the pandemic’s second, third and fourth waves, where the use of pharmaceuticals and disinfectants was the highest. The information on parabens occurrence in KwaZulu Natal and Gauteng Provinces (South Africa) improved the understanding of the fate and transport of parabens via wastewater effluents.
2 Materials and methods
2.1 Chemicals and reagents
All chemicals were of analytical-reagent grade. Ultrapure water was obtained from (Direct-Q® 3UV-R purifier system, Millipore, Merck) for the experiments. Acetonitrile (LC-MS, grade), ethyl 4-hydroxybenzoate (EtP), Propyl 4-hydroxybenzoate (PrP) and Butyl 4-hydroxybenzoate (BuP) (Supplementary Table S1) were purchased from Merck (Johannesburg, South Africa). All solutions and dilutions were prepared using ultrapure water.
2.2 Sampling area
Two South African provinces Gauteng and KwaZulu Natal were chosen as the areas of study. These two provinces were selected because they are considered one of the most densely populated provinces in South Africa. Gauteng province is one of nine South African provinces, is demarcated into five health districts constituting 26 subdistricts. It constitutes 1.5% of South Africa’s landmass of 18,178 square kilometres (km2), but 26% (15.9/59.6 million) of its population. The City of Johannesburg district (population density 3,400 people/km2) ranks among the top 10 most densely populated cities globally (Mutevedzi et al., 2022). The KwaZulu Natal province is located in the south-east of South Africa. It is known as the second most populated province in the in South Africa, accounting for about 20% of the country’s total population (Desai et al., 2024).
2.3 Wastewater and river sample collection
Wastewater and river waste samples were collected from different sites in two administrative South African provinces, Gauteng and KwaZulu-Natal (October 2020-December 2021). The samples were collected immediately following the second COVID-19 wave in KwaZulu-Natal WWTPs (Albert Falls, Howick, Darvil, Mpumalanga, Hammersdale, Dassenhoek, KwaNdengezi, Verulam and Umdloti) as well as in rivers close to the WWTPs.
In addition, during the third COVID-19 wave, samples were collected in Gauteng across the greater Tshwane area (Babelegi, Baviaanspoort, Rooiwal East, Themba and Zeekoegat WWTPs). In contrast, during the fourth wave of the pandemic, samples were collected in KwaZulu Natal WWTPs (Howick, Darvil, Mpumalanga, Hammersdale, Northern and Southern). Surface samples were also taken from rivers allocated near the stated WWTPs. The samples were kept in the fridge at 4°C until analysis. Supplementary Tables S2 and S3 provide the sampling site descriptions for all the samples collected in Kwazulu Natal and Gauteng Provinces.
2.4 Sample preparation and analysis
Offline solid phase extraction SPE adopted from previous studies (Almeida et al., 2019) was used to extract compounds from the water aqueous samples (wastewater and river water). Before the extraction, C18 SPE cartridges (200 mg) were conditioned with 5 mL of acetonitrile and 5 mL of Milli-Q water. After that, 50 mL of the sample was loaded into the cartridges. Elution was performed by adding 2 mL of acetonitrile. The extract was then filtered into HPLC vials using 0.22 µm syringe filters. A similar method was followed to prepare the procedure blank samples (ultrapure water was used as a sample). Extraction of each sample was done in triplicates. An Agilent HPLC 1200 Infinity series (Agilent Technologies, Waldbronn, Germany) equipped with a diode array detector (DAD) (Agilent Technologies, Waldron, Germany) was used for the detection and quantification of MePB, EtPB, PrPB and BuPB. Chromatographic separations were obtained with an Agilent Zorbax Eclipse Plus C18 column (3.5 µm × 150 mm × 4.6 mm) (Agilent, Newport, CA, United States) at a temperature of 25°C. The mobile phase comprised 40% water (A) and 60% methanol (B) with a flow rate of 1 mL/min in an isocratic elution mode. The total run time and injection volume were 10 min and 5 μL, respectively. Lastly, the detection was managed at 260 nm.
2.5 Quality assurance/quality control
The quantification of parabens in the samples was carried out using external standards, and a seventh-point calibration curve was constructed using standard solutions at concentration levels ranging from 0.40 to 500 μg/L. The calibration curve with at least a coefficient of determination of R2 = 0.99 was used to estimate the concentrations of the analytes. Procedure (method) blanks (ultrapure water) and instrument blanks (acetonitrile and ultrapure water (1:1, v:v)) were involved throughout the analysis of the samples. The procedure and instrument blanks were analysed after every ten samples to check for possible carryover between samples. The results showed no contamination in blanks and no carryover observed. Therefore, background correction was not required. The method detection and quantification limits (MDL and MQL) were determined using a revised U.S. Environmental Protection Agency method (Supowit et al., 2016). They were estimated from the signal-to-noise ratio of 3 and 10 from the replicate analysis (n = 7) of tap water, river water, effluent and influent blank spiked with a standard solution containing parabens at 0.01 μg/L. Randomly selected river water, effluent and influent samples were spiked at three concentration levels with paraben standards (1, 50, 100 μg/L) to obtain recoveries. The method’s precision was calculated from spiked samples and expressed as relative standard deviations (%RSDs). The retention time (RT) of parabens in the wastewater and river water matrices was within ±0.3 min of the RT of the standard analytes under similar conditions.
2.6 Ecotoxicological risk assessment
Previous studies have reported that parabens in aquatic systems may lead to toxic effects on aquatic organisms (Nagar et al., 2020). Therefore, this study assessed the potential risk to organisms using the risk quotient (RQ) computed for algae, daphnia, and fish. The RQ values were calculated based on the measured environmental concentration (MEC) of parabens detected in river water and the predicted no-effect concentration (PNEC) using Eq. (1).
Where MEC is the measured environmental concentration of each analyte in river water, while PNEC is the predicted no-effect concentration, the PNEC values for acute and chronic tests were derived from the literature (Bolujoko et al., 2022) and are presented in Table 1. An assessment factor of 100 was employed for the acute tests, while an assessment factor of 10 was used for chronic tests for algae and daphnia alone (Yamamoto et al., 2011). The risk quotient is classified as high risk (RQ ≥ 1), medium risk (1 < RQ ≤ 0.1), and low risk (RQ < 0.1).
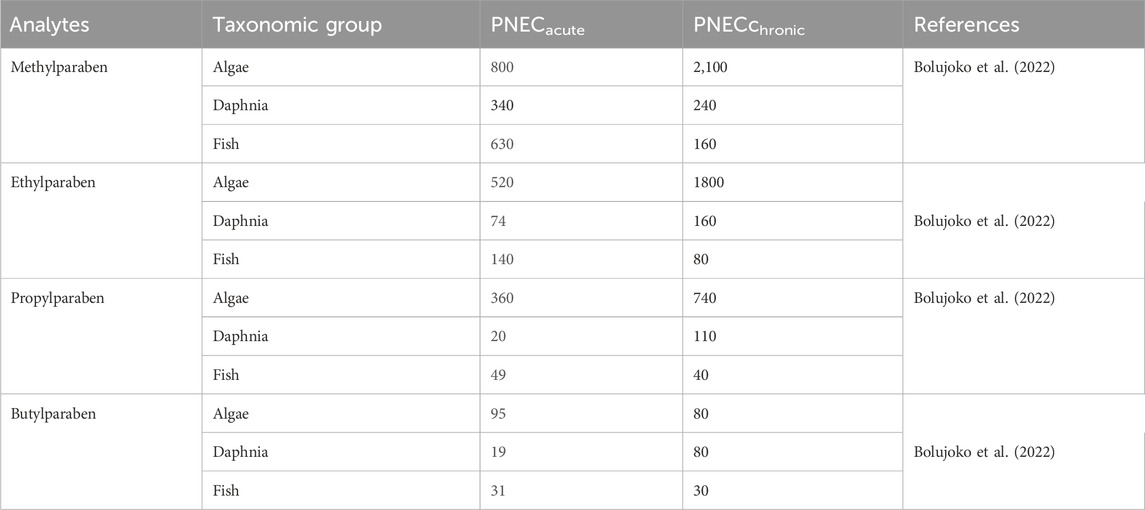
Table 1. Acute and chronic predicted no-effect concentrations (PNEC) (µg/L) of parabens in surface water samples.
3 Results and discussion
3.1 Method performance
The MDL and MQL in spiked surrogate river water, effluent, influent and ultrapure water are presented in Table 2. The MDL ranged from 12-14, 24-28, 48-56 and 71–82 ng/L in ultrapure water, river water, effluent and influent, respectively. Meanwhile, MQL ranged from 40-47, 80-93, 160-186, and 235–274 ng/L in ultrapure water, river water, effluent, and influent. These results have shown that the MDLs and MQLs were higher in wastewater samples due to matrix effects, but they were acceptable for accurate quantification of parabens.
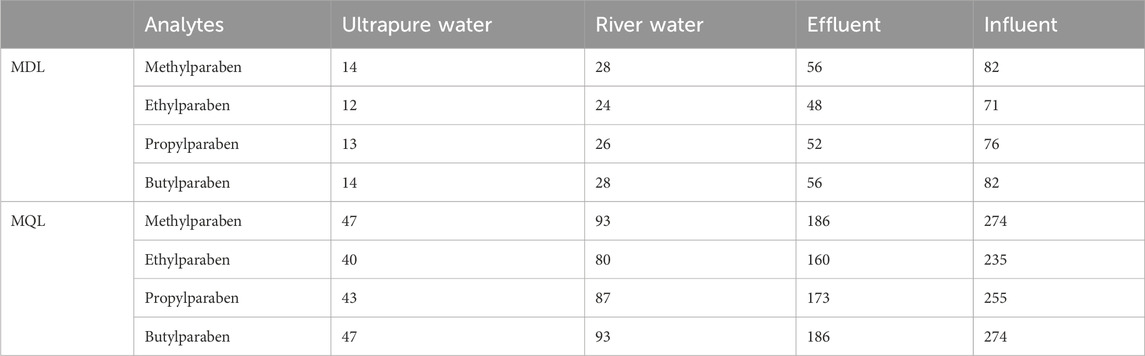
Table 2. SPE/HPLC-DAD method detection and quantification limits (MDLs and MQLs) estimated in various water matrices, units ng/L.
Average relative recoveries obtained using the spiking test ranged from 84% to 129% for all analytes (Table 3). These results indicate that the SPE/HPLC-DAD method had acceptable and good recoveries. The precision was less than 10%, showing the method has good repeatability.
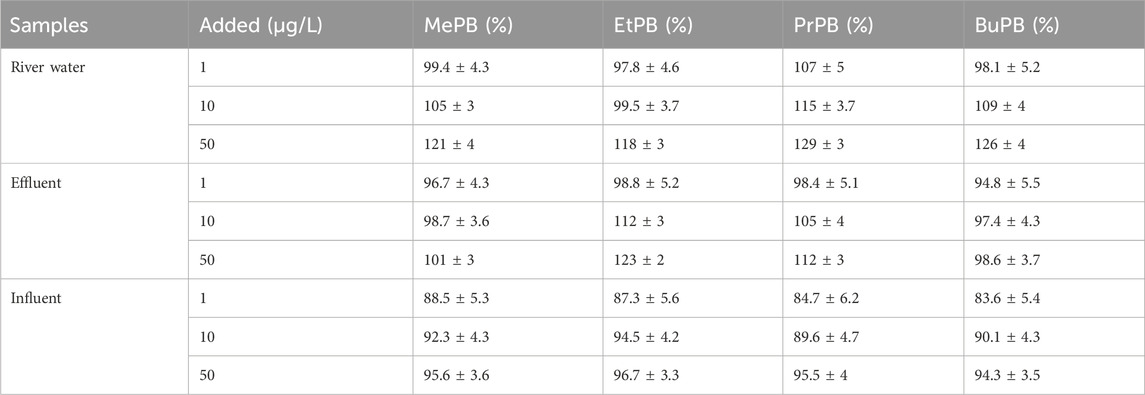
Table 3. SPE/HPLC-DAD method showing relative recoveries (mean ± standard deviation) of parabens from spiked river water and wastewater (effluent and influent) samples (n = 3).
3.2 Occurrence of parabens in water bodies from KwaZulu Natal Province
3.2.1 Concentration of parabens in wastewater
The concentrations of four commonly used parabens detected in wastewater samples from nine WWTPs in KwaZulu Natal Province are shown in Figures 1, 2. These concentrations were quantified in samples collected during the second and fourth waves of the COVID-19 pandemic. The results obtained showed that during the second wave of COVID-19, the target analytes were more frequently detected in the influent (inlet) than in effluent wastewater samples (Figure 1A and Supplementary Table S4). The average concentrations of parabens in wastewater influent ranged from ND-84.7 μg/L. MePB, EtPB and PrPB were the most common parabens detected in WWTPs influent, however MePB had the highest concentrations in most WWTPs influents than other parabens. The highest concentration was detected at Howick (84.7 μg/L), followed by the Darvil WWTP (71.3 μg/L). BuPB had the lowest frequency detection than other parabens.
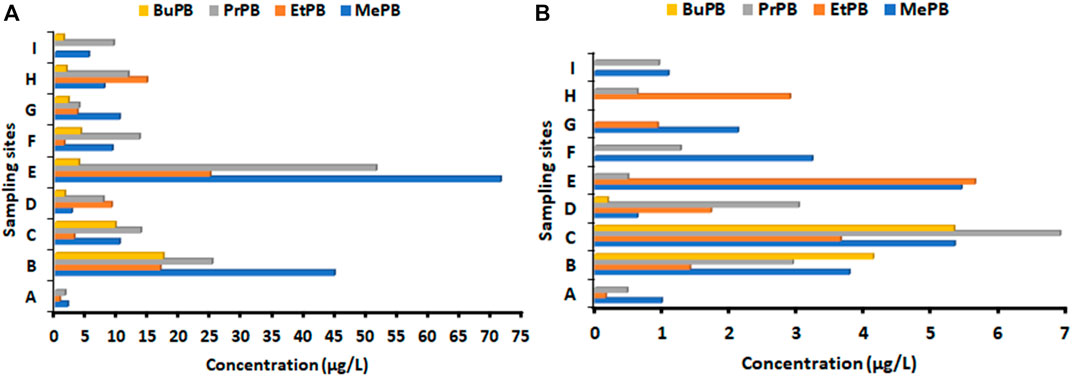
Figure 1. Concentrations (µg/L) of parabens in wastewater (A) influent and (B) effluent collected from selected KwaZulu Natal WWTPs during second wave of COVID-19. Sampling sites during second wave are: A = Albert Falls WWTP; B Darvil WWTP; C Dassenhoek WWTP; D Hammesdale WWTP; E Howick WWTP; F KwaNdengezi WWTP; G Mpumalanga WWTP; H Umdloti -WWTP; I Verulam WWTP.
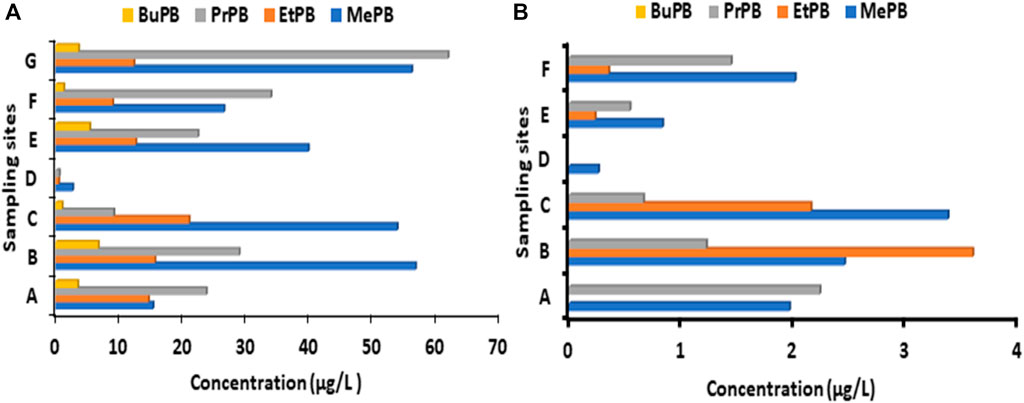
Figure 2. Concentrations (µg/L) of parabens in wastewater (A) influent and (B) effluent collected from selected KwaZulu Natal WWTPs during 4thwave of COVID-19. Sampling sites during fourth wave were: A Darvil WWTP; B Hammersdale WWTP; C Howick WWTP; D Mpumalanga WWTP; F Northern WWTP; G Southern WWTP.
Most of these parabens were detected in WWTP effluents during the second wave (Figure 1B). Overall, the concentration range was ND-13.5 μg/L. Despite the high-frequency detection of these parabens in WWTP effluents, it can be observed that there was a significant reduction in the concentration levels of these compounds in WWTP effluent samples. Additionally, BuPB had the lowest detection frequency in WWTP effluents with lower concentrations. Overall, there was a significant difference between the concentrations of parabens in effluent and influent samples. This might be due to the removal process, or some parabens are adsorbed on the sludge. The highest concentrations of parabens in effluent samples were recorded for Darvil and Dassenhoek WWTPs (Figure 1B).
During the fourth wave in KZN all four parabens were detected in WWTP influents (Figure 2A). MePB was measured in higher concentrations than other parabens. The concentration ranges of these compounds were as follows MePB (2.66–53.8 μg/L), EtPB (0.45–21.0 μg/L), PrPB (0.54–28.9 μg/L) and BuPB (0.97-6.68). These concentration ranges, which demonstrate the prevalence of MePB, EtPB, or PrPB, and then BuPB, are in good agreement with the literature. The relatively high concentrations and high detection frequency of MePB, EtPB and PrPB in wastewater samples can be justified by the synergic preservative effect obtained when two compounds are used together (Ramírez et al., 2012), suggesting that two of the parabens might have been combined as preservatives.
During fourth wave, MePB, EtPB and PrPB were the most abundant compared to BuPB in WWTPs effluent samples (Figure 2B). This is because MePB, BuPB and PrPB are the most widely used pharmaceutical and personal care preservatives. In addition, MePB and PrPB were generally found at higher concentrations than EtPB and BuPB (Figure 2B). The average concentration of parabens in selected KZN WWTPs effluents during the fourth wave ranged from ND-3.51 μg/L (Figure 2B and Supplementary Table S5).
The sum concentration of parabens in influent wastewater samples, during the second wave of COVID-19 followed the order: Howick (151 μg/L), Darvil (104 μg/L), Dassenhoek (36.6 μg/L), Umdloti (36.0 μg/L), KwaNdengezi (28.2 μg/L), Hammesdale (20.9 μg/L), Mpumalanga (19.9 μg/L), Verulam (16.1 μg/L) and Albert Falls (4.33 μg/L) WWTPs (Figure 3A). Generally, high concentrations of parabens were observed in KwaZulu Natal during the second wave of COVID-19, except for Albert Falls (4.33 μg/L), where its total concentration was comparable to or lower than most WWTP effluents in KZN during the second wave. As can be seen, Howick and Darvil had the highest concentrations of parabens, and this could be the reflection of the increased use of paraben-containing products during the second in KZN.
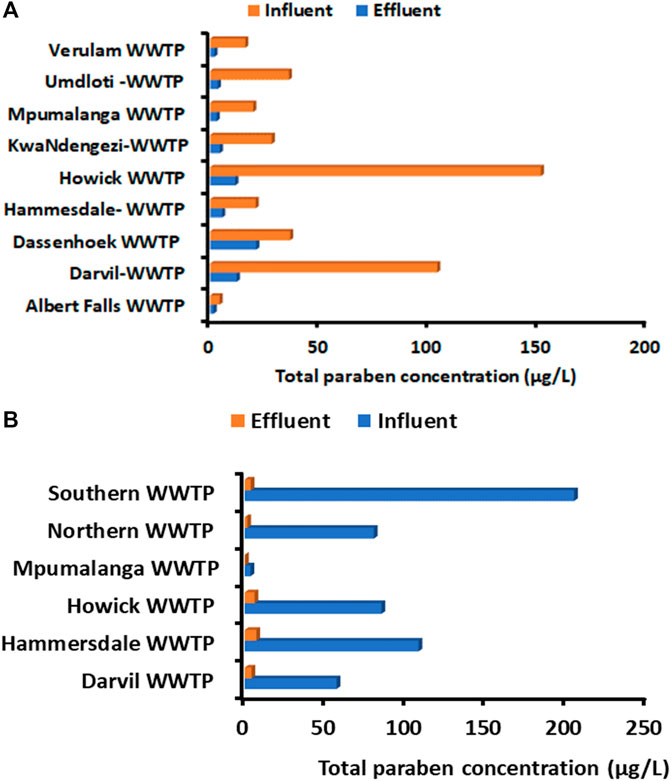
Figure 3. Total concentration of parabens in influent and effluent wastewater samples collected in selected KZN WWTPs during (A) second and (B) 4thwaves of COVID-19.
Whereas in the effluent wastewater, samples had the sum concentrations in the following order: Dassenhoek (21.2 μg/L), Darvil (12.2 μg/L), Howick (11.6 μg/L), Hammesdale (5.56 μg/L), KwaNdengezi (4.49 μg/L), Umdloti (3.52 μg/L), Mpumalanga (3.05 μg/L), Verulam (2.04 μg/L) and Albert Falls (1.63 μg/L) WWTPs (Figure 3A. The concentrations of parabens detected in the effluent wastewater samples were considerably lower in some of the WWTPs. For example, in Howick, the parabens concentration was 13 times lower than the total influent concentration. This confirms that WWTPs can reduce the amount of parabens concentrations in wastewater but cannot completely remove these substances. The same trend can be observed for Darvil (12.2 μg/L) when compared to Darvil influent. Dassenhoek (21.2 μg/L) had the highest concentrations of parabens, showing less reduction of concentration (Figure 3B). Several factors influence the presence of chemical pollutants in WWTP effluents, as well as their removal throughout wastewater treatment operations. Among others, their volatility, solubility, ability to adsorb on solids, as well as their capacity to undergo biodegradation in aqueous waste streams are critical variables that may affect their environmental fate and behaviour (Kanama et al., 2018).
During the fourth wave of the pandemic, the sum concentration (µg/L) of parabens ranking in influent wastewater from high to low was: Southern (industrial) (134 μg/L), Hammersdale (108 μg/L, Howick WWTP inlet (84.9 μg/L), Northern WWTP inlet (80.0 μg/L), Southern (domestic) (70.6 μg/L), Darvil (57.0 μg/L) and Mpumalanga (3.65 μg/L) WWTPs (Figure 3B). The sum concentration (µg/L) of parabens in KZN during the fourth wave was also measured in high concentrations. At the same time, the sum concentration (µg/L) of parabens trend in effluent wastewaters followed the trend: Hammersdale (7.26 μg/L), Howick (6.18 μg/L), Darvil (4.19 μg/L), Southern t (3.8 μg/L), Northern (1.6 μg/L) and Mpumalanga (0.26 μg/L) WWTPs (Figure 2B). Lower concentrations were detected in effluent samples. In general, the decrease in concentration levels from wastewater influent to wastewater effluent water is clearly evident.
3.2.2 Concentration of parabens in surface water
Surface water samples were collected in the rivers located near the WWTP, except in cases where the rivers were not accessible. Most target parabens were identified and quantified in the river water (Table 4). The average concentrations of the parabens in river samples ranged between ND and 16.4 μg/L. During the second wave, the compounds that were frequently detected were MePB and EtPB. During the fourth wave, BuPB was not detected in any river water samples, while EtPB was detected in Howick River upstream, Mpumalanga River upstream and Hammersdale River downstream. The results observed in Table 4 for individual parabens in the surface waters show that their detection pattern significantly differed from the WWTP influent and effluents except for EtPB during the second wave. These results reveal that the occurrences of parabens in the river systems in the study areas may be attributed to partially treated water.
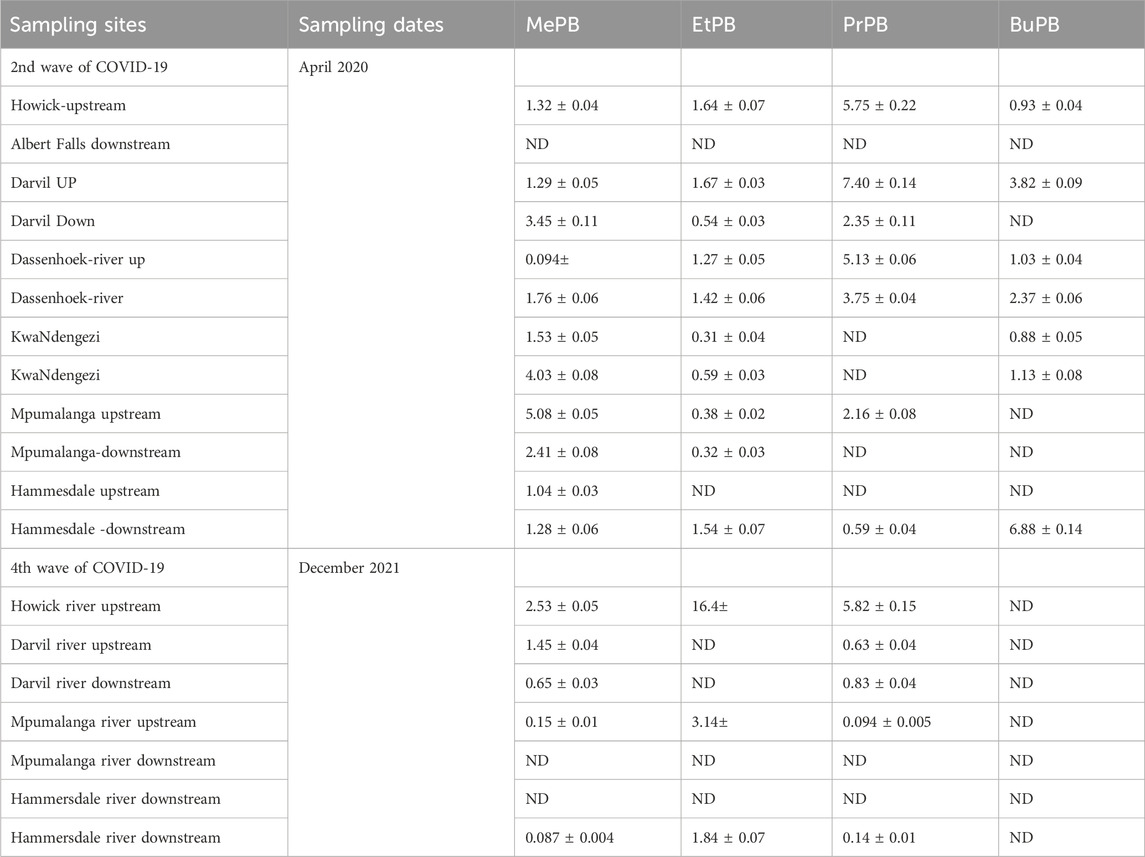
Table 4. Concentration of parabens during second and fourth waves of COVID-19 for river water samples collected in KwaZulu Natal.
The concentration levels of parabens slightly decreased in surface water. Still, they remained high in some of the surface water samples, which demonstrates that the treated wastewater discharge has a considerable impact on river water quality. Furthermore, the results for surface water samples clearly show that wastewater treatment plants do not effectively remove all of the personal care products found in wastewater influents, resulting in the discharge of several compounds into river water.
3.3 Occurrence of parabens in water bodies from Gauteng province
3.3.1 Levels of parabens in wastewater
During the third wave, parabens were detected in influent and effluent wastewater collected from Gauteng Province and their concentrations are presented in Figure 4 (Supplementary Table S6). The use of paraben-containing products in the selected study area varied depending on the sampling site, as different concentrations of parabens were detected in different WWTPs. The mean concentrations of parabens in influent wastewater samples ranged from 0 to 11.6 μg/L, 0–3.77 μg/L, 29.8–197 μg/L, 0–17.5 μg/L, 31.7–73.4 μg/L at Babelegi, Baviaanspoort, Rooiwal, Themba and Zeekoegat WWTPs, respectively (Figure 4A). It was worth noticing that Rooiwal East Inlet had high concentration levels for all four parabens. EtPB was detected in influent wastewater from Baviaanspoort, Rooiwal and Zeekoegat WWTPs.
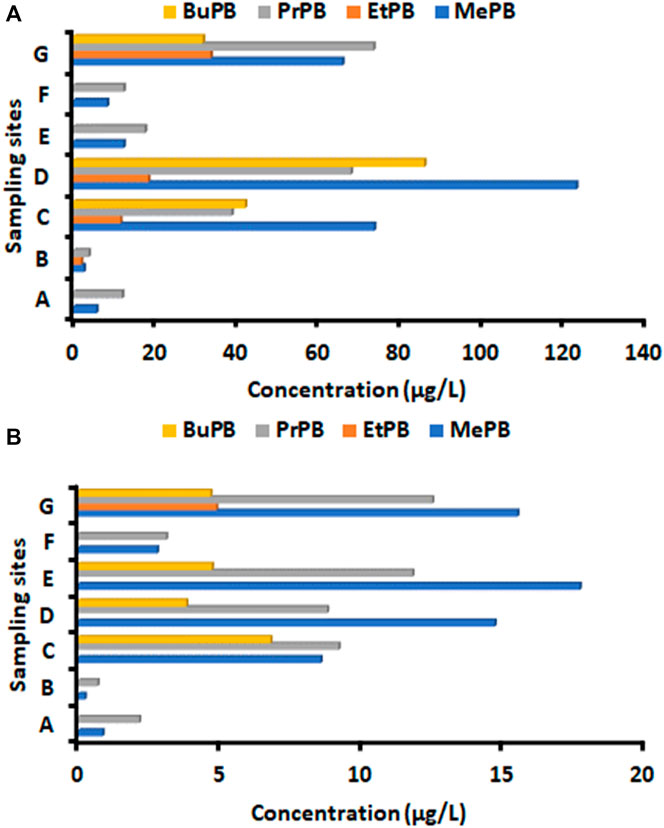
Figure 4. Concentrations (µg/L) of parabens in (A) influent and (B) effluent wastewater collected from selected Gauteng Province WWTPs during third wave of COVID-19. Sampling sites were (A) influent: A Babelegi WWTP; B Baviaanspoort WWTP; C Rooiwal East WWTP (Composite samples); D Rooiwal East WWTP; E Themba clarifier 2 WWTP; F Themba WWTP; G Zeekoegat WWTP. (B) effluent: A Babelegi WWTP; B Baviaanspoort WWTP; C Refilwe WWTP; D Rooiwal East WWTP (before chlorination); E Rooiwal East WWTP; B Themba WWTP; Zeekoegat WWTP.
MePB and PrPB were detected in all WWTPs effluent samples, ranging from 0.87 to 15.5 μg/L and 2.16–12.5 μg/L, respectively (Figure 4B). While, EtPB and BuPB were the least detected in WWTP effluent samples. Generally, the concentration levels of these parabens were significantly reduced in effluent samples, with EtPB and BuPB showing high removal compared to MePB and PrPB (Figure 4B).
The total concentration of parabens in various influent wastewater samples followed the trend: Rooiwal East (295 μg/L), Zeekoegat (205 μg/L), Rooiwal East (Composite samples) (166 μg/L), Themba clarifier 2 (29.8 μg/L), Themba (20.6 μg/L), Babelegi (17.6 μg/L) and Baviaanspoort (8.24 μg/L) WWTPs (Supplementary Table S6). While in the effluent wastewater the total paraben concentration trends was: Zeekoegat (37.6 μg/L), Rooiwal East (34.22), Rooiwal East (before chlorination) (27.3 μg/L), Refilwe (24.5 μg/L), Themba (5.9 μg/L), Babelegi (3.03 μg/L) and Baviaanspoort (0.93 μg/L) WWTPs. Paraben concentrations found in Gauteng Province WWTPs during the third wave were much lower than those found in KwaZulu Natal (second wave) except for the concentrations detected in influent samples from Zeekoegat and Rooiwal East WWTPs.
3.3.2 Levels of parabens in river water
The average concentrations of target parabens in the surface water samples from Gauteng Province are presented in Table 5. The investigated parabens showed different concentration levels in surface water samples in the range of ND (not detected)-3.14 μg/L, ND-1.03 μg/L, ND-2.33 μg/L and ND-1.31 μg/L for MePB, EtPB, PrPB and BuPB, respectively. The frequency of the detected parabens in different rivers followed the trend: MePB > PrPB > EtPB > BuPB. Hennops, Apies River (Hammanskraal) and Tolwane Rivers had the highest total paraben concentrations compared to other river systems. Generally, levels of parabens in the surface water were lower than the concentrations detected in the wastewater effluents. The presence of parabens in some river water systems implied that the WWTP effluents were the major contributors to the levels in the surface water bodies.
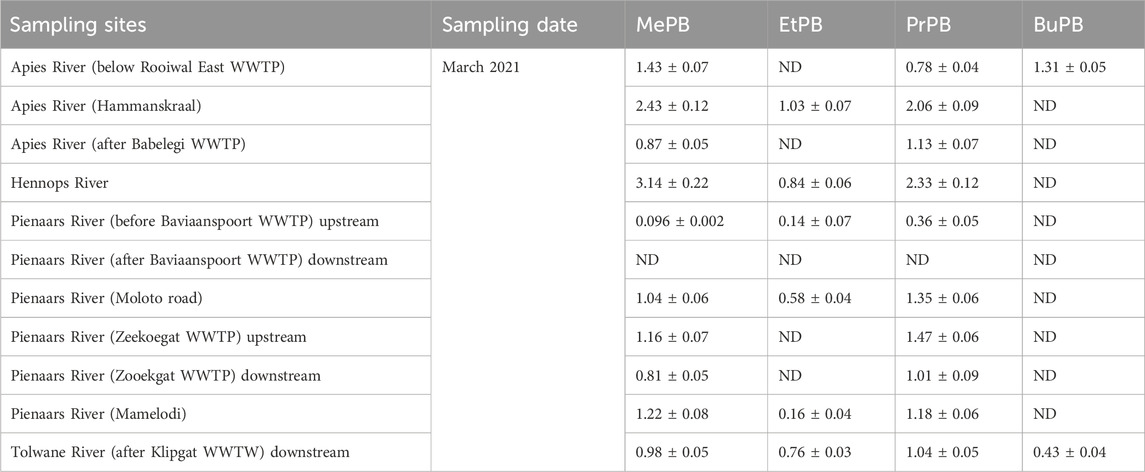
Table 5. Concentrations of MePB, EtPB, PrPB, BuPB in waste water treatment plants and rivers during third wave in Gauteng.
3.4 Comparison of concentration levels of parabens in WWTPs during COVID-19 seasonal waves
The concentration levels of four parabens were measured in KZN and GP provinces during the second, third and fourth waves of COVID-19 in South Africa. Many factors, such as the number of active cases and death rate in South Africa, characterised these waves. The findings revealed that the selected parabens were most frequently found in WWTP influents during the second wave and the fourth wave. However, the results also demonstrated a substantial variation in the total concentrations of these parabens between the second and fourth waves. The total sum of parabens concentration was higher during the fourth wave in KZN, with the exception of a few sample sites. This suggests that sanitisers might have been used in excess in KZN during the fourth wave. The high number of cases of COVID-19 can explain this in that period, which was caused by the most contagious omicron variant of COVID-19. MePB had a higher detection frequency than other parabens for both the second and fourth waves in KZN. Additionally, BuPB had low detection frequency for both waves.
In comparison to samples from KZN WWTPs, the paraben concentrations in Gauteng province were slightly higher. For instance, BuPB had the highest concentrations in Gateng, in the range of ND-85.8 μg/L. The third wave of COVID-19 had the highest cases of COVID-19 in South Africa. This might have increased the rate at which sanitisers and other paraben-containing products were consumed. On the other hand, EtPB had low-frequency detection in Gauteng compared to the KwaZulu Natal province.
3.5 Comparison of levels of parabens in different environmental water in South Africa
A comparison of the results in this study with those obtained previously for South African wastewater and river samples was conducted. Generally, the majority of wastewater and river concentrations in this study were considerably higher than the values in the literature, especially in influent and effluent samples. This indicates the extensive use of sanitisers and disinfectants containing parabens. For example, the concentration of MePB in influent wastewater reported by (Archer et al., 2017; Mashile et al., 2018) in 2017 and 2018 were 947 ng/L and 58.7 ng/L, while in this study, the highest concentration of MePB quantified was 84.7 ug/L. A comparable concentration of PrPB was reported in wastewater effluent in KZN by (Gumbi et al., 2022)in 2022. In addition, the occurrence of parabens in river systems in the current study reflects the disposal of partially treated/untreated sewage and wastewater from industries located near or on the edges of the rivers. Previous studies have agreed with observations in this study, where MePB and PrPB are the prevalent parabens detected in influents and effluents.
In contrast, BuP and EtP were less frequently detected at lower concentrations in studies done by (Mashile et al., 2018; Muckoya et al., 2020) in 2018 and 2020. This trend was observed during the third and fourth COVID-19 waves, contrary to the second wave, where EtPB and BuPB were frequently detected in influent and effluent wastewater samples. These results imply that the use of products containing parabens has increased during the pandemic outbreak.
3.6 Global concentrations of parabens in wastewater and surface water (river water)
Parabens are anticipated to occur at high levels in the aquatic environment due to their relatively high solubility (Marta-Sanchez et al., 2018). The global concentrations of parabens in surface and wastewater are presented in Table 6. Overall, studies reported in the duration of our research worldwide correspond with our findings. All four parabens share similar trends: the levels of MePB, PrPB and EtPB in water were higher, while BuPB was found in low concentrations. These high concentrations might be due to the increased use of personal care products (including sanitisers) during the COVID-19 pandemic. This implies that hand sanitisers are deposited in environmental care products along with high concentrations of their chemical constituents. Additionally, the lower frequency of BuPB detection in this study was similar to studies reported in Iran and China (Mao et al., 2020; Khezeli et al., 2023). This was also expected because BuPB is utilised less frequently than other parabens in personal care products.
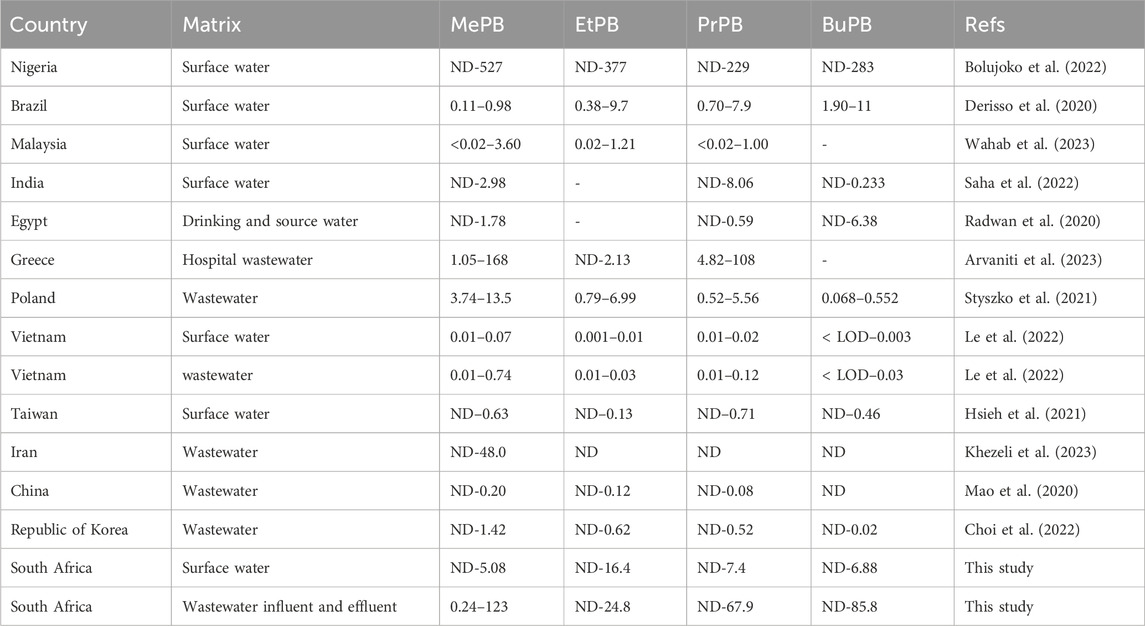
Table 6. Global concentration of paraben concentrations (μg/L) in wastewater and surface water samples.
High concentrations of parabens comprising MePB (ND-527 μg/L), EtPB (ND-377 μg/L), PrPB (ND-229 μg/L), and BuPB (ND-283 μg/L) were reported in Nigerian surface water (Bolujoko et al., 2022). These levels were 5–10 times higher than in this study. The high concentration levels of parabens in Nigeria can be attributed to the indiscriminate discharge of wastewater effluents containing parabens, misuse of parabens-containing products, and improper disposal of cosmetics. Additionally, MePB and EtPB were the most abundant in Nigerian surface water, and this trend was in accordance with the current study. Lower concentrations of parabens were reported in China MePB (ND-0.20 μg/L), EtPB (ND-0.12 μg/L) and PrPB (ND-0.08 μg/L) (Mao et al., 2020). It can be seen that BuPB was not detected in China; however, other parabens showed a similar trend to the concentrations observed in our study. Therefore, despite the fact that other countries had lower concentrations, the occurrence of parabens appears to follow the same trend. For instance, MePB and EtPB are always detected in high concentrations. On the other hand, BuPB is detected at lower concentrations in most countries. This can also be observed in Vietnam, where low concentrations of parabens were detected MePB (0.01–0.74 μg/L), EtPB (0.01–0.03 μg/L), PrPB (0.01–0.12 μg/L), BuPB (<LOD–0.03 μg/L) (Le et al., 2022), and the Republic of Korea MePB (ND-1.42 μg/L), EtPB (ND-0.62 μg/L), PrPB (ND-0.52 μg/L), BuPB (ND-0.02 μg/L) (Choi et al., 2022) This trend can be explained by the regular combination of MeP and EtPB in personal care products. Furthermore, the low concentration levels of parabens detected in wastewater from China (Mao et al., 2020), Vietnam (Le et al., 2022), and the Republic of Korea (Choi et al., 2022) might be an indication that personal care product compositions or paraben consumption practices from these countries differ from those reported in our research and other countries. Taiwan MePB (ND–0.63 μg/L), EtPB (ND–0.13 μg/L), PrPB (ND–0.71 μg/L) and BuPB (ND–0.46 μg/L) (Hsieh et al., 2021), also showed low concentrations compared to our study.
Similar or comparable concentration levels of MePB (0.11–0.98 μg/L), EtPB (0.38–9.7 μg/L), PrPB (0.70–7.9 μg/L) and BuPB(1.90–11 μg/L) were found in surface water from Brazil (Derisso et al., 2020). The variations in concentration levels of these parabens reveal that some countries can eliminate parabens more efficiently than others since their treatment plants are regulated, monitored and maintained routinely.
3.7 Ecological risk assessment of parabens in different river systems
The risk of parabens to aquatic organisms of various rivers in KwaZulu Natal and Gauteng Provinces was investigated using the risk quotients (RQs) (Supplementary Material). The RQ values (acute and chronic) of the parabens MePB (0.001-0.025) and EtPB (0.001-0.018) were below <0.1, suggesting that they pose low to the aquatic organisms in the river systems of the two provinces. Overall, MePB and EtPB are unlikely to threaten aquatic organisms in these river systems. Meanwhile, the acute and chronic RQs of PrPB (0.01-0.38) and BuPB (0.01-0.36) indicated that these parabens may pose a low to medium risk to aquatic organisms. Among the most likely to be impacted organisms were daphnia and fish.
It should be noted that single paraben compounds cause the RQ values discussed in this, but they are a mixture of compounds in the aquatic environment. Therefore, the actual risk presented by the mixtures might even be higher. This study showed that individuals with low paraben concentrations are unlikely to display acute toxic effects, but the chronic effects of these should not be neglected. This is because parabens bioaccumulate in aquatic life. Therefore, even short-term exposure may show molecular effects in test organisms.
3.8 Removal of parabens from selected Gauteng and KwaZulu Natal WWTPs
The results obtained showed that the four investigated parabens were detected in influent and effluent wastewater samples. The removal of the parabens at different WWTPs in Gauteng and KwaZulu Natal Provinces was analysed using the concentrations of parabens in influent and effluent wastewater samples. The removal efficiencies of the target parabens at different WWTPs of KZN Province ranged from −20.1%–100% (Table 7). Specifically, the removal efficiency of BuPB reached 100% at most WWTPs except at Darvil (76.2%), Dassenhoek (44.6%) and Hammesdale (87.5%) WWTPs. The removal efficiencies of MePB, EtPB and PrPb were high (>50%) in almost all WWTPs except Dassenhoek WWTP. As seen in Table 7, a high concentration (3.64 μg/) of EtPB was detected in the effluent wastewater from Dassenhoek WWTP, which then resulted in negative removal efficiency. The WWTPs treatment procedures and design can have an impact on the removal of pollutants. Most of the WWTPs in KZN employ the typical wastewater treatment process, including sedimentation, biological treatment, sludge treatment as well as tertially treatment processes. The efficiency of WWTPs on the removal of polluntants is mostly determined by the properties of the sewage and the activated sludge conditions. For example, higher inflows result in increased nutrient and organic load levels, which compromise the biological nutrient removal (BNR) process (Jwara et al., 2019). Therefore, the differences between the concentrations in influent and effluent wastewater samples could be attributed to the fact that the removal of pollutants in WWTP is strongly affected by chemical or hydraulic retention times. In addition, negative removal efficiency might be due to the conversion of the transformation product of parabens into the parent compounds by the chlorination process of microorganisms. In this study, it was observed that MePB, EtPB and PrPB were recalcitrant because they were frequently detected with a frequency greater than 80% in the effluent wastewater samples from selected KZN WWTPs.
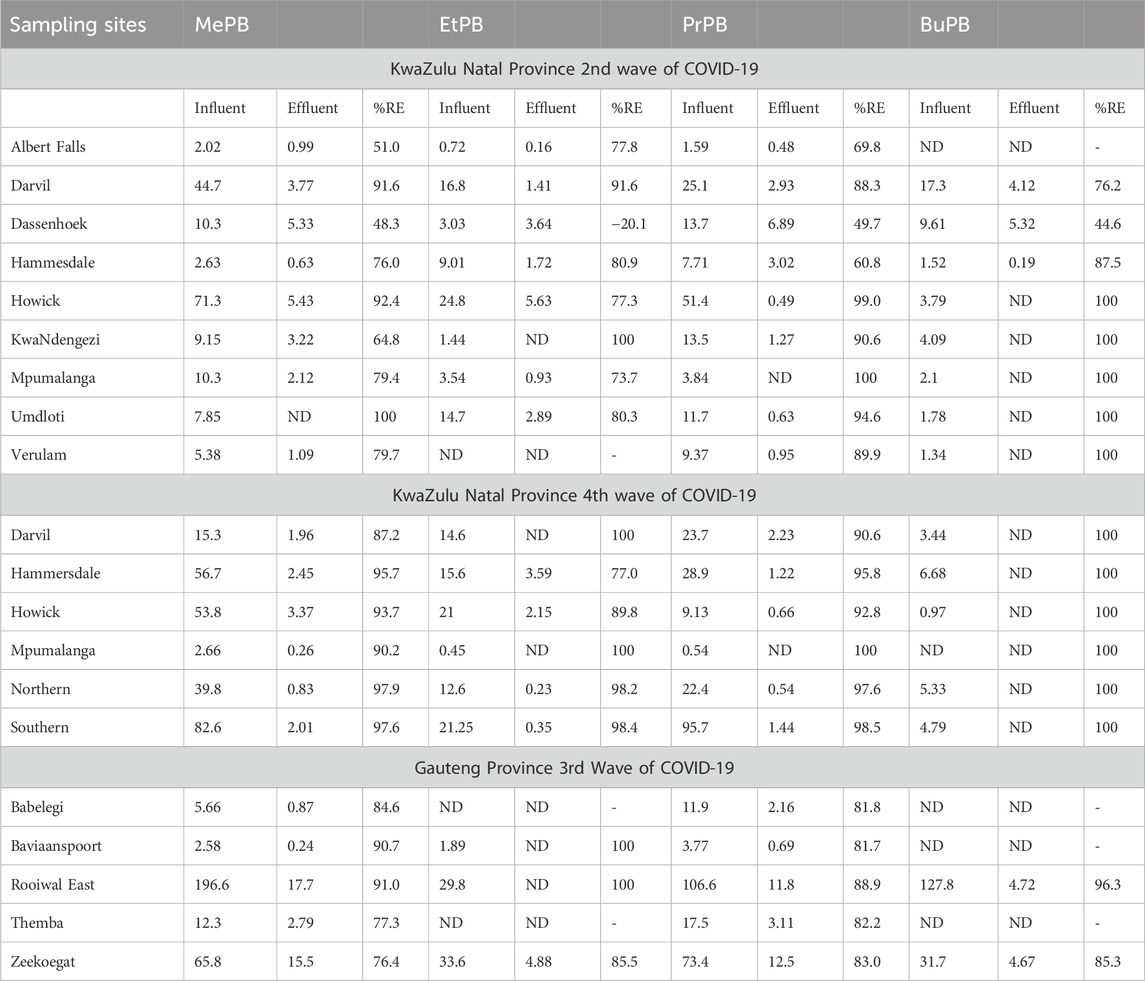
Table 7. The concentration and removal efficiency of parabens in selected Gauteng and KwaZulu Natal WWTPs.
Removal efficiencies of parabens in selected Gauteng WWTPs during the third wave of COVID-19 are illustrated in Table 7. The results demonstrated that high removal efficiencies, 77.3%–100%, were observed, suggesting that the amounts of parabens detected in influent wastewater samples were partially or fully removed in most cases. Table 7 shows that EtPB and BuPB were not frequently quantified in the influent and effluent wastewaters. Even though the removal efficiencies of these parabens reached 100% in some WWTPs, these pollutants were still present in high concentrations up to 15.5 μg/L in the effluent wastewater samples. These results proved that the conventional WWTPs are not designed to remove emerging contaminants completely. Furthermore, the incomplete removal of parabens by traditional WWTPs may be attributed to the chemical stability and nonbiodegradability of parabens.
4 Conclusion
This study presents the concentrations of parabens in wastewater and surface water samples collected from KwaZulu Natal and Gauteng Provinces, South Africa, during periods second, third and fourth waves of COVID-19. The analytical procedure was suitable for accurately quantifying parabens in wastewater and surface water samples. As expected, the concentrations of parabens were higher in influent wastewater than in effluent samples. These results proved that the WWTPs studied partially removed the four detectable parabens. Further, the concentrations of parabens in receiving surface water samples (upstream and downstream) of the WWTPs were investigated.
In most cases, the higher average concentrations were quantifiable downstream than upstream. The increase in paraben concentrations detected in surface water is evidence of the wastewater effluent impact in receiving rivers. In addition, the current work highlights the importance of river water monitoring. The ecotoxicological risk assessment of parabens on aquatic organisms indicated low-to-medium ecological risks in receiving surface water sampling areas.
Data availability statement
The original contributions presented in the study are included in the article/Supplementary Material, further inquiries can be directed to the corresponding author.
Author contributions
NM: Formal Analysis, Investigation, Software, Visualization, Conceptualization, Data curation, Methodology, Writing–original draft. AM: Conceptualization, Data curation, Formal Analysis, Investigation, Methodology, Supervision, Validation, Visualization, Writing–review and editing. NEM: Formal Analysis, Investigation, Methodology, Resources, Writing–review and editing. PN: Formal Analysis, Investigation, Software, Visualization, Funding acquisition, Project administration, Resources, Supervision, Validation, Writing–review and editing.
Funding
The author(s) declare that financial support was received for the research, authorship, and/or publication of this article. This study was financially supported by Department of Science and Innovation-National Research Foundation South African Research Chair Initiative (DSI-NRF SARChI) funding instrument, grant number 91230 and Water Research Commission (South Africa), grant number C2020-2021-00387.
Acknowledgments
The authors wish to acknowledge the University of Johannesburg, Faculty of Science, and Department of Chemical Sciences for laboratory space. The authors also want to thank N Musee for his immense contribution to the success of this study.
Conflict of interest
The authors declare that the research was conducted in the absence of any commercial or financial relationships that could be construed as a potential conflict of interest.
Publisher’s note
All claims expressed in this article are solely those of the authors and do not necessarily represent those of their affiliated organizations, or those of the publisher, the editors and the reviewers. Any product that may be evaluated in this article, or claim that may be made by its manufacturer, is not guaranteed or endorsed by the publisher.
Supplementary material
The Supplementary Material for this article can be found online at: https://www.frontiersin.org/articles/10.3389/fenvs.2024.1418375/full#supplementary-material
References
Adhikari, S., Kumar, R., Driver, E. M., Perleberg, T. D., Yanez, A., Johnston, B., et al. (2022). Mass trends of parabens, triclocarban and triclosan in Arizona wastewater collected after the 2017 FDA ban on antimicrobials and during the COVID-19 pandemic. Water Res. 222, 118894. doi:10.1016/j.watres.2022.118894
Ajiboye, T. O., Oyewo, O. A., and Onwudiwe, D. C. (2021). Photocatalytic removal of parabens and halogenated products in wastewater: a review. Environ. Chem. Lett. 19, 3789–3819. doi:10.1007/s10311-021-01263-2
Almeida, M. B., Madeira, T. B., Watanabe, L. S., Meletti, P. C., and Nixdorf, S. L. (2019). Pesticide determination in water samples from a rural area by multi-target method applying liquid chromatography-tandem mass spectrometry. J. Braz Chem. Soc. 30 (8), 1657–1666. doi:10.21577/0103-5053.20190066
Al-Tawfiq, J. A., Abdrabalnabi, R., Taher, A., Mathew, S., and Rahman, K. A. (2019). Infection control influence of Middle East respiratory syndrome coronavirus: a hospital-based analysis. Am. J. Infect. Control 47 (4), 431–434. doi:10.1016/j.ajic.2018.09.015
Archer, E., Petrie, B., Kasprzyk-Hordern, B., and Wolfaardt, G. M. (2017). The fate of pharmaceuticals and personal care products (PPCPs), endocrine disrupting contaminants (EDCs), metabolites and illicit drugs in a WWTW and environmental waters. Chemosphere 174, 437–446. doi:10.1016/j.chemosphere.2017.01.101
Arvaniti, O. S., Gkotsis, G., Nika, M. C., Gyparakis, S., Manios, T., Thomaidis, N. S., et al. (2023). Study on the occurrence of artificial sweeteners, parabens, and other emerging contaminants in hospital wastewater using LC-QToF-MS target screening approach. Water (Basel) 15 (5), 936. doi:10.3390/w15050936
Atolani, O., Baker, M. T., Adeyemi, O. S., Olanrewaju, I. R., Hamid, A. A., Ameen, O. M., et al. (2020). COVID-19: critical discussion on the applications and implications of chemicals in sanitizers and disinfectants. EXCLI J. 19, 785–799. doi:10.17179/excli2020-1386
Bolujoko, N. B., Ogunlaja, O. O., Alfred, M. O., Okewole, D. M., Ogunlaja, A., Olukanni, O. D., et al. (2022). Occurrence and human exposure assessment of parabens in water sources in Osun State, Nigeria. Sci. Total Environ. 814, 152448. doi:10.1016/j.scitotenv.2021.152448
Brandtner, P., Darbanian, F., Falatouri, T., and Udokwu, C. (2021). Impact of COVID-19 on the customer end of retail supply chains: a big data analysis of consumer satisfaction. Sustainability 13 (3), 1464. doi:10.3390/su13031464
Chirani, M. R., Kowsari, E., Teymourian, T., and Ramakrishna, S. (2021). Environmental impact of increased soap consumption during COVID-19 pandemic: biodegradable soap production and sustainable packaging. Sci. Total Environ. 796, 149013. doi:10.1016/j.scitotenv.2021.149013
Choi, S., Yoom, H., Son, H., Seo, C., Kim, K., Lee, Y., et al. (2022). Removal efficiency of organic micropollutants in successive wastewater treatment steps in a full-scale wastewater treatment plant: bench-scale application of tertiary treatment processes to improve removal of organic micropollutants persisting after secondary treatment. Chemosphere 288, 132629. doi:10.1016/j.chemosphere.2021.132629
Derisso, C. R., Pompei, C. M. E., Spadoto, M., da Silva Pinto, T., and Vieira, E. M. (2020). Occurrence of parabens in surface water, wastewater treatment plant in southeast of Brazil and assessment of their environmental risk. Water Air Soil Pollut. 231 (9), 468. doi:10.1007/s11270-020-04835-0
Desai, R., Onwubu, S., Lutge, E., Buthelezi, N. P., Moodley, N., Haffejee, F., et al. (2024). Provision of HIV testing services and its impact on the HIV positivity rate in the public health sector in KwaZulu-Natal: a ten-year review. Sahara J. 21 (1), 2318797. doi:10.1080/17290376.2024.2318797
Diaz-Sosa, V. R., Tapia-Salazar, M., Wanner, J., and Cardenas-Chavez, D. L. (2020). Monitoring and ecotoxicity assessment of emerging contaminants in wastewater discharge in the City of Prague (Czech Republic). Water (Basel) 12 (4), 1079. doi:10.3390/w12041079
Galinaro, C. A., Spadoto, M., de Aquino, F. W. B., de Souza Pelinson, N., and Vieira, E. M. (2022). Environmental risk assessment of parabens in surface water from a Brazilian river: the case of Mogi Guaçu Basin, São Paulo State, under precipitation anomalies. Environ. Sci. Pollut. Res. 29, 8816–8830. doi:10.1007/s11356-021-16315-x
Grover, A., Mohiuddin, I., Malik, A. K., Aulakh, J. S., Kukkar, D., and Kim, K. H. (2021). Chitosan-Ni/Fe layered double hydroxide composites as an efficient solid phase extraction sorbent for HPLC-PDA monitoring of parabens in personal care products. Chemosphere 264, 128429. doi:10.1016/j.chemosphere.2020.128429
Gumbi, B. P., Moodley, B., Birungi, G., and Ndungu, P. G. (2022). Risk assessment of personal care products, pharmaceuticals, and stimulants in Mgeni and Msunduzi Rivers, KwaZulu-Natal, South Africa. Front. Water 4, 867201. doi:10.3389/frwa.2022.867201
Haman, C., Dauchy, X., Rosin, C., and Munoz, J. F. (2015). Occurrence, fate and behavior of parabens in aquatic environments: a review. Water Res. 68, 1–11. doi:10.1016/j.watres.2014.09.030
Hsieh, C. Z., Chung, W. H., and Ding, W. H. (2021). Experimental design approaches to optimize ultrasound-assisted simultaneous-silylation dispersive liquid–liquid microextraction for the rapid determination of parabens in water samples. RSC Adv. 11 (38), 23607–23615. doi:10.1039/d1ra04195a
Jing, J. L. J., Pei Yi, T., Bose, R. J. C., McCarthy, J. R., Tharmalingam, N., and Madheswaran, T. (2020). Hand sanitizers: a review on formulation aspects, adverse effects, and regulations. Int. J. Environ. Res. Public Health 17 (9), 3326. doi:10.3390/ijerph17093326
Jwara, T. Y. S., Musonge, P., Bakare, B. F., and Mnguni, M. (2019). Biological nutrient removal efficiencies for hydraulically overloaded wastewater works. WIT Trans. Ecol. Environ. 239, 223–231. doi:10.2495/WS190201
Kanama, K. M., Daso, A. P., Mpenyana-Monyatsi, L., and Coetzee, M. A. A. (2018). Assessment of pharmaceuticals, personal care products, and hormones in wastewater treatment plants receiving inflows from health facilities in North West Province, South Africa. J. Toxicol. 2018, 1–15. doi:10.1155/2018/3751930
Khezeli, T., Daneshfar, A., and Kardani, F. (2023). In-situ functionalization of MnO2 nanoparticles by natural tea polyphenols: a greener sorbent for dispersive solid-phase extraction of parabens from wastewater and cosmetics. Microchem. J. 190, 108751. doi:10.1016/j.microc.2023.108751
Le, T. M., Pham, P. T., Nguyen, T. Q., Nguyen, T. Q., Bui, M. Q., Nguyen, H. Q., et al. (2022). A survey of parabens in aquatic environments in Hanoi, Vietnam and its implications for human exposure and ecological risk. Environ. Sci. Pollut. Res. 29 (31), 46767–46777. doi:10.1007/s11356-022-19254-3
Li, C., Zhao, Y., Liu, S., Yang, D., Ma, H., Zhu, Z., et al. (2021). Exposure of Chinese adult females to parabens from personal care products: estimation of intake via dermal contact and health risks. Environ. Pollut. 272, 116043. doi:10.1016/j.envpol.2020.116043
Li, W., Shi, Y., Gao, L., Liu, J., and Cai, Y. (2015). Occurrence, fate and risk assessment of parabens and their chlorinated derivatives in an advanced wastewater treatment plant. J. Hazard Mater. 300, 29–38. doi:10.1016/j.jhazmat.2015.06.060
Lu, S., Ren, L., Liu, Y., Ma, H., Liu, S., Zhu, Z., et al. (2019). Urinary parabens in children from South China: implications for human exposure and health risks. Environ. Pollut. 254, 113007. doi:10.1016/j.envpol.2019.113007
Ma, W. L., Zhao, X., Lin, Z. Y., Mohammed, M. O. A., Zhang, Z. F., Liu, L. Y., et al. (2016). A survey of parabens in commercial pharmaceuticals from China and its implications for human exposure. Environ. Int. 95, 30–35. doi:10.1016/j.envint.2016.07.013
Mao, H., Li, H., Li, Y., Li, L., Yin, L., and Yang, Z. (2020). Four typical personal care products in a municipal wastewater treatment plant in China: occurrence, removal efficiency, mass loading and emission. Ecotoxicol. Environ. Saf. 188, 109818. doi:10.1016/j.ecoenv.2019.109818
Marta-Sanchez, A. V., Caldas, S. S., Schneider, A., Cardoso, SMVS, and Primel, E. G. (2018). Trace analysis of parabens preservatives in drinking water treatment sludge, treated, and mineral water samples. Environ. Sci. Pollut. Res. 25, 14460–14470. doi:10.1007/s11356-018-1583-4
Mashile, G. P., Mpupa, A., and Nomngongo, P. N. (2018). In-syringe micro solid-phase extraction method for the separation and preconcentration of parabens in environmental water samples. Molecules 23 (6), 1450. doi:10.3390/molecules23061450
Muckoya, V. A., Nomngongo, P. N., and Ngila, J. C. (2020). Factorial design optimisation of solid phase extraction for preconcentration of parabens in wastewater using ultra-high performance liquid chromatography triple quadrupole mass spectrometry. Curr. Anal. Chem. 16 (4), 436–446. doi:10.2174/1573411014666180627150854
Musee, N., Ngwenya, P., Motaung, L. K., Moshuhla, K., and Nomngongo, P. (2023). Occurrence, effects, and ecological risks of chemicals in sanitizers and disinfectants: a review. Environ. Chem. Ecotoxicol. 5, 62–78. doi:10.1016/j.enceco.2023.01.003
Mutevedzi, P. C., Kawonga, M., Kwatra, G., Moultrie, A., Baillie, V., Mabena, N., et al. (2022). Estimated SARS-CoV-2 infection rate and fatality risk in Gauteng Province, South Africa: a population-based seroepidemiological survey. Int. J. Epidemiol. 51 (2), 404–417. doi:10.1093/ije/dyab217
Nagar, Y., Thakur, R. S., Parveen, T., Patel, D. K., Ram, K. R., and Satish, A. (2020). Toxicity assessment of parabens in Caenorhabditis elegans. Chemosphere 246, 125730. doi:10.1016/j.chemosphere.2019.125730
Radwan, E. K., Ibrahim, M. B. M., Adel, A., and Farouk, M. (2020). The occurrence and risk assessment of phenolic endocrine-disrupting chemicals in Egypt’s drinking and source water. Environ. Sci. Pollut. Res. 27 (2), 1776–1788. doi:10.1007/s11356-019-06887-0
Ramírez, N., Borrull, F., and Marcé, R. M. (2012). Simultaneous determination of parabens and synthetic musks in water by stir-bar sorptive extraction and thermal desorption-gas chromatography-mass spectrometry. J. Sep. Sci. 35 (4), 580–588. doi:10.1002/jssc.201100887
Saha, S., Narayanan, N., Singh, N., and Gupta, S. (2022). Occurrence of endocrine disrupting chemicals (EDCs) in river water, ground water and agricultural soils of India. Int. J. Environ. Sci. Technol. 19 (11), 11459–11474. doi:10.1007/s13762-021-03858-2
Saidulu, D., Gupta, B., Gupta, A. K., and Ghosal, P. S. (2021). A review on occurrences, eco-toxic effects, and remediation of emerging contaminants from wastewater: special emphasis on biological treatment based hybrid systems. J. Environ. Chem. Eng. 9 (4), 105282. doi:10.1016/j.jece.2021.105282
Styszko, K., Proctor, K., Castrignanò, E., and Kasprzyk-Hordern, B. (2021). Occurrence of pharmaceutical residues, personal care products, lifestyle chemicals, illicit drugs and metabolites in wastewater and receiving surface waters of Krakow agglomeration in South Poland. Sci. Total Environ. 768, 144360. doi:10.1016/j.scitotenv.2020.144360
Supowit, S. D., Sadaria, A. M., Reyes, E. J., and Halden, R. U. (2016). Mass balance of fipronil and total toxicity of fipronil-related compounds in process streams during conventional wastewater and wetland treatment. Environ. Sci. Tech. 50 (3), 1519–1526.
Valdez-Carrillo, M., Abrell, L., Ramírez-Hernández, J., Reyes-López, J. A., and Carreón-Diazconti, C. (2020). Pharmaceuticals as emerging contaminants in the aquatic environment of Latin America: a review. Environ. Sci. Pollut. Res. 27, 44863–44891. doi:10.1007/s11356-020-10842-9
Vazquez, L., Celeiro, M., Castiñeira-Landeira, A., Dagnac, T., and Llompart, M. (2022). Development of a solid phase microextraction gas chromatography tandem mass spectrometry methodology for the analysis of sixty personal care products in hydroalcoholic gels˗ hand sanitizers˗ in the context of COVID-19 pandemic. Anal. Chim. Acta 1203, 339650. doi:10.1016/j.aca.2022.339650
Wahab, R. A., Omar, T. F. T., and Nurulnadia, M. Y. (2023). Occurrence, distribution, and risk assessment of parabens in the surface water of Terengganu River, Malaysia. Mar. Pollut. Bull. 192, 115036. doi:10.1016/j.marpolbul.2023.115036
Wei, F., Mortimer, M., Cheng, H., Sang, N., and Guo, L. H. (2021). Parabens as chemicals of emerging concern in the environment and humans: a review. Sci. Total Environ. 778, 146150. doi:10.1016/j.scitotenv.2021.146150
Keywords: parabens, solid phase extraction, ecotoxicological risk assessment, wastewater treatment plants, preservatives, surface water
Citation: Mpayipheli N, Mpupa A, Madala NE and Nomngongo PN (2024) Paraben residues in wastewater and surface water: a case study of KwaZulu Natal and Gauteng provinces (South Africa) during the COVID-19 pandemic. Front. Environ. Sci. 12:1418375. doi: 10.3389/fenvs.2024.1418375
Received: 16 April 2024; Accepted: 22 July 2024;
Published: 06 August 2024.
Edited by:
Qiuda Zheng, The University of Queensland, AustraliaReviewed by:
Yujie Ben, Southern University of Science and Technology, ChinaLan Anh Phan Thi, Vietnam National University, Hanoi, Vietnam
Copyright © 2024 Mpayipheli, Mpupa, Madala and Nomngongo. This is an open-access article distributed under the terms of the Creative Commons Attribution License (CC BY). The use, distribution or reproduction in other forums is permitted, provided the original author(s) and the copyright owner(s) are credited and that the original publication in this journal is cited, in accordance with accepted academic practice. No use, distribution or reproduction is permitted which does not comply with these terms.
*Correspondence: Philiswa Nosizo Nomngongo, cG5ub21uZ29uZ29AdWouYWMuemE=