 Xingfu Wang
 Xianfei Huang
 Xun Zhu1
95% of researchers rate our articles as excellent or good
Learn more about the work of our research integrity team to safeguard the quality of each article we publish.
Find out more
ORIGINAL RESEARCH article
Front. Environ. Sci. , 01 August 2024
Sec. Soil Processes
Volume 12 - 2024 | https://doi.org/10.3389/fenvs.2024.1417949
This article is part of the Research Topic Climate Change and Soil Microbial Control of Carbon Sequestration View all 12 articles
Karst landforms are widely distributed in southern China. The terrain and soil properties in karst basins are complex, which results in high spatial heterogeneity of the ecological environment and soil organic matter (SOM) in karst watersheds. To investigate the spatial distribution characteristics of SOM in different land uses in the karst plateau basin, a total of 3,816 soil samples were taken from 568 soil profiles. The soil animals and different soil properties were recorded, and the concentration of SOM was tested using the potassium dichromate method in the laboratory. Then, the changes in the SOM content associated with soil animals and the soil properties associated with the different land use types were analyzed. The results showed a large discrepancy in SOM in the karst plateau basin. The average values of SOM in different soil layers were between 9.23 g kg−1 and 59.39 g kg−1. The SOM decreased in the following order: forestland > grassland > barren land > cultivated land > garden land. The SOM in soil in which soil animals are present is generally greater than that in the absence of soil animals, and the SOM partially increases with soil species diversity. Agrotis segetum is the main soil animal species that positively affects the distribution of organic matter in the surface soil layer. The SOM in soil with the phylum Annelida is much greater than that in soils with other animals, and earthworms are the main contributor. The structure of soil animal species is complex, and the change trend of SOM is stable. The major positive factors affecting soil animal diversity are soil thickness, soil humidity and soil structure, and rock outcrops are the main negative factor. In summary, good land use can increase animal diversity and abundance in soil, which promotes soil organic matter accumulation. Moreover, microtopography is an important factor that influences soil organic matter accumulation in karst basins and further affects the restructuring of the spatial distribution of soil organic matter.
Soil organic matter (SOM) refers to all the carbonaceous organic matter existing in soil, including the residual organic matter of plants and animals, microorganisms, and humus (Jurgensen et al., 1997; Kaiser et al., 2002; Di et al., 2015; Zhang J. et al., 2023). It is an important resource used in many processes, including carbon cycling in terrestrial ecosystems (Mcdonagh et al., 2001; Six et al., 2007). Because the main component of SOM is carbon, SOM is crucial for the global carbon cycle (Caspersen et al., 2000; Schime et al., 2000; Zhang X. et al.f, 2023). There are some interactions between the processes of carbon cycling and climate change (Ding et al., 2002; West and Post, 2002; Li et al., 2024). According to the transition relationship between SOM and soil organic carbon, the global SOM reserve in the 0–100 cm soil layer is approximately 2,517 Pg (Weissert et al., 2016; Wang et al., 2022). This indicates that the global SOM reserve is a large carbon reservoir. Small changes in SOM may lead to great changes in atmospheric CO2, further resulting in global climate change (Lin and Zhang, 2012; Bieluczyk et al., 2023; Wang et al., 2023). SOM is an important part of the terrestrial carbon pool that affects the carbon balance (Pouyat et al., 2002; Freitas et al., 2022). In addition, SOM is an essential factor in agricultural productivity and soil fertility. SOM can improve the physical structure and chemical composition of soil. It is not only a main index of soil quality but also the basis of sustainable development (Wang et al., 2005; Smith et al., 2013). It is beneficial to soil aggregate formation and can promote plant nutrient absorption from soil (Di et al., 2015; Poffenbarger et al., 2020; Street et al., 2020; Li et al., 2024). In summary, the reserves and spatial heterogeneity of SOM directly impact the carbon cycle in terrestrial ecosystems, plant growth, soil fertility maintenance, and agricultural output and quality (Niu et al., 2015; Wang et al., 2022). Therefore, research on SOM has become a popular field worldwide (Cheshire, 1987; Li et al., 2019; Zhang et al., 2019).
Although SOM reserves are essential in terrestrial ecosystems, they are not constant in soil but constitute a long-term dynamic balance system of input and output (Yan et al., 2011; Aaltonen et al., 2019; Zhou et al., 2024). There is high spatial distribution heterogeneity of SOM because the exchange processes between SOM and other materials in different ecosystems are complex, and SOM is influenced by multivariate factors (Huang et al., 2018). The influence of multifactor coupling on SOM is complex, which leads to the key factors being different in various areas (Huang et al., 2018; Wang et al., 2022). Therefore, many scholars have studied SOM from different perspectives and in different ways. For example, Li et al. researched the relationships between SOM and soil pH and soil bulk density (SBD), and the results showed that there was a negative correlation between these indices; the higher the soil pH and soil bulk density are, the lower the SOM concentration is (Li D. C. et al., 2020). In another instance, Zhang et al. researched the spatiotemporal variation mechanism of SOM in farmland by different abandoned tillage practices and noted that the decreasing order of SOM under different abandoned tillage practices is season abandonment > adjustment abandonment > annual ring abandonment > long-term abandonment > long-term cultivation (Zhang T. Y. et al., 2020). The conversion of natural pasture to dryland farming results in a notable decrease in SOM. This decrease in SOM is quantified as a reduction of 24.7% at the first site and 44.2% at the second site within the top 30 cm of soil (Haghighi et al., 2010). These results indicate that land use patterns and soil properties are important factors affecting SOM and that fertilizer and green manure inputs to soil and straw return to farmland can promote SOM accumulation (Zhang W. J. et al., 2012; Zhang et al., 2015; Qaswar et al., 2019). In addition, Shen et al. noted a positive correlation between SOM and the species and number of soil animals (Shen et al., 2009). Zhang et al. suggested that land use change greatly impacts soil animal diversity. He noted that forestland supports a more diverse and complex soil animal community than farmland or grassland, and the composition and number of these soil animals vary across different sampling plots (Zhang J. E. et al., 2011). SOM is highly heterogeneous in soil, and the SOM process and its impacts are complex.
Karst basins are a typical landform type in karst mountainous areas, and farmland, forestland, barren land, etc., are widely distributed in karst basins. The special ecosystem of karst landforms is different from that of nonkarst regions (Zhang et al., 2016). Because soil erosion in karst areas is severe, karst areas exhibit low stability, poor self-regulation, and low environmental capacity (Yang et al., 2010; Zhang X. B. et al., 2011). Therefore, the microenvironments and land use types of karst landforms are more complex than those of other landforms (Wang et al., 2022). The soil quality of different land uses in karst basins varies greatly, which can directly affect agricultural yield and carbon sequestration. These factors result in high spatial distribution heterogeneity of SOM in karst areas, and SOM is impacted by major factors in different karst regions (Huang et al., 2018; Zhang et al., 2019). SOM is an important index of soil quality, fertility, and carbon balance (Freitas et al., 2022; Wang et al., 2023). We ask the following question: What is the mechanism of the relationships among soil animals, land use, and SOM in karst basins? This main issue is not clearly understood for karst basins in general or, more specifically, for the South China Karst.
In summary, SOM is critical for global carbon circulation; changes in SOM can influence the carbon balance, which partially responds to soil structure and fertility. However, no researchers have reported on the response of SOM to soil animals in karst basin areas with different land uses. Therefore, the distribution characteristics of soil animals in karst plateau basin soils were analyzed, and the coupling mechanisms among land use, soil animals, and SOM were further investigated. The aim of this study was to provide a reference for carbon sequestration management and land use, thereby promoting soil quality and production in karst areas.
The research region was set in Puding County, which is a typical plateau basin in the central region of the South China Karst with geographic coordinates of 105°27′49″–105°58′51″E and 26°26′36″–26°31′42″N. It is in the belt of the translation zone between the Sichuan Basin and the Yun-Gui Plateau and extends to the Hunan Hills. The elevation is approximately 800–1900 m. The topography of the southern and northern regions is greater than that of the central region, and its karst landform characteristics are abundant, widely distributed, distinctly discrepant, and seriously rocky desertification. Severe soil erosion has occurred due to the karst landform development and the number of underground rivers. The region is a subtropical region with a humid monsoon climate, and this region is affected by the quasistationary Guiyang–Kunming front. The average annual temperature is 15.1°C, the average annual sunshine duration is 1,164.9 h, and the average annual rainfall reaches 1,378.2 mm. The research area is one of three major core rainfall regions in Guizhou Province, and it belongs to the Yangzi River ecosystem. The survey and statistics revealed three types of soils, Leptosols, Ferralsols, and Anthrosols, in the area of interest (IUSS Working Group WRB, 2014). The vegetation mostly includes walnut, Quercus glauca, pine trees, strawberry trees, plum trees, and Chinese pear. The land use mostly includes paddy fields, dry land, forestland, sloped farmland, and grassland. The major crops and grasses are sweet potato, paddy rice, corn, pepper, soybean, and foxtail grass. The soil animals mostly include ants (Formicidae, Arthropoda, and Hymenoptera), earthworms (Lumbricus and Annelida), centipedes (Chilopoda and Arthropoda), crickets (Gryllidae and Arthropoda), and spiders (Araneae and Arthropoda).
To research the relationship between SOM and soil animals in different land uses, samples containing traces of soil animal activity were collected from different locations. The number of soil animal species was counted in an approximate square with a length of approximately 1.7 m and a depth of 0–20 cm, and the sampling sites were in the center of each sampling grid. The sampling site was sampled at a depth of 100 cm according to the design, and the soil profile of each sampling site was divided into 12 layers (0–5 cm, 5–10 cm, 10–15 cm, 15–20 cm, 20–30 cm, 30–40 cm, 40–50 cm, 50–60 cm, 60–70 cm, 70–80 cm, 80–90 cm, and 90–100 cm). Other information, such as soil thickness, rock outcrop, soil animal, SBD, soil moisture, soil structure, soil genus, soil color, slope position, slope gradient, and vegetation, was also recorded.
In fact, the soil thicknesses of many sampling sites were less than 100 cm. Therefore, the number of collected soil samples was lower than the theoretical sample number. Finally, a total of 3,816 soil samples were taken from 568 soil profiles. The soil samples were taken to the laboratory, air-dried at room temperature, ground, and sieved to remove the gravel fraction (>2 mm). The resulting materials were ground into powders and saved for SOM analysis. The SOM concentration in the soil samples was determined using the potassium dichromate method with K2Cr2O7 oxidation at 170°C–180°C, followed by titration with Fe3O4 (Wang et al., 2010; Zhang et al., 2019). The soil thickness at each site was measured by inserting an iron rod with a length of either 60 cm or 120 cm. The SBD was determined via the cutting ring method (Huang et al., 2018; Zhang et al., 2019; Wang et al., 2022), and the soil moisture was tested via the oven method (Sharaya and Van, 2022). The rock outcrop rate at each sampling site was assessed via the line-transect method, and the line length was set to 10 m (Zhang et al., 2019; Wang et al., 2022).
The SBD (g∙cm−3) was tested in the field by the cylindrical core method. The formula is as follows (Huang et al., 2018; Wang et al., 2022):
where M1 is the weight of the cutting ring (g), M2 is the weight of the cutting ring with dry soil (g), and V is the volume of the cutting ring (cm3).
The species diversity index of the local environment was determined via the following formula (Zeng et al., 2018):
where D is the species diversity index, S is the species number of soil animals, and A is the area of the sampling site (m2).
Factor analysis was carried out via principal component analysis (PCA) and redundancy analysis (RDA). PCA analyzes the similarity and diversity among factors and distinguishes the significant impact factors from all samples. RDA is an important method of constrained ordination that can sort species and environmental factor datasets and sort the environmental factors under constrained species (Wang et al., 2020).
The data were managed and organized using Microsoft Excel 2003 (Microsoft, Redmond, WA, USA). Statistical analysis was performed with IBM SPSS 18.0 and Origin 8.6 software.
The soil properties are more complex in karst mountainous areas, and there is high spatial heterogeneity in the major soil properties, such as soil thickness, SBD, rock outcrop, and soil moisture, which are important factors that affect SOM in karst areas (Zhang W. et al., 2012; Zhang et al., 2019). According to the information in Table 1, the average values of soil thickness, SBD, rock outcrop, and moisture content were 61.70 cm, 1.17 g cm−3, 16%, and 23%, respectively, and their coefficients of variation were 0.53, 0.18, 1.38, and 0.57, respectively. The changes in soil thickness, rock outcrop, and soil moisture content were highly variable, and the SBD was moderately variable (Shang et al., 2018). The skewness of both the soil thickness and the SBD was lower than 0, which indicated that the skewness exhibited a certain degree of left-sided bias. This result showed that the soil thickness and SBD were generally lower than the average values, which indicated that the soil layer in a typical karst basin was thinner and nonuniform and that there was high spatial heterogeneity in the soil thickness and SBD in the karst basin.
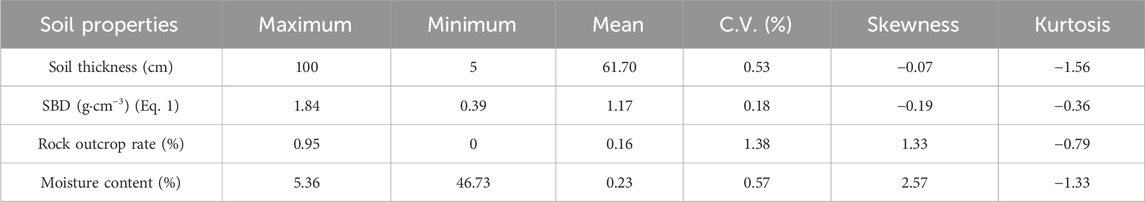
Table 1. Descriptive statistics of the major soil properties in the karst basin.
The skewness values of the rock outcrops and moisture content were greater than 0, which indicated that the rock outcrops and moisture content had a degree of right-sided bias and that there was high rock desertification in the karst basins. Moreover, the kurtosis values of the soil thickness, SBD, rock outcrop cover, and moisture content were lower than 0, and the peak distributions were gradual. This indicated that the spatial distributions of soil thickness, SBD, rock outcrop cover, and moisture content were diverse.
There was a greater discrepancy in the soil properties among the land use types (Figure 1). The soil thickness under the different land uses ranged between 37.48 and 77.06 cm, and the soil thickness decreased in the following order: cultivated land > garden land > forestland > barren land > grassland. The soil layer thickness of cultivated land and garden land was much greater than that of the other land uses. The coefficient of variation of soil thickness in all land use types reached high levels, with forests and grasslands having the highest values and being similar (Figure 1A). The average SBD values for all land uses were between 1.10 g cm−3 and 1.26 g cm−3, and the SBD values decreased in the following order: garden land > cultivated land > forestland > barren land > grassland. Moreover, the differences in SBD among the land use types were greater. The coefficient of variation of SBD in cultivated land and forestland was low, while that in garden land was moderately variable. However, the values for grassland and barren land reached highly variable levels, and the value for barren land was the greatest (Figure 1B).
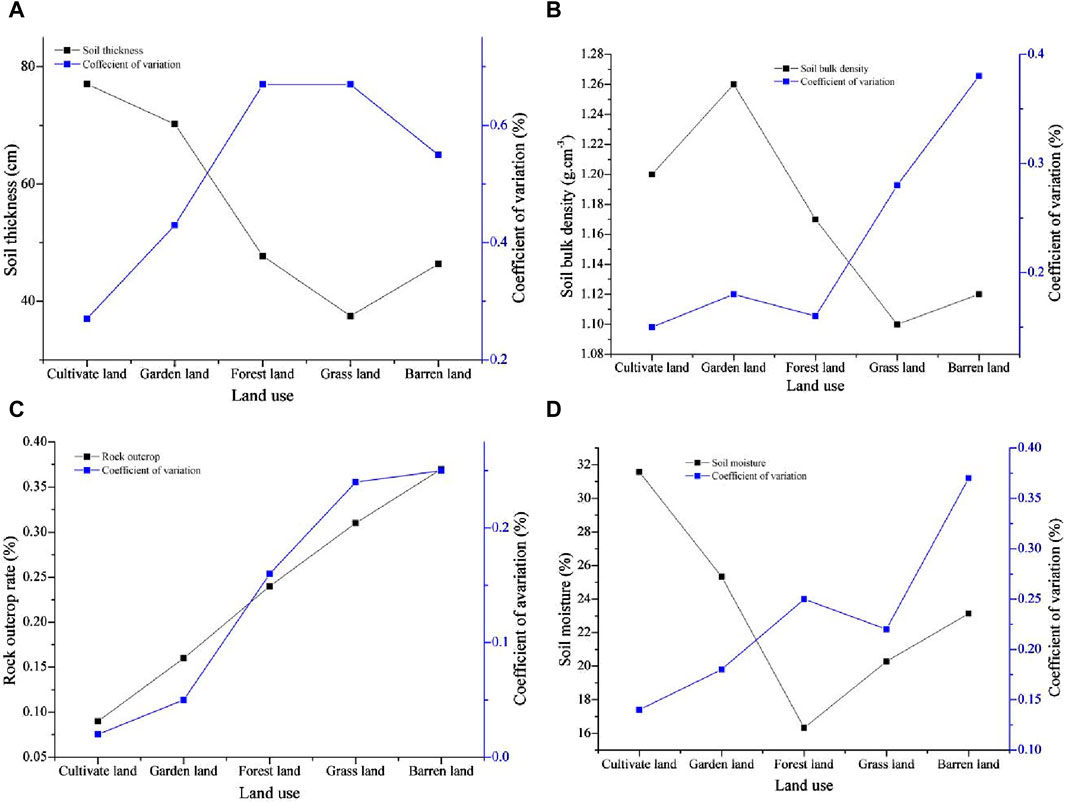
Figure 1. Information characteristics on soil properties in different land uses: (A) soil thickness, (B) SBD, (C) rock outcrop, and (D) soil moisture.
The rock outcrop rate under the different land uses ranged between 0.09 and 0.37, and its coefficient of variation ranged between 0.02 and 0.25. The spatial distribution characteristics of rock outcrops and their coefficients of variation for all land use types were similar, and their descending order was barren land > grassland > forestland > garden land > cultivated land. The distribution of rock outcrops among different land uses followed a regular gradient pattern. In addition, the coefficient of variation of rock outcrops in cultivated land and garden land was low; however, those values in forestland, grassland, and barren land had a high degree of variation (Figure 1C).
The average soil moisture content under the different land uses ranged from 16.33% to 31.57%, and the moisture content decreased in the following order: cultivated land > garden land > barren land > grassland > forestland. The distribution characteristics of soil moisture under the different land use types revealed a type of “V.” There were few differences in the soil moisture content among garden land, grassland, and barren land. The descending order of the coefficient of variation for different land uses was barren land > forestland > grassland > garden land > cultivated land. The coefficient of variation for cultivated land was low, but that for garden land, forestland, and grassland varied moderately. The coefficient of variation for barren land was significantly greater than that for other land uses (Figure 1D).
The number of soil animals in the sampling sites was counted, and the sites were divided into different levels of species, order, class, and phylum. There were many different soil animals in the soil samples, such as ground beetles, Agrotis segetum, caterpillars, ants, cicadas, crickets, Coccinella septempunctata, spiders, centipedes, frogs, and earthworms. Among them, Agrotis segetum and its caterpillars can be classified as Lepidoptera, and other soil animals belong to the Blattaria, Hymenoptera, Hemiptera, Orthoptera, Coleoptera, Araneae, Chilopoda, Anura, and Haplotaxida orders. These animal orders can be divided into five animal classes: Insecta, Arachnida, Myriapoda, Amphibian, and Clitellata and further divided into three animal phyla, Arthropoda, Chordata, and Annelida (Table 2).

Table 2. The statistics of soil animals in the karst basin.
At the species level, the top two soil animal species were ants and earthworms, and their numbers were far greater than those of other soil animal species. Their accumulation proportion was 89.5%, and the number of ants was more than double that of earthworms. This indicated that ants and earthworms were the dominant species in the study area and were widely distributed in the karst plateau basin. At the order level, the top two soil animals were Hymenoptera and Haplotaxida, and the distribution characteristics among all the soil animal orders were similar to the trend at the species level. However, there were few differences in number among the other soil animal orders. At the class level, the top two most abundant were Insecta and Clitellata, and their accumulation proportion reached 96.3%. At the phylum level, the abundance of Arthropoda was close to three times greater than that of Annelida, and Annelida was far more abundant than Chordata, and their percentages were 72.5%, 26.7%, and 0.9%, respectively. This indicated that the major soil animal phyla Arthropoda and Annelida were widely distributed in the karst basin, and there were fewer Chordata. This may be because the mass of Chordata is much larger than that of other soil animals, and Chordata occupy more places in the food chain; for example, ants are a food source for frogs.
There was a greater discrepancy in the SOM in each soil layer among the different land use types, and their spatial distribution characteristics are shown in Table 3. The average SOM concentration in all soil layers under the different land use types ranged between 8.98 g kg−1 and 69.25 g kg−1. In the 0–5 cm, 5–10 cm, 10–15 cm, and 15–20 cm soil layers, the SOM distributions in the different land use types were similar and exhibited a pattern of forestland > grassland > barren land > cultivated land > garden land. The differences between barren land and grassland and between cultivated land and garden land were small, and the SOM content in forestland was significantly greater than that in the other land types. In the 20–30 cm and 30–40 cm soil layers, the SOM concentration decreased in the following order: barren land > grassland > forestland > cultivated land > garden land. The values in barren land, grassland, and forestland were similar, and the discrepancy in the SOM content between cultivated land and garden land was small. In the 40–50 cm soil layer, the SOM concentration decreased in the following order: barren land > forestland > grassland > cultivated land > garden land. In the 50–60 cm, 60–70 cm, and 80–90 cm soil layers, the spatial distribution characteristics of the SOM concentration under the different land use types exhibited the following pattern: grassland > barren land > forestland > garden land > cultivated land. In the 70–80 cm soil layer, the descending order was grassland > forestland > barren land > cultivated land > garden land. However, the distribution of SOM in the 90–100 cm soil layer decreased in the following order: grassland > forestland > garden land > barren land > cultivated land.
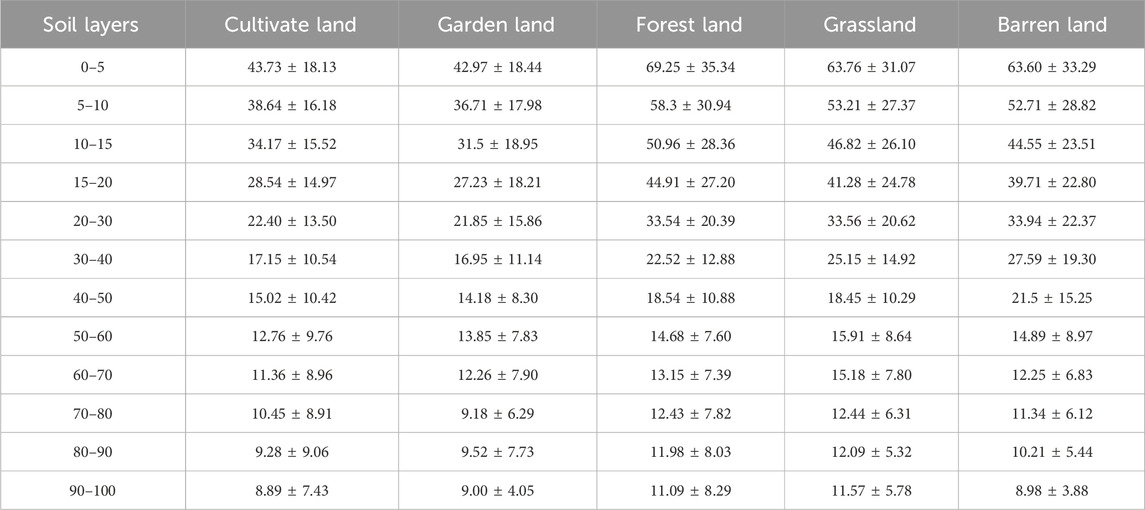
Table 3. The soil organic matter content characteristics in different land uses (g·kg−1).
In addition, in the vertical direction, the discrepancy in the SOM concentration from the surface soil layer to the subsurface soil among the different land use types was great. The descending order was forestland > barren land > grassland > cultivated land > garden land, and their ranges were 58.19 g kg−1, 54.62 g kg−1, 52.19 g kg−1, 34.84 g kg−1, and 33.97 g kg−1, respectively. In the 0–5 cm to 50–60 cm soil layers, the SOM concentration declined quickly; however, its decrease from the 60–100 cm soil layers was relatively slow. Moreover, the differences in SOM among the soil layers with different land use types were highly variable, and the coefficient of variation ranged from 0.39 to 0.85. In summary, the distribution regularity of the SOM concentration in the upper soil layers was distinctly better than that in the subsoil, and the depth of 60 cm could be considered the boundary of the distribution characteristics of the SOM in the upper soil layers and subsoil layers.
Information on the spatial distribution characteristics of SOM under coupled soil conditions is listed in Figure 2. The SOM concentrations in the samples with soil animals were generally greater than those in the soil without soil animals, and the SOM gradually decreased with increasing soil thickness. There was less difference between the SOM concentrations of soil samples containing animals and those with no animals in the upper soil layer, but this difference gradually increased with soil thickness. In addition, there was a distribution pattern of SOM in the vertical direction in which the SOM rapidly decreased in the soil layer from the surface to 50 cm, and the decrease rate of SOM in the 50 cm–100 cm layer was relatively slower and more stable. Furthermore, the coefficients of SOM variation in different soil layers were highly variable; these changes in non-animal-soil samples were generally greater than those in animal-soil samples, and this difference gradually increased in the subsoil layer (Figure 2A). There was no significant regular distribution of SOM in soils with different soil animals, but there was a larger discrepancy in SOM in soils with different soil animals in the 0 cm–60 cm soil layers, and this difference in the 60 cm–100 cm subsoil layer was relatively slight (Figure 2B).
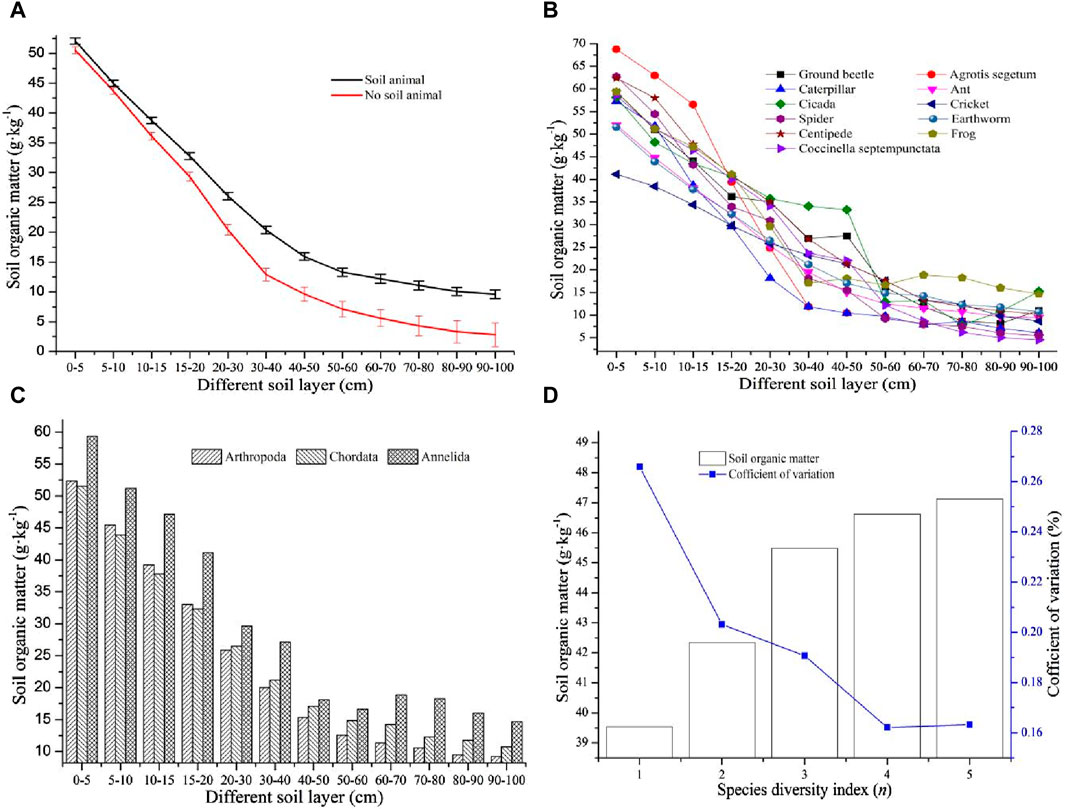
Figure 2. Distribution characteristics of SOM under the coupling of soil animals: (A) Spatial distribution of SOM with soil animals and no soil animals, (B) SOM distribution with different soil animals, (C) different soil phylum effects on SOM, and (D) the spatial distribution characteristics of SOM response to the species diversity index.
To further analyze the differences in SOM in soils with different soil animals, the soil animals were classified into three different soil phyla: Arthropoda, Chordata, and Annelida. In the upper soil layers from 0 cm to 20 cm, the descending order of SOM concentration in soils with different soil animal phyla was Annelida > Chordata > Arthropoda, and the SOM in soils with Annelida was significantly greater than that in soils with Chordata and Arthropoda. In the subsoil layer from 20 cm to 100 cm, the descending order of SOM concentration in soils with different animal phyla was Annelida > Arthropoda > Chordata. Obviously, the SOM concentration in each soil layer under the coupling of the Annelida animal phylum was the highest, and it was significantly greater than that under the coupling of the other two animal phyla. In addition, there was a slight difference in the SOM in the different soil layers with the animal phyla Chordata and Arthropoda (Figure 2C). This indicated that Annelida animals could promote SOM sequestration in soil more than other soil animals, which could improve soil quality in nature. The species diversity was calculated by Eq. 2. To better understand how species diversity affects SOM, the relationship between the average value of SOM in the 0 cm–20 cm soil layer and the change in the species diversity index was analyzed. The results showed that the SOM concentration gradually increased with increasing species diversity index, and there was a significant increase in the value of SOM when the species diversity index was between 1 and 3. When the species diversity index was between 3 and 5, the difference in SOM decreased. The variation coefficient of SOM at different levels of the species diversity index indicated moderate variation, and these values were between 0.16 and 0.26. The change in the SOM concentration gradually decreased with increasing species diversity index. Thus, when the species diversity index was relatively lower, the SOM concentration was lower, but there was a larger discrepancy in the SOM. When the species diversity index gradually increased, not only was the SOM concentration higher but also the difference in SOM was slight. This indicated that species diversity could promote SOM sequestration and maintain stable soil fertility (Figure 2D).
To analyze the distribution characteristics of SOM at different soil thickness levels, the SOM concentrations in each soil layer in the upper and bottom soil layers under different soil thicknesses were compared. Because the soil animals were mainly distributed in the 20-cm soil layer, the soil thickness at most sampling sites was less than 30 cm. Therefore, comparisons were conducted for the 5 cm, 10 cm, and 20 cm soil layers and in the subsoil (Figure 3). The SOM in the topsoil layer of 5 cm at different soil thicknesses gradually decreased with increasing soil thickness, and the SOM concentration ranged between 37.01 g kg−1 and 89.93 g kg−1. The maximum value was 2.43 times greater than the minimum, which indicated that there was a greater discrepancy in the SOM in the topsoil layer among the different soil thickness levels. In addition, the change in SOM in the topsoil layer at each soil thickness level was highly variable except at the 80 cm and 100 cm soil thickness levels. The change trend of SOM at different soil thickness levels fit an exponential function curve (y = 95.03e−0.084x, R2 = 0.9807) (Figure 3A). In the 10 cm soil layer, the SOM concentration gradually decreased with increasing soil thickness. However, the average SOM concentration at the 10 cm soil thickness level was much greater than that at the other soil thickness levels, and the largest value of SOM was 2.11 times the lowest value. There was little difference in SOM at different soil thicknesses from 20 cm to 100 cm, and the SOM concentration at different soil thickness levels fit a power function curve (y = 66.59x−0.288, R2 = 0.9328). Only the coefficient of variation of SOM at a soil thickness level of 10 cm indicated high variation; those at soil thickness levels of 20 cm, 30 cm, 40 cm, and 50 cm indicated moderate variation, and the change in SOM at soil thickness levels from 60 cm to 100 cm indicated low variation (Figure 3B).
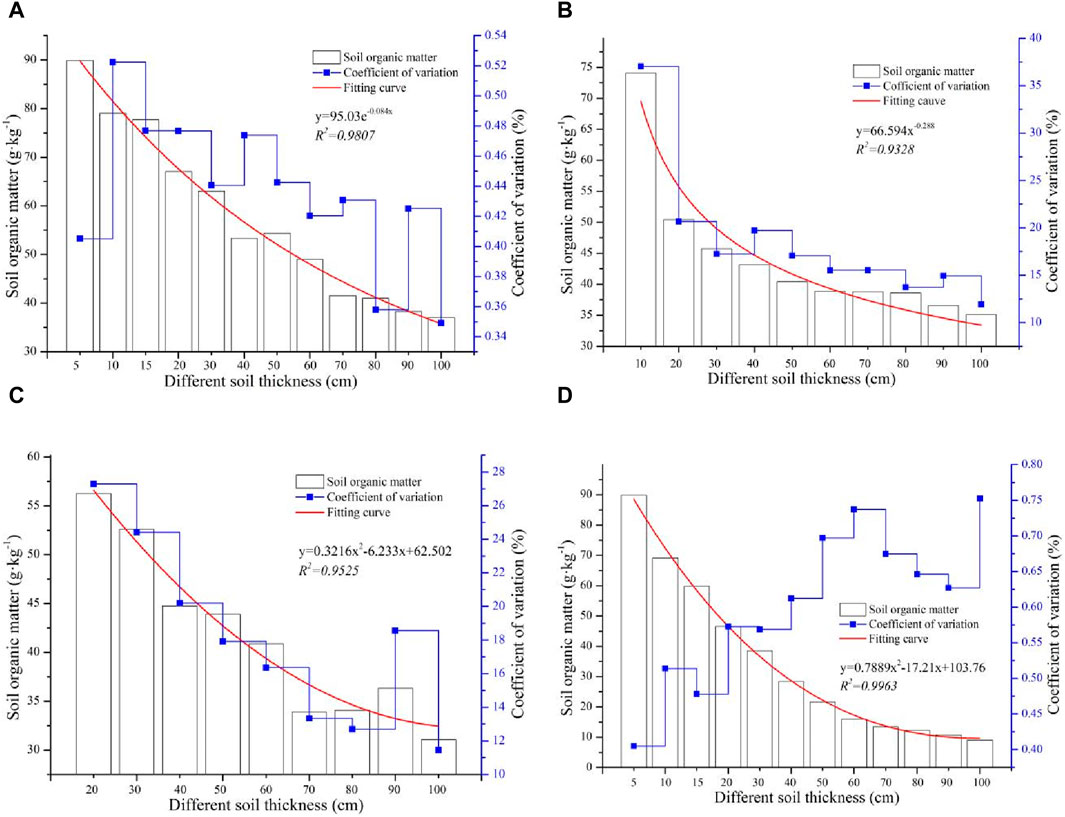
Figure 3. The soil thickness effects of the SOM concentration: (A) the SOM in the 5 cm surface soil layer at different soil thicknesses, (B) the SOM in the 10 cm upper soil layer at different soil thicknesses, (C) the SOM in the 20 cm upper soil layer at different soil thicknesses, and (D) the SOM in the subsoil layer at different soil thicknesses.
The distribution characteristics of the average concentration of SOM in the upper 20 cm soil layer at different soil thickness levels from 20 cm to 100 cm were similar to those in the 10 cm soil layer (Figure 3C). As the soil thickness increased, the SOM concentration decreased, and the change in SOM also decreased. The change trend of SOM at different soil thicknesses fit a polynomial function curve (y = 0.3216x2 − 6.233x + 62.502, R2 = 0.9525). Moreover, all the changes in SOM at different soil thickness levels exhibited low and moderate variations, which indicated that when the soil thickness was greater, the SOM was more stable. There was a significant regular distribution of SOM in the bottom soil layer at different soil thickness levels. The SOM concentration gradually decreased with increasing soil thickness, and the change trend of SOM at different soil thickness levels fit a polynomial function curve (y = 0.7889x2 − 17.21x + 103.76, R2 = 0.9963). The SOM concentration in the bottom soil layer at the different soil thickness levels ranged between 9.05 g kg−1 and 89.93 g kg−1, and the maximum was approximately 10 times the minimum. In addition, the degree of change in the SOM concentration in the bottom soil layer gradually increased with increasing soil thickness, and all the coefficients of variation were highly variable (Figure 3D). This indicated a high discrepancy in SOM in the bottom soil layer at different soil thickness levels.
In summary, the soil thickness greatly influenced the SOM, and this influencing mechanism can be summarized as follows: The SOM concentration in each soil layer at the different soil thicknesses gradually decreased with increasing soil thickness, and the change in SOM in the upper soil layer gradually decreased with increasing soil thickness. However, the change in SOM in the bottom soil layer differed from that in the upper soil layer, which gradually increased with increasing soil thickness.
The relationships between SOM and SBD and between SOM and rock outcrops were analyzed, and the results are shown in Figure 4. The large discrepancies in the SBD and rock outcrops were important properties of the soil in karst basins, and there were important factors that affected the SOM to varying degrees. The SOM and SBD were negatively correlated (r = −0.332, p < 0.01, n = 2,728), which indicated that the higher the SBD was, the lower the SOM (Figure 4A). Moreover, the SBD quickly increased with soil thickness in the upper 0–40 cm soil layer, there was a slight difference in the SBD in the 40–60 cm soil layer, and then the SBD gradually decreased with increasing soil thickness in the 60–100 cm soil layer. In addition, the change trend of the SBD from the surface soil layer to the bottom soil layer fit a polynomial curve (y = 1.065 + 0.1078x − 0.0109x2 − 1.2817x3, R2 = 0.9849), which revealed that the effects of the SBD on the SOM mainly occurred in the upper 0–40 cm of the soil layer, and this influence in the subsoil layer was relatively lower. Furthermore, there was a large change in the SBD in the upper soil layer, and this change was relatively lower in the subsoil layer. All the coefficients of variation of the SBD in the different soil layers exhibited low variation, except for that in the 0–5 cm soil layer (Figure 4B).
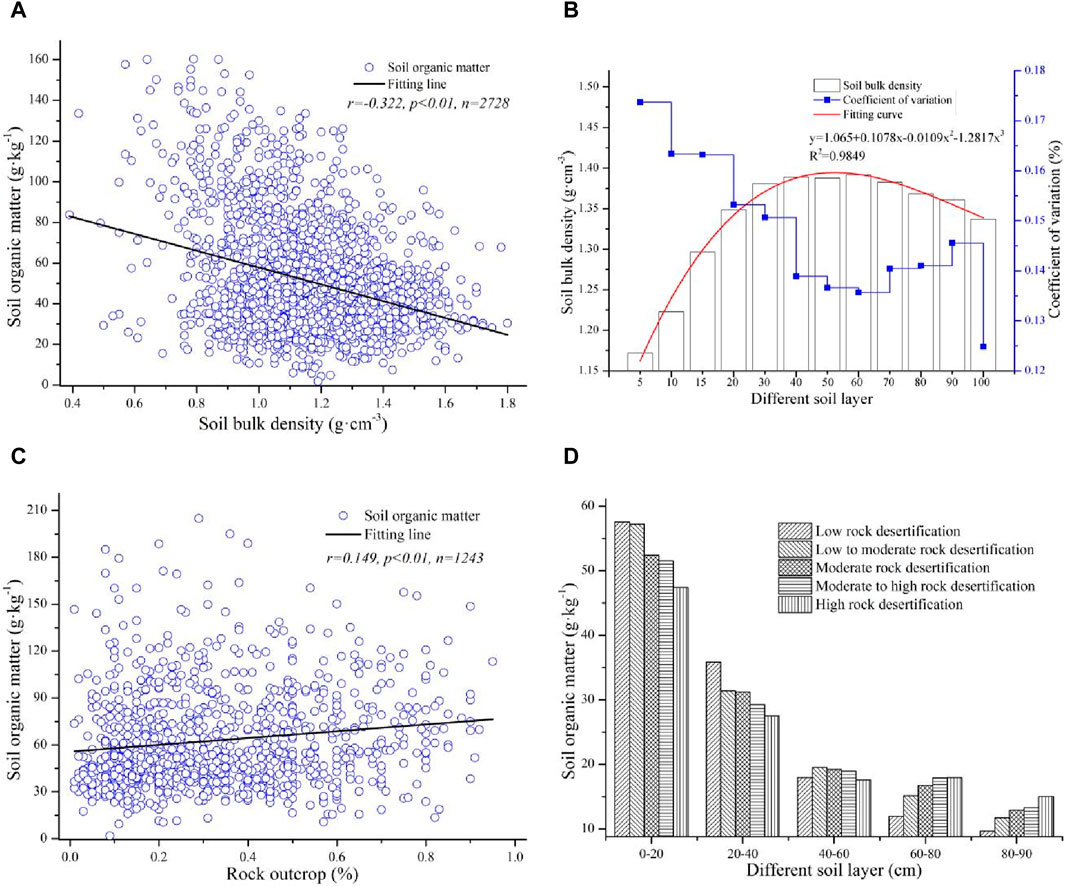
Figure 4. The SBD and rock outcrop affected the SOM concentration: (A) the relationship between SBD and SOM, (B) the spatial distribution of SBD in the vertical direction, (C) the relationship between SOM and rock outcrop, and (D) rocky desertification affected SOM in different soil layers.
Rock outcrops could partially promote SOM accumulation, and the relationships between the SBD and rock outcrops were positively correlated (r = 0.194, p < 0.01, n = 1,243) (Figure 4C). To further analyze the effects of rock outcrops on different soil layers, the rock outcrops were divided into different rocky desertification areas according to the rock outcrop rate, after which the changes in SOM among the different rocky desertification areas in the different soil layers were analyzed. The results showed that the SOM gradually decreased with increasing rocky desertification in the upper soil layers of 0–40 cm, and there was little change in the SOM at different rocky desertification degrees in the middle soil layer of 40–60 cm. In contrast, the SOM gradually increased with increasing rocky desertification degree, but the average value of SOM in the bottom soil layer was lower than that in the upper soil layer (Figure 4D). This indicated that lower rocky desertification mainly affected the SOM in the upper soil layer, and higher rocky desertification had a greater effect on the SOM in the subsoil layer.
Soil moisture, soil structure, soil genus, and soil color are additional important soil characteristics in karst basins. To analyze the relationship between these soil properties and SOM, the average SOM concentration in the upper 0–20 cm layer was determined under the coupling of different soil properties, and the information is listed in Figure 5. To analyze the response of the SOM concentration to soil moisture more clearly, the soil moisture was divided into five categories according to the soil moisture content, which ranged from 5.67% to 43.25%. The soil moisture had a greater effect on the SOM concentration, and there was a larger discrepancy in the SOM content at the different soil humidity levels. The lowest value of SOM occurred at a soil moisture level of 1, and the maximum value of SOM occurred at a soil moisture level of 3. The SOM concentration was between 28.56 g kg−1 and 48.29 g kg−1, and the largest value was 1.69 times the minimum value. There was a slight difference in the SOM content at levels 2 and 5, and the SOM content at level 3 was much greater than that at the other soil moisture levels. The change trend of the SOM value coupled with the soil moisture level fit a polynomial curve (y = 9.73 + 20.43x − 3.23x2, R2 = 0.63). This revealed that the effect of soil moisture on SOM mainly exists in moderately humid soil, and this influence in dry soil and wetter soil is relatively less. Furthermore, all the changes in SOM at different degrees of soil moisture were highly variable, which indicated that there was a large discrepancy in SOM with the change in soil moisture (Figure 5A). There was a significant change in the SOM in the different soil structures, and the SOM gradually increased with decreasing soil structure. The content of SOM in the different soil structures ranged between 41.27 g kg−1 and 47.01 g kg−1, and its coefficient of variation ranged between 0.45 and 0.55. The SOM concentrations in the block structure and granular structure were relatively lower, and the difference in SOM in the two soil structures was also smaller. The SOM content in the soil structure of the silt and clay fraction was the highest, and its change was the lowest (Figure 5B). Thus, the smaller the soil structure was, the more easily the accumulation of SOM was promoted, and the SOM accumulation was relatively stable.
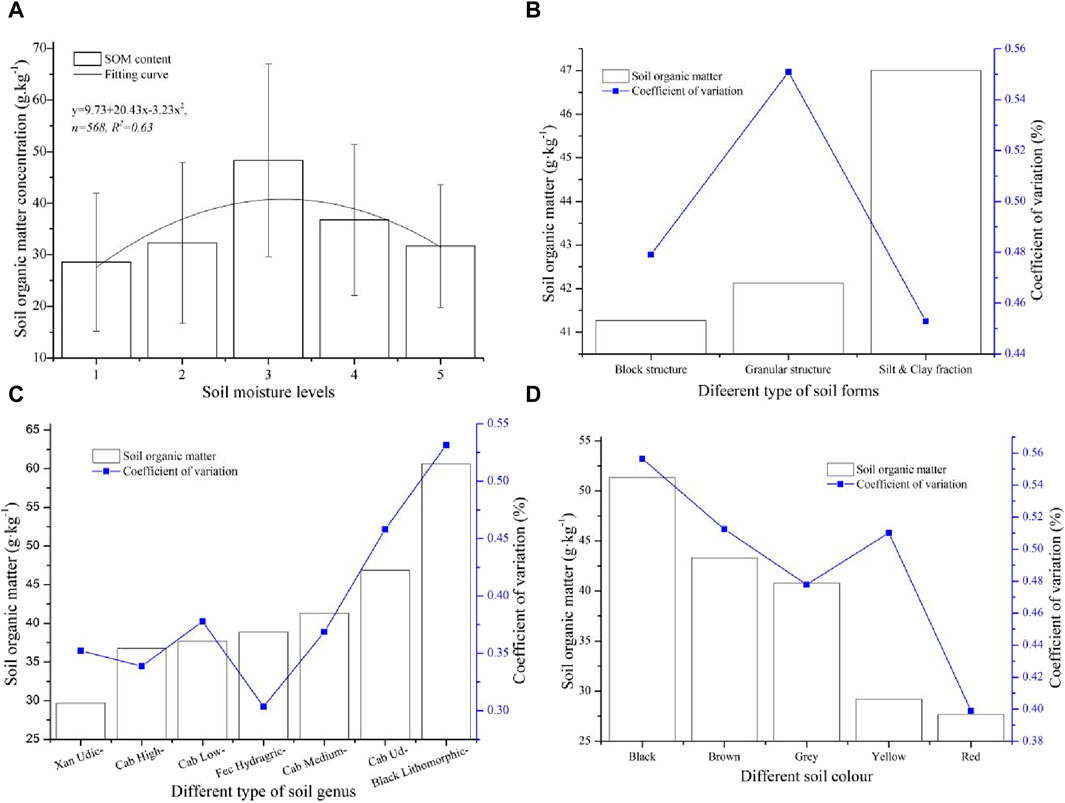
Figure 5. The relationship between SOM and soil properties: (A) the relationship between SOM and soil moisture, (B) the relationship between SOM and soil structures, (C) the relationship between SOM and soil genus, and (D) the relationship between SOM and soil color.
The descending order of SOM in the upper soil layer at 0–20 cm in the different soil types was Black Lithomorphic Isohumisols (Black Lithomorphic) > Cab Udi Orthic Entisols (Cab Udi) > Cab Medium Fertility Orthic Anthrosols (Cab Medium) > Fec Hydragric Anthrosols (Fec Hydragric) > Cab Low Fertility Orthic Anthrosols (Cab Low) > Cab High Fertility Orthic Anthrosols (Cab High) > Xan Udic Fernalisols (Xan Udic), and their average values were 29.67 g kg−1, 36.75 g kg−1, 37.67 g kg−1, 38.85 g kg−1, 41.32 g kg−1, 46.86 g kg−1, and 60.64 g kg−1, respectively. The SOM gradually increased from Cab High to Cab Udi, and there were smaller differences in the SOM values among them. Moreover, the SOM values in Black Lithomorphic soil were greater than those in the other soils, and the values in Xan Udic soil were lower than those in the other soil types. In addition, there was a regular distribution of the coefficient of variation for SOM changes in different soil types, which was similar to the change trend of SOM content in different soil types. In general, the higher the SOM content was, the greater the coefficient of variation in the different soil types. The changes in SOM in the Xan Udic, Cab High, and Fec Hydragric soils exhibited moderate variation, and those in the Black Lithomorphic, Cab Udi, Cab Medium, and Cab High soils exhibited high variation (Figure 5C). This indicated that the SOM in calcareous soil was generally greater than that in other soils. The descending order of SOM in the different soil colors was black > brown > gray > yellow > red, and the SOM content ranged between 27.67 g kg−1 and 51.32 g kg−1. The concentration of SOM in the different soil colors could be divided into three different levels. The SOM content in the black soil was the highest, the SOM content in the brown and gray soils was the second highest, and the SOM content in the yellow and red soils was the third highest. There were smaller differences in SOM at the second level, and these differences at the third level were similar. Furthermore, there was a greater discrepancy in SOM at different levels, and the change presented a significant ladder. The coefficient of variation of SOM in different soil colors gradually decreased with decreasing SOM content, but all the coefficients of variation were highly variable (Figure 5D). Obviously, the SOM in dark-colored soil was generally greater than that in bright-colored soil, and the degree of change in SOM in dark-colored soil was also relatively greater.
According to the information in Figure 2, which indicates that the relationship between SOM and soil animals is positively correlated, the number of soil animals and the species of soil animals can partially promote the accumulation of organic matter in soil. The many soil animal species in karst basins can be divided into different animal orders, classes, and phyla; this information is listed in Table 2. There is a larger discrepancy in the spatial distribution characteristics of soil animals in karst basins, which results in the spatial heterogeneity of soil animals in karst basins being more complex. Because the ecological environment in karst regions is more fragmented, the coupling mechanism between soil animals and different soil properties is more complex. Therefore, to research the relationship between SOM and soil animals, the spatial distribution characteristics of soil animals impacted by different soil properties must be investigated. The relationships between the soil animals and soil properties are listed in Figure 6.
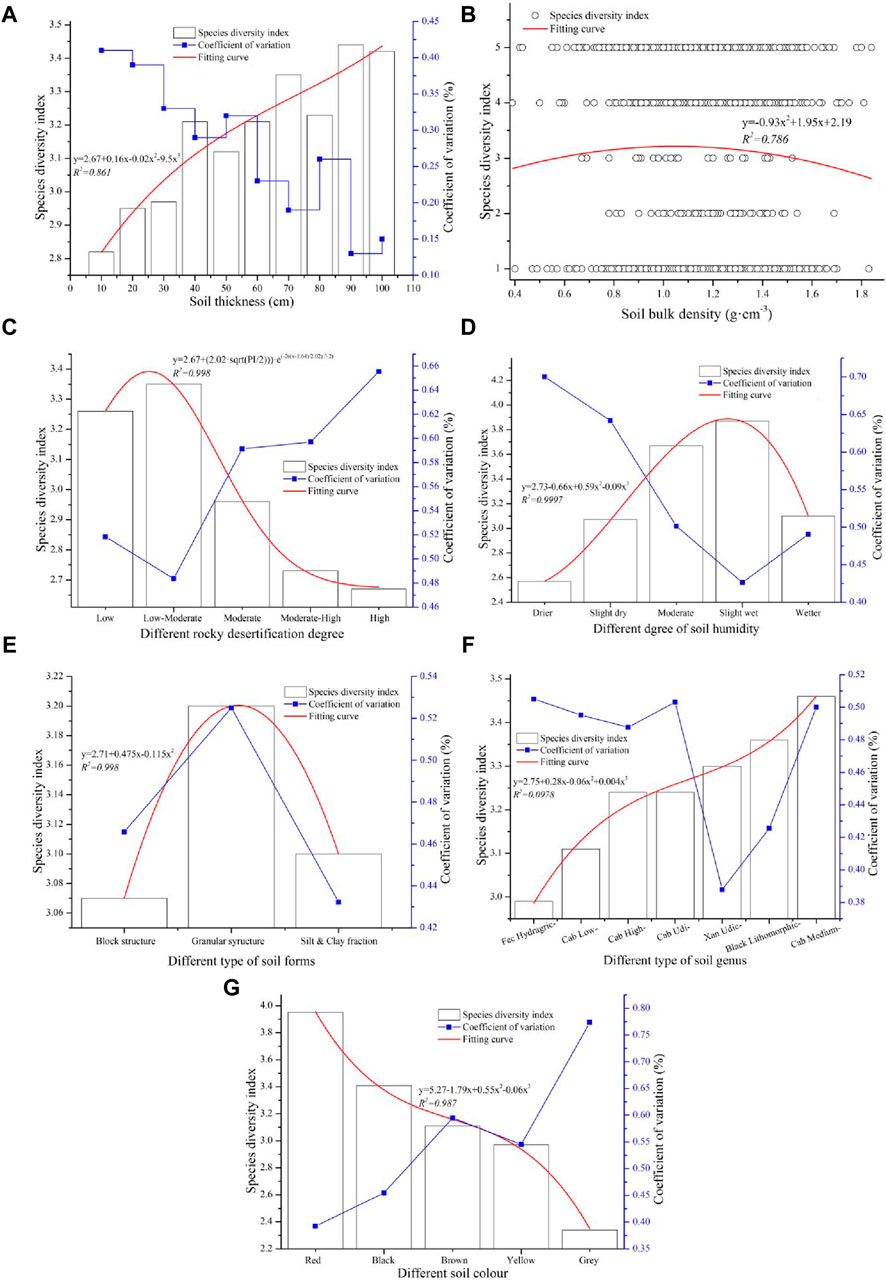
Figure 6. The relationship between soil animals and soil properties: (A) the relationship between soil animals and soil thickness, (B) the relationship between soil animals and SBD, (C) the relationship between soil animals and rocky desertification, (D) the relationship between soil animals and soil humidity, (E) the relationship between soil animals and soil structures, (F) the relationship between soil animals and soil types, and (G) the relationship between soil animals and soil color.
Soil thickness is an important soil property; it is a site where energy and matter are stored and translated, which is the basis of sustainable development (Keesstra et al., 2018; Visser et al., 2019). The soil layer in the center of the intersection of the lithosphere, biosphere, hydrosphere, and atmosphere is an important reservoir of organic matter (Hobley et al., 2014). Moreover, the soil layer is an important habitat for organisms, and changes in the soil environment may influence species structure and number. Soil thickness significantly impacts soil animals; the thicker the soil is, the more soil animal species there are. In addition, thicker soil can promote the structural stability of living soil because the coefficient of variation of species diversity tends to gradually decrease with increasing soil thickness. Then, the species diversity gradually increased with soil thickness, and the change fit a polynomial formula curve (y = 2.6760.16x − 0.02x2 − 0.95x3, R2 = 0.861) (Figure 6A). The main range of SBD values in the karst basin was between 0.8 and 1.6, and the SBD in this range was 94.59%. The relationship between soil animals and SBD fits a polynomial formula curve (y = 0.93x2 + 1.95x + 2.19, R2 = 0.786). The species diversity index gradually increased with increasing SBD before the top site, and then, the species index gradually decreased with increasing SBD (Figure 6B). This indicated that a moderate range of SBD is an advantage for soil animal survival, and both too-high and too-low SBDs are not good environments for organisms living in soil. This can further influence the spatial distribution characteristics of SOM.
There was a significant regular distribution of soil species diversity under the impact of rocky desertification, which showed that the species diversity index increased from low rocky desertification to low–moderate rocky desertification, after which the species diversity in the soil quickly decreased with increasing rocky desertification. This trend in soil species diversity was coupled with the change in rocky desertification, which fit a curve of the Gauss formula (y = 2.67+(2.02·sqrt (PI/2))·e(−2((x−1.64)/2.02)^2), R2 = 0.998). In addition, the change in species diversity in soil gradually increased with rocky desertification in general, and the coefficients of variation of the species diversity index at low and low–moderate levels of rocky desertification were relatively lower than those at other degrees of rocky desertification. However, all the degrees of change in soil species diversity at different levels of rocky desertification were highly variable (Figure 6C), which indicated that low and moderate levels of rocky desertification could promote soil living, and there was a large discrepancy in the number of animal species in the soil.
The main soil dry humidity conditions in the karst basin include moderate, slightly wet, and slightly dry conditions, and drier soil is relatively less abundant. At first, the soil species diversity gradually increased with soil humidity until the soil humidity level was slightly wet, and then the species diversity quickly decreased with increasing soil humidity. The change trend of soil species diversity under the coupling of soil dry humidity fits a polynomial formula curve (y = 2.73 – 0.66x + 0.59x2 − 0.09x3, R2 = 0.9997). Furthermore, the coefficient of variation of soil species diversity in the karst basin gradually decreased with soil humidity in general, but all the changes in species diversity at different soil humidities exhibited high variation (Figure 6D). This indicated that moderate and slight degrees of soil humidity are beneficial to soil life, and drier and wetter levels of soil humidity are not favorable sites for different soil animals. In addition, the main soil animals in wetter soil were Annelida, such as earthworms. The soil species diversity index in the granular structure of the soil in the karst basin was the largest, followed by that in the block structure, and the soil species diversity in the granular structure was significantly greater than that in the other soil structures. The regular distribution of soil species diversity from a larger structure to a smaller structure of soil fit a polynomial formula curve (y = 2.71 + 0.48x − 0.12x2, R2 = 0.998), and the coefficient of variation of soil species diversity in the granular structure was the highest (Figure 6E). This revealed that the granular structure of soil is an advantage for the survival of living organisms in soil, and there is a large discrepancy in soil species diversity among different soil structures.
The difference in soil species diversity among the different soil types was not large, and the species diversity indices among the different soil types ranged between 2.99 and 3.46. The descending order of species diversity in the different soil types was Cab Medium > Black Lithomorphic > Xan Udic > Cab Udi > Cab High > Cab Low > Fec Hydragric. According to the order of the different soil types, the relationships between the soil types and the species diversity indices of the soil animals fit a polynomial curve (y = 2.75 + 0.28x − 0.06x2 + 0.04x3, R2 = 0.978). In summary, the species diversity in calcareous soil was greater than that in loamy soil, and all the changes in species diversity exhibited high variation among the different soil types (Figure 6F). This indicated that there is no significant regular distribution of soil animals in different soil types, and there is a slight trend that the soil animals in black limestone soil and yellow limestone are relatively more prevalent than in other soils. There was a great difference in species diversity among the different soil colors, and the species diversity indices under the different soil colors ranged between 2.34 and 3.95. The largest species diversity index value was in red soil, the lowest was in gray soil, and the change trend fit a polynomial curve (y = 5.27 – 1.79x + 0.55x2 − 0.06x3, R2 = 0.987). The trend of the coefficient of variation of species diversity in different soil colors was the opposite of the change in species diversity in different soil colors; the species diversity in red soil was the highest, but the change was the lowest, and the opposite was the case in gray soil (Figure 6G). In summary, the qualities of soils with bright colors can promote soil life more than the qualities of soils of other colors. The abundance of organisms in gray soil is lower, which may be the result of gray soil having properties similar to those of limestone bedrock.
Because of the main distribution of soil animals in surface soil layers (Li X. D. et al., 2020), the relationships among SOM, soil animals, and land use changes are discussed mainly for the 0–20 cm soil layer. According to the information from Tables 2, 3 and Figures 1, 2, the distribution characteristics of SOM in different land uses showed a regular stepwise decrease. Among them, forestland was at the first level, significantly higher than other land uses, followed by grassland and barren land, and cultivated land and garden land were at the third level. This was because the SOM concentrations in the soil samples containing animals are generally greater than those in the soil without soil animals (Figure 2A). Moreover, the soil animal diversity of forestland, barren land, and grassland is generally greater than that of garden land and cultivated land. The diversity forestland and cultivated land are significantly greater and less than those of other land uses, respectively (Figure 7A). This result is similar to that of Lu et al.’s research, which showed a significant correlation between soil animals and SOM (p < 0.01), and the SOM concentration increases with the increasing number of soil animal species (Lu et al., 2016). In addition, the microtopography of stone basins, stone grooves, stone crevices, etc., is widely distributed in barren land grasslands, and humus is generally intercepted in these microtopographies (Huang et al., 2018; Wang et al., 2022). In forestland, there is an abundant SOM resource, and the surface soil is not washed by rainfall because of the buffering effect of tree crowns (Wang et al., 2022). According to Figure 2B, the SOM concentrations in the 0–20 cm layer of soil with Agrotis segetum are greater than those in the soil with other soil animals (Figure 7B). Moreover, the average numbers of Agrotis segetum in barren land and grassland are much greater than those in other land uses. The SOM concentrations in cultivated land and garden land are lower than those in other land uses, but their earthworm numbers are generally high (Figure 7C). This is because earthworms positively or negatively affect SOM. They can promote the accumulation and decomposition of humus and SOM (Crowther et al., 2014; Kang and Wu, 2021). Although earthworms are considered major soil animals that affect SOM conversion, it is unclear how much and how quickly they can protect SOM content (Shan et al., 2013; Tu et al., 2020). In addition, cultivated land, including paddy fields and dry land, is more disturbed by productive activities, resulting in easier loss of SOM (Wang et al., 2022; Gao et al., 2023). According to the relationships between land use types, soil animals can be summarized as two loop lines, Line A and Line B, in the karst basin area. Among these factors, land use is crucial in the cyclical process. In line A, land use affects the soil animal species and subsequently affects the SOM distribution. In line B, the distribution characteristics of SOM in the different land use types greatly differ in all the soil layers, which further affects the spatial distribution of the number of soil animals in the different soil layers (Figure 7D). For these reasons, the SOM concentrations in those land use types are greater than those in other land use types. However, the SOM concentrations in cultivated land and garden land are relatively low, but the distribution of SOM is more uniform. In summary, the coupling mechanism among land use, soil animals, and SOM in karst areas is complex, and there are multiple relationships among them. Their relationships show not only positive promotion but also negative restraint. A good land type may increase the number and abundance of soil animal species and SOM. However, microtopography, such as stone grooves and stone crevices, can affect the restructuring of the spatial distribution of SOM in karst basin areas (Huang et al., 2018; Zhang et al., 2019).
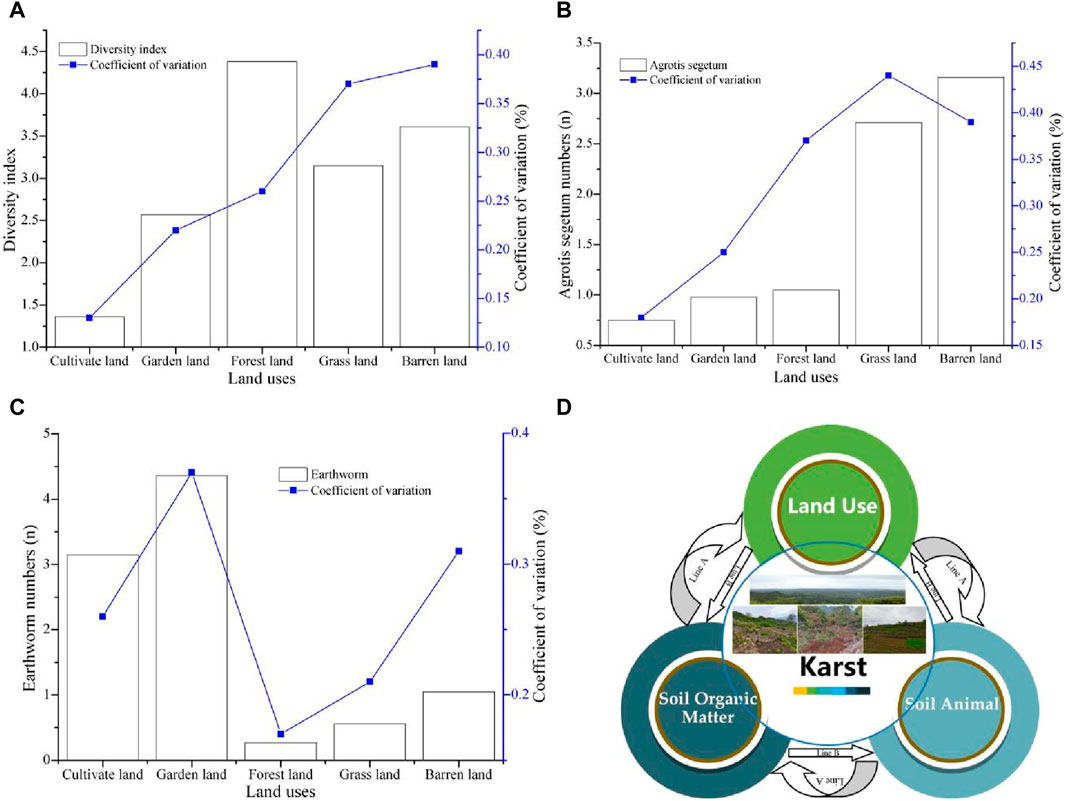
Figure 7. The relationship between SOM, soil animals, and land use: (A) the relationship between soil animals and land use; (B, C) the relationship between Agrotis segetum and land use and earthworms and land use; (D) the relationship cycle of land use, soil animals, and soil organic matter in karst.
Figures 2, 3, 6 show the complexity of the relationships between SOM, soil animals, and different influencing factors. The distribution characteristics of each impact factor in the karst plateau basin are also complex, which means the multiple factors influencing the SOM in the karst plateau basin are complicated (Zhang et al., 2019; Wang et al., 2022). To more accurately analyze the response model of factors that affect soil animals, the key factors in karst plateau basins should be discussed (Huang et al., 2018; Zhang et al., 2019). The dimensions of the multiple factors were reduced using PCA via SPSS software (Table 4).
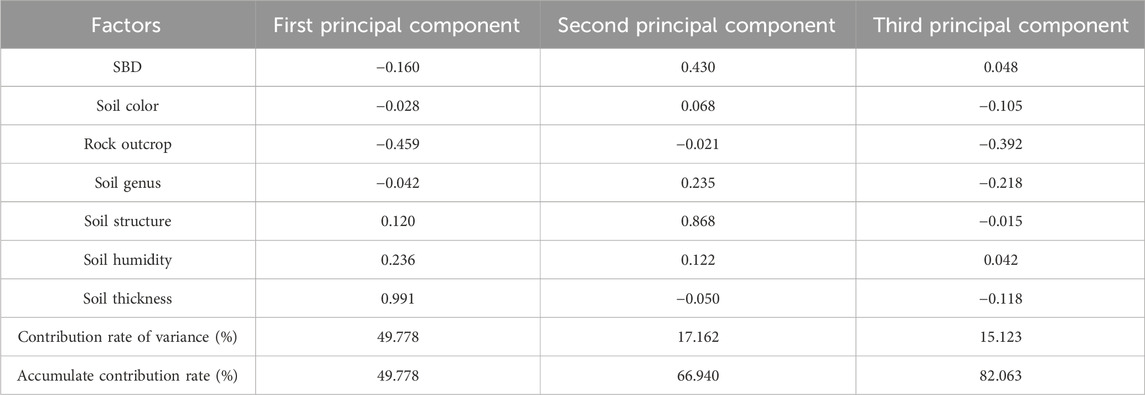
Table 4. Principal component analysis (PCA) of environmental factors via the maximum variance method.
The first three principal components represented 82.063% of the correlation between different factors. The contribution rates of the first, second, and third principal components were 49.778%, 17.162%, and 15.123%, respectively. Among those impact factors, soil thickness and soil humidity had high positive loads on the first principal axis, and soil structure and SBD had high positive loads on the second principal axis; however, the rock outcrop and soil type had high negative loads on the third principal axis. These factors were critical on each principal axis, which revealed two positive alliance models—soil thickness-soil humidity and soil structure-SBD—and a negative alliance of rock outcrop-soil type that has a greater influence on soil animals in the karst plateau basin. According to the RDA results, the major positive impact factors of soil animal diversity mostly include soil thickness, soil humidity, and soil form, and the negative impact factor is rock outcrops (Figure 8A). The dominant species of soil animals in the study area are ants and earthworms. Among them, soil form positively influences ants, and soil humidity positively affects earthworms (Figure 8B). These results were consistent with those of Han et al. and Ye et al., who reported that the soil animal community positively responds to soil humidity, and the relationship between SOM and soil animals exhibits a significant positive correlation (Han et al., 2017; Ye et al., 2019). Zhang et al. noted that soil moisture has a significant control effect on earthworm reproduction (Zhang X. H. et al., 2020). In summary, the soil animal community was positively influenced by soil thickness, soil humidity, and soil form and negatively influenced by rock outcrop cover. In addition, the dominant species affecting the spatial distribution of SOM are ants and earthworms, which are impacted to a greater degree by soil form and soil humidity, respectively.
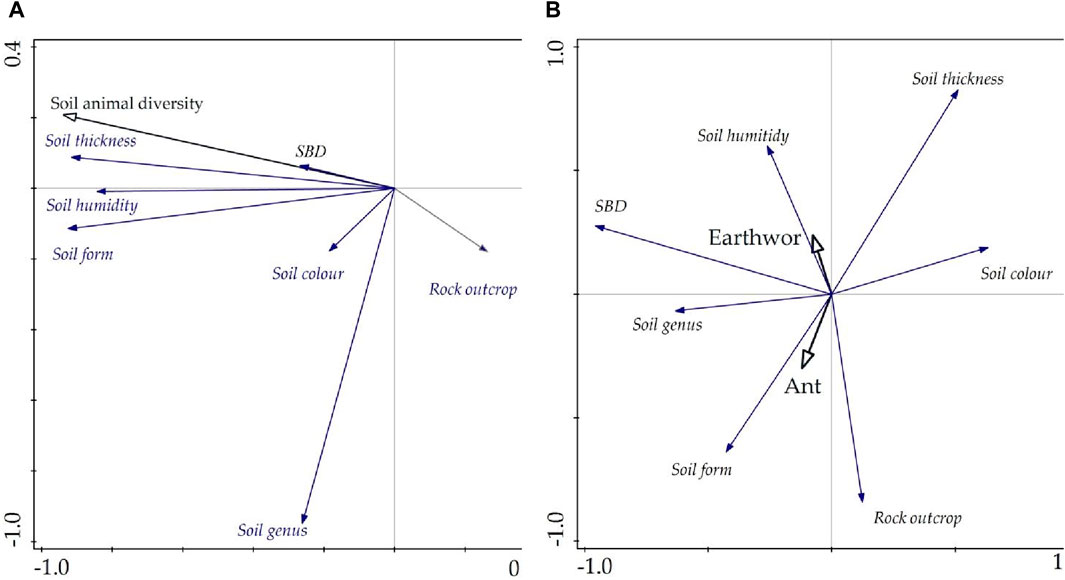
Figure 8. The key impact factors of soil animals: (A) soil animal diversity in response to different factors in all samples and (B) the dominant species response to different factors.
Soil animals are an important component of the soil ecological system and affect the translation of nutrients and energy in soil. Soil animals are often treated as mini-pulverizers of litterfall that can impact the conversion of SOM and the formation of humus. The comprehensive interaction between soil animals and soil microorganisms can stimulate the activity of soil enzymes and promote the decomposition of soil humus (Dong et al., 2016). The activities of soil animals can improve soil air permeability, soil structure, and soil fertility. For example, ants and earthworms burrow, nest, and obtain food in soil and can mix different soil layers that increase soil porosity, reduce SBD, improve soil aggregation, and promote soil nutrient cycling (Mbau et al., 2015). In addition, soil animal feces and exudation can increase the effectiveness of soil nutrients, influencing the spatial distribution characteristics of SOM in profiled soil and simultaneously impacting soil properties in direct and indirect ways (Frouz et al., 2008; Dong et al., 2016). Figure 7 shows that soil properties promote an increase in soil animals, which indicates a synergistic effect between soil animals and soil properties. The soil thickness, SBD, rock outcrop, soil structure, and soil humidity are particularly important factors affecting soil animals, and there is a significant regular distribution between soil animals under the coupling of these soil properties. There is a significant correlation between soil animals and soil properties in karst basins, and the interaction is similar to the findings of Frouz et al. (2008) and Mbau et al. (2015). Moreover, based on Figure 2, the organic matter in soil with soil animals was generally greater than that in soil with no soil animals, and the coupling mechanism was consistent with the work by Dong et al. (2016). In addition, soil properties are impacted by the synergism between different soil animals and other factors in general, and different soil animals affect SOM in different ways (Wright and Covich, 2005). The organic matter in soil with earthworms (phylum Annelida) is much greater than that in soil with other soil animals (Figure 2C), which is consistent with the results of Kisand and Tanmmert (2000), Scullion and Malik (2000), and Bradford et al. (2002). Furthermore, soil species diversity can partially promote soil quality, and the higher the species diversity index is, the better the soil structure (Figure 6E), which is consistent with the results of Berg and Mcclaugherty (2013). According to the information in Figure 3D, species diversity is a major factor promoting SOM; the higher the species diversity index is, the greater the SOM value, and the regular relationship between species diversity and SOM is consistent with studies by BjΦrnlund and Christensen (2005), and Wang et al., (2009).
In summary, there is a significant correlation between soil animals, soil properties and SOM, and soil animals not only impact different soil properties but also influence SOM. Moreover, the soil thickness, SBD, rock outcrop, soil humidity, and soil aggregates are important soil properties in karst basins (Huang et al., 2018; Li et al., 2019; Zhang et al., 2019), and the regular relationships between soil animals and SOM in karst basins are obvious. Thus, soil animal distribution characteristics are important factors that affect SOM in karst basins, and the mechanism of SOM distribution under the coupling of soil animals is partially reliable.
The average concentration of soil organic matter (SOM) in the Puding Basin varies between 9.23 g kg−1 and 59.39 g kg−1 across the different land uses and is ranked in descending order as follows: forestland, grassland, barren land, cultivated land, and garden land. The SOM distribution in the upper soil layers is more pronounced than that in the subsoil layers, with a notable change at a depth of approximately 60 cm. Soils containing soil animals generally have higher SOM concentrations than those without. Higher SOM levels are associated with greater species diversity, and both diversity and SOM decrease with increasing soil depth. Large variability in SOM was observed under the influence of different soil animal phyla. Soils with Annelida, particularly earthworms, exhibited higher SOM concentrations than did the other soils. Soils with Agrotis segetum also have elevated SOM levels. Annelida greatly improved soil quality, fertility, and nutrient availability in karst basins. The major species influencing the SOM distribution were Agrotis segetum, which affects surface layers, and earthworms, which facilitate deeper organic matter penetration. Earthworms thrive at relatively high soil humidity and thickness but are negatively impacted by rock outcrops. The spatial distribution of soil animals is positively influenced by interactions between soil thickness, humidity, structure, and bulk density and is negatively influenced by rock outcrops and soil types. Soil animal diversity is mostly affected by soil thickness, humidity, and structure. Land use type is also crucial in influencing SOM distribution; beneficial land use increases soil animal diversity and abundance, promoting SOM accumulation. Microtopography greatly impacts SOM in karst basins by altering its spatial distribution. Overall, land use and soil animals are critical factors affecting SOM, with complex relationships influenced by spatial heterogeneity in karst environments. Therefore, more accurate methods are needed to assess SOM in these areas for further study.
The original contributions presented in the study are included in the article/Supplementary Material; further inquiries can be directed to the corresponding author.
The manuscript presents research on animals that do not require ethical approval for their study.
XW: data curation, formal analysis, funding acquisition, investigation, software, writing–original draft, and writing–review and editing. XH: conceptualization, investigation, project administration, software, and writing–review and editing. XZ: investigation, software, and writing–original draft. NW: data curation, software, and writing–original draft. ZZ: conceptualization, funding acquisition, investigation, and writing–original draft. YL: data curation, software, and writing–original draft. YH: data curation, software, and writing–original draft. JH: writing–review and editing.
The author(s) declare that financial support was received for the research, authorship, and/or publication of this article. This research was supported by the Doctoral Research Fund of Guiyang Healthcare Vocational University (No. K2023-8), the Planning Project of Guiyang City (no. Zhukehe [2023]3-11), the Guizhou Provincial Key Technology R&D Program (QKHZC [2023]-141), the Collaborative Innovation Center of Biology and Information Technology in Karst Plateau Area of Guizhou Province (no. QJJ[2022]010), the Central Guidance Local Science and Technology Development Fund (Qianke Zhongyin [2022] 4035), the Guiyang Science and Technology Plan Project (Zhuke Contract [2022] No. 3–7), and the Tongren City Science and Technology Support Project ([2021] No.24).
The authors declare that the research was conducted in the absence of any commercial or financial relationships that could be construed as a potential conflict of interest.
All claims expressed in this article are solely those of the authors and do not necessarily represent those of their affiliated organizations, or those of the publisher, the editors, and the reviewers. Any product that may be evaluated in this article, or claim that may be made by its manufacturer, is not guaranteed or endorsed by the publisher.
The Supplementary Material for this article can be found online at: https://www.frontiersin.org/articles/10.3389/fenvs.2024.1417949/full#supplementary-material
Aaltonen, H., Palviainen, M., Zhou, X., Köster, E., Berninger, F., Pumpanen, J., et al. (2019). Temperature sensitivity of soil organic matter decomposition after forest fire in Canadian permafrost region. J. Environ. Manag. 241, 637–644. doi:10.1016/j.jenvman.2019.02.130
Berg, B., and Mcclaugherty, C. (2013). Plant litter: decomposition, humus formation, carbon sequestration. Berlin Heidelberg: Springer. doi:10.1007/978-3-642-38821-7
Bieluczyk, W., Asselta, F. O., Navroski, D., Júlia, B. G., Venturini, A. M., Mendes, L. W., et al. (2023). Linking above and belowground carbon sequestration, soil organic matter properties, and soil health in brazilian atlantic forest restoration. J. Environ. Manag. 344, 118573. doi:10.1016/j.jenvman.2023.118573
BjΦrnlund, L., and Christensen, S. (2005). How does litter quality and site heterogeneity interact on decomposer food webs of a semi-natural forest. Soil Biol. Biochem. 37, 203–213. doi:10.1016/j.soilbio.2004.07.030
Bradford, M. A., Jones, T. H., Bardgett, R. D., Black, H. I. J., Boag, B., Bonkowski, M., et al. (2002). Impacts of soil faunal community composition on model grassland ecosystems. Science 298, 615–618. doi:10.1126/science.1075805
Caspersen, J. P., Pacala, S. W., Jenkins, J. C., Hurtt, G. C., and Birdsey, R. A. (2000). Contributions of land-use history to carbon accumulation in U.S. forests. Science 290, 1148–1151. doi:10.1126/science.290.5494.1148
Cheshire, M. V. (1987). Soil organic matter. Soil Sci. 144 (4), 304–305. doi:10.1097/00010694-198710000-00011
Crowther, T. W., Maynard, D. S., Leff, J. W., Oldfield, E. E., Mcculley, R. L., Fierer, N., et al. (2014). Predicting the responsiveness of soil biodiversity to deforestation: a cross-biome study. Glob. change Biol. 20 (9), 2983–2994. doi:10.1111/gcb.12565
Di, X. Y., An, X. J., Dong, H., Tang, H. M., and Xiao, B. H. (2015). The distribution and evolution of soil organic matter in the Karst region, Guizhou Province, Southwestern China. Earth Environ. 43, 697–708. doi:10.14050/j.cnki.1672-9250.2015.06.014
Ding, G., Novak, J. M., Amarasiriwardena, D., Hunt, P. G., and Xing, B. (2002). Soil organic matter characteristics as affected by tillage management. Soil Sci. Soc. Am. J. 66, 421–429. doi:10.2136/sssaj2002.4210
Dong, W. H., Li, X. Q., and Song, Y. (2016). Role of soil fauna on soil organic matter formation. Soils 48, 211–218. doi:10.13758/j.cnki.tr.2016.02.001
Freitas, V., Babos, D. V. D., Guedes, W. N., Silva, F. P., Tozo, M. L. D. L., Martin-Neto, L., et al. (2022). “Assessing soil organic matter quality with laser-induced fluorescence (lifs) and its correlation to soil carbon stock,” in Latin America Optics and Photonics (LAOP) Conference 2022, Technical Digest Series (Optica Publishing Group, 2022), ppaper W3B.5. doi:10.1364/laop.2022.w3b.5
Frouz, J., Lobinske, R., Kalcík, J., and Ali, A. (2008). Effects of the exotic crustacean, Armadillidium vulgare (Isopoda), and other macrofauna on organic matter dynamics in soil microcosms in a hardwood forest in central Florida. Fla. Entomol. 91, 328–331. doi:10.1653/0015-4040(2008)91[328:eoteca]2.0.co;2
Gao, L., Zhang, D. S., Long, H. Y., Chen, X. Y., and Lin, C. H. (2023). Characteristics and influencing factors of soil organic carbon in different land use types in Ningxia. J. lanzhou Univ. Nat. Sci. 59 (6), 749–758. doi:10.13885/j.issn.0455-2059.2023.06.006
Haghighi, F., Gorji, M., and Shorafa, M. (2010). A study of the effects of land use changes on soil physicalproperties and organic matter. Land Degrad. Dev. 26, 496–502. doi:10.1002/ldr.999
Han, H. Y., Yin, X. Q., and Kou, X. C. (2017). Community characteristics of soil fauna in the low-mountain of the Changbai mountains and its respond to the change of environmental factors. Acta Ecol. sin. 37, 2197–2205. doi:10.5846/stxb201511232368
Hobley, E. U., Willgoose, G. R., Frisia, S., and Jacobsen, G. (2014). Stability and storage of soil organic carbon in a heavy-textured karst soil from south-eastern Australia. Soil Res. 52, 476–551. doi:10.1071/SR13296
Huang, X. F., Zhou, Y. C., and Zhang, Z. M. (2018). Carbon sequestration anticipation response to land use change in a mountainous karst basin in China. J. Environ. Manag. 228, 40–46. doi:10.1016/j.jenvman.2018.09.017
Jurgensen, M. F., Harvey, A. E., Graham, R. T., Page-Dumroese, D. S., Tonn, J. R., Larson, M. J., et al. (1997). Impacts of timber harvesting on soil organic matter, nitrogen, productivity and health of inland Northwest forests. For. Sci. 43, 234–251. doi:10.1093/forestscience/43.2.234
Kaiser, K., Guggenberger, G., Haumaier, L., and Zech, W. (2002). The composition of dissolved organic matter in forest soil solutions: changes induced by seasons and passage through the mineral soil. Org. Geochem. 33, 307–318. doi:10.1016/S0146-6380(01)00162-0
Kang, Y. J., and Wu, H. T. (2021). Effects and mechanism of earthworms on soil organic carbon and nitrogen cycling: a review. Soils crops 10 (2), 150–162. doi:10.11689/j.issn.2095-2961.2021.02.004
Keesstra, S., Mol, G., Leeuw, J. D., Okx, J., Molenaar, C., Margot, D. C., et al. (2018). Soil-related sustainable development goals: four concepts to make land degradation neutrality and restoration work. Land 7, 133. doi:10.3390/land7040133
Kisand, V., and Tanmmert, H. (2000). Bacterioplankton strategies for leucine and glucose uptake after a cyanobacterial bloom in an eutrophic shallow lake. Soil Biol. Biochem. 32, 1965–1972. doi:10.1016/S0038-0717(00)00171-1
Li, D. C., Huang, J., Ma, C. B., Xue, Y. D., Gao, J. S., Wang, B. R., et al. (2020a). Soil organic matter content and its relationship with pH and bulk density in agriculture areas of China. J. soil water conservation 34, 252–258. doi:10.13870/j.cnki.stbcxb.2020.06.035
Li, H. W., Wang, S. J., Bai, X. Y., Cao, Y., and Wu, L. H. (2019). Spatiotemporal evolution of carbon sequestration of limestone weathering in China. Sci. China earth Sci. 62, 974–991. doi:10.1007/s11430-018-9324-2
Li, X. D., Jiang, Y. F., Rong, W. T., Qin, G. L., Yuan, B. D., and Qin, W. G. (2020b). The community structure and composition of soil fauna under different crops in Karst area. J. changzhou Inst. Technol. 33 (3), 1–6. Available at: https://czgb.cbpt.cnki.net/WKE2/WebPublication/paperDigest.aspx?paperID=700405b9-fee7-44ad-b0ef-b5932f0dd18b.
Li, Y. F., Fang, Y. Y., Hui, D. F., Tang, C. X., Van Zwieten, L., Zhou, J. S., et al. (2024). Nitrogen deposition-induced stimulation of soil heterotrophic respiration is counteracted by biochar in a subtropical forest. Agric. For. Meteorology 349, 109940. doi:10.1016/j.agrformet.2024.109940
Lin, Z. B., and Zhang, R. D. (2012). Dynamics of soil organic carbon under uncertain climate change and elevated atmospheric CO2. Pedosphere 22, 489–496. doi:10.1016/S1002-0160(12)60033-2
Lu, S. W., Li, X. W., and Zhang, X. G. (2016). Cupressus inefficient forest in hilly area of central Sichuan basin after transformation of afforestation with gap. Mod. Agric. Sci. Technol. 10, 125–129. Available at: https://kns.cnki.net/kcms2/article/abstract?v=9CXCstbk-ttXWEVDbkrkigVYMAx6UpCnlYTiAwQSKuzoQs0s83R-CKD6LLh2giltVRXTolE5bd9_teDYsj_gPE73wJAhJs1SXQ8nQsSE9YOorLbPQUoDgkxtpS16QDcjSFZ9xclhpa0xidqtiZNVzA==&uniplatform=NZKPT&language=CHS.
Mbau, S. K., Karanja, N., and Ayuke, F. (2015). Short-term influence of compost application on maize yield, soil macrofauna diversity and abundance in nutrient deficient soils of Kakamega County, Kenya. Plant Soil 387 (1-2), 379–394. doi:10.1007/s11104-014-2305-4
Mcdonagh, J. F., Thomsen, T. B., and Magid, J. (2001). Soil organic matter decline and compositional change associated with cereal cropping in southern Tanzania. Land Degrad. Dev. 12, 13–26. doi:10.1002/ldr.419
Niu, X., Gao, P., Li, Y. X., and Li, X. (2015). Impact of different afforestation systems on soil organic carbon distribution characteristics of limestone mountains. Pol. J. Environ. Stud. 24, 2543–2552. doi:10.15244/pjoes/59235
Poffenbarger, H., Olk, D. C., Cambardella, C., Kersey, J., Castellano, M. J., Mallarino, A., et al. (2020). Whole-profile soil organic matter content, composition, and stability under cropping systems that differ in belowground inputs. Agric. Ecosyst. Environ. 291, 106810. doi:10.1016/j.agee.2019.106810
Pouyat, T. R., Grofman, P., Yesilonis, I., and Hernandez, L. (2002). Soil carbon pools and fluxes in urban ecosystems. Environ. Pollut. 116, S107–S118. doi:10.1016/S0269-7491(01)00263-9
Qaswar, M., Jing, H., Ahmed, W., Li, D. C., Liu, S. J., Ali, S., et al. (2019). Long-term green manure rotations improve soil biochemical properties, yield sustainability and nutrient balances in acidic paddy soil under a rice-based cropping system. Agronomy 9, 780. doi:10.3390/agronomy9120780
Schime, D., Melillo, J., Tian, H. Q., McGuire, A. D., Kicklighter, D., Kittel, T., et al. (2000). Contribution of increasing CO2 and climate to carbon storage by ecosystems in the United States. Science 287, 2004–2006. doi:10.1126/science.287.5460.2004
Scullion, M. J. A., and Malik, A. (2000). Earthworm activity affecting organic matter, aggregation and microbial activity in soils restored after opencast mining for coal. Soil Biol. Biochem. 32, 119–126. doi:10.1016/S0038-0717(99)00142-X
Shan, J., Liu, J., Wang, Y. F., Yan, X. Y., Guo, H. Y., Li, X. Z., et al. (2013). Digestion and residue stabilization of bacterial and fungal cells, protein, peptidoglycan, and chitin by the geophagous earthworm Metaphire guillelmi. Soil Biol. Biochem. 64, 9–17. doi:10.1016/j.soilbio.2013.03.009
Shang, M. J., Zhou, Z. F., Wang, X. Y., Huang, D. H., and Zhang, S. S. (2018). Evaluation of soil environmental quality in karst mountain area based on support vector machine: a case study of a tea plantation in northern Guizhou. Carsologica Sin. 37, 575–583. doi:10.11932/karst20180411
Sharaya, L. S., and Van, P. S. (2022). Regular changes in soil moisture content in coniferous forests of the udyly state nature reserve, lower amur river region. Contemp. problems Ecol. 15 (7), 863–871. doi:10.1134/S1995425522070198
Shen, Q. X., Ran, J. C., Rong, L., Lan, H. B., Lu, C. W., and Guo, Y. L. (2009). Spatial variability of soil organic matter in maolan Karst forest. World For. Res. 22, 110–114. Available at: https://kns.cnki.net/kcms2/article/abstract?v=9CXCstbk-tuU31pCL7me3Cv9-eEv3ZjwbrzCwh563whb9n4U5wAQLoMt2bCVXXHj3JhY7EjTkIpq58Pu89J9G_6kq1PclChaOjO08J_7xaGmF7m9lMx9AKJTnts2WT1gOCUy3vqVeujm0jft_KrjRg==&uniplatform=NZKPT&language=CHS.
Six, J., Callewaert, P., Lenders, S., Gryze, S. D., Morris, S. J., Gregorich, E. G., et al. (2007). Measuring and understanding carbon storage in afforested soils by physical fractionation. Soil Sci. Soc. Am. J. 66, 1981–1987. doi:10.2136/sssaj2002.1981
Smith, P., Haberl, H., Popp, A., Erb, K., Lauk, C., Harper, R., et al. (2013). How much land-based green-house gas mitigation can be achieved without compromising food security and environmental goals. Glob. change Biol. 19, 2285–2302. doi:10.1111/gcb.12160
Street, L. E., Garnett, M. H., Subke, J. A., Baxter, R., and Wookey, P. A. (2020). Plant carbon allocation drives turnover of old soil organic matter in permafrost tundra soils. Glob. change Biol. 26, 4559–4571. doi:10.1111/gcb.15134
Tu, T. T. N., Vidal, A., Katell, Q., Mercedes, M. M., and Derenne, S. (2020). Influence of earthworms on apolar lipid features in soils after 1 year of incubation. Biogeochemistry 147 (3), 243–258. doi:10.1007/s10533-020-00639-w
Visser, S., Keesstra, S., Maas, G., Cleen, M. C., and Molenaar, C. (2019). Soil as a basis to create enabling conditions for transitions towards sustainable land management as a key to achieve the SDGs by 2030. Sustainability 11, 6792. doi:10.3390/su11236792
Wang, Q. K., Wang, S. L., Feng, Z. W., and Huang, Y. (2005). Active soil organic matter and its relationship with soil quality. Acta Ecol. sin. 25, 513–519. Available at: https://www.researchgate.net/publication/285838318_Active_soil_organic_matter_and_its_relationship_with_soil_quality.
Wang, S. J., Ruan, H. H., and Wang, B. (2009). Effects of soil microarthropods on plant litter decomposition across an elevation gradient in the Wuyi Mountains. Soil Biol. Biochem. 41 (5), 891–897. doi:10.1016/j.soilbio.2008.12.016
Wang, X. F., Huang, X. F., Hu, J. W., and Zhang, Z. M. (2020). The spatial distribution characteristics of soil organic carbon and its effects on topsoil under different karst landforms. Int. J. Environ. Res. Public Health 17, 2889. doi:10.3390/ijerph17082889
Wang, X. F., Huang, X. F., Xiong, K. N., Hu, J. W., Zhang, Z. M., and Zhang, J. C. (2022). Mechanism and evolution of soil organic carbon coupling with rocky desertification in South China Karst. Forests 13, 28. doi:10.3390/f13010028
Wang, Y. G., Li, Y., Ye, X. H., Chu, Y., and Wang, X. P. (2010). Profile storage of organic/inorganic carbon in soil: from forest to desert. Sci. total Environ. 408, 1925–1931. doi:10.1016/j.scitotenv.2010.01.015
Wang, Z. Q., Lin, Y. H., Cai, L., Wu, G. L., Zheng, K., Zhrng, K., et al. (2023). Substantial uncertainties in global soil organic carbon simulated by multiple terrestrial carbon cycle models. Land Degrad. Dev. 34, 3225–3249. doi:10.1002/ldr.4679
Weissert, L. F., Salmond, J. A., and Schwendenmann, L. (2016). Variability of soil organic carbon stocks and soil CO2 efflux across urban land use and soil cover types. Geoderma 271, 80–90. doi:10.1016/j.geoderma.2016.02.014
West, T. O., and Post, W. M. (2002). Soil Organic carbon sequestration rates by tillage and crop rotation: a global data analysis. Soil Sci. Soc. Am. J. 66, 1930–1946. doi:10.2136/SSSAJ2002.1930
Wright, M. S., and Covich, A. P. (2005). Relative importance of bacteria and fungi in a tropical headwater stream: leaf decomposition and invertebrate feeding preference. Microb. Ecol. 49, 536–546. doi:10.1007/s00248-004-0052-4
Yan, J. H., Zhou, C. Y., Wen, A. B., Liu, X. Z., Chu, G. W., and Li, K. (2011). Relationship between soil organic carbon and soil bulk density in the rocky desertification process of Karst ecosystem in Guizhou. J. Trop. subtropical Bot. 19, 273–278. doi:10.3969/j.issn.1005-3395.2011.03.013
Yang, D. W., Kanae, S., Oki, T., Koike, T., and Musiake, K. (2010). Global potential soil erosion with reference to land use and climate changes. Hydrol. Process. 17, 2913–2928. doi:10.1002/hyp.1441
Ye, Y., Jiang, Y. X., and Chen, H. (2019). Responses of functional groups of large soil fauna to niche environmental factors. Jiangsu Agric. Sci. 47, 253–257. doi:10.15889/j.issn.1002-1302.2019.03.060
Zeng, W. H., Shi, W., Tang, Y. S., Zhen, W. Y., and Cao, K. F. (2018). Comparison of the species diversity and phylogenetic structure of tree communities in karst and non-karst mountains in Guangxi. Acta Ecol. sin. 38 (24), 8708–8716. doi:10.5846/stxb201808021643
Zhang, J., Wei, R., and Guo, Q. (2023a). Impacts of mining activities on the spatial distribution and source apportionment of soil organic matter in a karst farmland. Sci. total Environ. 882, 163627. doi:10.1016/j.scitotenv.2023.163627
Zhang, J. E., Qin, Z., and Li, Q. F. (2011a). Clustering and ordination of soil animal community under different land-use types. Chin. J. Ecol. 30, 2849–2856. doi:10.1097/RLU.0b013e3181f49ac7
Zhang, L., Wu, W. L., Wei, Y. P., and Hu, K. (2015). Effects of straw return and regional factors on spatio-temporal variability of soil organic matter in a high-yielding area of northern China. Soil tillage Res. 145, 78–86. doi:10.1016/j.still.2014.08.003
Zhang, T., Wu, X. Q., Dai, E. F., and Zhao, D. S. (2016). SOC storage and potential of grasslands from 2000 to 2012 in central and eastern Inner Mongolia, China. J. arid land 8, 364–374. doi:10.1007/s40333-016-0041-8
Zhang, T. Y., Hu, Y. M., Ren, X. N., Chen, F. X., and Feng, X. K. (2020a). Study on the spatiotemporial variation of soil organic matter induced by abandoned tillage behavior. J. Agric. Resour. Environ. 37, 805–817. doi:10.13254/j.jare.2020.0480
Zhang, W., Wang, K. L., Chen, H., He, X., and Zhang, J. (2012b). Ancillary information improves kriging on soil organic carbon data for a typical karst peak cluster depression landscape. J. Sci. food Agric. 92, 1094–1102. doi:10.1002/jsfa.5593
Zhang, W. J., Xu, M. G., Wang, X. J., Huang, Q. H., Nie, J., Li, Z., et al. (2012a). Effects of organic amendments on soil carbon sequestration in paddy fields of subtropical China. J. soil sediments 12, 457–470. doi:10.1007/s11368-011-0467-8
Zhang, X., Li, D., Liu, Y., Li, J., and Hu, H. (2023b). Soil organic matter contents modulate the effects of bacterial diversity on the carbon cycling processes. J. Soils Sediments 23, 911–922. doi:10.1007/s11368-022-03336-3
Zhang, X. B., Bai, X. Y., and He, X. B. (2011b). Soil creeping in the weathering crust of carbonate rocks and underground soil losses in the karst mountain areas of Southwest China. Carbonate evaporites 26, 149–153. doi:10.1007/s13146-011-0043-8
Zhang, X. H., Zhang, Z. S., and Wu, H. T. (2020b). Effects of ant disturbance on soil organic carbon cycle: a review. Chin. J. Appl. Ecol. 31, 4301–4311. doi:10.13287/j.1001-9332.202012.033
Zhang, Z. M., Zhou, Y. C., Wang, S. J., and Huang, X. F. (2019). The soil organic carbon stock and its influencing factors in a mountainous karst basin in P. R. China. Carbonates Evaporites 34, 1031–1043. doi:10.1007/s13146-018-0432-3
Zhou, J. S., Zhang, S. B., Hui, D. F., Vancov, T., Fang, Y. Y., Tang, C. X., et al. (2024). Pyrogenic organic matter decreases while fresh organic matter increases soil heterotrophic respiration through modifying microbial activity in a subtropical forest. Biol. Fertil. Soils 60, 509–524. doi:10.1007/s00374-024-01815-y
Keywords: soil organic matter, spatial heterogeneity, soil animals, land use, effect mechanism, Karst basin
Citation: Wang X, Huang X, Zhu X, Wu N, Zhang Z, Liu Y, Huang Y and Hu J (2024) Spatial distribution characteristics of soil organic matter in different land uses and its coupling with soil animals in the plateau basin in the South China Karst basin. Front. Environ. Sci. 12:1417949. doi: 10.3389/fenvs.2024.1417949
Received: 15 April 2024; Accepted: 24 June 2024;
Published: 01 August 2024.
Edited by:
Peng Shi, Xi’an University of Technology, ChinaReviewed by:
Hao Yang, Guangxi Normal University, ChinaCopyright © 2024 Wang, Huang, Zhu, Wu, Zhang, Liu, Huang and Hu. This is an open-access article distributed under the terms of the Creative Commons Attribution License (CC BY). The use, distribution or reproduction in other forums is permitted, provided the original author(s) and the copyright owner(s) are credited and that the original publication in this journal is cited, in accordance with accepted academic practice. No use, distribution or reproduction is permitted which does not comply with these terms.
*Correspondence: Xianfei Huang, aHhmc3dqc0Bnem51LmVkdS5jbg==
Disclaimer: All claims expressed in this article are solely those of the authors and do not necessarily represent those of their affiliated organizations, or those of the publisher, the editors and the reviewers. Any product that may be evaluated in this article or claim that may be made by its manufacturer is not guaranteed or endorsed by the publisher.
Research integrity at Frontiers
Learn more about the work of our research integrity team to safeguard the quality of each article we publish.