 Mingxuan Liu
94% of researchers rate our articles as excellent or good
Learn more about the work of our research integrity team to safeguard the quality of each article we publish.
Find out more
ORIGINAL RESEARCH article
Front. Environ. Sci., 04 July 2024
Sec. Environmental Economics and Management
Volume 12 - 2024 | https://doi.org/10.3389/fenvs.2024.1417924
This paper studies the impact of digital economy development on carbon emissions, which is a hot topic in the field of environmental economics. This topic is within the scope of the Frontiers in Environmental Science and is particularly in line with the theme of Environmental Economics and Management section in the journal. Firstly, this paper constructs the Digital Economy Development Index and its variable indicators to measure the development of the digital economy. Secondly, this paper uses urban panel data to reveal the impact of digital economy development on carbon emissions, and further adopts IV method to deal with endogeneity issues. Thirdly, this paper performs the heterogeneity analyses depending on the characteristics of the city. The results can provide a basis for formulating differentiated policies. Fourthly, this paper further explores the mechanism by which the digital economy affects carbon peaking. The results show that the digital economy may influence carbon peaking through upgrading of the industrial structure, technical innovation, and energy consumption.
In recent years, although the extensive use of carbon-based energy has brought great impetus to the economic growth of China, excessive carbon emissions will increase greenhouse gases in the atmosphere and lead to an increase in surface temperature. The report of the International Energy Agency (IEA) clearly points out that global greenhouse gas emissions will increase by 57% by 2030, which may lead to a 3°C1 increase in the earth’s surface temperature. The rising temperature will further increase the probability of droughts, floods, storms and other disasters, which will adversely affect agricultural production and people’s health and safety to some extent. The Chinese government attaches great importance to the environmental problems caused by carbon emissions, and the report of the 20th National Congress of the Communist Party of China put forth a “dual carbon” target calling for “actively and steadily bringing about a peak in carbon emissions and achieving carbon neutrality”. The Chinese government has implemented remedies targeted at improving resource conservation and environmental protection, as well as encouraging low-emissions, environmentally responsible production and lifestyles, and hastened the development of low-carbon cycles. Meanwhile, the government highlights the importance of the digital economy, proposing “accelerating digital development and building a digital China” in the Outline of the 14th Five-Year Plan. Therefore, exploring the impact of China’s digital economy on carbon emissions levels is of certain reference value for countries around the world to explore the relationship between the digital economy and carbon emissions, as China is a major country in the development of digital economy. The rapid development of the digital economy not only brings new impetus to economic growth, but also promotes the adjustment of industrial structure (Kovacikova et al., 2021), optimize the structure and efficiency of traditional production factors, and promote green development (Xu et al., 2019). Studying the impact of China’s digital economy development on carbon emissions is of reference value for countries around the world to play the role of digital economy and achieve the goal of “carbon peaking”.
The main contributions of this paper are as follows. Firstly, this paper constructs the Digital Economy Development Index and its variable indicators to measure the development of the digital economy. Secondly, this paper uses urban panel data to reveal the impact of digital economy development on carbon emissions. Thirdly, this paper further explores the mechanism by which the digital economy affects carbon peaking.
The subsequent parts of this article are arranged as follows: Section 2 provides a literature review, Section 3 proposes the research design, Section 4 conducts the empirical analysis and its results, and Section 5 further verifies the two hypotheses proposed in the paper. Finally, Section 6 gives the conclusion and policy recommendations.
As the environmental issues caused by carbon emissions have gotten worse, a growing body of studies has looked into methods to enhance the environment by lowering these emissions. The research on the factors influencing carbon emissions has mostly concentrated on economic, technological, and institutional aspects. From 1996 to 2018, Shao et al. (2022) calculated and analyzed China’s provincial carbon emission performance data. They analyzed the relationships between economic structures, green technology, and carbon emissions, concluding that carbon emission performance has a spatial spillover effect on surrounding provinces and that green technologies and industrial structure adjustment are conducive to improving carbon emission performance. Zhu et al. (2020) studied the impact of economic growth and energy structural transformation on carbon emissions employing a simultaneous equation model with panel data from 67 economies globally from 1990 to 2018. They argue that there is a certain threshold for economic growth that must be exceeded before we can further boost energy structural transformation and minimise carbon emissions. Environmental restrictions, according to Guo and Sun (2020), may improve total factor carbon productivity by encouraging technological innovation.
The extraordinary advancement of digital technology has given rise to innovative approaches and concepts for China to achieve “carbon peaking and carbon neutralisation”. A huge number of experts are currently focusing on the influence of the digital economy on carbon emissions. Wang and Li (2022) utilize an entropy approach to quantify and calculate the level of China’s digital economy from 2011 to 2019. They reveal positive U-shaped correlations between the digital economy and energy consumption, as well as between the digital economy and carbon emissions, using a twofold fixed effect model. Upon panel data from 1,561 Chinese counties from 2007 to 2017, Yang et al. (2023) find that the digital economy has a notable influence on emissions reduction and that technical progress, energy utilization efficiency, and technical diversity are essential mechanisms. Wang (2023) initially measures and provides a digital economy development index using an entropy weight TOPSIS method, then matches the generated data with panel data from 2011 to 2019 for 269 Chinese cities. By constructing a bidirectional fixed effect model, he demonstrates an inverted U-shaped correlation between the digital economy and carbon emissions, and that energy consumption, industrial structure transformation, and green technical innovation are significant elements. Wang and Dong (2023) assess the state of the digital economy in each of China’s provinces from 2014 to 2020. Building an intermediary effect model, they discover that the digital economy has a carbon-containment impact and that energy consumption intensity, clean energy structure transformation, and industrial structure upgrading are influential mechanisms. Yang and Zhao (2022) indicate that the digital economy can minimise regional carbon emissions by improving energy efficiency and optimizing energy structure. By employing a two-way fixed effect model, Fei et al. (2022) corroborate that an inverted U-shaped relationship exists between the digital economy and carbon emissions. Using panel data from 280 cities, Chen et al. (2024) explored the indirect and substitution effects of digital economy on carbon emissions from the perspectives of wealth, population and technology.
When the literature is reviewed, it becomes clear that researchers have reached different results. They have revealed either a substantial negative correlation, or an inverted U-shaped relationship between the digital economy and carbon emissions, among other things. Furthermore, the preceding literature mainly analyzes the potential mechanisms from the perspectives of energy consumption efficiency, energy consumption structure, industrial structure, technological advancement, and laws pertaining to the environment. This serves as a reference for the mechanism analysis in our investigation.
Due to a lack of leading theoretical and empirical studies, the influence of the digital economy on carbon emissions is a point of controversy. The link between digital economy development and carbon emissions is complicated, and digital economy development has both beneficial and negative environmental implications. However, there is a growing corpus of studies devoted to evaluating the carbon footprint of the digital economy. Theoretical theories and research hypotheses have been presented to investigate the implications of the digital economy on carbon emissions reduction.
Scholars have been exploring the impacts of digital economy growing on carbon emissions in recent years. At the initial stages of the digital economy development, the industrial structure has not been improved, and the energy structure has not been optimized and adjusted, while society’s energy is mostly generated from fossil fuels. The application of digital technology, however, will have a substantial impact on social production and lifestyle. The conventional energy structure has not altered at this first stage, but the scale of production is inevitably enlarged due to the higher productivity brought about by the development of digital technology. Meanwhile, the increased manufacturing may raise the application of traditional energy sources including fossil fuels. According to Lange et al. (2020), although the initial development of the digital economy improves productivity, the expansion of production also increases energy demand, and carbon emissions will therefore also rise. With the further spread of digital technology, however, a tendency towards green technology and low carbon emissions occurs (Zhu and Li, 2023). The digital information exchange platform could enhance the efficiency with which supply and demand are matched, resulting in cost savings in manufacturing materials and energy consumption, as well as contributing to low-carbon economic development (Huang et al., 2022). The advancement of the digital economy has the potential to improve people’s awareness of green consumption, promote the green upgrading of the industrial structure, and expedite the low-carbon transformation of industry, lowering carbon emissions. According to the above theoretical analysis, this investigation puts forward proposition 1.
H1. Carbon emissions will rise throughout the early stages of the digital economy. Once the digital economy has matured, carbon emissions will decrease as it develops further. Therefore, carbon emissions and the growth of the digital economy have an inverted U-shaped connection, that is, a peak in carbon emissions will be observed as the digital economy progresses.
The processes of the digital economy that influence “carbon peaking” are complicated, and more research is needed to completely comprehend their impact. A review of the relevant data provided by the Public Environmental Center (IPE), carbon emissions in China increased continuously from 10.781 billion tons in 2013 to 12.466 billion tons in 2021,2 indicating a continuous growth trend. Shan et al. (2022) investigated peak carbon emissions and the driving factors in 289 Chinese cities from 2001 to 2019. They point out that while some cities in China have achieved the peak of carbon emissions,3 the overall carbon emissions in China are still increasing and have not reached the peak point. The progress of the digital economy, however, will have an impact on traditional industries causing substantial pollution and high emissions, encouraging efficient and environmentally friendly emerging industries to replace less forward-looking traditional industries. This will drive backward conventional industries to leave, stimulate industrial structure transformation, and lead to the integration of various industries into new formats, lowering carbon emissions (Deng et al., 2014). The application of digital technology facilitates the information interchange inside industrial organizations, as well as the transformation of the industrial structure, better efficiency and cost savings, and green enterprise growth (Guo and Wang, 2022). Digitization has the potential to improve the efficiency with which fossil fuels are employed in production, reduce the proportion of traditional energy use, and bring about lower carbon emissions. The widespread adoption of digital technology has expanded the scale of information infrastructure, and the resulting demand for electric energy will inevitably increase. At the same time, a considerable part of electrical energy is now generated by the burning of fossil fuels. The digital economy also have an impact on carbon emissions upon the consumption of electrical energy and the burning of fossil fuels. Figure 1 presents the impact pathways of the digital economy on carbon emissions.
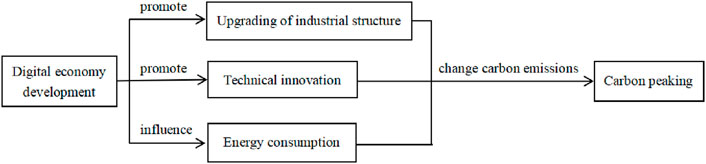
Figure 1. The impact pathways of the digital economy on “carbon peaking”.
In combination with Proposition 1, with the development of the digital economy, carbon emissions show an inverted U-shaped trend, but the volume of carbon emissions in China is still increasing and has not reached its peak. According to the preceding theoretical analysis, this study puts forward Proposition 2.
H2. China’s development of the digital economy can impact the “carbon peak” through the upgrading the industrial structure, technological innovation, and energy consumption.
According to Proposition one proposed in Section 3, as the digital economy grows, the scale of carbon emissions will display an inverted U-shaped trajectory. To verify Proposition 1, we reference Wang and Hu (2016), Liu et al. (2021), Shao et al. (2019), Zhu and Li (2019), and Yu and Zhang (2016), prior to formulating an econometric model as shown in Formula Eq. 1.
The logarithm of the scale of carbon emissions, which is primarily assessed by the total amount of carbon dioxide emitted in each city, is the dependent variable. The logarithm of the digital economy development index is the independent variable, and
Following that, we will discuss measuring the degree of the expansion in the digital economy and calculating relevant variables, including the construction of a measurement framework and the selection of measurement methods. A number of international economic organisations have investigated ways to quantify the digital economy. According to the Organization for Economic Cooperation and Development (OECD) (2014), a framework for assessing the size of the digital economy has been constructed. Intelligent facilities, social contribution, energy innovation, and the contribution of information and communications technologies on economic growth and employment were chosen as major metrics. And a total of 38 secondary indices such as broadband penetration rate were selected from the primary indices. The European Union (EU) (2014) selected five primary indices including the amount of Internet access and the degree of Internet application, along with the application level of digital technology. In addition, the EU also selected 12 secondary indices such as the amounts of fixed broadband, mobile broadband, and electronic commerce, as well as 31 tertiary indices from the above primary indices in order to construct a framework for measuring the Digital Economy and Social Index (DESI). The World Economic Forum (WEF) (2016) chose four primary indices related to the business environment, degree of preparation, application effect, and socioeconomic impact, along with 11 secondary and 68 tertiary indices related to infrastructure, business use, etc., so as to calculate the information preparation index. The International Telecommunications Union of the United Nations (ITU) (2017) selected three primary indices, including information and communications technology access, usage and skills, and 11 secondary indices, including the fixed telephone coverage rate, household computer penetration rate, junior high school enrollment rate, and the like in order to construct an information and communications technology development index (IDI). In China, several research institutions are involved in measuring the digital economy. The Tencent Research Institute (2018) selected four first-level indices, notably basic indices, industrial indices, innovation and entrepreneurship indices, along with intelligent livelihood indices. In addition, it also selected 14 second-level indices such as WeChat and QQ, and 135 third-level indices, with the goal of establishing a measurement framework for “Internet +” digital economy indices. Caixin Insight (2020) constructed a measurement framework for China’s digital economy index based on four primary indices, namely, the industrial index, the convergence index, the spillover index, and infrastructure, as well as 14 secondary indices and 137 tertiary indices related to big data industries. When calculating the digital economy index, the China Academy of Information and Communications Technology (2020) adopted three primary indices including information and communications industry, integrated industry, and traditional industry, as well as 23 secondary indices such as Internet investment. The China Center for Information Industry Development (2020) selected five primary indices, such as the basic index and the convergence index of the digital economy, and 41 secondary indices, such as the Internet penetration rate and online shopping. Tian et al. (2024) selected indicators from three perspectives, namely, access equipment, digital economy and production, and digital economy and life when calculating the level of digital economy in rural households. Yang (2024) measured the development level of digital economy by selecting indicators such as Internet penetration rate, number of Internet employees, number of Internet users, and financial inclusive development. Huang and Yao (2024) studied the measurement methods of innovation-oriented digital economy and efficiency-oriented digital economy, pointing out that the innovation-oriented digital economy is measured from the perspective of digital basic industry and digital service industry, while the efficiency-oriented digital economy is measured from the perspective of ICT technology.
In terms of measurement methods for the digital economy, OECD and Caixin Insight both used the contrast method in their calculations.4 The American Agency for Economic Analysis proposed a “three-step method”. The first step was to define the scope of the digital economy, and the second was to determine the related commodities and services. The third was to identify the commodity and service sectors related to the digital economy, and to measure the output of related economic activities, subsidies, and so on. When the World Economic Forum measures the information preparation index and the Tencent Research Institute measures the “Internet +” digital economy index, the indicators are first standardized and the index empowerment method is used for further calculation. The China Academy of Information and Communications Technology calculated its digital economy index using a value-added accounting model method. The China Center for Information Industry Development conducted dimensionless processing of data indices, and then used a scoring method and weighted average method (entropy method) to measure the digital economy development index.
The methods used by the above-mentioned economic organizations and research institutions to measure the digital economy provide ideas for our paper. Measuring the digital economy development index by the entropy method is highly operable. This method can handle multiple indicators and uncertain information, and can objectively calculate the weight of indicators to avoid the interference of subjective factors, thus ensuring the objectivity and accuracy of evaluation results. Therefore, we construct a digital economy development index and use the entropy method to calculate it, referring to Zhang et al. (2003), Yan and Sun (2015), Ma et al. (2015), Zhao and Yu (2019), and Liu et al. (2021). The processing of the index involves seven steps:
First, we select the index. Assume that there are h years, m provinces, and n evaluation indicators, and that
In the same way, the existing negative indices are then processed, as shown in formula Eq. 3:
Where i = 1, 2, 3, …, m indicates the total number of evaluation objects. j = 1, 2, 3, …, n indicates the total number of evaluation indicators.
The third step is to normalize each index, as shown in formula Eq. 4:
Fourth, we calculate the entropy of each index, where the normalized index is first processed by taking the logarithm, and the entropy of each index is then calculated using formula Eq. 5:
where the k-value is calculated by:
Fifth, we calculate the variation coefficient of the entropy values of all indices, as shown in formula Eq. 6:
Sixth, we calculate the weight of each index using formula Eq. 7:
Finally, we use the formula Eq. 8 to further calculate the digital economy index:
Referring to the above calculation method and the ideas of the China Center for Information Industry Development in constructing the China digital economy index, we select four indices: basic indices, industry indices, integration indices, and penetration indices. Table 1 lists both primary and secondary indices covered by the digital economy index.
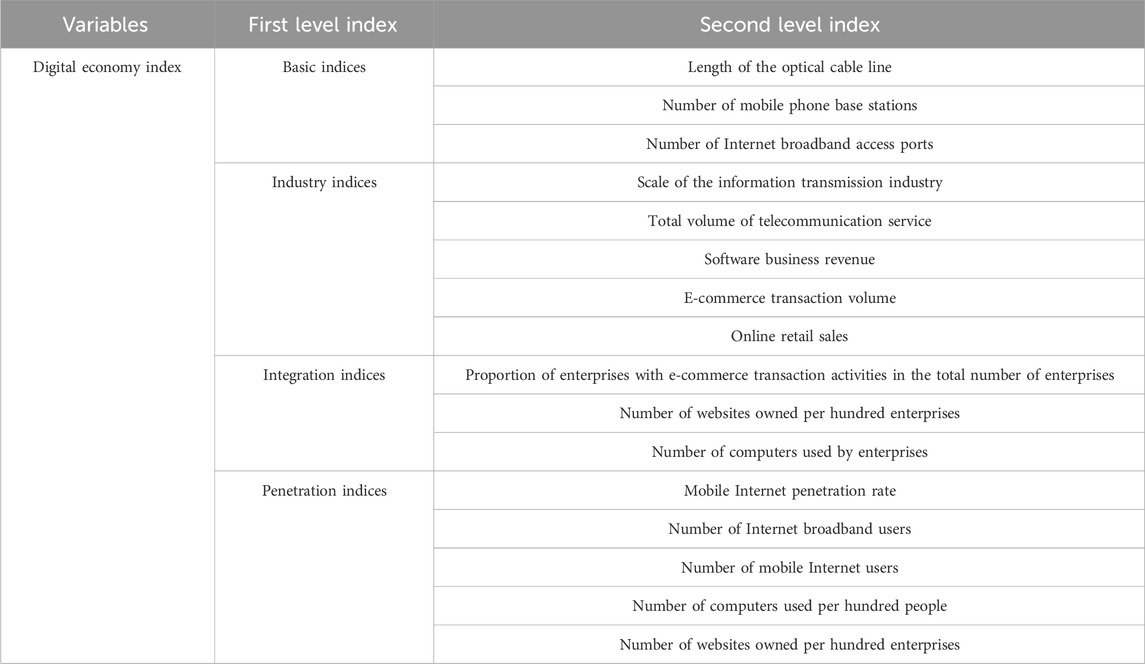
Table 1. Description of the digital economy index.
For the measurement and calculation of the principal components of the digital economy, we mainly refer to Zhao et al. (2020), Guo and Sun (2020), Yang and Liu (2018), Bai and Zhang (2021), Xu et al. (2018), Xu and Zhang (2020), Liu et al. (2020), and so on. Table 2 shows the composition and weight of each index of the principal components of the digital economy.
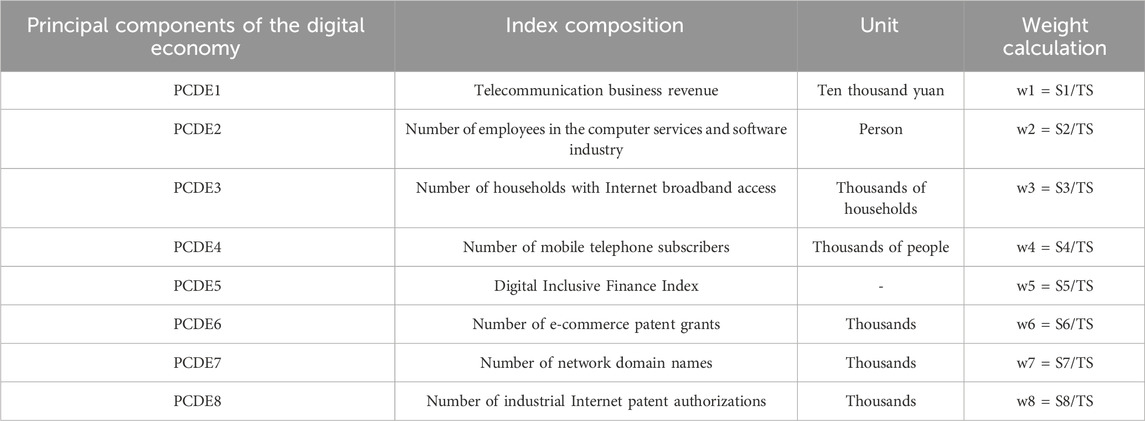
Table 2. Index composition and weight calculation of the principal components of the digital economy.
Referring to Yang (2006) and Gao and Wang (2011), this paper uses the coefficient-of-variation method to calculate the principal components of the digital economy. According to Table 2, the principal components of the digital economy are synthesized by telecommunication business revenue, the number of employees in the computer services and software industry, the number of households with Internet broadband access, the number of mobile phone subscribers, and the Digital Inclusive Finance Index, etc. Eq. 9 shows the specific calculation formula:
The variation coefficient
where
The sum of the variation coefficient TS is calculated as shown in Eq. 11:
The weight is calculated as Eq. 12:
On the basis of formula Eq. 12, we can obtain the data for the principal components of the digital economy.
Based on the above methodology, the panel data of digital economy development index and digital economy principal components of 204 cities in China from 2013 to 2021 can be calculated. This paper analyzes the development characteristics of the calculated digital economy development index and digital economy principal components, and finds that the level of digital economy development in Chinese cities is characterized as follows:
Firstly, the scale of China’s digital economy shows a ladder-like distribution. In this paper, the data of digital economy development index and digital economy principal components are sorted from high to low respectively, and divided into four parts using the quartile method. By observing the data, we can find that the development of digital economy in China presents a ladder-like distribution. The specific features are as follows: Cities in the first tier of digital economy development level are mainly concentrated in the eastern region, including Guangdong, Jiangsu, Shandong and Zhejiang. This is because these regions have developed economies and are leaders in new-generation information technology, so their digital economy development level is significantly higher than that of other regions. Cities in the second tier of digital economy development level are concentrated in the eastern and central regions, including Hubei, Fujian, Henan, Sichuan, Hebei, Hunan and Anhui. The information and communication industries in these regions are large in scale and have greater potential for development. Cities in the third tier of digital economy development are scattered in the central and northeastern regions, including Shaanxi, Jilin, Liaoning, Guangxi, Heilongjiang, Guizhou and Shanxi. The digital economy in these regions is growing at a relatively slow pace, but it is also progressing gradually. Cities in the fourth tier of digital economy development are mainly concentrated in the northwest region, including Gansu and Ningxia. The development of digital economy in these regions is relatively backward, but there is a large space for development.
Secondly, by calculating the difference between the digital economy development index of each city in 2013 and 2021, we can get the digital economy development speed of each city in China in these 9 years. Through comparative analysis, it is found that the digital economy of cities in the eastern and central regions develops at a slower pace, while the digital economy of cities in the northeastern and western regions develops at a faster pace.
Finally, the development of digital economy is characterized by regional agglomeration and linkage development. That is to say, from the perspective of spatial distribution, the development of digital economy in cities with similar scale and close distance appears agglomeration characteristics. The development of digital economy in two or more cities with large differences in city sizes but close to each other has the characteristics of linkage, that is, the digital economy development of big cities drives the digital economy development of small cities.
The influence of the digital economy on carbon emissions is investigated in this research. We mainly utilized panel data from 204 Chinese cities from 2013 to 2021, which come from the Institute of Public and Environmental Affairs (IPE), and is primarily assessed by the digital economy development index and the principal component of the digital economy, with the data of its sub-variables mostly derived from the China Economic Network database and the Wind database. Other control variables include gross domestic product (GDP), government budget expenditure (GBE), population size (PS), urbanization rate (UR), upgrading of industrial structure (UIS, measured by the proportion of the output value of the tertiary industry), financial development level (FDL), urban greening area (UGA), urban construction scale (RCL), urban public transport (UPT, measured by the number of buses), resident consumption (RC), production electricity consumption (PEC), technological innovation input (TII), the output value of enterprises above designated size (EMVS), and fossil fuel consumption (FFC). The data comes mostly from the China Economic Network database, the Wind database, and the Statistical Yearbook of each city. Table 3 provides a detailed explanation of the above variables.
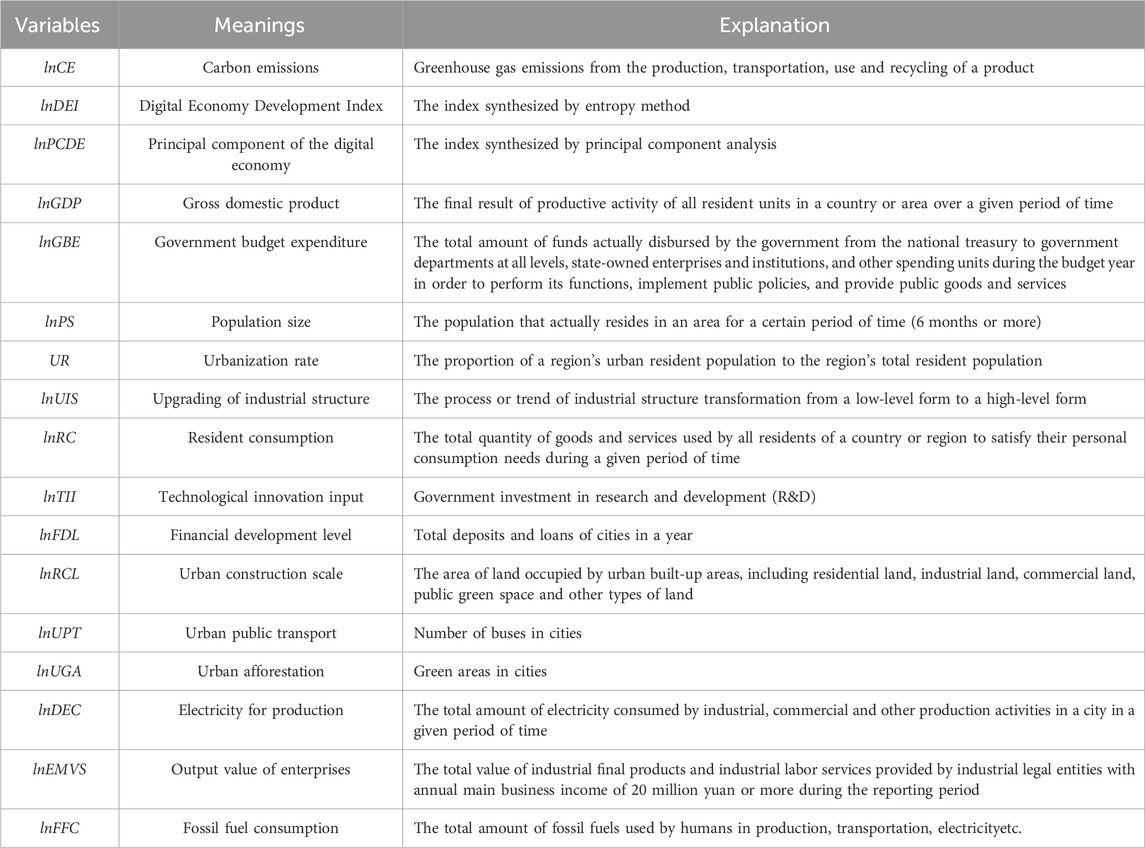
Table 3. Detailed explanations of the main variables.
We utilise stata16.0 software to carry out descriptive statistical analysis on 1,836 sample data from 204 cities for the period from 2013 to 2021. The results are shown in Table 4. It can be seen that there are no missing values or outliers, indicating that this is a set of balanced panel data.
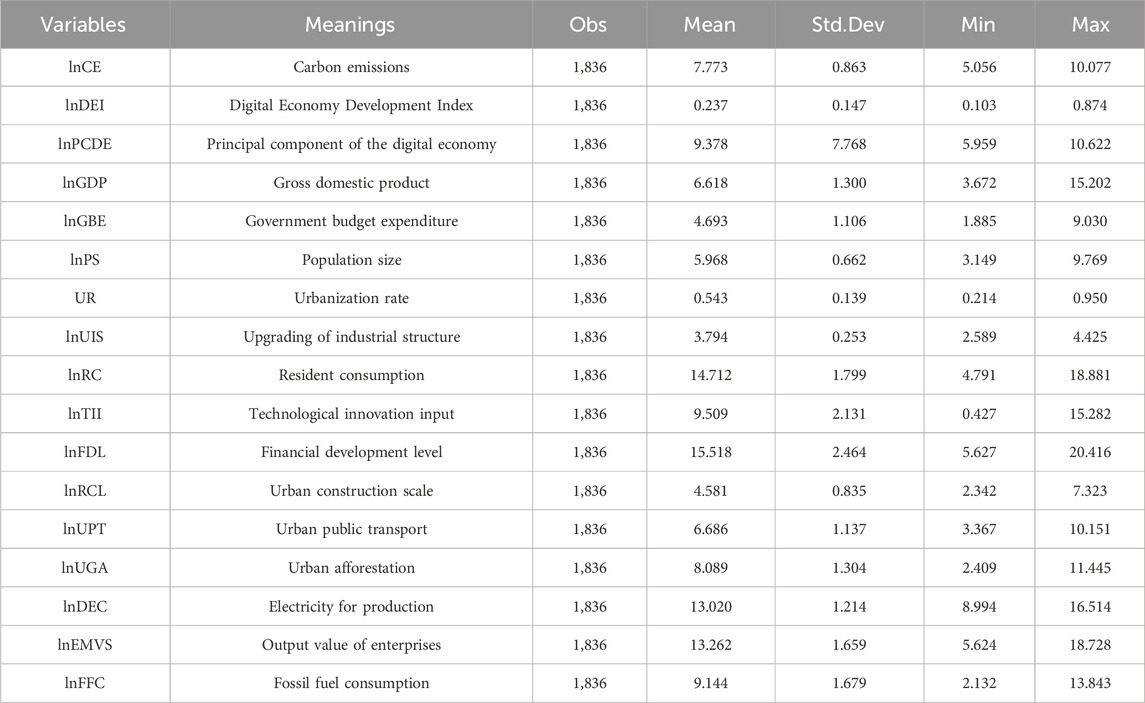
Table 4. Descriptive statistics for the main variables.
The digital economy development index and the principal component of the digital economy in Table 4 are the core indicators obtained through calculation. After taking the logarithm, the minimum value of the digital economy development index is 0.103, and the maximum value is 0.874, which suggests a wide range of extremes in the level of digital economy development across cities. Its standard deviation is 0.147, indicating that the development level of the digital economy is generally concentrated. After taking the logarithm, the minimum value of the principal component of digital economy is 5.959, and the maximum value is 10.622, while the mean value is 9.378 and the standard deviation is 7.768, indicating that the data are relatively concentrated.
The baseline regression results are shown in Table 5. Column (1) employs a random effects model, while Column (2) relies on a fixed effects model. The findings reveal a substantial positive correlation between the first-order coefficient of the digital economy and carbon emissions, as well as a significant negative correlation between the quadratic coefficient of the digital economy and carbon emissions. We may infer that as the digital economy develops, carbon emissions display an inverted U-shaped pattern, confirming Proposition 1 (H1), meaning that carbon emissions will increase in the early stages of the development of the digital economy, but will decrease as it matures. In terms of control variables, there is a negative connection between gross domestic product (GDP), government budget expenditure (GBE), urban financial development level (FDL), and carbon emissions. This demonstrates that the more developed the economy, the greater the investment by the government, and the more mature the development of urban finance, the lower carbon emission. The reason for the change is that cities with relatively developed economies and budgets are more likely to adopt clean technologies and modern equipment, as well as to prioritise the urban environment and green development. Because contemporary public transport uses largely clean energy, such as electricity, urban public transport has been shown to dramatically cut carbon emissions. To some extent, public transit can replace private automobiles and reduce fossil fuel consumption, hence facilitating a reduction of carbon emissions. Urban afforestation will contribute to low-carbon travel, helping to reduce carbon emissions.
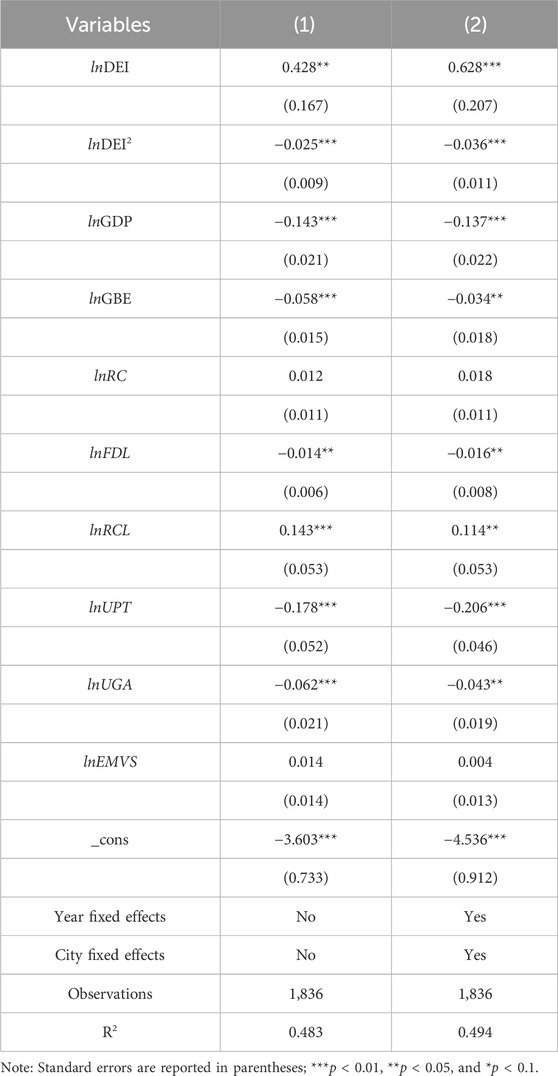
Table 5. Baseline regression.
On the one hand, the digital economy is expected to promote the formation of brand-new businesses, the transformation of energy structure, and the modernization of industrial structures via the utilization of digital technology, all of which will further have an impact on carbon emissions (Shi and Sun, 2023). On the other hand, the changes in carbon emissions will directly or indirectly affect the development of the digital economy. Areas with high energy consumption and emissions will aggressively deploy digital technology and digital infrastructure, influencing the development of the local digital economy. There may therefore be a two-way causal relationship between digital economy development and carbon emissions (She and Wu, 2022). Adopting the strategies of Huang et al. (2019), Zhao et al. (2020), and Qian et al. (2020), the historical posts and telecommunications data from 1984 were utilised as instrumental variables for the digital economy development. In addition, the number of fixed telephones per 100 persons in 1984 is also used as an instrumental variable in the research. The availability of fixed telephones and other facilities has historically influenced the later dissemination of digital technologies and facilities, and hence the growth of the digital economy. This variable therefore satisfies the correlation assumption. With the advancement of the digital economy, the usage rate of fixed telephones will gradually decrease, and its impact on carbon emissions will also gradually weaken. Consequently, this variable likewise fits the exclusivity assumption. The endogeneity issue was then solved with the instrumental variable approach (IV-2SLS).
The coefficients at the first stage are significantly positive, as illustrated in Table 6, indicating that the instrumental variables comply with the correlation condition. The value of Kleibergen-Paap rk LM is 27.202 and significant at the 1% level, disproving the initial hypothesis of “Insufficient identification of instrumental variables”. The value of Kleibergen-Paap rk Wald F is 32.259, the value of Cragg-Donald Wald F is 49.132, and similarly, the critical value of Stock-Yogo is 16.38, all of which are substantially more than 10, so ruling out the possibility of weak instrumental variables. Observing the coefficients in the second stage regression, we can find that the first-order coefficient of the digital economy is notably positive at the 1% level, and the quadratic coefficient of the digital economy is significantly negative at the 1% level, which is consistent with baseline results. Upon a result of resolving the endogeneity issue, the outcomes we achieved are reliable.
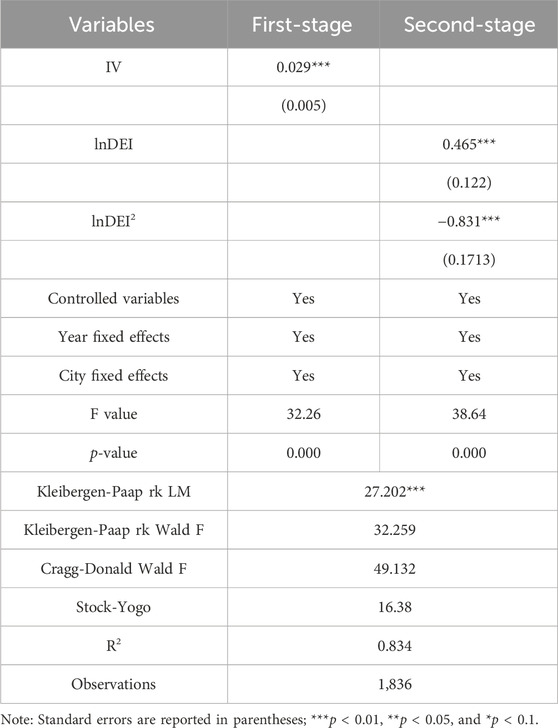
Table 6. IV-2SLS regression.
In this section, we carried out robustness tests to confirm the credibility of the preceding findings. Substituting core independent variables and subsample regression were the two major strategies employed.
First, we substituted the digital economy development index with the principal components of the digital economy. The results are exhibited in Table 7. The first-order coefficient of the primary components of the digital economy is 0.553, which is significant at the 10% level. Its quadratic coefficient is −0.033 and is significant at the 5% level, matching the baseline values.
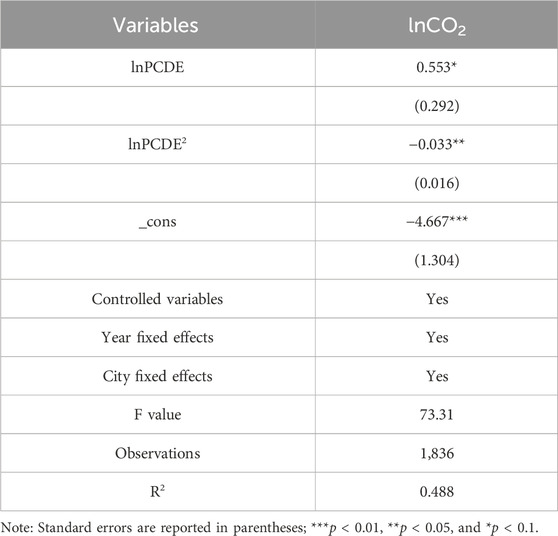
Table 7. Robustness test of replacing core independent variables.
Subsample regressions are then used to assess the trustworthiness of our findings. The panel data from 2013 to 2021 are divided into two sub-sample sets, 2013–2016 and 2017–2021, and the regression analysis is then conducted respectively. The findings are corroborated in Table 8. Column (1) presents the results of regression using panel data from 2013 to 2016. We can see that the digital economy development index has a first-order coefficient of 0.712, which is significant at the 5% level. Its quadratic coefficient is −0.039 and is significant at the 5% level, which matches the baseline results. Column (2) displays the panel data findings from 2017 to 2021. The first-order coefficient of the digital economy development index is highly positive, whereas the quadratic coefficient remains strongly negative, confirming the robustness of our findings once more.
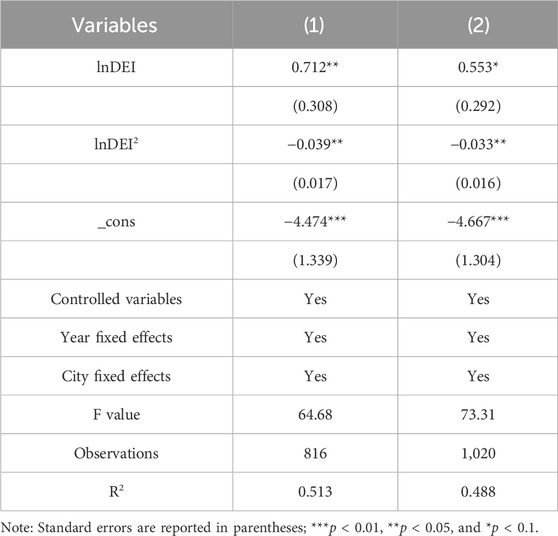
Table 8. Robustness test of subsample regression.
To summarise, we demonstrate that the benchmark results of the inverted U-shaped relationship between digital economy development and carbon emissions are credible by substituting core independent variables and conducting sub-sample regressions.
To identify whether the aforementioned implications change with city characteristics, we conducted three sets of stratified analyses, focusing on the location, population size, and development level (urbanization rate) of the cities.
We began with a heterogeneity analysis based on the region in which each city is located. In this analysis, the cities are grouped into four regions: Eastern, Central, Western, and Northeastern China. The results are summarized in Table 9. It can be seen that when the cities are divided into different regions, the findings change from the baseline regression results. The impact of the digital economy on carbon emissions in Central cities is consistent with the baseline regression. The digital economy has an enormous inhibiting effect on carbon emissions in Eastern cities. This is because these cities are rapidly growing and have noteworthy clean-technology research and application capabilities, which can effectively reduce carbon emissions and promote carbon neutralization. The influence of the digital economy on carbon emissions in Western cities follows a U-shaped pattern. This is due to the fact that the economic scale of Western cities is initially limited, and the application of digital technology may replace the usage of a tiny quantity of fossil energy, hence lowering carbon emissions. However, the widespread use of digital technology will expand Western cities’ economic size while Western cities also increase energy consumption, resulting in a rise in carbon emissions. In Northeastern China, however, the influence of the digital economy on carbon emissions is not significant.
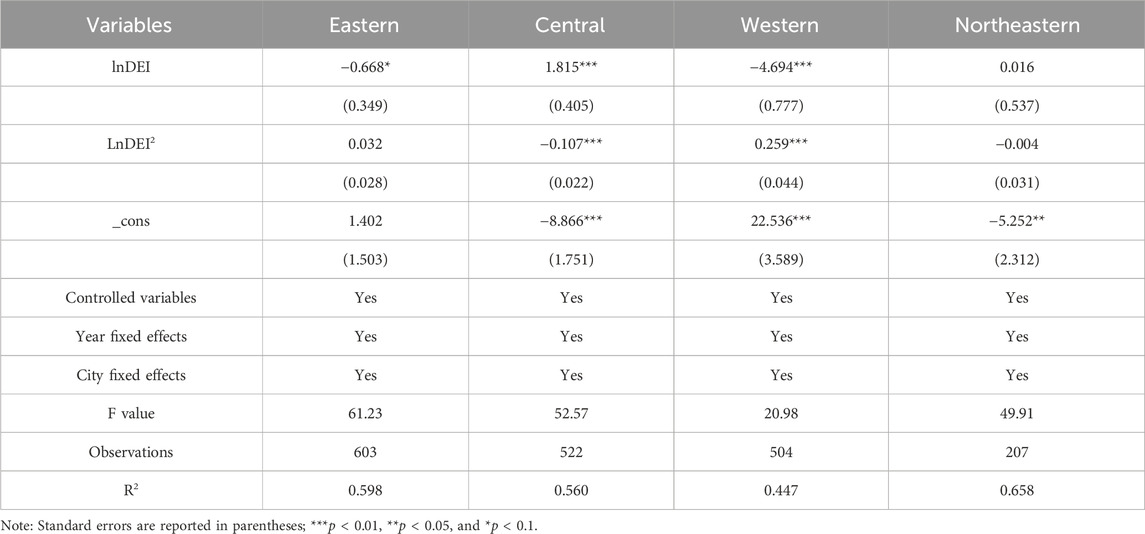
Table 9. Heterogeneity analysis based on the location of cities.
Second, we classify all cities into four groups based on population size. Specifically, the cities are ranked according to the population size from small to large, then the quartile method is applied to divide them into four intervals. The cities in the four intervals are defined as tiny cities, small and medium cities, medium and big cities, and large cities, respectively. Table 10 summarises the findings. Based on the first-order coefficient of the digital economy development index, the digital economy has a substantial effect on carbon reduction in medium and big cities. Since the industrial chains of medium and big cities are relatively developed, the industrial upgrading brought about by digital industrialization and industrial digitization is more obvious, which will improve energy consumption efficiency and promote the upgrading of the energy structure, thus reducing carbon emissions. However, there is little evidence that the digital economy affects carbon emissions in tiny cities, small and medium cities, and large cities. The quadratic coefficient of the digital economy development index demonstrates an obvious inverted U-shaped relationship between the development level of digital economy and carbon emissions in small and medium cities, as well as in large cities.
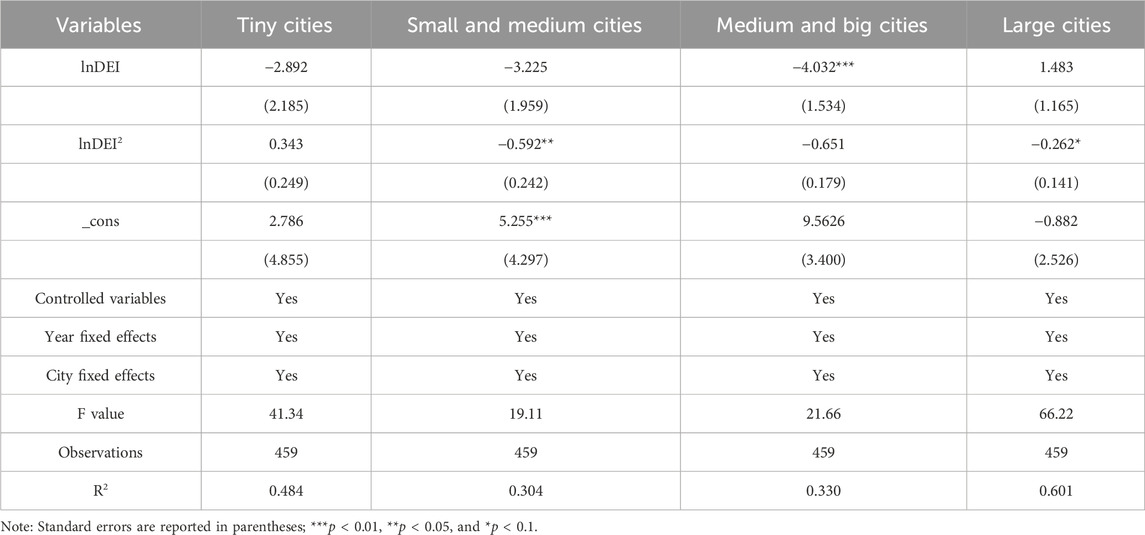
Table 10. Heterogeneity analysis based on the population size of cities.
Finally, we implement a heterogeneity analysis upon the urbanization rates of the cities. Specifically, the cities are ranked according to the urbanization rate from low to high, then the quartile method is applied to divide them into four intervals. The cities in the four intervals are defined as least developed cities, underdeveloped cities, developed cities, and highly developed cities, respectively. The regression results are shown in Table 11. We recognise that, the first-order coefficient of the digital economy is significantly positive for least developed cities and underdeveloped cities, while the quadratic coefficient is significantly negative, indicating that an inverse U-shaped relationship exists between the development level of the digital economy and carbon emissions. This conclusion might be interpreted as the digital economy expanding the economic size of least developed and underdeveloped cities in the short term, increasing carbon emissions. However, with the upgrading of industrial structures and the improvement of energy utilization efficiency brought about by digital technology, carbon emissions tend to reduce. Meanwhile, the coefficient of the digital economy in developed cities is significantly negative at the 1% level, and the quadratic coefficient is not significant. It indicates that the digital economy can help developed cities lower their carbon emissions.
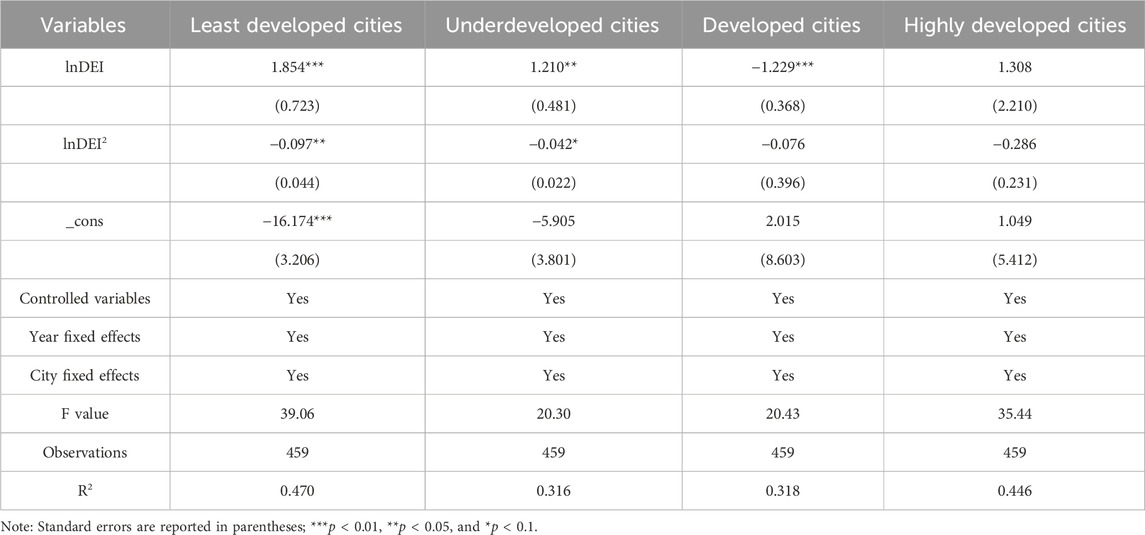
Table 11. Heterogeneity analysis based on the development status of cities.
Through the above analysis, we identified an inverted U-shaped relationship between the development of the digital economy and carbon emissions, that is, carbon emissions will reach a peak and then decline as the digital economy develops. According to Hypothesis 2, this paper will further explore how development of the digital economy influences the carbon peak via upgrading of the industrial structure, technical innovation, and changes to the scale of energy consumption. Table 12 demonstrates the impact of digital economy development on the mechanism variables.
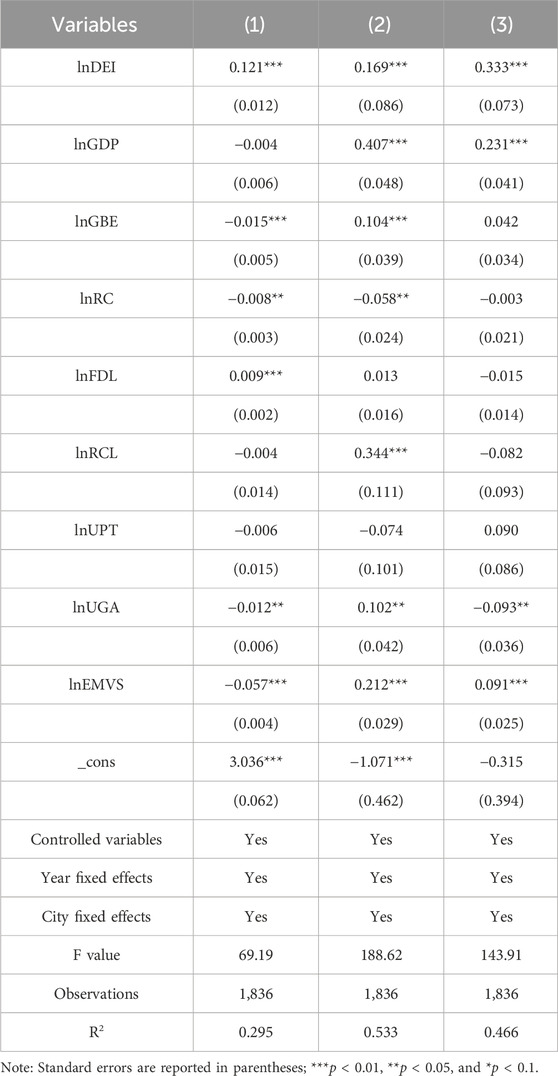
Table 12. The impact of digital economy development on mechanism variables.
Column (1) depicts the impact of digital economy development on upgrading of the industrial structure. The digital economy coefficient is positively significant at the 1% level. Why does the development of digital economy contribute to the upgrading of industrial structure? This is because the development of digital economy improves the efficiency and level of production and management by utilizing intelligent technology and information engineering technology. Moreover, the application of digital technology can make the acquisition and transmission of information more convenient and efficient, and make the flow of information between different industries smoother, thus promoting the flow of information and the integration of resources. In addition, the development of digital economy can accelerate the rise of emerging industries related to digital technology. In a word, the digital economy realizes the effective allocation of data resources, improves the utilization efficiency and value creation ability of data resources, and promotes the upgrading of industrial structure through the flow, sharing, trading and opening of data elements. Numerous research focus on how the modernization of industrial infrastructure influences the carbon emissions. Depend upon the panel data for 278 Chinese cities between 2011 and 2019, Feng et al. (2023) revealed a substantial negative correlation between industrial structure upgrading and carbon emissions. Utilizing provincial panel data from 2003 to 2019, Liu et al. (2022) find that the more advanced the industrial structure, the more obvious its carbon-emission-inhibiting impact. Zhao et al. (2022) also find that improving industrial structure may lower carbon emissions. These findings indicate that the digital economy promotes the modernization of industrial structures, which has an emissions reduction effect. In the current situation where the carbon emissions of most cities in China have not reached their maximum value, the development of the digital economy can assist these cities in achieving a “carbon peak” by upgrading their industrial structure.
Column (2) depicts the impact of digital economy development on technical innovation. We can see that the expansion of the digital economy may be incredibly successful in supporting this innovation. How does the development of digital economy promote technological innovation? First, the application of digital technology enables enterprises to obtain market information more quickly and accurately, and better understand consumer demand, thus reducing the cost of innovation. Secondly, the application of digital technology enables enterprises to develop new products and services more quickly, improving the efficiency of innovation. Finally, the digital economy has changed the traditional innovation mode and promoted the development of new innovation modes such as open innovation and collaborative innovation. Some research explores the influence of technological innovation on carbon emissions. Using a threshold STIRPAT strategy, Liu et al. (2022) find that the coefficient of the impact of autonomous technical innovation on industrial carbon emissions is notably negative at the 1% level. Employing provincial panel data from 2005 to 2017, Sun et al. (2020) conclude that technical innovation has an essential limiting effect on regional carbon emissions. The digital economy can promote technical innovation, and there is a negative correlation between technical innovation and carbon emissions. Consequently, the progress of the digital economy may contribute to achieve the “carbon peak” by supporting technical innovation.
Column (3) indicates the impact of development of the digital economy on energy consumption. We could deduce that the current development of the digital economy has increased energy consumption. The use of digital technology is characterized by high energy consumption. For example, the growing demand for electricity from AI systems puts pressure on power resources, which in turn leads to an increase in carbon emissions. At the same time, the growth of the digital industry itself increases energy consumption, which further exacerbates resource depletion. Although digital technology improves the efficiency of energy use by optimizing energy allocation and consumption, and can better monitor and control energy consumption in residential, commercial and industrial environments, the empirical analysis results show that the current development of digital economy has expanded energy consumption. In terms of the relationship between energy consumption and carbon emissions, Cao et al. (2021) find that energy consumption has a considerable positive impact on per capita carbon emissions. Zhang et al. (2013) find that the use of fossil energy sources can dramatically increase carbon emissions. Given that current development of the digital economy can promote energy consumption, and higher energy consumption leads to higher carbon emissions, the increased energy consumption can be considered a mechanism by which the digital economy increases carbon emissions and delays the arrival of the “carbon peak”.
Through further analysis, we can conclude that the digital economy influences the “carbon peak” through the upgrading of industrial structure, technological innovation, and energy consumption. This corroborates that Proposition two is correct.
The current investigation analyses the correlation between the expansion of the digital economy and carbon emissions via Chinese urban panel data from 2013 to 2021. Based on the above research evidence and analysis results, we can draw the following conclusions. Firstly, there is an inverted “U-shaped” relationship between the development level of the digital economy and carbon emissions. Specifically, with the progress of the digital economy, carbon emissions show a clear upward trend, reaching a “carbon peak”, followed by a downward change. Secondly, the carbon emissions of most cities in China are still on the rise, while the digital economy accelerates the arrival of “carbon peak” by promoting technological innovation and upgrading the industrial structure. The increase in fossil energy consumption caused by the digital economy is undeniably a negative element towards reaching the “carbon peak”.
Heterogeneity analysis results show that, firstly, the development of digital economy has a significant inhibitory effect on carbon emissions in eastern cities, while its impact on carbon emissions in western cities presents a U-shaped trend, and the impact on carbon emissions in Northeast China is not significant. Secondly, the digital economy can effectively reduce carbon emissions in medium and big cities, but there is little evidence that the digital economy affects carbon emissions in tiny cities, small and medium cities, and large cities. There is an obvious inverted U-shaped relationship between the development level of digital economy and carbon emissions in small and medium cities, as well as in large cities. Thirdly, there is an inverted U-shaped relationship exists between the development level of digital economy and carbon emissions in least developed cities and underdeveloped cities, and the digital economy can significantly reduce carbon emissions in developed cities.
This paper explores the mechanisms by which the development of digital economy affects carbon peaking. The results show that the digital economy may influence carbon peaking through upgrading of the industrial structure, technical innovation, and energy consumption.
Based on the aforementioned findings and facts, we put forward our recommendations. First of all, in terms of policy preparation, it is necessary to accelerate the investigation and data statistics of digital economy development and carbon emissions in cities, so as to understand the current situation and characteristics of digital economy development and carbon emissions in each city, and to prepare for formulating relevant policies to promote carbon emission reduction by digital technology.
The heterogeneity analysis results show that the impact of digital economy on carbon emissions varies among cities located in different regions, with different scales and development levels, so each city should formulate policies in line with its own characteristics according to the city size and development status. In addition, these policies should be designed from the aspects of industrial structure, technical innovation and energy consumption.
In terms of promoting the upgrading of urban industrial structure, it is necessary to accelerate the application of digital technology, and use technologies such as Internet of Things, big data and artificial intelligence to monitor the running status of production equipment in real time, predict the maintenance requirements, reduce the failure rate and improve production efficiency. It is also necessary to formulate the integration support policy of digital technology and manufacturing industry as soon as possible to promote the development of intelligent manufacturing. In addition, digital technology should be used to promote the development of emerging economic forms such as platform economy and sharing economy, and to accelerate the integration of digital technology and traditional industries.
With regard to promoting technical innovation, in order to encourage enterprises to engage in digital innovation, the government should set up special funds for innovation, provide loans and tax incentives for enterprises, and encourage social capital to invest in the field of digital technological innovation to reduce the financing cost of enterprises. It is a good choice to establish digital technology innovation parks to attract enterprises, universities and scientific research institutions to participate in digital technology innovation. In addition, it is essential to strengthen the protection of digital intellectual property rights, combat infringement and protect innovations.
When formulating and implementing policies, we need to be aware of the dual impact of the digital technology on carbon emissions, that is, the use of digital technologies can improve energy efficiency, promote the integration of renewable energy sources, and facilitate energy management, which can reduce carbon emissions. However, the development of the digital industry will also increase energy consumption, thereby increasing carbon emissions. For example, the demand for electricity in AI systems is increasing, which not only puts pressure on electricity resources, but also indirectly leads to an increase in carbon emissions.
How to minimize the impact of digital industry development on energy consumption and carbon emissions? First, in terms of digital technology promotion and industrial upgrading, the government should take the lead, enterprises should wholeheartedly accelerate the application of digital technology in production, promote industrial digitalization, optimise industrial structure, transform or eliminate enterprises with high energy consumption and high pollution to reduce carbon emissions. Secondly, in terms of addressing high energy consumption, enterprises should increase the research and promotion of green technologies to reduce carbon emissions while improving productivity per unit of energy consumption. In addition, we need to find alternative clean energy sources. Fossil fuels such as coal and oil are important energy sources at present, but they are also major factors that lead to the increase of carbon emissions. Therefore, it is necessary to accelerate the research and development of green and clean energy to replace traditional fossil fuels.
There are some limitations to the data used in this paper. Firstly, constrained by the availability of urban data, the sub-indicators of the digital economy development index are relatively simple. Secondly, these sub-indicators mostly focus on the application of Internet technology. However, the digital technology is innovating rapidly, and the promotion and utilization of artificial intelligence, big data, and Internet of Things are profoundly affecting socio-economic development, so the sub-indicators of the digital economy development index need to be further enriched and improved. Finally, with the advancement of measurement technology, the calculation method of China’s carbon emissions will become more scientific, and the data related to carbon emissions will be more refined. Therefore, it is necessary to further study the impact of digital economy development on carbon emissions in order to obtain accurate conclusions by using more precise and abundant data.
This paper explores the mechanisms by which the digital economy affects carbon emissions from the perspectives of industrial structure upgrading, technical innovation and energy consumption. However, the application of digital technologies such as cloud computing, big data, and artificial intelligence has a more complex and diverse impact on carbon emissions, so we can further explore other mechanisms by which the digital economy affects carbon emissions in the future.
With the advancement of research technology and research methods, it is advisable to establish a big data model based on big data thinking and including digital technology indicators such as artificial intelligence, which can further simulate and predict the impact trend of digital economy development on carbon emissions.
The raw data supporting the conclusion of this article will be made available by the authors, without undue reservation.
ML: Conceptualization, Data curation, Formal Analysis, Funding acquisition, Investigation, Methodology, Project administration, Resources, Software, Supervision, Validation, Visualization, Writing–original draft, Writing–review and editing.
The author(s) declare that financial support was received for the research, authorship, and/or publication of this article. This work was supported by the National Natural Science Foundation of China (No. 72003131).
Thanks to the support of the National Natural Science Foundation of China and the people who provided valuable suggestions for this paper.
The author declares that the research was conducted in the absence of any commercial or financial relationships that could be construed as a potential conflict of interest.
All claims expressed in this article are solely those of the authors and do not necessarily represent those of their affiliated organizations, or those of the publisher, the editors and the reviewers. Any product that may be evaluated in this article, or claim that may be made by its manufacturer, is not guaranteed or endorsed by the publisher.
2See https://www.ipe.org.cn/MapLowCarbon/LowCarbonGlobalTd.aspx?q=5&ct=1&isfromindustryweb=0&isshowlogo=0
3Shan et al. (2020) point out that by 2019, Beijing, Tianjin, Shijiazhuang, Handan, Weihai, Qingdao, Jining, Tai’an, Linyi, Jiaozuo, Kaifeng, Xuchang, Zhoukou, Suzhou, Hefei, Shangluo, Xi’an, Chongqing, Yibin, Huanggang, Shanghai, Huangshan, Hangzhou, Jinhua, Taizhou, Yichun, Nanchang, Shangrao, Lishui, Nanping, Sanming, Hechi, Guilin, Nanning, Guigang, Macao Special Administrative Region, and the urban areas of Chaozhou had actively reached the peak of carbon emissions. Meanwhile, carbon emissions in other cities are increasing, and the goal of “carbon peaking” has not yet been achieved.
4The contrast method refers to the method of comparing the actual number with the base and calculating the difference between them.
Bai, P., and Zhang, Y. (2021). Digital economy, declining demographic dividends and the rights and interests of low-and medium-skilled labor. Econ. Res. J. 56 (5), 91–108.
Cao, X., Gao, Y., and Liu, Z. (2021). The impact of urbanization of rural residents on carbon emissions from household energy consumption. Chin. Rural. Econ. 442 (10), 64–83.
Chen, J., Li, W., Liu, Y., and W, B. (2024). Digital economy, factor role shift and urban carbon emissions: based on the test of moderating and threshold effect. J. Beijing Jiaot. Univ. Soc. Sci. Ed. doi:10.16797/j.cnki.11-5224/c.20240513.003
Chen, Y., Wang, S., and Lu, S. (2022). Research on the impact of green innovation on carbon emissions and its mechanism driven by the new development concept—empirical evidence based on continuous DID. Res. Econ. Manag. 43 (9), 3–16. doi:10.13502/j.cnki.issn1000-7636.2022.09.001
Deng, S. H., Zhang, J., Shen, F., Guo, H., Li, Y.-w., and Xiao, H. (2014). The relationship between industry structure, household-number and energy consumption in China. Energy Sources, Part B Econ. Plan. Policy 4, 325–333. doi:10.1080/15567249.2010.5333306
Fei, W., Yu, B., and Wang, W. (2022). Digital economy development and carbon emission reduction—theoretical deduction and empirical test. Economist. 11, 74–83. doi:10.16158/j.cnki.51-1312/f.2022.11.007
Feng, S., Xu, D., and Zhang, R. (2023). How does the development of digital finance reduce CO2 emissions? empirical analysis based on prefecture-level cities. Mod. Econ. Sci. 45 (4), 1–18. doi:10.20069/j.cnki.DJKX.202304002
Gao, P., and Wang, X. (2011). Regional differences and influencing factors of rural financial rejection in China: empirical analysis based on provincial data. J. Agrotechnical Econ. 4, 93–102. doi:10.13246/j.cnki.jae.2011.04.0129
Guo, F., Wang, J., Wang, F., Kong, T., Zhang, X., and Cheng, Z. (2020). Measuring China’s digital financial inclusion: index compilation and spatial characteristics. China Econ. Q. 19 (4), 1401–1418. doi:10.13821/j.cnki.ceq.2020.03.12
Guo, J., and Wang, H. (2022). Innovative choice of emissions-reduction strategy under digital empowerment: quasi-natural experiment based on the “Broadband China” pilot policy. Industrial Econ. Res. 119 (4), 101–142. doi:10.13269/j.cnki.ier.2022.04.003
Guo, W., and Sun, H. (2020). Research on impact of environmental regulation and technical innovation on total factor carbon productivity: based on Chinese provinces spatial panel data analysis. Sci. Technol. Manag. Res. 40 (23), 239–247.
Hittinger, E., and Jaramillo, P. (2019). Internet of things: energy boon or bane. Science 364 (6438), 326–328. doi:10.1126/science.aau8825
Huang, H., and Yao, R. (2024). Accounting for the scale of the digital Economy: a framework combining national accounts and growth accounting. Econ. Perspect. 1, 74–92.
Huang, Q., Yu, Y., and Zhang, S. (2019). Internet development and productivity growth in manufacturing industry: internal mechanism and china experiences. China Ind. Econ. 08, 5–23. doi:10.19581/j.cnki.ciejournal.2019.08.001
Huang, Y., Gong, S., Zou, C., Jia, L., and Xu, Z. (2022). Digital economy, factor allocation efficiency, and integrated urban-rural development. China Popul. Resour. Environ. 10, 77–87.
Kovacikova, M., Janoskova, P., and Kovacikova, K. (2021). The impact of emissions on the environment within the digital economy. Transp. Res. Procedia 55, 1090–1097. doi:10.1016/j.trpro.2021.07.080
Lange, S., Pohl, J., and Santarius, T. (2020). Digitalization and energy consumption: does ICT reduce energy demand? Ecol. Econ. 176, 106760. doi:10.1016/j.ecolecon.2020.106760
Liu, J., Yang, Y., and Zhang, S. (2020). Research on the measurement and driving factors of China’s digital economy. Shanghai J. Econ. 6, 81–96. doi:10.19626/j.cnki.cn31-1163/f.2020.06.008
Liu, X., Xu, H., and Zhang, M. (2022a). Impact and transmission mechanism of land leasing marketization on carbon emissions: based on the mediating effect of industrial structure. China Popul. Resour. Environ. 32 (6), 12–21.
Liu, Y., Li, H., and Ma, H. (2021). Evaluation of agricultural modernization of state farms: based on entropy weight method and TOPSIS method. Issues Agric. Econ. 494 (2), 107–116. doi:10.13246/j.cnki.iae.2021.02.010
Liu, Y., Zhang, J., and Geng, Y. (2023). Exports and carbon emissions from the perspective of global value chains—re-examination of the inverted U-shaped relationship. J. Int. Trade 481 (1), 90–107. doi:10.13510/j.cnki.jit.2023.01.005
Liu, Z., Wang, Z., and Yuan, C. (2022b). Impact of independent technological innovation on industrial carbon emissions and trend prediction from the perspective of structure. China Popul. Resour. Environ. 32 (7), 12–21.
Ma, Y., Wu, Y., and Wu, B. (2015). Comprehensive evaluation of sustainable urban development of Yangtze River delta based on entropy method and quadrant method. Econ. Geogr. 35 (6), 47–53. doi:10.15957/j.cnki.jjdl.2015.06.007
Qian, H., Tao, Y., Cao, S., and Cao, Y. (2020). Theoretical and empirical analysis on the development of digital finance and economic growth in China. J. Quantitative Technol. Econ. 37 (6), 26–46. doi:10.13653/j.cnki.jqte.2020.06.002
Shan, Y., Guan, Y., Hang, Y., Zheng, H., Li, Y., Guan, D., et al. (2022). City-level emission peak and drivers in China. Sci. Bull. 67 (18), 1910–1920. doi:10.1016/j.scib.2022.08.024
Shao, S., Fan, M., and Yang, L. (2022). Economic restructuring, green technical progress, and low-carbon transition development in China: an empirical investigation based on the overall technology frontier and spatial spillover effect. J. Manag. World 38 (2), 46–69. doi:10.19744/j.cnki.11-1235/f.2022.0031
Shao, S., Zhang, K., and Dou, J. (2019). Effects of economic agglomeration on energy saving and emission reduction: theory and empirical evidence from China. J. Manag. World 35 (1), 36–60. doi:10.19744/j.cnki.11-1235/f.2019.0005
She, Q., and Wu, L. (2022). The carbon emission reduction effect of digital economy development. Econ. Surv. 39 (5), 14–24. doi:10.15931/j.cnki.1006-1096.2022.05.008
Shi, D., and Sun, G. (2023). Analysis of the green effect of digital economy and industry convergence. Fujian Trib. 371 (4), 67–82.
Sun, Z., Liu, B., and Li, H. (2020). Industrial restructuring, technological innovation and regional carbon emission reduction—empirical research based on regional panel data. Reform Econ. Sys. 371 (03), 101–108.
Tian, L., Han, W., and Tian, W. (2024). Research on the mechanism of digital economy affecting intra-rural income gap—analyses based on the digital dividend and the digital divide. Inq. into Econ. Issues. 5, 21–34.
Wang, F., and Dong, Z. (2023). The impact of digital economy on carbon emissions in China: empirical analysis based on provincial panel data. Reform 349 (3), 76–90.
Wang, S. (2023). Digital economy development for urban carbon emissions: “accelerator” or “speed bump”. China Popul. Resour. Environ. 33 (6), 11–22.
Wang, X., and Li, J. (2022). Did the digital economy effectively promote energy conservation and CO2 reduction? China Popul. Resour. Environ. 32 (11), 83–95.
Wang, Y., and Hu, J. (2016). An empirical review on China’s carbon Kuznets curve. Public Finance Res. 405 (11), 51–64. doi:10.19477/j.cnki.11-1077/f.2016.11.005
Xu, Q., Shan, Z., and Ma, C. (2018). A review of research on digital economy measurement index system at home and abroad. World Surv. Res. 11, 52–58. doi:10.13778/j.cnki.11-3705/c.2018.11.008
Xu, X., Ren, X., and Chang, Z. (2019). Big data and green development. China Ind. Econ. 4, 5–22. doi:10.19581/j.cnki.ciejournal.2019.04.001
Xu, X., and Zhang, M. (2020). Research on the scale measurement of China’s digital economy—based on the perspective of international comparison. China Ind. Econ. 5, 23–41. doi:10.19581/j.cnki.ciejournal.2020.05.013
Yang, D., and Liu, Y. (2018). Why can Internet plus increase performance. China Ind. Econ. 5, 80–98. doi:10.19581/j.cnki.ciejournal.2018.05.005
Yang, G., Wang, H., Fan, H., and Yue, Z. (2023). Carbon reduction effect of digital economy:theoretical analysis and empirical evidence. China Ind. Econ. 05, 80–98. doi:10.19581/j.cnki.ciejournal.2023.05.005
Yang, L., and Sun, Z. (2015). The development of western new-type urbanization level evaluation based on entropy method. Econ. Problems. 3, 115–119. doi:10.16011/j.cnki.jjwt.2015.03.023
Yang, X., and Zhao, S. (2022). Low-carbon emission reduction effect of digital economy empowering regional green development. Res. Econ. Manag. 43 (12), 85–100. doi:10.13502/j.cnki.issn1000-7636.2022.12.006
Yang, Y. (2006). Evaluation and analysis of an empowerment method in the multi-index comprehensive evaluation system. Statistics Decis. 13, 17–19.
Yang, Y. (2024). Digital economy and local fiscal sustainability: coupling coordination and spatial spillover test. Inq. into Econ. Issues 4, 35–50.
Yu, D., and Zhang, M. (2016). Resolution of “the heterogeneity difficulty” and reverification of the carbon emission EKC—based on the country grouping test under the threshold regression. China Ind. Econ. 340 (7), 57–73. doi:10.19581/j.cnki.ciejournal.2016.07.005
Zhang, W., An, J., and Han, C. (2003). Application of the entropy method in urban sustainable development evaluation. J. Quantitative Technol. Econ. 6, 115–118.
Zhang, W., Zhu, Q., and Li, H. (2013). Energy use, carbon emission and China’s total factor carbon emission reduction efficiency. Econ. Res. J. 48 (10), 138–150.
Zhao, H., and Yu, F. (2019). Evaluation of agricultural green development level in main grain producing areas based on entropy method. Reform 309 (11), 136–146.
Zhao, T., Zhang, Z., and Liang, S. (2020). Digital economy, entrepreneurship, and high-quality economic development: empirical evidence from urban China. J. Manag. World 36 (10), 65–76. doi:10.19744/j.cnki.11-1235/f.2020.0154
Zhao, Y., Qian, Z., and Xu, X. (2022). Study on the impact of industrial structure upgrading on carbon emissions in China in the context of carbon peaking and carbon neutrality. Inquiry into Econ. Issues 03, 87–105.
Zhu, H., Zheng, J., Zhao, Q., and Kou, D. (2020). Economic growth, energy structure transformation and carbon dioxide emission—empirical analysis based on panel data. Res. Econ. Manag. 41 (11), 19–34. doi:10.13502/j.cnki.issn1000-7636.2020.11.002
Zhu, J., and Li, D. (2019). Is technological innovation the effective way to achieve “double dividend” of environmental protection and employment growth? an empirical research based on the mediating effect model of 34 subdivided industries in China. China Soft Sci. 344 (8), 1–13.
Keywords: digital economy development, carbon emissions, carbon peaking, industrial structure, technical innovation, energy consumption
Citation: Liu M (2024) Has the development of the digital economy raised or lowered the level of carbon emissions in cities?-Evidence from China. Front. Environ. Sci. 12:1417924. doi: 10.3389/fenvs.2024.1417924
Received: 15 April 2024; Accepted: 07 June 2024;
Published: 04 July 2024.
Edited by:
Mobeen Ur Rehman, Shaheed Zulfikar Ali Bhutto Institute of Science and Technology (SZABIST), United Arab EmiratesReviewed by:
Rui Huang, Nanjing Normal University, ChinaCopyright © 2024 Liu. This is an open-access article distributed under the terms of the Creative Commons Attribution License (CC BY). The use, distribution or reproduction in other forums is permitted, provided the original author(s) and the copyright owner(s) are credited and that the original publication in this journal is cited, in accordance with accepted academic practice. No use, distribution or reproduction is permitted which does not comply with these terms.
*Correspondence: Mingxuan Liu, bGl1bWluZ3h1YW5AcnVjLmVkdS5jbg==
Disclaimer: All claims expressed in this article are solely those of the authors and do not necessarily represent those of their affiliated organizations, or those of the publisher, the editors and the reviewers. Any product that may be evaluated in this article or claim that may be made by its manufacturer is not guaranteed or endorsed by the publisher.
Research integrity at Frontiers
Learn more about the work of our research integrity team to safeguard the quality of each article we publish.