
95% of researchers rate our articles as excellent or good
Learn more about the work of our research integrity team to safeguard the quality of each article we publish.
Find out more
ORIGINAL RESEARCH article
Front. Environ. Sci. , 03 September 2024
Sec. Drylands
Volume 12 - 2024 | https://doi.org/10.3389/fenvs.2024.1417199
This article is part of the Research Topic Drylands under the Influence of Climate Change and Human Activities View all 15 articles
 Gajanan L. Sawargaonkar*
 Moses Shyam Davala
 S. Rakesh
 Prasad J. KamdiRohan Y. KhopadeRajesh Nune
 Rajesh Pasumarthi
 Pushpajeet ChoudhariAviraj DattaVenkata Radha Akuraju
 Sreenath DixitRamesh SinghMangi Lal Jat
The current diagnostic agronomy study of the Bankura region of West Bengal, India, examined the variations in crop yields through a socio-ecological analysis of multiple production system components. Envirotyping for root cause analysis was employed to delve into the variables that affect the performance of rainfed production systems. Mother Earth, man, machine, management, and materials (5Ms concept) were the five indicators under which the variables were grouped. Findings demonstrated the fragility of the region’s soils due to its undulating terrain, unpredictable rainfall patterns, and frequent drought scenarios. The LULC’s NDVI showed that the agricultural area is about 60% and 43% of the total geographical area in the Hirbandh and Ranibandh blocks, respectively. Soils are acidic and diagnosed with deficiency of both macro and micronutrients (phosphorous, sulfur, and boron) having poor water holding capacity (35 to 55 mm for a 50 cm soil depth). The sand and soil organic carbon contents ranged between 43.04%–82.32% and 0.17%–1.01%, respectively with a low bacterial population. These factors are the root cause for low cropping intensity (106%) and low paddy productivity (3,021 kg/ha). Overall, the study contributes to designing and scaling-up of sustainable landscape management practices that could ensure higher cropping intensity and system productivity in similar agro-ecologies with limited evidence.
Considering that 17.4% of India’s GDP comes from agriculture and related industries, which employ 54.6% of the nation’s workforce, agriculture is a key sector of the economy. It is desirable to use cultivable land as intensively as possible to maximize agricultural output since there is an inelastic supply of land for cultivation in a country like India, where there is demand from a high and expanding population for cultivable land. Nonetheless, since the country’s independence, its net sown area has increased roughly by 20% and has reached a point where further growth is not currently feasible. There are only two ways to use land to meet the nation’s growing population’s needs for food and other necessities: either increasing the net area under cultivation or intensifying cropping over the current area. Increasing cropping intensity is one of the tried-and-true methods for raising agricultural productivity and creating jobs in rural areas. Nonetheless, the degree of cropping intensity is mostly determined by the agroecological conditions and the inputs used in agriculture (Mondal and Sarkar, 2021).
In India, there are many different cropping systems under various agroclimatic zones, which are primarily determined by soil type, rainfall, climate, technology, policies, and the socioeconomic status of the farming community (Gulati and Juneja, 2022). All these factors have a significant impact on crop productivity and intensity. Bankura is the western district of West Bengal, India, and much of the terrain is undulating, having soils with low available moisture capacity (National Bureau of Soil Survey and Land Use Planning, 2013). The soils in Bankura are of inherently poor quality due to erosion and warm climate. Soil degradation is exacerbated by the conversion of land uses, such as forests to croplands, and poor farmland management (De et al., 2022). Due to unpredictable rainfall patterns, rainfed crops are typically grown with low nutrients, and the farmers in these areas tend to be resource-poor (Srinivasarao et al., 2013). As a result, these soils frequently have nutrient deficits, which make it difficult for crops to produce desirable yields. Long-term fertilizer studies spanning approximately 30 years showed that organic manures are essential for maintaining agricultural yield in addition to enhancing soil organic carbon stock (Srinivasarao et al., 2009). However, high temperatures oxidize soil organic matter (SOM); hence, the conservation and maintenance of SOM in tropical regions is the biggest challenge. Consequently, there is a multi-nutrient deficiency in these soils.
The four different types of drought situations that can occur in Bankura are meteorological drought, hydrological drought, agricultural drought, and socio-economic drought, which affects human activities (Wilhite and Glantz, 1985; Wilhite, 2000; AMS, 2004; Parry et al., 2007; Bera and Bandyopadhyay, 2017; District Disaster Management Cell, 2017). Drought coupled with the high runoff rate of rainwater, inadequate storage facilities, high surface runoff, and low water holding capacity of the soil exacerbates the situation during the post-rainy season (Rahim et al., 2011; District Disaster Management Cell, 2021). The development of sustainable cropping systems is significantly becoming important in the current scenario with increased vulnerability to climate change. The UN Sustainable Development Goals (SDGs) such as #SDG13 and #SDG15 focus on climate action, and the life on land can be effectively achieved by the adoption of sustainable agriculture practices. Consequently, we can achieve land degradation neutrality (LDN) and climate mitigation.
Large yield gaps between potential, on-station, and farm yields (Srinivasarao et al., 2010) are attributable to many factors, which include a range of management techniques that affect crop yield, in addition to having a high correlation with certain socioeconomic aspects. “Envirotyping” is an approach proposed by Xu (2016) which considers all environmental factors in order to determine the impact of climate change on the growth and production of plants. Batan (2017) and Xu (2016) classified the envirotyping factors into five major groups, namely, soil, climate, crop canopy, companion organisms, and crop management, and these components are important environmental factors affecting plant growth. However, the human element (i.e., man) was not considered in the envirotyping framework, like the role of socio-economic factors, which greatly influence the decision-making process and adaptation strategies of the farmer to climate change. The land tenancy system, farm size, skilled (young) labor, capital (agricultural credit), market and product price, farm mechanization, access to and knowledge of IT, farm subsidies, resource management, farm risk, awareness, age of the farmers, population, rural development, government policies, and religion are some of the notable socioeconomic barriers that numerous studies have reported (Roy and Kaur, 2015). As the budgetary payments to farmers did not counteract the price-depressing effects of intricate domestic marketing rules and trade policy measures, it inevitably affected the farmers’ net income and, consequently, the subsequent investments in agriculture. This led to the dependency of farmers, particularly small and marginal farmers, on government schemes and support. Hence, the reasons for low productivity or cropping intensity cannot be attributed to one single factor, but it is a complex relationship between tangible and intangible factors and needs a thorough understanding of inter-relationship.
In the present investigation, we contributed to answering these questions by analyzing a case study of the Bankura region of West Bengal, India, with the objectives (i) to characterize the existing ecosystem complemented with socio-economic analysis, (ii) to analyze the root cause for low agricultural productivity and cropping intensity, and (iii) to recommend site-specific interventions to address the challenges.
Root cause analysis (RCA) was carried out in a small focus group of about six to eight people in each of the 10 villages using a flip chart paper, and as the conversation progressed, important factors were added. The first step is to discuss and agree on the problem or issue to be analyzed. The broader topic was further broken down with the help of a tree. The problem or issue is written in the center of the flip chart, which becomes the “trunk” of the tree representing the “focal problem.” The next step is to identify the causes of the focal problem, which become the roots, and then identify the consequences, which become the branches. As the study involves envirotyping, the measurements include both field and laboratory activities such as planning, sample collection, laboratory tests and analysis, and data handling (Worthington et al., 2024). To meticulously understand the concepts of cropping systems in rainfed regions and the root cause determination (Alpha et al., 2021) behind each of the 5Ms, the authors attempted to generate a research-based fishbone concept framework (Kaoru Ishikawa diagram) for the underlying causes of an event with proper corrective measures and further prevent any recurrences (Murumbi, 2014).
The present investigation was outlined under the framework of five M’s, e.g., Mother Earth, man, machine, management, and materials (Zielińska-Chmielewska et al., 2021). Several other methods (Chaudhary et al., 2015; Rao et al., 2019; Reddy et al., 2021) have also studied vulnerability indicators using different quantifying methodologies/approaches, but the 5M’s approach unveiled the opportunities to identify the key root causes of each problem in the present study. We used this approach to critically focus on the 5Ms and discuss several sub-elements (Figure 1) under each M to come up with salient features of the studied regions. To identify a research problem’s primary reason or causes, a “five whys” approach was used. Any question will serve as the starting point and basis for the subsequent question in this manner. Quality professionals rank fifth for repeating the inquiry based on their experience and field studies. This approach’s primary objective was to identify the underlying source of an issue by asking “why?” a lot.
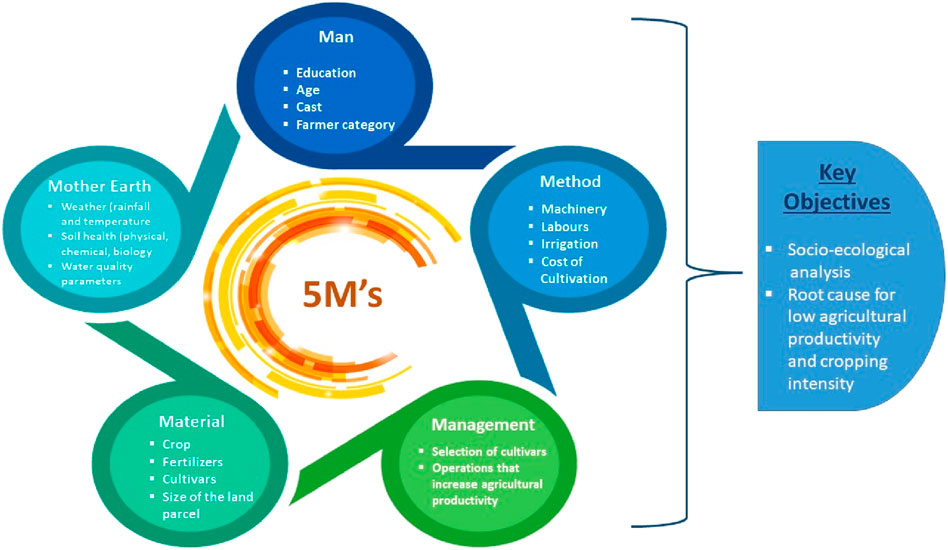
Figure 1. 5M concept of the study.
The study area comprises Ranibandh (22.8661°N and 86.7831°E) and Hirbandh (23.0616°N and 86.8145°E) blocks of the Bankura district (Figure 2) of the south-western part of West Bengal, India, which is bordered by the Mukutmanipur reservoir. The geographical areas of the Hirbandh and Ranibandh blocks are 199 and 418 sq. km, respectively. There are about 119 villages in Hirbandh and about 184 villages in the Ranibandh block with diverse socio–agro–economic characteristics. All the villages in both blocks were clustered based on the demographic and socio-economic criteria (Supplementary Table S1), and five representative villages from each block were selected (Figure 2). The villages, namely, Tentulia, Sitarampur, Jadurbankata, Kadia, and Itamara from the Hirbandh block, while Satnala, Gosainidihi, Dhanara, Ramgarh, and Kama from the Ranibandh block were selected for the study.
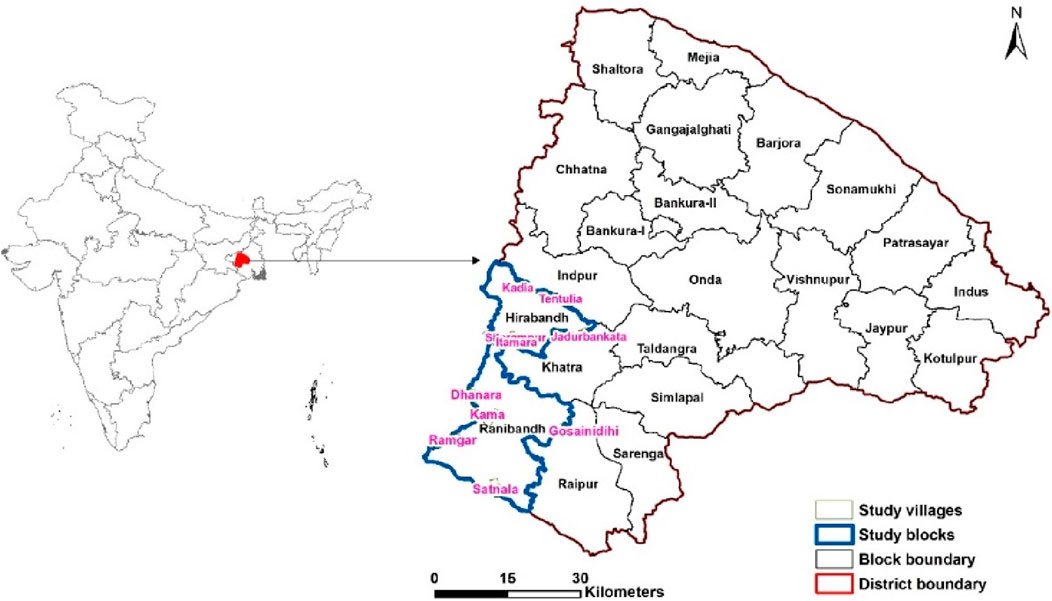
Figure 2. Location of the experimental area.
As the topography influences the cropping pattern and productivity (Kumhálová et al., 2011), 30 farmers from each village were randomly selected and classified into four categories: uplands, mid-uplands, mid-lowlands, and lowlands (Jana SK, 2011A). The uplands consist of a mix of non-arable wasteland and cultivable land with thin topsoil and low water-holding capacity. The mid-uplands are sandy to sandy loam and shallow with low organic matter and moisture holding capacity. The mid-lowlands are loamier than the mid-uplands and are lower than mid-uplands but higher than lowlands (Sugata et al., 2017). Low-lying arable land is best suited for paddy cultivation as water from uplands collects in these types of plots.
To analyze the nutrient status and physical and soil biological properties, 20 composite soil samples were collected from each of the 10 villages using a stratified soil sampling method (up-, mid-, and lowlands). Water samples were collected from drinking water wells, community ponds near the households used for washing, and from the main irrigation sources in each of the 10 villages for its quality assessment. Overall, the sample design comprises 300 household samples, 200 soil samples, and 30 water samples (Supplementary Table S2).
Table 1 shows the brief methodology used to analyse various parameters of soil and water:
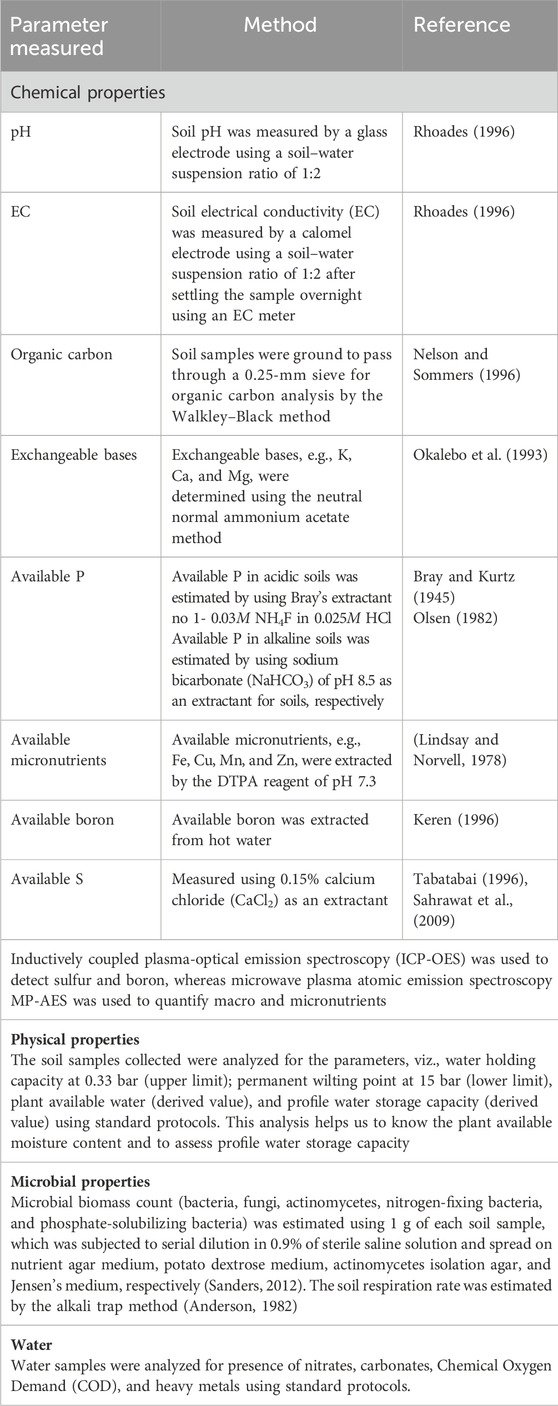
Table 1. Laboratory protocol used for testing soil and water samples and please add the right hand border.
Detection of changes in land use/land cover patterns is a good indicator of land degradation and, hence, an essential task for sustainable natural resources management planning. This section analyses the changes in land use/land cover for the years 2005–06 and 2020–21 in Hirbandh and Ranibandh blocks. To analyze changes in land use in the study area, time-series satellite data from 2005–06 and 2020–21 were used. Monthly IRS-P6 AWiFs images were utilized, with digital numbers converted to reflectance values to normalize multi-date effects. Top-of-atmosphere (TOA) reflectance was calculated using a reflectance model built in ERDAS Imagine (Thenkabail et al., 2004; Velpuri et al., 2009), and normalization was based on available metadata in header files. A hybrid approach, including decision tree or supervised MXL or both, was used to classify the data and extract information on land use/land cover classes and agricultural seasons. This allowed for regular process repetition at set time intervals. All classes were reclassified into major classes such as built-up, rainy season (June to November), post-rainy (December to March), double crop, fallow land, forest, wasteland, and waterbodies.
The cropping intensity of the region was estimated to understand the present utilization efficiency of the land, which is the ratio between the gross cropped area (GCA) and net cropped area (NCA) (Brahmanand et al., 2021). The GCA represents the total area sown once, twice, or more in a specific year; hence, in GCA, an area is counted twice when a crop is sown twice on the same plot of land, while the NCA is the crop-planted area that was only counted once. Crop diversity is calculated using the Simpson index of diversification (Simpson, 1949), which measures the diversity by considering both the total number of species and the relative abundance of each species.
Simpson index of diversification (SID) = 1 −
Here, Ai is the amount of land allocated to each ith crop, and
The standard deviation and the standard error mean of the samples of different villages under two different blocks were computed using SPSS software- version: 17.0.
The variation in cropping intensity (CI) has been noticed in the sample locations (Figure 3A). Jadurbankata and Itamara have a higher CI, which is around 200%. On the other hand, Sitamara and Kamo Gora have a lower CI (<100%). The average CI of all the 10 villages was 121%, whereas after the exclusion of the two villages (viz, Jadurbankata and Itamara), the CI for the rest of the villages was 106%, thus indicating the low land use efficiency of the study region (Mondal, 2019). Due to low rainfall and excess draining out of water, there is less residual soil moisture availability in these areas during the post-rainy season, thereby making farmers unable to cultivate multiple crops, and thus, the region witnesses low CI.
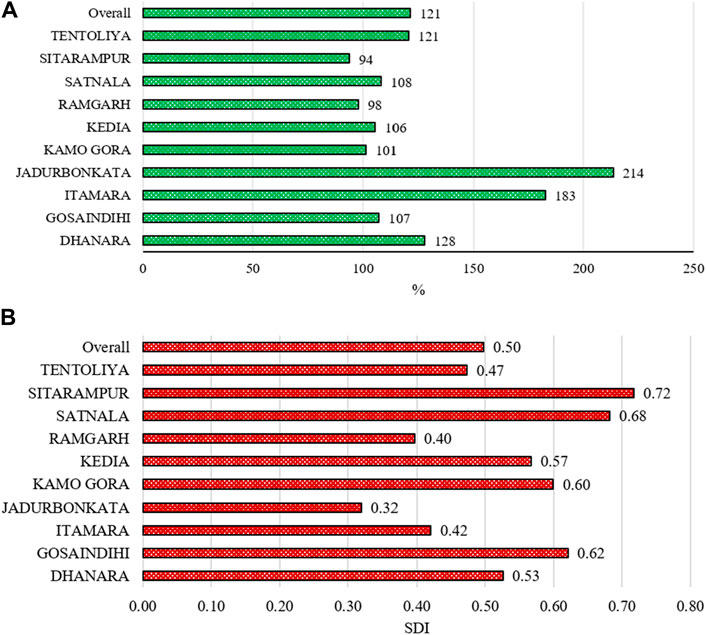
Figure 3. (A) Cropping intensity of the study area and (B) Simpson diversity index of the study villages.
Diversified cropping systems, in general, tend to be more agronomically stable and resilient (Makate et al., 2016). The average Simpson diversification index (SDI) score was <0.5, indicating moderate diversification across the villages (Figure 3B). The highest SDI was observed at Jadurbankata (0.30), indicating diversification from subsistence crops to more commercial crops. Studies proved that crop diversification has a significant and positive impact on the farm income of households (Lama, 2016), and as these areas have low cropping system diversification and low CI, the agricultural income is very meager to sustain the livelihoods of small and marginal farmers in the area. Hence, it is very important to understand the socio-ecological reason for low CI.
The team has brainstormed along with farmers and scientists about many possible causes and their effects that lead to low intensity and productivity and are represented in a cause-and-effect diagram or a fishbone diagram (Figure 4). The factors are classified into five main groups: Mother Earth, man, material, methods, and management.
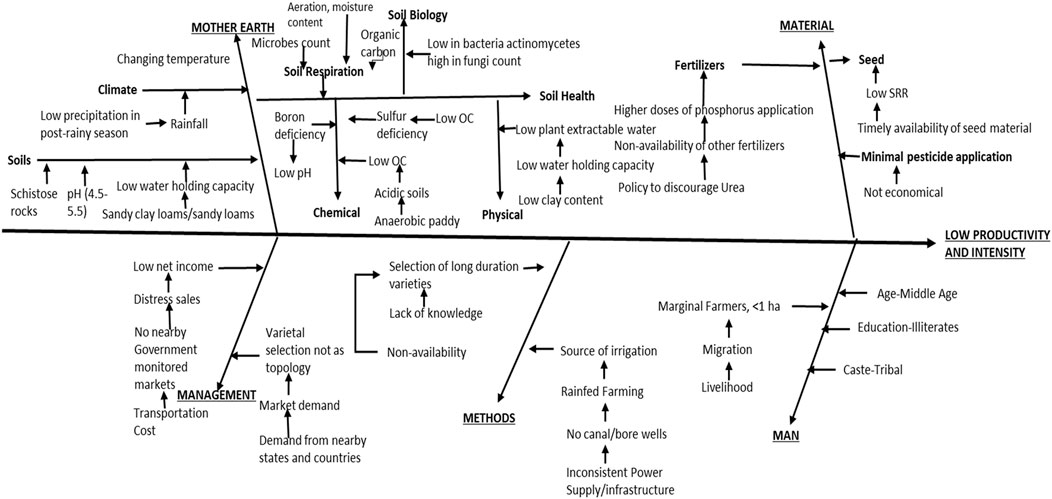
Figure 4. Fishbone conceptual framework.
Each node in the framework represents the causes that affect it. Each cause has its opportunities for improvement and needs to be analyzed separately. Based on the judgment of the expert team, the problem is assigned to the pre-described root cause (5M’s). Table 2 shows the important controllable causes of this problem.
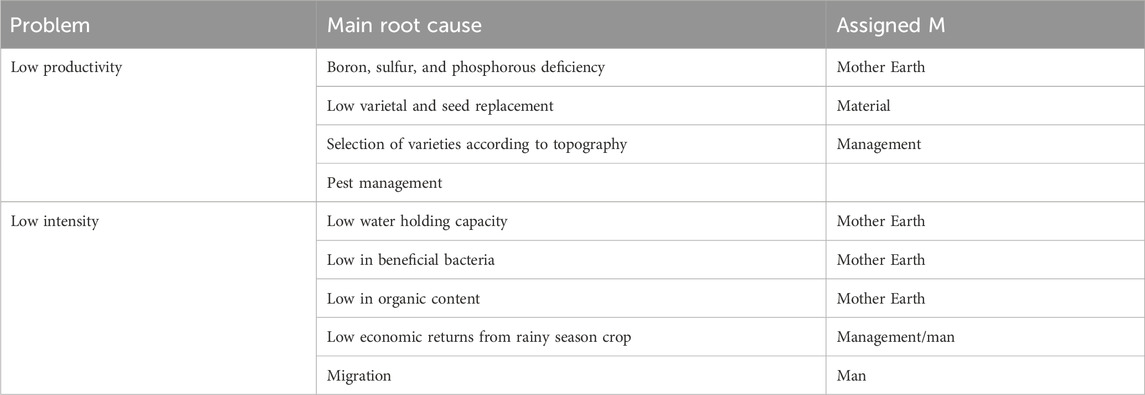
Table 2. Controllable root causes of the problem.
Mother Earth encapsulates the environmental elements such as weather, soil, water, and other uncontrollable events that fall into this category. The present study includes weather (rainfall and temperature), soil health (physical, chemical, and biological), and water quality parameters under this category.
A total of eight classes were generated to understand LULC in Hirbandh and Ranibandh blocks for the year 2020–21 (Figure 5). Time-series satellite data for the years 2005–06 and 2020–21 were used to analyze the land use change in the study area. The changes in land use/land cover classes for the period 2005 to 2020 were analyzed as a percent difference. Remote-sensing analysis showed that the agricultural area is about 60% and 43% of the total geographical area in the Hirbandh and Ranibandh blocks, respectively. This shows that both blocks are agriculture-dominant. About 54% and 37% of areas are under the rainy season, and negligible areas are under the post-rainy season in Hirbandh and Ranibandh blocks (Table 3). The area under built-up, post-rainy, forest, and water bodies has not changed significantly (<1%) in the Hirbandh block. The area under the rainy season has increased by 18% due to the conversion of 5.5% of fallow land, 9.5% of double crop land, and 3.5% of wasteland.
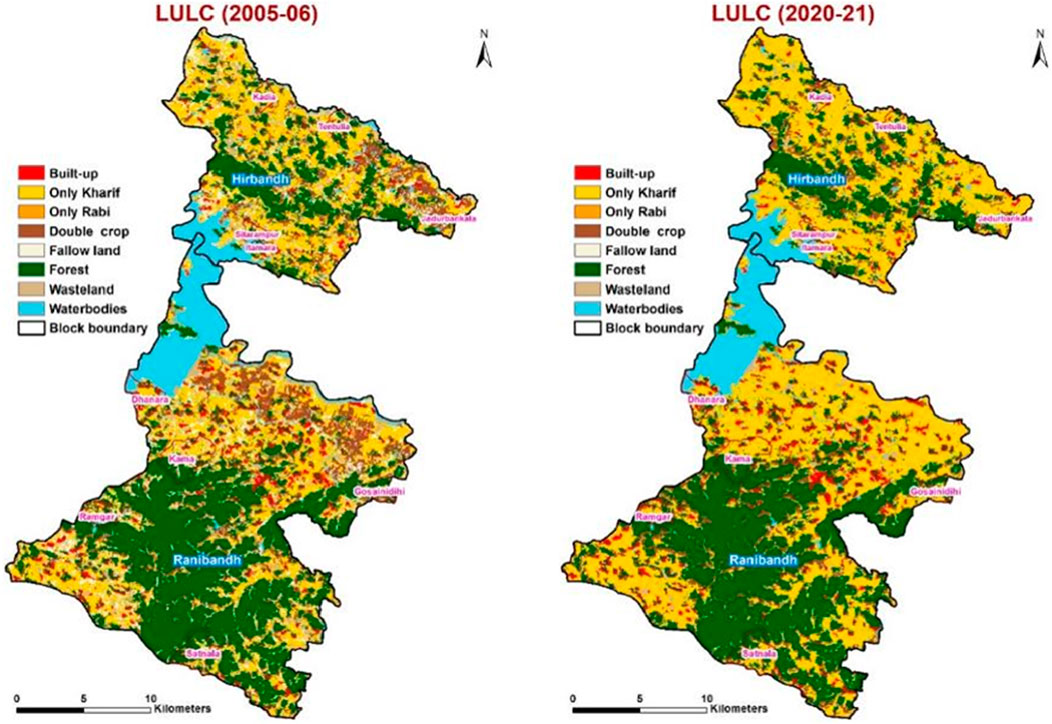
Figure 5. LULC of Hirbandh and Ranibandh blocks for 2005–06 and 2020–21.
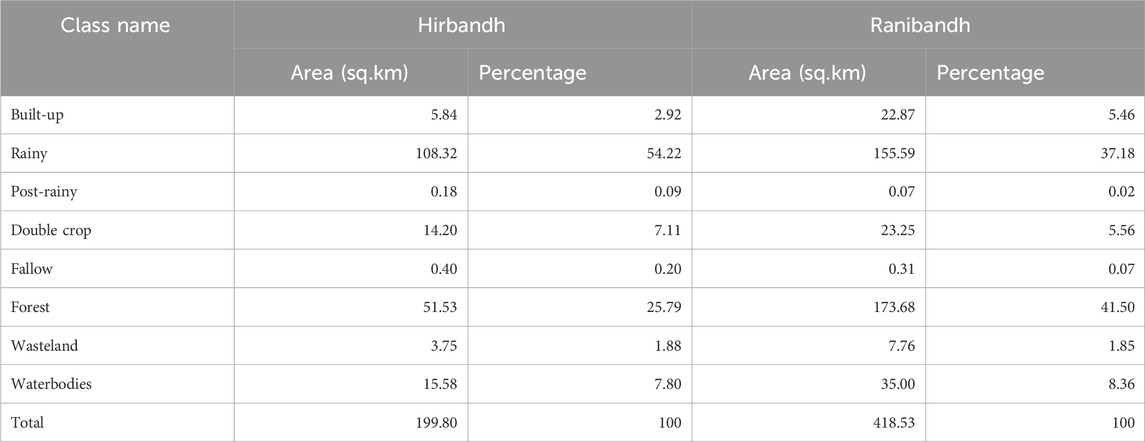
Table 3. Percentage of land use/land cover classes of the study area during 2020–21.
Analysis showed that the areas under built-up, post-rainy, forest, and waterbodies have not changed significantly (<1%) in the Ranibandh block. However, only the rainy season area increased by 13.4% due to the conversion of 7.5% of fallow land, 3.5% of the double crop land, and 2.5% of wasteland. Overall, Hirbandh and Ranibandh blocks experienced a similar type of conversion from one land use class to other classes. The existing cropping pattern in the region is presented in Supplementary Table S3, and it shows that paddy cultivation occupies 99% of the cropped area in the rainy season and only 6% in the post-rainy season. The post-rainy season was dominated by mustard (54%), followed by potato (18%) and watermelon 10%. Vegetables (other than potato) occupy only 6.4% of the cropped area as they are majorly grown from self-consumption rather than for the market. The post-rainy area occupies only 52% of the rainy season area (Supplementary Table S3), highlighting that farming during the post-rainy season is under constrained conditions. As paddy cultivation occupies major portion of the land, the study primarily focuses on paddy cultivars and the related factors of production.
The selected blocks fall under the “hot, dry, sub-humid ecological hub region” with the length of the rainfed crop-growing period (LGP) being approximately 150–180 days. The normal rainfall of the blocks was 1,556 mm/annum and 1,464 mm/annum, and nearly 75% of the total rainfall is received between June and September (Figure 6) and nearly 15% during the months of March–May. The post-rainy season receives only 8%–10% of the rainfall, which could be the main reason for the very low CI. High rainfall variability was observed during the monsoon season (high: 7%–8%) in the Hirbandh block, which led to decreased runoff during the monsoon season (2007–2021). The rainfall variability in the Ranibandh block is observed low (2%) during the monsoon season.
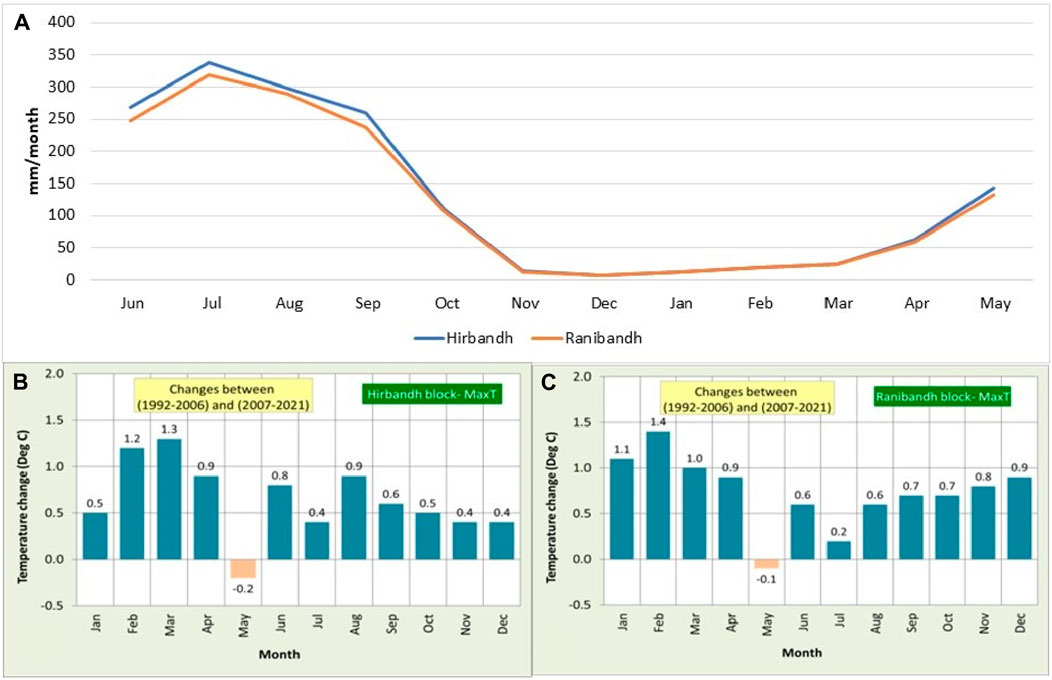
Figure 6. (A) Seasonal patterns of monthly rainfall in Hirbandh and Ranibandh blocks (B) and (C) long-term temperature changes in Hirbandh and Ranibandh blocks, respectively, calculated as mean (1992–2006) monthly averages–mean (2007–2021) monthly averages.
Although the period between May and June is the hottest with temperature as high as 45°C, the onset of southeast monsoons brings down temperature. The winter (November–January) temperature is between 22°C and 25°C (Figure 6), and this period is most suited for the cultivation of a variety of good quality vegetables. The meteorological data obtained from the local meteorological department indicate that the maximum temperature in Hirbandh and Ranibandh during the monsoon season increased by 0.20°C–0.40°C (winter) and 1.30°C–1.40°C (summer) (February/March), respectively. However, there was a decreasing trend in temperatures in May in both the blocks.
The sand content of 30 soil samples ranged from 43.04% to 82.32%, silt content ranged from 7.54% to 27.69%, and clay content ranged from 10.10% to 37.54% (Table 4). Light textured soils (high sand) have a low water holding capacity and require frequent rains or irrigations, as compared to heavy textured soils (high clay) which have a high water holding capacity (Pathak et al., 2009). The upland soils are light textural soils, and lowland soils are heavy textural soils as the clay content is comparatively higher (Table 4). Simple water budgeting obtained from model simulations (Supplementary Table S4) showed that 30%–44% of the runoff generated in these blocks is already captured by existing water storage structures (waterbodies). Although the soil moisture holding capacity of soils in the Ranibandh block is higher than that in Hirbandh block, the average water holding capacities of both soils are poor (35 mm–55 mm for a 50-cm depth of soil). Similarly, groundwater recharge was found high (9%) due to sandy loamy soils in both the blocks.
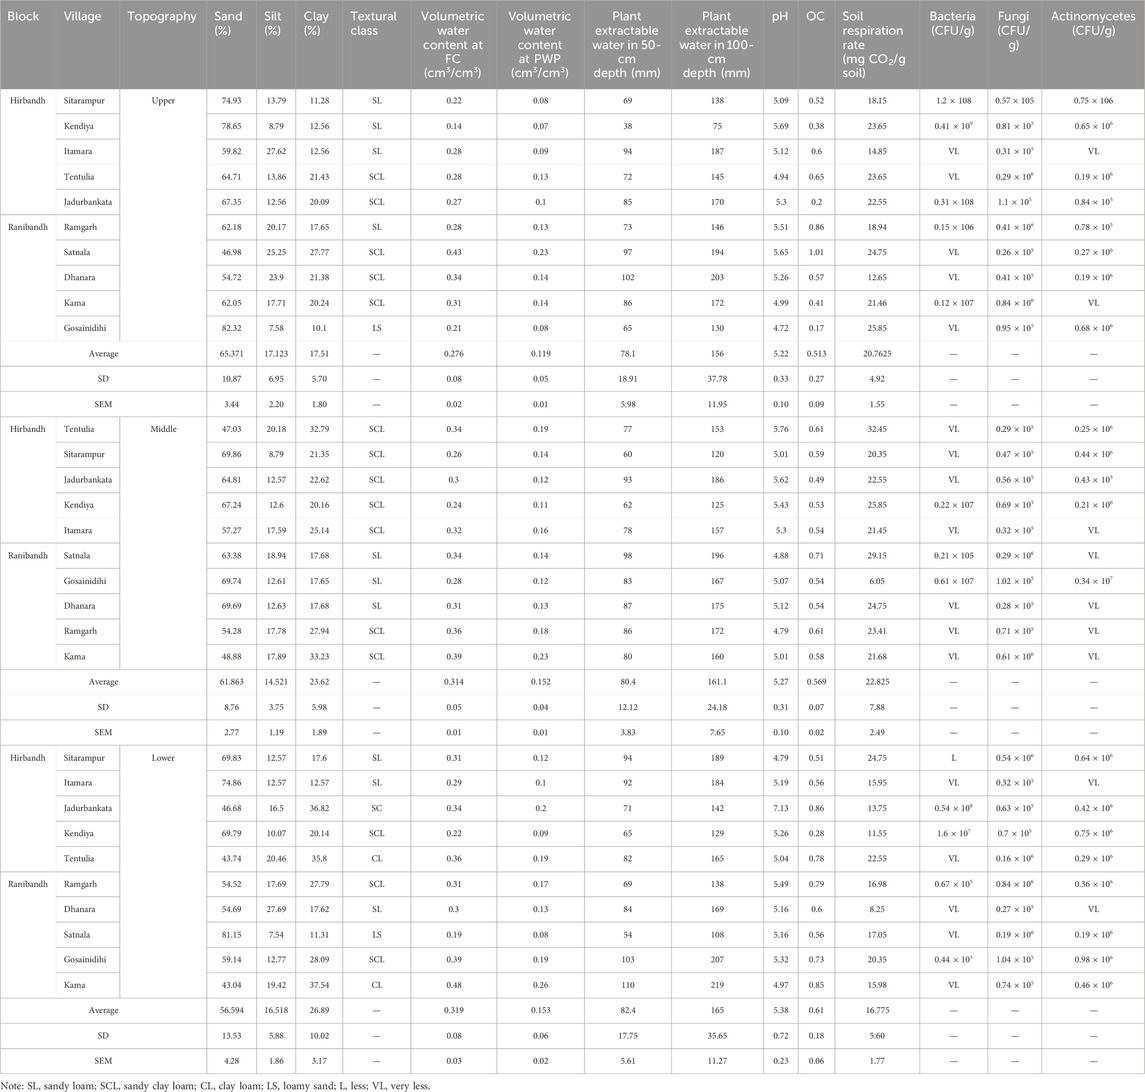
Table 4. Soil physicochemical and biological properties of the selected villages under Hirbandh and Ranibandh.
Water retention of Bankura soils at 0.33 bar field capacity (FC) varies from 0.14 to 0.48 cc/cc, whereas at 15 bar, permanent wilting point (PWP) varies from 0.07 to 0.26 cc/cc (Table 4). Alfisols are highly variable in depth, texture, bulk density, and stoniness; their water retention and transmission properties are very site-specific and must be judiciously evaluated for the specific areas in which quantitative studies of soil–plant–water relations are conducted (El-Swaify et al., 1985). Water availability to crops is affected by their rooting characteristics and soil physical properties (El-Swaify et al., 1985). The value of plant extractable water (PEW) for the Bankura soils in the top 50-mm layer varies from 38 mm to 110 mm, whereas, in the top 100 cm, depth varies from 75 mm to 219 mm (Table 4). Crop water requirements of various crops are wheat and maize, 500 to 600 mm; groundnut, 500 to 550 mm; sorghum/millets, 350 to 500 mm; sunflower, 400 to 500 mm; finger millet, 400 to 450 mm; chickpea, green gram, and black gram, 350 to 400 mm; mustard, 400 to 450 mm; safflower, 250 to 300 mm; and sesame, 200 to 250 mm. Since the plant extractable water of Bankura soils ranges from 75 to 219 mm in the top 100-cm layer (Table 4), we have to provide supplemental irrigations during critical crop growth stages during the post-rainy season to grow these crops successfully without any risk. Even though there is some rainfall during the post-rainy season but not enough to cover the water needs of the crops, irrigation water must supplement the rainwater in such a way that the rainwater and the irrigation water together cover the water needs of the crop (Brouwer and Heibloem, 1986). The analysis of physical properties indicates that due to the high sand content, the saturation capacity of both block soils is 40%–60% of their volumetric content, water holding capacity is low (6%–10%) due to low clay content, and the drainable limit is good (0.28%–40%), which leads to better groundwater recharge (Figure 7).
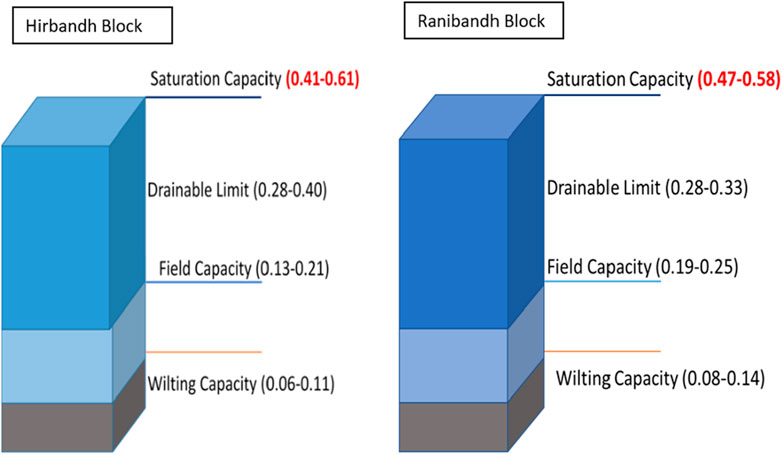
Figure 7. Water retention capacity of the soil.
The soil pH of both blocks ranged between 4.72 and 7.13, with an average soil pH of 5.29 (Table 4). The soil pH of Hirbandh and Ranibandh blocks was found to be acidic in reaction, and this might be due to granite being the parent material, sloppy land, and heavy rainfall, which cause leaching losses of basic cations, and the laterization process causes the accumulation of iron and aluminum oxide. More than 50% of soil samples are deficient in available phosphorus (P) (61.90%), sulfur (S) (70.48%), and boron (B) (94.29%) in the Hirbandh block (Figure 8). In the Ranibandh block, more than 50% of soil samples are deficient in available calcium (Ca) (68.57%), S (82.86%), and B (97.14%) (Figure 8). The soil organic carbon content (SOC) in Hirbandh and Ranibandh blocks varied from 0.17 to 1.01% and was categorized as low-to-high in the range. Furthermore, the highest SOC content was observed in Satnala village. Low SOC was observed in the Sitarampur and Jadurbankata villages of the Hirbandh block. The available potassium is less in the Sitarampur village (Figure 8).
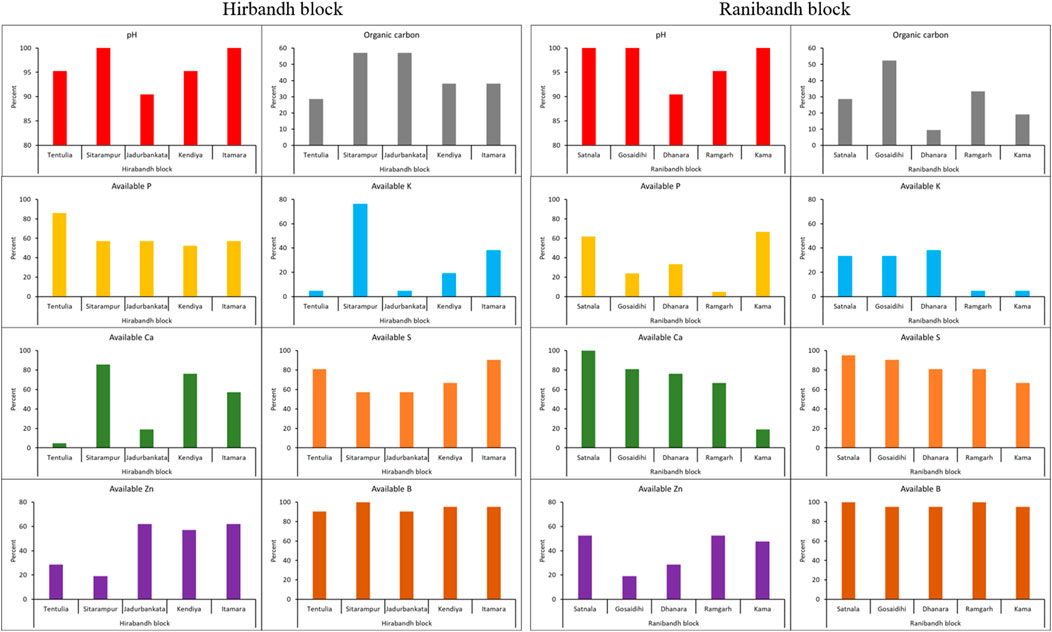
Figure 8. Village-wise percent-deficient soil samples in Hirbandh and Ranibandh blocks, Bankura, West Bengal.
The bacterial population was noticeably lower (Table 4) in most of the samples, irrespective of terrain (upper, middle, and lower), which might be due to the low-to-medium organic carbon content of the soil and the acidic nature of the soil. The fungal population (colony-forming units: CFU/g) was high compared to bacteria, which might be attributed to the acidic nature of the soil (Rousk et al., 2008). A study was conducted by Rousk et al., (2010) on the influence of soil pH on bacterial and fungal communities. The quantitative polymerase chain reaction (qPCR) results based on 16S rDNA revealed that the abundance of bacteria was increased four-fold with an increase in pH from 4 to 9, and no significant influence of pH was observed on fungal abundance. Similar results were also observed by Wang et al. (2022).
In the present study, we observed that sample BN-55 (L) from Jadurbankata village has a high SOC, i.e., 0.86%, which is the reason for the comparatively high microbial population (bacteria, fungi, and actinomycetes), compared to other samples. Therefore, field bunding in this region is an important intervention that could help retain moisture, which creates favorable conditions for microbial growth, resulting in an increase in the microbial population (Van et al., 2014). One of the most important biological indicators of soil health, indicating the presence of living organisms and their activities, is soil respiration. Although soil organic carbon (SOC) was reported to have a positive correlation with soil respiration, soil respiration is also influenced by factors like temperature, moisture, porosity, and soil type (Duan et al., 2021). In the present study, not all the samples tested for soil respiration had a positive correlation with SOC, which might be due to the presence of labile carbon (active carbon pool) that contributes to microbial activity and respiration (Cleveland et al., 2007). The samples were observed to have low-to-medium organic carbon and fewer bacteria compared to fungi.
As per the total microbial biomass, e.g., bacteria, fungi, and actinomycetes, it has been observed that the bacterial count was less in the samples. Soil acidity and low organic carbon content are contributing to the low microbial activity and less productivity of the soil. To improve the SOC content, practices like composting and incorporation of crop stubble into soil can be practiced. Vermicomposting and aerobic composting are two proven methods to practice composting at the rural level. Agroforestry practices and the presence of vegetation on bunds contribute to the accumulation of plant residues, fallen leaves, and other organic materials. These organic inputs gradually decompose, enriching the soil with organic carbon (Sarvade et al., 2014). The flora diversity found in agroforestry systems fosters the growth of soil microorganisms, which are essential for the breakdown of litter and the release of nutrients (Kumar, 2011).
The chemical analysis of water samples (Table 5) showed that water is not safe for drinking as arsenic levels are high. Arsenic (As) contamination poses a serious risk to human health. As per the World Health Organization (WHO), the minimum permissible safe limit of As in drinking water is 10 μg L−1, and as per the US Environmental Protection Agency (USEPA), the approved safe limit of As in soil is 24 mg kg−1. Drinking water contaminated with arsenic is the most common route of human exposure to arsenic contamination (Tandukar and Neku, 2002). The presence of As in paddy cultivation, if irrigated with arsenic-contaminated water, may vary depending on the cultivation method, cooking, irrigation methods, and fertilizer application practices. The immediate adverse impact of arsenic stress appears through up- or downregulation of the expression of transporters. Moreover, arsenic stress causes phytotoxic and genotoxic effects on plants by escalating lipid peroxidation levels, affecting the permeability of cell membranes. Arsenic stress reduces seed germination and growth of seedlings through the lower uptake of water and lowered amylase activity (Moulick et al., 2018). Grain quality and yield of rice decrease due to arsenic stress because of the decreased uptake of essential nutrients and alterations of physicochemical and biochemical properties of plants (Shri et al., 2019). The straighthead disease of rice is also caused due to arsenic stress, which manifests through the presence of distorted husks, sterile spikelets, unfilled grains, etc.
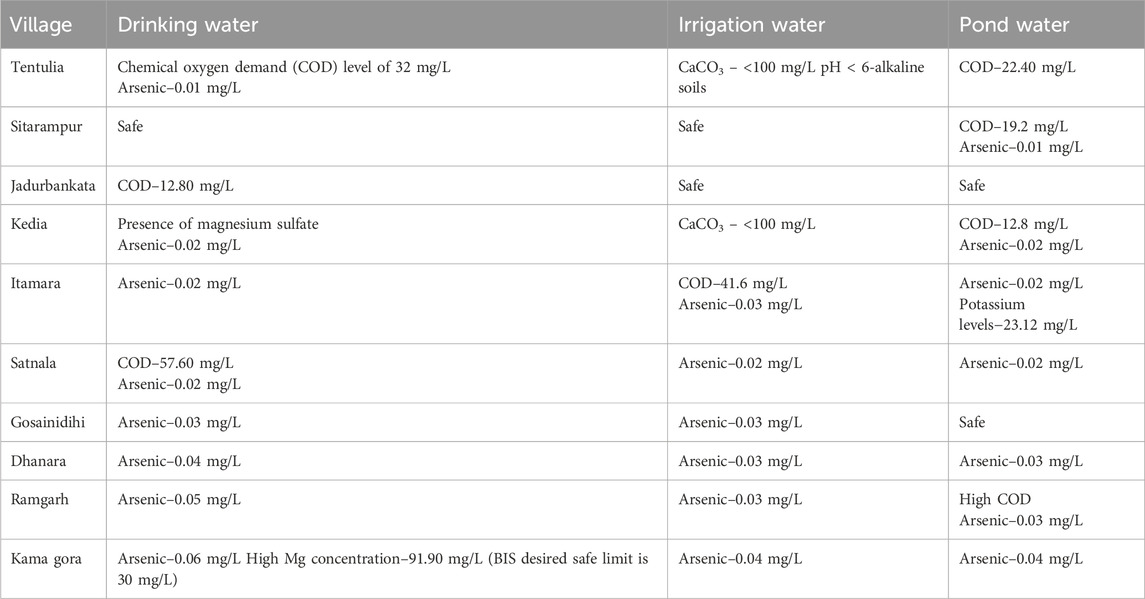
Table 5. Chemical analysis of water.
For site-specific management, a thorough understanding of soil variability and landscape properties, as well as their effects on crop yield, is very critical (Jiang and Thelen, 2004). In the two blocks of the study area, the suitable land for cultivation (midland) is 61%, which is distributed mostly in the mid-upland and mid-lowland (Figure 9A), whereas the remaining land (39%) is less productive due to poor water holding capacity and low fertility (Jana SK, 2011). The less productive lands are around 40%–50%, which is a major concern contributing to low cropping intensity and low system productivity in the study area. Most households in the region are marginal, with the average land holding below 0.5 ha (Figure 9B).
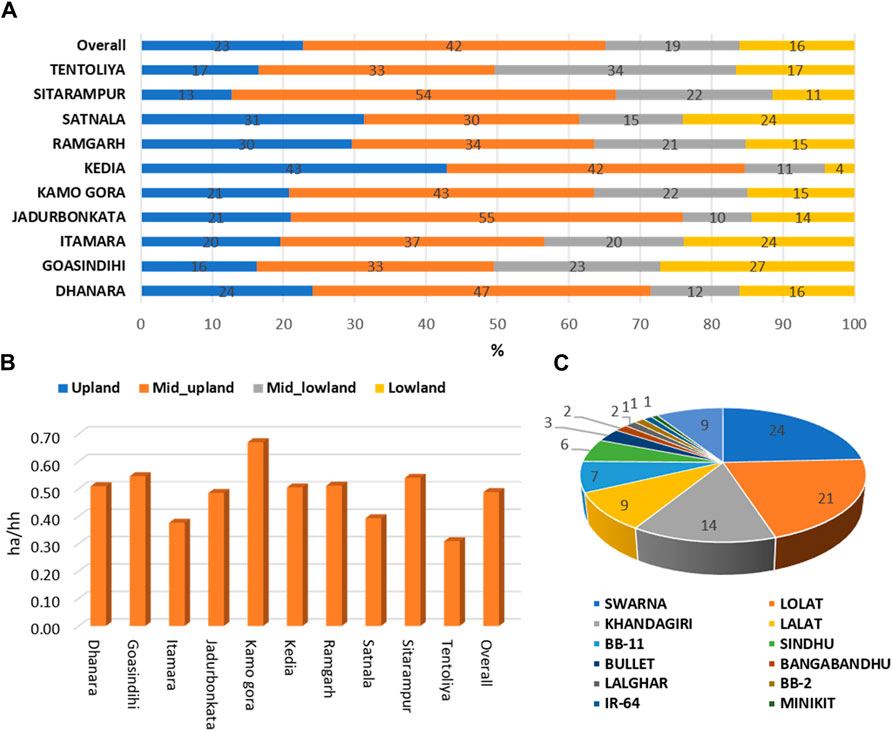
Figure 9. (A) Cropped area distribution by topology; (B) average size of land holding; and (C) share of paddy cultivars in the study area.
The average land holding was 0.53 ha/HH, with the highest in Kamo Gora (0.73 ha/HH) and lowest in Tentulia (0.34 ha/HH). This indicates the existence of marginalized communities across the villages, which are exposed to a variety of risks at the individual or household level (Mahendra, 2012). Studies proved that the farm size is positively related to technology adoption (Shang et al., 2021); thus, it depicts the reason for the subsistence level of farming in these two blocks. As the low size of land holding is not economical, the returns are affecting the reinvestment on the second crop. With respect to the paddy cultivars cultivated by the farmers, Swarna variety was cultivated by 24% of the farmers (Figure 9C), followed by Lolat (21%) and Khandagiri (14%), constituting about 59% of the land area under paddy cultivation (IET-10396). The cultivated paddy cultivars were short-duration cultivars like Lolat, Sindhu, Bullet, and IR-64, which occupy 31% of the cropped area, and the remaining cultivars occupy 69%. The varietal adoption pattern indicates that farmers are continuing the older varieties which were notified 20–30 years ago. Khandagiri (IET-10396) was notified in the year 1994 (DRD, Patna), Lolat was prior to it, and Swarna Sub-1 in 2009. Even though Swarna Sub-1 was a better variety under submergence/lowland conditions, because of its duration, the variety cannot sustain the terminal stress during the critical stages of growth. This shows that the farmers are not adopting the climate-resilient cultivars suitable for the region, and the topography might be due to non-availability in the study area or demand from the market. For example, Pushpa (notified in 2015) is a non-lodging, non-shattering, drought-tolerant early variety with 50% flowering in 79 days and seed-to-seed of 105 days during rainy season. Its average yield ranged from 4,500 to 5,000 kg ha−1, and its productivity was 8,216 kg ha−1 (Mallick et al., 2013). Hence, the extension activities with seed availability and market infrastructure need to be developed. The data on fertilizer (NPK) use pattern across the villages (Supplementary Table S5) infer that the application of phosphate fertilizers (e.g., DAP) was found to be high. The application of nitrogen fertilizers was less than the recommended dosage of 80 kg/ha in the majority of villages.
Most of the cultivars grown were old-ranging and cultivated irrespective of their suitability to the topology. Usually, short-duration varieties were in the uplands due to water deficit, medium-duration varieties in mid-lands, and long-duration varieties in the lowlands. However, the cultivars were grown irrespective of their suitability to topology (Figure 10A). This is mainly because of market demand for the varieties from neighboring districts like Assam, Jharkhand (SEMA, 2023), and Odisha and international demand from Bangladesh. Most of the previous studies employed aerobic or upland rice cultivars, whereas modern lowland cultivars typically exhibit longer growth durations and higher yield potential, particularly the super hybrid cultivars that are sensitive to unfavorable conditions and suitable for intensive cultivation (Bouman et al., 2006; Liu et al., 2019). We observed that in the uplands, short-duration crop varieties were typically found due to water scarcity, while medium-duration crop cultivars were found in the midlands and long-duration crop cultivars in the lowlands. This suggests that lowland rice cultivars, with their longer growth duration and higher growth potential, could benefit more from rainfall (Liu et al., 2019). In upland cultivation, rainfall accounted for 60%–85% of total water use during the growing season. Upland cultivars are bred with the specialty of shorter growth duration and lower aboveground biomass accumulation, which accounts for their lower yield performance under aerobic cultivation in Central China when compared to lowland cultivars (Zhao et al., 2010).
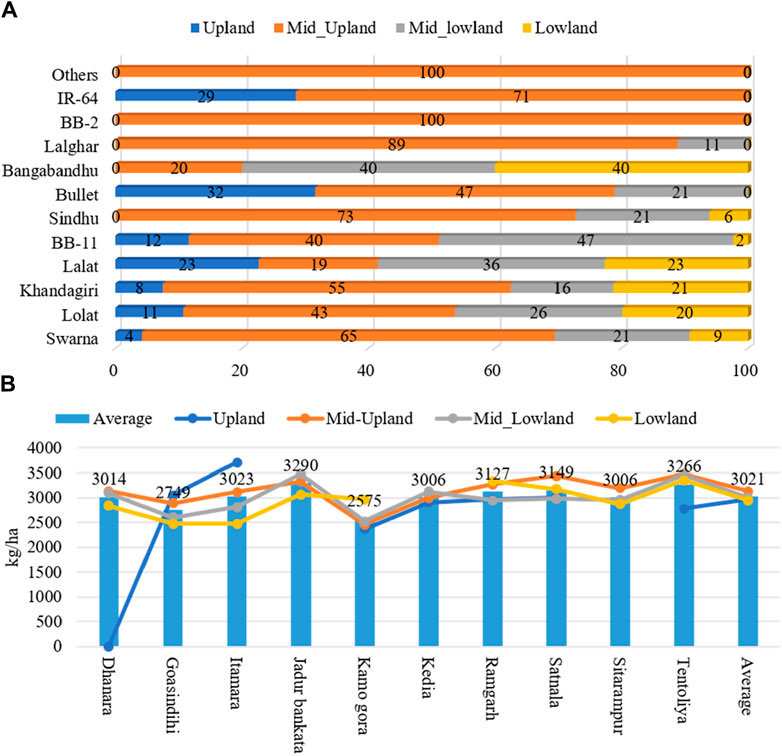
Figure 10. (A) Varietal selection across the topography and (B) paddy productivity by topology.
Scale-appropriate farm mechanization holds a key to the successful management of the farmland. Tractors and the associated machinery are primarily used during land preparation and seeding, whereas other machineries are less important during crop growth (Supplementary Figure S1). A study on the impact of farm mechanization on foodgrain productivity revealed that foodgrain productivity is higher in the states where farm power availability is high (Buragohain, 2021), which proves the need for introducing farm power through customer hiring centers (CHCs). The study revealed that most of the farm operations are carried out by labor, mostly family labor. The farmers are realizing low economic returns from the rainy season paddy cultivation.
The net returns observed were negative in many cases when the cost of family labor was included (Table 6) while calculating the total cost of cultivation (CoC). The results imply that economic returns are more relevant as the low net returns from rainy season paddy cultivation might be one of the essential factors affecting low investment in post-rainy cultivation. The study observed that because of low income from rainy season crops, the young members of the households tend to migrate to nearby towns, creating acute labor shortage during the post-rainy season. The average productivity of the existing varieties is 3,021 kg/ha, which is significantly on the lower side, as compared to the recently introduced variety, namely, Pushpa. The study further revealed that the farmers are realizing low economic returns from the rainy season paddy cultivation. The major reasons are low-yielding crop cultivars, low seed replacement rate, generalized selection of rice cultivars at all the typologies (for example, lowland, midland, and upland), imbalanced use of inorganic fertilizers, and unavailability of nutrients primarily secondary and micronutrients. The negative net returns in many cases reduce the capacity of farmers to invest not only for post-rainy crops but for next year’s rainy season crops.
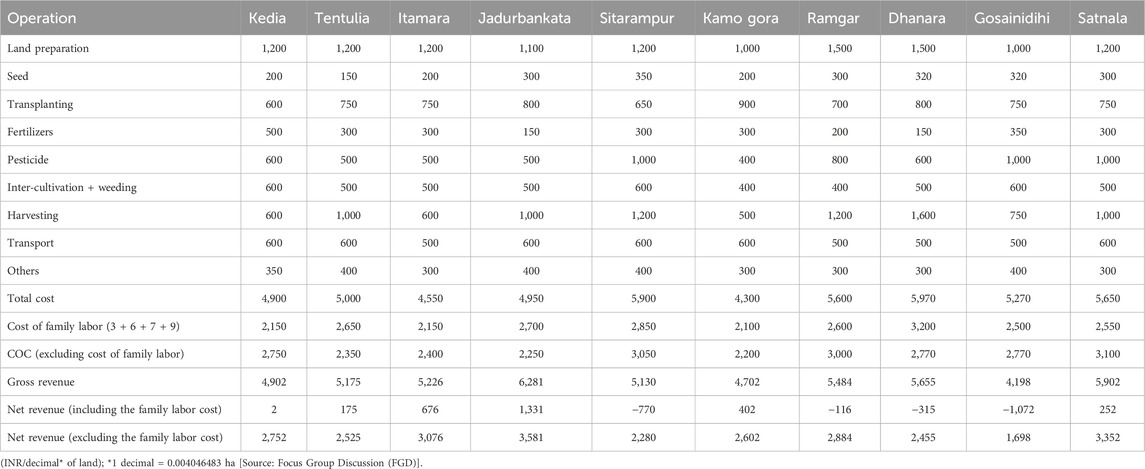
Table 6. Cost of cultivation of paddy.
Most of the farmers were from the middle age group (<45 years). The average age of the surveyed farmers was 42 years; the youngest (∼35 years) was observed in Satnala and Jadurbankata, whereas the oldest (∼50 years) was observed in Kadia and Ramgarh (Supplementary Figure S2). Most farmers were uneducated (40%), and only 3% of the respondents had completed their graduation (Supplementary Figure S3). About 50% of illiterates were observed at Satnala and Tentulia. The lowest level of illiteracy was found in Ramgarh (28%). The low levels of education could be attributed to high poverty levels and a lack of motivation to pursue higher education (Mwango, 2010). Moreover, low levels of education might affect the farming skills and productive capabilities of the farmers (Paltasingh and Goyari, 2018). Agriculture systems should adapt to uncertain climatic conditions by building sustainable resilience systems which require a dynamic understanding of agricultural systems and their interaction with climate and practices (Abhilash et al., 2021). The adoption of contemporary paddy varieties and, consequently, the farm production of adopters have been found to be considerably influenced by a minimum threshold level of education, according to Paltasingh and Goyari’s (2018) study on the impact of farmer education on farm productivity. The likelihood of applying agricultural inputs rises dramatically with higher education levels but falls with farmers’ ages (Sagar et al., 2022). Considering that the age group (>42 years) with low literacy rates is majorly engaged in rainfed farming, they are less receptive to the adoption of improved cultivars (Pushpa, MTU1140 TARANGINI, and MTU1001) over the early 1970s' traditional varieties (Lolat, Swarna, and Khandagiri) and climate-smart agricultural technologies.
We have determined the primary underlying causes of every issue that the farming communities who are most at risk are dealing with, and we have also talked about the best ways to address each of the 5Ms. Government programs must, however, play a crucial role in helping farming communities that are most vulnerable to changes in the climate, the availability of resources, and other factors that affect sustainable agriculture. Even with numerous government initiatives designed to assist small and marginal farms, awareness building is still necessary.
Low rainfall and excess draining out of water are resulting in low cropping intensity and low system productivity in the studied regions of West Bengal. Farmers need to enhance crop diversification by cultivating multiple crops that positively impact the farm income of households of small and marginal farmers (Lama, 2016). There are several schemes initiated by the Indian government for the benefit of small and marginal farmers in order to enhance crop productivity. The national scheme, i.e., Rainfed Area Development (RAD) was launched to support integrated farming systems (IFS), which emphasize intercropping, rotational cropping, mixed cropping, and other related practices. The Pradhan Mantri Kisan Samman Nidhi (PMKISAN) was launched to help land-holding farmers meet their financial needs, the Pradhan Mantri Kisan Maan Dhan Yojana (PMKMY) was launched to provide stability and financial assistance to the most vulnerable farming households; and the Pradhan Mantri Fasal Bima Yojana (PMFBY) was launched to offer farmers a straightforward and reasonably priced crop insurance solution that would guarantee full crop risk coverage against all unavoidable natural hazards from planting to harvest, as well as a sufficient claim amount, and the minimum support price (MSP) for all required commercial crops with a minimum 50% return, including rainy and post-rainy seasons.
Due to low soil organic carbon, there are multi-nutrient deficiencies and poor water holding capacity and, as a result, declined crop productivity in the dryland farming soils of studied regions. Hence, there is a great necessity for improving SOC in these areas to deal with moisture stress and nutrient deficiencies. The Indian government has taken several initiatives for soil carbon and water storage specifically in drylands. The Mahatma Gandhi National Rural Employment Guarantee Act (MGNREGA) and the National Mission for Sustainable Agriculture (NMSA) were launched to maintain agricultural productivity by conserving natural resources like water and soil while also advancing rainfed agriculture in India. The Soil Health Card (SHC) mission is to enhance the soil fertility status by providing fertilizer recommendations based on soil tests. However, 82% of the farmers were aware of the SHC plan, only 66% of them could grasp the guidelines, and only 48% of them applied fertilizer at the prescribed rate (Reddy, 2019). Hence, it is high time to create awareness about the SHC among the farmers. The Rashtriya Krishi Vikas Yojana (RKVY) supports the overall growth of agriculture and related industries by conserving water and soil, enhancing farmer effort, reducing risk, and encouraging agribusiness entrepreneurship.
Farm mechanization and potential management practices are other major problems that are noticed in the studied regions. In the investigated areas, the majority of small and marginal farmers lack formal education; nonetheless, they can still receive assistance and benefit from government programs. The Sub-Mission on Agriculture Automation (SMAM) has been launched by the Indian government to employ drones to apply fertilizer and pesticides in public areas, as well as to expand the use of farm automation to small and marginal farmers. The Indian government has made funds available for plant protection equipment, tractors, power tillers, self-propelled machinery, custom hiring centers, hi-tech hubs, and farm machinery banks under this program. The Per Drop More Crop (PDMC) scheme uses micro-irrigation technology, such as sprinkler and drip irrigation systems, to improve farm-level water consumption efficiency. Furthermore, the scheme Mission for Integrated Development of Horticulture (MIDH) was launched for the holistic growth of the horticultural industry.
The global commitments/agreements such as the Paris Climate Change Agreement and the 4 per mille concept are also committed by India to the mitigation of GHG emissions and enhance soil carbon sink. Achieving these goals would immensely contribute to the overall succession of sustainable development goals (SDGs) such as #SDG-1: no poverty; #SDG-2: zero hunger; #SDG-13: climate action; and #SDG-15: life on land, and also help in achieving the land degradation neutrality (LDN) in the global dryland farming soils. However, there is no “one-size-fits-all” solution to the complex problems, primarily pertaining to dryland farming systems. Taking into account the current situation as identified under the 5M approach, building soil carbon, increasing cropping system diversification, improvising farm mechanization, and raising farmer community awareness of the benefits of various government schemes are some of the “win–win” strategies to unlock the potential of dryland soils. These initiatives are required to be scaled through various national and state government initiatives, which are present in every developing country.
Envirotyping of agroecology using the 5M concept not only helps in characterizing and quantifying the environmental factors but also complements in achieving system profitability through tailored advocacy of climate-resilient landscape-specific technologies, particularly in rainfed agro-ecologies like Bankura, West Bengal, India. In conditions like low cropping intensity, the root causes are low organic carbon and soil microbial population, particularly bacteria and actinomycetes in soils. Farmers need to be encouraged and facilitated to apply bacterial inoculum/culture comprising Azospirillum/Rhizobium, phosphate-solubilizing bacteria (PSB), and vesicular arbuscular mycorrhiza (VAM). Climate-resilient agriculture practices like cropping system diversification, cover crops, soil mulching, zero-tillage, biochar, green manuring, and agroforestry, need to be promoted to build soil organic carbon and retain the residual soil moisture levels. Sandy soils with low pH tends to have sulfur deficiency, and soils rich in iron and bauxites shows boron deficiency due to the chemical interaction between iron and bauxite and subsequent leaching of boron. Hence, a basal application or foliar application of boron is recommended, and sulfur deficiency can be addressed by replacing urea with ammonium sulfate. Economic returns can be maximized by forming farmer collectives. Climate-resilient and topography-suitable varieties need to be promoted through farmer collectives for the efficient utilization of available soil moisture regime and thereby enhancing cropping intensity. Farmer collectives need to encourage where the land holding is small and net income realization is low. In a nutshell, the present agronomic diagnostic study could be referred as a model to help development agencies, government institutions and policy makers understand the root cause analysis of the pertinent problems and design suitable interventions/policy frameworks in a short period for similar agro-ecologies.
The limitation to the study was that the role of government or enabling systems was not covered by the research team, which is important for policy advocacy and scaling the recommendations at landscape level. The diagnostic study was limited to soils with high sand content where available soil moisture was low for the second season. The study emphasized more on the scientific evidence, and the human interaction with the environment was not properly explored due to the time and budgetary constraints.
The original contributions presented in the study are included in the article/Supplementary Material, further inquiries can be directed to the corresponding author.
GS: conceptualization, methodology, project administration, supervision, writing–original draft, and writing–review and editing. MD: conceptualization, data curation, formal analysis, methodology, supervision, validation, writing–original draft, and writing–review and editing. SR: data curation, formal analysis, methodology, validation, and writing–review and editing. PK: formal analysis, validation, and writing–review and editing. RK: conceptualization, methodology, supervision, and writing–review and editing. RN: data curation, formal analysis, and writing–review and editing. RP: data curation, formal analysis, methodology, validation, and writing–review and editing. PC: data curation, formal analysis, methodology, and writing–review and editing. AD: data curation, formal analysis, methodology, and writing–review and editing. VA: data curation, formal analysis, methodology, and writing–review and editing. SD: conceptualization, methodology, supervision, and writing–review and editing. RS: supervision, writing–review and editing. MJ: supervision, writing–review and editing.
The authors declare that financial support was received for the research, authorship, and/or publication of this article. This study was funded by the consortium led by Professional Assistance for Development Action (PRADAN), India, which was supported by Hindustan Unilever Foundation (HUL), India, as a part of a project on “Agronomic Diagnostics Study of Bankura region in West Bengal.”
The authors would like to gratefully acknowledge financial support from PRADAN and Hindustan Unilever Foundation (HUL), India. They would also like to thank the staff of PRADAN and the farmers of the Bankura region for their active support during the agronomy diagnostic study.
The authors declare that the research was conducted in the absence of any commercial or financial relationships that could be construed as a potential conflict of interest.
All claims expressed in this article are solely those of the authors and do not necessarily represent those of their affiliated organizations, or those of the publisher, the editors, and the reviewers. Any product that may be evaluated in this article, or claim that may be made by its manufacturer, is not guaranteed or endorsed by the publisher.
The Supplementary Material for this article can be found online at: https://www.frontiersin.org/articles/10.3389/fenvs.2024.1417199/full#supplementary-material
Abhilash, S. C., Rani, A., Kumari, A., Singh, R. N., and Kumari, K. (2021). “Climate-smart agriculture: an integrated approach for attaining agricultural sustainability,” in Climate change and resilient food systems: issues, challenges, and way forward (Singapore, Singapore: Springer), 141–189.
Alpha, M. M., Patience, S., and Paidamoyo, P. C. (2021). Root cause analysis of factors associated with high cost of dairy feed under the Zimbabwean stock feed manufacturing sector. World Acad. J. Manag. 9 (3), 37–44.
Anderson, J. P. E. (1982). “Soil respiration,” in Methods of soil analysis: part 2 chemical and microbiological properties. Editor A. L. Page (Madison: Agronomy Monograph, ASA and SSSA), 831–871.
Batan, E. L. (2017). New environmental analysis method improves crop adaptation to climate change. August 15, Mexico (CIMMYT). Available at: https://www.cimmyt.org/news/new-publications-new-environmental-analysis-method-improves-crop-adaptation-to-climate-change/.
Bera, K., and Bandyopadhyay, J. (2017). Drought analysis for agricultural impact through geoinformatic based indices, A case study of Bankur district, West Bengal, India. J. Remote Sens. GIS 6 (209), 2. doi:10.4172/2469-4134.1000209
Bouman, B. A. M., Yang, X., Wang, H., Wang, Z., Zhao, J., and Chen, B. (2006). Performance of aerobic rice varieties under irrigated conditions in North China. Field Crop. Res. 97, 53–65. doi:10.1016/j.fcr.2005.08.015
Brahmanand, P. S., Behera, B., Srivastava, S. K., Singandhupe, R. B., and Mishra, A. (2021). Cultivated land utilization index vis-a-vis cropping intensity for crop diversification and water resource management in Odisha, India. Curr. Sci. 120 (7), 1217. doi:10.18520/cs/v120/i7/1217-1224
Bray, R. H., and Kurtz, L. T. (1945). Détermination du phosphoreorganique total et des formesdisponibles dans les sols. Soil. Sci. 59, 39–46. doi:10.1097/00010694-194501000-00006
Brouwer, C., and Heibloem, M. (1986). Irrigation water management: irrigation water needs. Train. Man. 3, 1–5.
Buragohain, T. (2021). Impact of farm mechanisation on foodgrain productivity in India. Agric. Situat. India LXXVII, 13–19.
Chaudhary, A., Verones, F., De Baan, L., and Hellweg, S. (2015). Quantifying land use impacts on biodiversity: combining species–area models and vulnerability indicators. Environ. Sci. Technol. 49, 9987–9995. doi:10.1021/acs.est.5b02507
Cleveland, C. C., Nemergut, D. R., Schmidt, S. K., and Townsend, A. R. (2007). Increases in soil respiration following labile carbon additions linked to rapid shifts in soil microbial community composition. Biogeochemistry 82, 229–240. doi:10.1007/s10533-006-9065-z
De, P., Deb, S., Deb, D., Chakraborty, S., Santra, P., Dutta, P., et al. (2022). Soil quality under different land uses in eastern India: evaluation by using soil indicators and quality index. PLoS One 17 (9), e0275062. doi:10.1371/journal.pone.0275062
District Disaster Management Cell (2017). District disaster management plan. Bankura, West Bengal: District Disaster Management Cell.
District Disaster Management Cell (2021). District disaster management plan. Bankura, West Bengal: District Disaster Management Cell.
Duan, L., Liu, T., Ma, L., Lei, H., and Singh, V. P. (2021). Analysis of soil respiration and influencing factors in a semiarid dune–meadow cascade ecosystem. Sci. Total Environ. 796, 148993. doi:10.1016/j.scitotenv.2021.148993
El-Swaify, S. A., Pathak, P., Rego, T. J., and Singh, S. (1985). Soil management for optimized productivity under rainfed conditions in the semi-arid tropics. Adv. Soil Sci. 1, 1–64. doi:10.1007/978-1-4612-5046-3_1
Gulati, A., and Juneja, R. (2022). “Transforming Indian agriculture,” in Indian agriculture towards 2030. India studies in business and economics. Editors R. Chand, P. Joshi, and S. Khadka (Singapore, Singapore: Springer). doi:10.1007/978-981-19-0763-0_2
Jana, S. K. (2011). Sustainable small scale irrigation experiment in the dry zones: a case study on happa (small tank) model in the state of West Bengal, India, mpra paper No. 29553. Available at: https://mpra.ub.uni-muenchen.de/29553/.
Jiang, P., and Thelen, K. D. (2004). Effect of soil and topographic properties on crop yield in a North-Central corn–soybean cropping system. Agron. J. 96 (1), 252–258. doi:10.2134/agronj2004.0252
Kumar, B. M. (2011). Quarter century of agroforestry research in Kerala: an overview. J. Trop. Agric. 49 (1-2), 1–18.
Kumhálová, J., Kumhála, F., Kroulík, M., and Matějková, Š. (2011). The impact of topography on soil properties and yield and the effects of weather conditions. Precis. Agric. 12, 813–830. doi:10.1007/s11119-011-9221-x
Lama, M. (2016). Crop diversification and farm income in the hills of North East India: a Case study of Arunachal Pradesh. Int. J. Food Agric. Vet. Sci. 6 (2), 15–21.
Lindsay, W. L., and Norvell, W. A. (1978). Development of a DTPA soil test for zinc, iron, manganese, and copper. Soil Sci. Amer. J. 42, 421–428. doi:10.2136/sssaj1978.03615995004200030009x
Liu, H., Zhan, J., Hussain, S., and Nie, L. (2019). Grain yield and resource use efficiencies of upland and lowland rice cultivars under aerobic cultivation. Agronomy 9 (10), 591. doi:10.3390/agronomy9100591
Mahendra, D. S. (2012). Small farmers in India: challenges and opportunities, WP-2012-014. Mumbai, India: Indira Gandhi Institute of Development Research. Available at: http://www.igidr.ac.in/pdf/publication/WP-2012-014.pdf.
Makate, C., Wang, R., Makate, M., and Nelson, M. (2016). Crop diversification and livelihoods of smallholder farmers in Zimbabwe: adaptive management for environmental change. Springer Plus 5, 1135. doi:10.1186/s40064-016-2802-4
Mallick, G. K., Mondal, M., Jana, K., Ghosh, A., and Biswas, A. (2013). PUSPA–a new rice variety alternative to Annada, released for upland areas of West Bengal, India. Ecol. Environ. Conserv. 19 (4), 1127–1129.
Mondal, A. (2019). Land capability classification of Bankura district, West Bengal. Indian J. Spat. Sci. 10 (1), 87–91.
Mondal, T. K., and Sarkar, S. (2021). Analysis of cropping intensity and irrigation intensity in North Twenty Four Parganas district, West Bengal, India. Misc. Geogr.– Regional Stud. Dev. 25 (4), 246–258. doi:10.2478/mgrsd-2020-0063
Moulick, D., Chandra Santra, S., and Ghosh, D. (2018). Rice seed priming with Se: a novel approach to mitigate as induced adverse consequences on growth, yield and as load in brown rice. J. Hazard. Mater. 355, 187–196. doi:10.1016/j.jhazmat.2018.05.017
Murumbi, F. (2014). “Root cause analysis in horticulture exporting firms in Kenya,”. Doctoral dissertation (Nairobi, Kenya: University of Nairobi).
Mwango, N. H. (2010). “Community traditional knowledge, perceptions and response to flood risks in nyando basin, western Kenya,”. A Thesis submitted in partial fulfilment for the award of the Degree of Master of Public Health in the School of Health Sciences (Nairobi, Kenya: Kenyatta University).
National Bureau of Soil Survey and Land Use Planning (2013). Soils of Bankura district, (West Bengal) for land use planning. Nagpur, Maharashtra: NRM-NBSSLUP-Publication, 1–122.
Nelson, D. W., and Sommers, L. E. (1996). Total carbon, organic carbon, and organic matter. Methods soil analysis part 3 Chemical methods. Madison, WI: SSSA Book Series No. 5, SSSA and ASA vol 5, 961–1010. doi:10.2136/sssabookser5.3.c34
Okalebo, J. R., Gathua, K. W., and Woomer, P. L. (1993). Laboratory methods of soil and plant analysis: a working manual–KARI. Nairobi, Kenya: UNESCO−ROSTA, 88.
Paltasingh, K. R., and Goyari, P. (2018). Impact of farmer education on farm productivity under varying technologies: case of paddy growers in India. Agric. Econ. 6, 7. doi:10.1186/s40100-018-0101-9
M. L. Parry, O. F. Canziani, J. P. Palutikof, P. J. van der Linden, and C. E. Hanson (2007). Climate change 2007: impacts, adaptation and vulnepost rainylity. Contribution of working group II to the fourth assessment report of the Intergovernmental Panel on Climate Change (Cambridge, Uinted Kingdom: Cambridge University Press).
Pathak, P., Sahrawat, K. L., Wani, S. P., Sachan, R. C., and Sudi, R. (2009). “Opportunities for water harvesting and supplemental irrigation for improving rainfed agriculture in semi-arid areas,” in Rainfed agriculture: unlocking the potential (Wallingford, Uinted Kingdom: CABI), 197–221.
Rahim, K. M. B., Majumder, D., and Biswas, R. K. (2011). Determinants of stagnation in productivity of important crops in West Bengal. India: Agro-Economic Research Centre Visva-Bharati Santiniketan.
Rao, C. S., Kareemulla, K., Krishnan, P., Murthy, G. R. K., Ramesh, P., Ananthan, P. S., et al. (2019). Agro-ecosystem based sustainability indicators for climate resilient agriculture in India: a conceptual framework. Ecol. Indic. 105, 621–633. doi:10.1016/j.ecolind.2018.06.038
Reddy, A. A. (2019). The soil health card Scheme in India: lessons learned and challenges for replication in other developing countries. J. Nat. Resour. Policy Res. 9 (2), 124–156. doi:10.5325/naturesopolirese.9.2.0124
Reddy, A. A., Bhattacharya, A., Reddy, S. V., and Ricart, S. (2021). Farmers’ distress index: an approach for an action plan to reduce vulnerability in the drylands of India. Land 10 (11), 1236. doi:10.3390/land10111236
Rhoades, J. D. (1996). “Salinity: electrical conductivity and total dissolved solids,” in Methods of soil analysis: Part 3 Chemical methods, 5 (Madison, USA: Soil Science Society of America), 417–435.
Rousk, J., Bååth, E., Brookes, P. C., Lauber, C. L., Lozupone, C., Caporaso, J. G., et al. (2010). Soil bacterial and fungal communities across a pH gradient in an arable soil. ISME J. 4 (10), 1340–1351. doi:10.1038/ismej.2010.58
Rousk, J., Demoling, L. A., Bahr, A., and Bååth, E. (2008). Examining the fungal and bacterial niche overlap using selective inhibitors in soil. FEMS Microbiol. Ecol. 63 (3), 350–358. doi:10.1111/j.1574-6941.2008.00440.x
Roy, P., and Kaur, M. (2015). Status and problems of paddy straw management in West Bengal. Int. J. Agric. Environ. Eng. 1, 44–48.
Sagar, G. G. M., Khan, M., and Blay, J. K. (2022). Factors determining adoption of bhoochetana scheme by farmers in rainfed agriculture of Karnataka: a probit analysis. Econ. Aff. New Delhi 67, 43–48. doi:10.46852/0424-2513.1.2022.9
Sahrawat, K. L., Murthy, K. V. S., and Wani, S. P. (2009). Comparative evaluation of Ca chloride and Ca phosphate for extractable sulfur in soils with a wide range in pH. J. Plant. Nutr. Soil Sci. 172 (3), 404–407. doi:10.1002/jpln.200800005
Sanders, E. R. (2012). Aseptic laboratory techniques: plating methods. J. Vis. Exp. 63, e3064. doi:10.3791/3064
Sarvade, S., Singh, R., Prasad, H., and Prasad, D. (2014). Agroforestry practices for improving soil nutrient status. Pop. Kheti 2 (1), 60–64.
SEMA (2023). Report on Assam and Jharkhand rice value chain. India: SEMA Equipment and Energy Private Limited. Available at: https://selcofoundation.org/wp-content/uploads/2023/06/Report-Rice-Value-Chain-Assam-Jharkhand-01-05-2023-merged.pdf.
Shang, L., Heckelei, T., Gerullis, M. K., Börner, J., and Rasch, S. (2021). Adoption and diffusion of digital farming technologies-integrating farm-level evidence and system interaction. Agri. Sys. 190, 103074. doi:10.1016/j.agsy.2021.103074
Shri, M., Singh, P. K., Kidwai, M., Gautam, N., Dubey, S., Verma, G., et al. (2019). Recent advances in arsenic metabolism in plants: current status, challenges and highlighted biotechnological intervention to reduce grain arsenic in rice. Metallomics 11, 519–532. doi:10.1039/C8MT00320C
Srinivasarao, C., Venkateswarlu, B., Wani, S. P., Sahrawat, K. L., Dixit, S., Kundu, S., et al. (2010). Productivity enhancement and improved livelihoods through participatory soil fertility management in tribal districts of Andhra Pradesh. Indian J. Dryland Agric. Res. 25 (2), 23–32.
Srinivasarao, C., Venkateswarlu, B., Lal, R., Singh, A. K., and Kundu, S. (2013). Sustainable management of soils of dryland ecosystems of India for enhancing agronomic productivity and sequestering carbon. Adv. Agron. 121, 254–329. doi:10.1016/B978-0-12-407685-3.00005-0
Srinivasarao, Ch., Vittal, K. P. R., Venkateswarlu, B., Wani, S. P., Sahrawat, K. L., Marimuthu, S., et al. (2009). Carbon stocks in different soil types under diverse rainfed production systems in tropical India. Commun. Soil Sci. Plant Anal. 40 (15), 2338–2356. doi:10.1080/00103620903111277
Sugata, H., Sabita, R., and Sujit, M. (2017). Enhancing adaptive capacity and increasing resilience of small and marginal farmers of purulia and Bankura districts, West Bengal to climate change. Kolkata, India: School of Oceanographic Studies Jadavpur University.
Tabatabai, M. A. (1996). “Sulfur,” in Methods of soil analysis, part 3: chemical methods. Editor D. L. Sparks (Madison, Wisconsin: SSSA and ASA), 921–960. Soil Science Society of America Book Series No. 5.
Tandukar, N., and Neku, A. (2002). “Arsenic contamination in groundwater in Nepal - an overview,” in Fifth International Conference on Arsenic Exposure and Health Effects, San Diego, July 14-18, 2002.
Thenkabail, P., Enclona, E. A., Legg, C., and De Dieu, M. J. (2004). Hyperion, IKONOS, ALI, and ETM+ sensors in the study of African rainforests. Remote Sens. Environ. 90 (1), 23–43. doi:10.1016/j.rse.2003.11.018
Van, D. J., Okie, J. G., Buelow, H. N., Gooseff, M. N., Barrett, J. E., and Takacs-Vesbach, C. D. (2014). Soil microbial responses to increased moisture and organic resources along a salinity gradient in a polar desert. Appl. Environ. Microbiol. 80 (10), 3034–3043. doi:10.1128/aem.03414-13
Velpuri, N. M., Thenkabail, P. S., Gumma, M. K., Biradar, C. M., Dheeravath, V., Noojipady, P., et al. (2009). Influence of resolution in irrigated area mapping and area estimation. Photogramm. Eng. Remote Sens. 75 (12), 1383–1395. doi:10.14358/pers.75.12.1383
Wang, T., Cao, X., Chen, M., Lou, Y., Wang, H., Yang, Q., et al. (2022). Effects of soil acidification on bacterial and fungal communities in the Jiaodong peninsula, Northern China. Agronomy 12 (4), 927. doi:10.3390/agronomy12040927
Wilhite, D. A. (2000). Drought as a natural hazard: concepts and definitions. Drought: a global assessment. London, United Kingdom: Routledge Publishers, 16.
Wilhite, D. A., and Glantz, M. H. (1985). Understanding: the drought phenomenon: the role of definitions. Water Inter. 10 (3), 111–120. doi:10.1080/02508068508686328
Worthington, J., Dockum, S., and Smith, A. (2024).Root cause analysis as a problem solving tool for leaders and managers: application to environmental measurement systems, 2014 national environmental monitoring conference. Washington, DC. August 4–8, 2014.
Xu, Y. (2016). Envirotyping for deciphering environmental impacts on crop plants. Theor. Appl. Genet. 129, 653–673. doi:10.1007/s00122-016-2691-5
Zhao, D. L., Amante, M., Cruz, M. T. S., Atlin, G. N., and Kumar, A. (2010). Developing aerobic rice cultivars for water-short irrigated and drought-prone rainfed areas in the tropics. Crop. Sci. 50, 2268–2276. doi:10.2135/cropsci2010.10.0028
Keywords: envirotyping, soil health, rainfed agriculture, soil degradation, climate-resilient agriculture, crop productivity
Citation: Sawargaonkar GL, Davala MS, Rakesh S, Kamdi PJ, Khopade RY, Nune R, Pasumarthi R, Choudhari P, Datta A, Akuraju VR, Dixit S, Singh R and Jat ML (2024) Envirotyping helps in better understanding the root cause of success and limitations of rainfed production systems. Front. Environ. Sci. 12:1417199. doi: 10.3389/fenvs.2024.1417199
Received: 14 April 2024; Accepted: 02 August 2024;
Published: 03 September 2024.
Edited by:
Jing Zhao, Xi’an University of Technology, ChinaReviewed by:
Germano Costa-Neto, Syngenta, United StatesCopyright © 2024 Sawargaonkar, Davala, Rakesh, Kamdi, Khopade, Nune, Pasumarthi, Choudhari, Datta, Akuraju, Dixit, Singh and Jat. This is an open-access article distributed under the terms of the Creative Commons Attribution License (CC BY). The use, distribution or reproduction in other forums is permitted, provided the original author(s) and the copyright owner(s) are credited and that the original publication in this journal is cited, in accordance with accepted academic practice. No use, distribution or reproduction is permitted which does not comply with these terms.
*Correspondence: Gajanan L. Sawargaonkar, Z2FqYW5hbi5zYXdhcmdhb25rYXJAaWNyaXNhdC5vcmc=
Disclaimer: All claims expressed in this article are solely those of the authors and do not necessarily represent those of their affiliated organizations, or those of the publisher, the editors and the reviewers. Any product that may be evaluated in this article or claim that may be made by its manufacturer is not guaranteed or endorsed by the publisher.
Research integrity at Frontiers
Learn more about the work of our research integrity team to safeguard the quality of each article we publish.