 Syed Ahmed Raza
 Li Zhang
 Jian Zuo1,2,3
- 1Key Laboratory of Digital Earth Science, Aerospace Information Research Institute, Chinese Academy of Sciences, Beijing, China
- 2International Research Center of Big Data for Sustainable Development Goals, Beijing, China
- 3University of Chinese Academy of Sciences, Beijing, China
Sustainable Development Goal-14 (SDG-14) directly demands the protection, conservation, restoration, and sustainable management of the global mangrove ecosystem. Assessment of the development Pakistan has made toward the sustainable management of mangrove ecosystems necessitates the remote sensing-based evaluation of national-level mangrove cover. Using Google Earth Engine (GEE) for geoprocessing 12,000+ 10-m high-spatial resolution Sentinel-2 time-series images (2016–23) and applying random forest (RF) classifier, the current research provides the latest spatial distribution of mangroves along Pakistan’s coastline and changes observed for a duration of 8 years. Additionally, this research provides the first spatiotemporal health assessment of Pakistan’s national mangrove cover as well. Rational analysis of the results indicated splitting the entire timeline based on two seasons (Jan–Jun and Jul–Dec). Results revealed an overall increase of 1,210 km2 (2023) in the mangrove cover on the national-level; a 3.42 km2 average annual increase from 2016 (1,186 km2). Mangrove gain/loss assessment based on the land use land cover (LULC) transition matrix illustrated 223 km2 gain and 199 km2 loss; a 24 km2 net gain. Declines of 20.28% and 7.91% were found in maximum- and mean-NDVI (2016-23), depicting the deteriorating mangrove health conditions. Likewise, significant Sen’s slope analysis (p < 0.05) indicated that 88.8% of all the mangrove-NDVI pixels exhibited an overall decrease, whereas 11.2% pixels showed an overall increase (2016-23). It was concluded that despite showing a growth in the extent, mangrove cover in Pakistan has shown a decline in health, primarily due to deforestation for urban operations and sea-level rise, still making them vulnerable and potentially leading to a disrupted ecosystem, including carbon release in the atmosphere. This study will assist in the formulation of mangrove conservation and management strategies, whereas future research can explore the potentials of land surface temperature (LST) and evapotranspiration in combination to the NDVI for an in-depth analysis of the health status of mangroves.
1 Introduction
Halfway toward the 2030 Agenda for Sustainable Development, countries—including developed and developing—have been in a continuous struggle to confront the challenges in the way to achieve the 17 Sustainable Development Goals (SDGs), which demands an urgent call for action from all the nations worldwide to transform the world into a fully sustainable global partnership (Ferreira et al., 2020; Sustainable Development Goals, 2023). Among the developing countries, Pakistan was one of the very first countries to embark on its commitment toward the 2030 Agenda for Sustainable Development by adopting the 17 SDGs as part of the Parliament of Pakistan’s national development agenda in 2016 (Brollo et al., 2021; SDGs in Pakistan, 2023; Federal SDGs Support Unit, 2023). While Pakistan has shown progressive behavior in the past few years in the implementation of the measures designed to achieve the full potential of the 2030 Agenda for Sustainable Development, its performance still lags far behind in critical SDG sectors (Brollo et al., 2021; Sachs et al., 2023).
SDG-14’s target 14.2 directly demands to protect, conserve, restore, and sustainably manage the global mangroves (the salt-tolerant plants that have adapted to survive in brackish and saline water found in tropical and sub-tropical zones (Liao et al., 2019; UN-DESA, 2020; Sun et al., 2023)). Thoroughly examining the targets of SDG-14 implies that mangroves serve as a lens to analyze SDG-14 (Friess et al., 2019; UN-DESA, 2020; Sasmito et al., 2023), providing vital ecosystem services toward SDG-14 including heavy metal filtration (Yan et al., 2017), coastal erosion protection (Xiao et al., 2020), exceptional carbon sequestration (Tang et al., 2018), and support to marine life (Whitfield, 2017). The conservation and sustainable consumption of marine resources, i.e., the implementation of SDG-14, undeniably influences and supports the other SDGs, including SDG-1, -2, -6, -8, -12, and -13 (Liao et al., 2019; Horan, 2020; Chen et al., 2023). The diverse role of mangroves in the ecosystem highlights their potential to fight against climate change, offering support to both adaptation and mitigation strategies (Heumann, 2011; Liao et al., 2019; Reithmaier et al., 2023; Chen and Kirwan, 2024). However, at the same time, mangroves have turned out to be severely vulnerable, facing an acute decline in the past century (Lovelock et al., 2015; Cinco-Castro and Herrera-Silveira, 2020; Bhowmik et al., 2022). In the previous decades, an increased number of mangroves have been lost due to anthropogenic activities of farming and aquaculture rather than natural disasters (Ahmed and Glaser, 2016; Liao et al., 2019; Bhowmik et al., 2022; McSherry et al., 2023). An estimated 35% of the global mangrove cover was lost by the end of the 1990s, while approximately 3,400 km2 of mangrove cover was lost between 2000 and 2016 with a 62% (approximately 2,100 km2) of this loss due to anthropogenic causes (Goldberg et al., 2020; Jessica Merzdorf, 2020). A recent review study reported an 8,600 km2 loss of global mangrove cover between 1990 and 2020, pointing to farming and aquaculture as the predominant drivers, with the highest decline found in South and Southeast Asia, i.e., 3,870 km2 (Bhowmik et al., 2022).
The status of Pakistan’s mangrove cover was declared to be “protected forest” under Pakistan Forest Act 1927 (Saeed et al., 2019). In addition to the literature suggesting loss in mangroves worldwide, studies regarding mangroves in Pakistan revealed an increasing trend. Since the beginning of the 21st century, mangrove restoration and conservation campaigns have been conducted by various government and non-government organizations. The legendary forester Tahir Qureshi spent his life dedicated to the restoration and conservation of Pakistan’s mangroves and is known for planting millions of mangroves in Pakistan (IUCN, 2021). Green Pakistan Program, Billion Tree Tsunami, and Ten-Billion Tree Tsunami are plantation initiatives taken by Pakistan in the previous few years (Saeed et al., 2019). Pakistan was awarded by the Guinness World Records (GWR) in 2009 and again in 2013 for planting more than half a million mangrove saplings per day and 850,000 saplings per day, respectively (Mahar et al., 2020; Gilani et al., 2021). In the previous few decades, remote sensing satellite data and methodologies have become widely accepted tools in providing spatiotemporal information related to mangrove forest mapping and landscape-level changes (Pastor-Guzman et al., 2018). Only few remote sensing-based studies exist in Pakistan; however, only a limited number of those studies address national-level mangroves. Gilani et al., 2021 provided and claimed a national-level comprehensive mangrove ecosystem change analysis spanning 3 decades from 1990 to 2020. Utilizing a Google Earth Engine (GEE) web-based geoprocessing tool to apply the random forest (RF) classifier over medium-resolution Landsat satellite imagery, Hammad et al. revealed that the mangrove area across the nation in 1990 and 2020 was 477.2 km2 and 1,463.59 km2, respectively, suggesting an increasing trend. Along with this, by far, the most comprehensive remote sensing-based mangrove assessment of Pakistan’s mangroves, the currently existing global land use land cover (LULC) maps mapping global mangrove distribution including ESA WorldCover 10 m v100 (Zanaga et al., 2021), ESA WorldCover 10 m v200 (Zanaga et al., 2022), HGMF_2020 (Jia et al., 2023), and GMF30_2000-2020 (Liao, 2022) have all found to overlook and does not capture all the mangrove sites along Pakistan’s national coastline.
Contrary to regular desktop-based processing, this research has utilized a cloud-based geospatial platform GEE to assess the potential of an advanced RF machine learning algorithm for classifying mangroves and other land covers through scripting a comprehensive source code in order to access and process Sentinel-2 satellite imagery. The emergence of the GEE has significantly enhanced the convenience of processing the remote sensing data (Liu et al., 2023). LULC change assessment was done in order to analyze the spatiotemporal transition of various LULC classes present along the national coastline of Pakistan throughout the period studied, particularly transitions involving mangroves. The monitoring of LULC changes is beneficial for decision-making to efficiently plan the strategies for achievement of SDGs (Waleed et al., 2023). Spatiotemporal national-level mangrove health is mapped by analyzing the changes in a widely used vegetation health indicator, Normalized Difference Vegetation Index (“NDVI”) of mangrove cover in Pakistan (Ruan et al., 2022). Moreover, significant Sen’s slope analysis of mangrove-NDVI rasters was done on the basis of significance from the Mann–Kendall trend test (p < 0.05).
In order to measure the progress toward sustainable management and protection of mangrove ecosystems in Pakistan and actions for their restoration, i.e., SDG target 14.2, the current research aims to achieve the following objectives: 1) identifying and mapping the present-day status of Pakistan’s national-level extent of mangrove cover along with 8-year long (2016–2023) spatiotemporal changes in it and 2) identifying and mapping the changes in the health status of mangrove cover through analyzing the spatiotemporal trends in the NDVI of Pakistan’s mangrove ecosystems. To this end, the current study is an attempt to bridge the gap by mapping not only the largescale mangrove covers of Pakistan but smaller mangrove patches as well, which were being overlooked in previous studies. This is conducted by utilizing 10-m high-spatial resolution Sentinel-2 satellite imagery to understand the actual trend dynamics of mangrove extent in Pakistan. Moreover, previous remote sensing-based studies of the study area have revealed the quantification, distribution, and spatiotemporal changes in the mangrove cover. However, the current study has carried out the NDVI-based assessment for identifying and mapping the changes in the health status of national-level mangrove cover as well. The NDVI is one of the mostly used optimal indicators for remotely sensed ecological monitoring (Liu et al., 2024). The proposed methodology and the produced results will assist the decision-makers in the formulation of mangrove conservation and management strategies on national as well as local scales. Moreover, the study establishes a benchmark for future research for exploring the potentials of land surface temperature (LST) and evapotranspiration in combination with NDVI for an in-depth analysis of the health status of mangroves.
2 Materials and methods
2.1 Study area
The current research is interested in the national-level mangrove cover that is present along the southern border of Pakistan, which itself is a 990-km-long national coastline (Ali and Dinshaw, 2016; Aslam et al., 2019). Starting from the Indian border in the east (23.97° N, 68.75° E) and extending in the westward direction, this coastline traverses through two administrative provinces Balochistan and Sindh, finally reaching the Iranian border in the west (25.18° N, 61.62° E). Figure 1 provides the map of the study area considered for the current research. A minimum bounding polygon, in order to encompass the entire national coastline and including all the distinct mangrove sites, was delineated as the study area boundary with reference to previous studies (Abbas et al., 2013; Gilani et al., 2021; Xu et al., 2023).
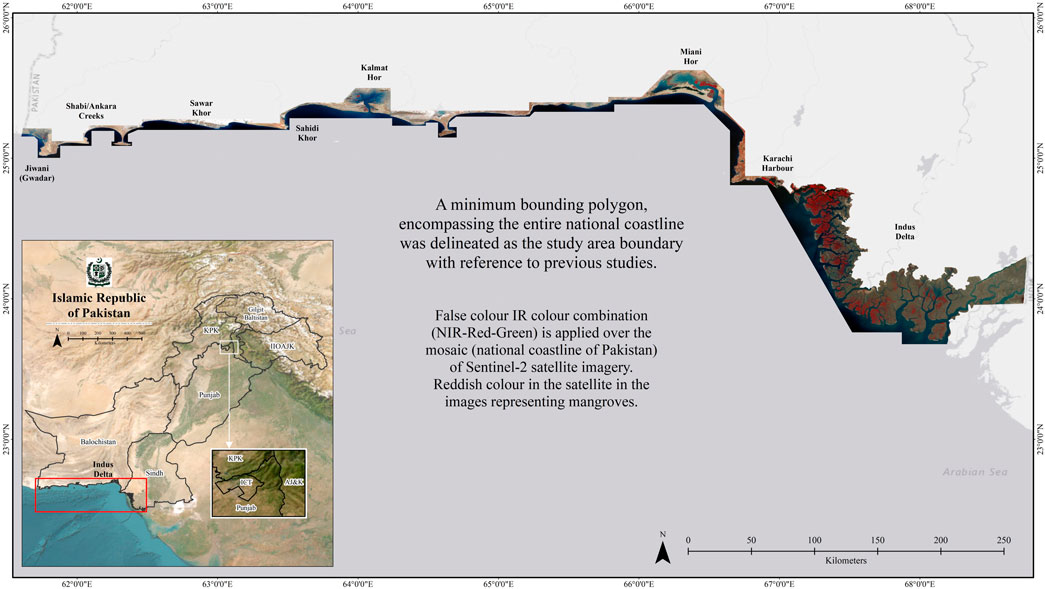
Figure 1. Study area map showing the mangrove sites along the coastline of Pakistan.
2.2 Data source
2.2.1 Sentinel-2 imagery and cloud probability dataset
To accurately map and monitor mangroves, high-spatial resolution Sentinel-2 Level-1C (Top of Atmosphere/TOA) time-series imagery from 2016 to 2023 was incorporated. All the 10-and 20-m spectral bands of 12,000+ Sentinel-2 multi-spectral instrument (MSI) images were accessed and processed by harnessing the powers of web-based cloud-computing geospatial platform GEE. The GEE satellite imagery catalog provides Sentinel-2 imagery in 100 × 100 km ortho images, known as granules or tiles, in UTM/WGS1984 projection (Traganos et al., 2018; Corbane et al., 2020; Google For Developers, 2024). Access to the GEE is possible through an internet-based application programming interface (API) to control and enable users to perform their own geospatial analyses.
The S2 cloud probability dataset, provided by the GEE satellite imagery catalog corresponding to every image captured by Sentinel-2 since 2015, was employed as auxiliary data in order to mask out the clouds from Sentinel-2 time-series imagery, which is based on Sentinel Hub’s s2cloudless cloud detection algorithm.
2.2.2 ESA WorldCover 2020 land cover product
ESA WorldCover 2020, a 10-m global LULC map developed by the European Space Agency featuring 11 land cover classes (Duarte et al., 2023; ESA, 2024), was accessed from GEE Data Catalog and reclassified to merge into five classes (mangroves, water, built-up, barren, and other vegetation) before collecting training samples out of it. In addition, 15,000 training points were automatically generated from ESA WorldCover 2020 using a random stratified sampling algorithm. This sampling method ensured the random distribution of points within each class, and the number of points was proportional to the relative area of each class (Sadaiyandi et al., 2023).
2.3 Methods
The schematic framework followed in the proposed approach is provided in Figure 2. A combination of web-based (GEE) and desktop-based approaches was adopted. The entire methodological workflow comprised a few sections including Sentinel-2 satellite imagery preprocessing, extraction of spectral indices, RF classification and accuracy assessment process, mangrove cover change detection, and mangrove cover health assessment.
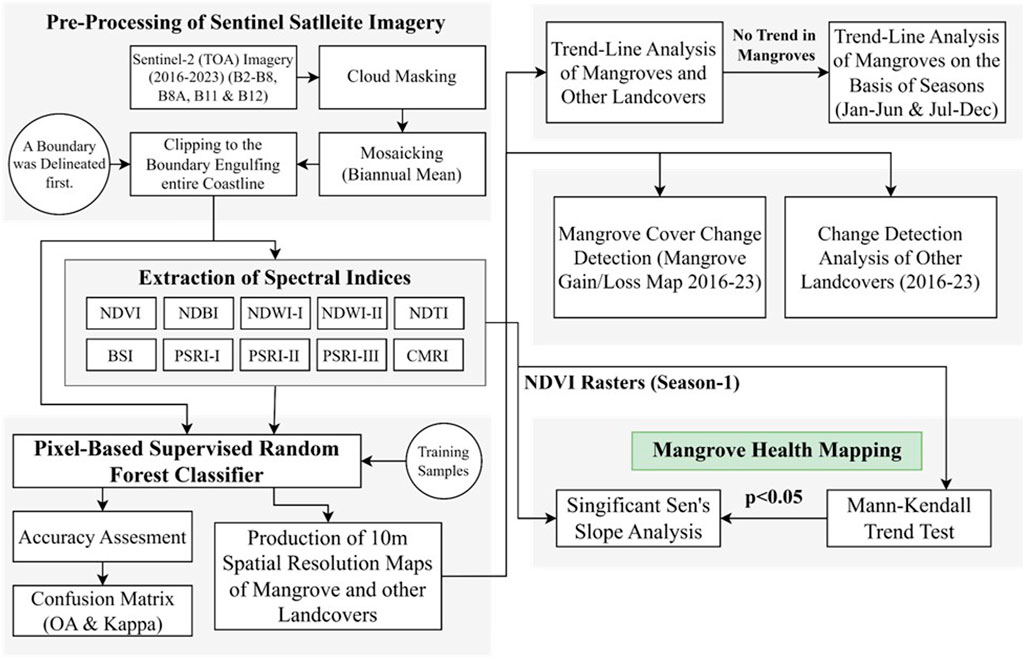
Figure 2. Schematic framework of the proposed methodology.
2.3.1 Preprocessing: cloud-masking, biannual means, and spectral index extraction
Sentinel-2A Level-1C (TOA) time-series imagery from 2016 to 2023 has been accessed and filtered on the basis of cloud percentage, i.e., images having clouds less than 10%. To remove the remaining clouds from the filtered images, the S2 cloud probability dataset was accessed and loaded into GEE. Fifteen biannual mean images have been generated by processing a total of 12,882 images taken initially, having two images per year covering the whole study area from 2016 to 2023. The detailed number of images processed in each of the biannual periods is provided in Table 1.
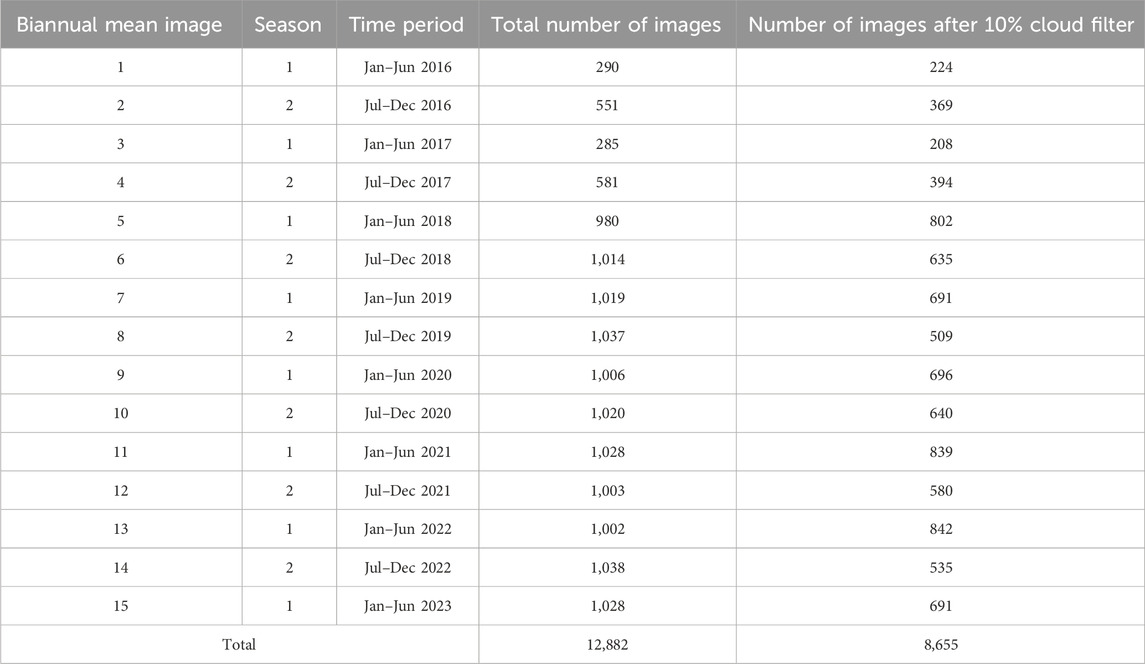
Table 1. Number of Sentinel-2 images processed in this research.
To enhance the spectral properties of mangroves and other LULC features in order to improve their identification and classification accuracy (Hu et al., 2020; Kavhu et al., 2021), several spectral indices, provided in Table 2, were derived for the 15 biannual mean images.
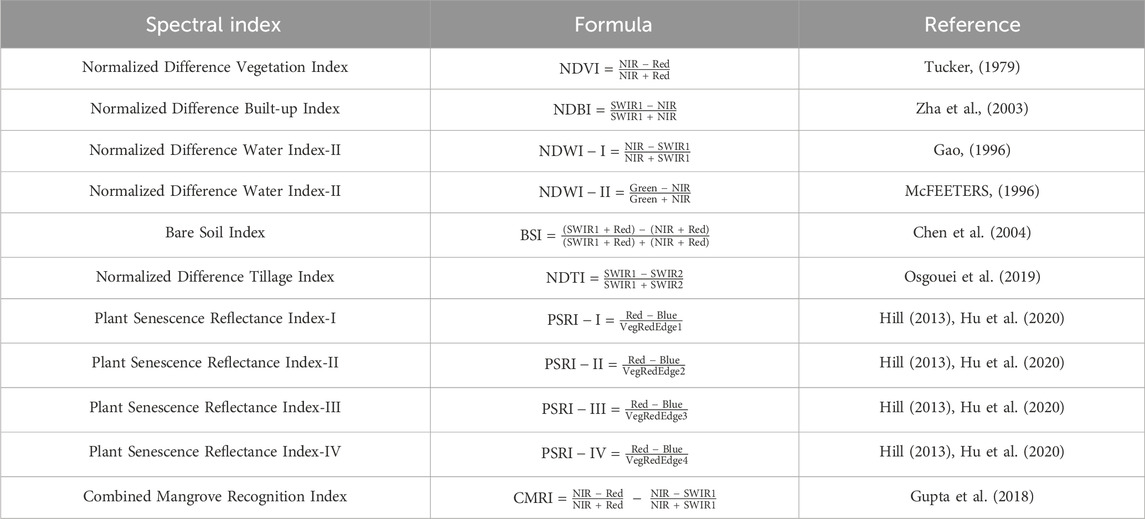
Table 2. Spectral indices extracted and incorporated in the current research.
2.3.2 Mapping mangroves and other LULC classes
A pixel-based supervised machine learning RF classifier was applied in order to map and classify the mangroves and other LULC features. The RF classification algorithm is insensitive to input variables, providing the flexibility of choosing the desired input variables, as well as it can provide the relative importance of each variable, making the approach substantially efficient and producing accurate results (Belgiu and Drăguţ, 2016; Chen, 2020). Along with the 10 spectral bands of Sentinel-2 (blue, green, red, the three vegetation red edge bands, NIR, narrow NIR, and the two SWIR bands), 11 spectral indices (Table 2) were used as input variables. The hyperparameters governing the RF classifier were set to 150 number of trees and the default values for the rest of the hyperparameters, i.e., variables per split: square root of the number of input variables, minimum leaf population: 1 and bag fraction: 0.5.
Prior to running the classifier, a semi-automated methodology was drawn and adopted to generate and validate 15,000 training samples based on random stratified sampling. Initially, these samples were automatically derived from the ESA WorldCover 2020 global LULC map, which was pre-classified into five classes, i.e., mangroves, water, built-up, barren, and other vegetation. These samples were then manually verified by overlaying them onto the corresponding 15 biannual mean images and removing the incorrectly collected training samples individually from the 15 biannual mean images. The 15 vector layers containing the training samples for 15 biannual mean images were employed afterward for classification. From the samples generated every time, 80% were used in training the classifier, whereas 20% were utilized in assessing the accuracy of the classification. The error matrix method (Foody, 2010) was incorporated to assess the accuracy of the classified products by generating the percentage overall accuracy (OA) along with the percentage Cohen’s Kappa coefficient value. A value of ≥80% for both the factors is considered good accuracy (Foody, 2010).
Moreover, to assess an independent accuracy of the classification approach adopted in current study, the Jan–Jun 2023 classified output (being the latest among all the outputs) was validated, which involved an external reference data from very high-spatial resolution Google Earth imagery. A total of 250 samples were generated from Jan–Jun 2023 classified output using the stratified random sampling method, hence being distributed randomly within each class, where the number of points of each class is proportional to its relative area. The error matrix method was incorporated to generate the OA and percentage Cohen’s Kappa coefficient value (Foody, 2010). In addition to the error matrix method applied on the latest classified map of 2023, a qualitative assessment of the performance of all the 15 produced maps was done visually by overlaying them on very high-spatial resolution Google Earth imagery.
2.3.3 Spatiotemporal trends of national-level mangrove extent and LULC change detection
The final 15 biannual classified products were exported from the GEE to the desktop system for further spatial analysis, statistical assessments, and cartography. Manual post-classification processing was done based on visual image interpretation to remove the “salt-and-pepper” noise, thereby improving the overall quality of the classification (Parashar, 2023). Run charts were plotted on the basis of area coverage, and linear trendline analyses based on least square linear regression were conducted for mangrove cover as well as for other LULC classes from 2016 to 2023. The transition matrix method was employed to detect and compare the interchange between the five LULC classes, and mangrove gain and loss on the national level was recorded and reported. Considering that the annual rate of change to be non-linear across the studied timeline, the percentage annual rate of change in the mangrove area was calculated based on compound interest law, i.e., Eq. 1 (Puyravaud, 2003), where T1 and T2 are the initial and final points of time for which areas A1 and A2 were taken, respectively.
2.3.4 Mangrove cover health mapping and analysis
In this study, mangrove cover health was analyzed using the NDVI as it is considered to be an optimal measure for the assessment of vegetation health, showing a highly positive correlation (Wang et al., 2020; Parman et al., 2022). The classified products were used to mask out pixels in the 15 biannual NDVI rasters having mangroves only for the complete time series. The values of maximum and mean NDVI of the pixels having mangroves in the whole study area were extracted and fed into a spreadsheet for statistical analyses. Furthermore, in order to assess spatiotemporal trends in the health of the mangrove cover, the NDVI rasters having mangrove pixels only were subjected to the pixel-based nonparametric Sen’s slope estimation, and the significance of Sen’s slope is judged through the Mann–Kendall trend test (Zhong et al., 2022).
3 Results
3.1 Accuracy assessment of the RF classification for mangrove mapping
For each of the 15 seasonal maps produced from 2016 to 2023, the OA and Cohen’s Kappa coefficient were reported in percentages. For all the LULC maps in this study, ≥89% OA is obtained, while ≥80% Cohen’s Kappa coefficient is obtained (Table 3). The OA and Kappa values obtained here demonstrate the strong potential of the adopted approach for detailed mapping of the mangrove cover in Pakistan. The classified map of the mean Sentinel-2 image of Jan–Jun 2023 was subjected to accuracy validation involving external reference data from very high-spatial resolution Google Earth imagery. The results of the external validation are considered to be in good agreement between the classified and ground truth value and similar to that of the train–test split method adopted with reference to the same satellite image, i.e., 93% and 87% for Jan–Jun 2023 (Table 4).
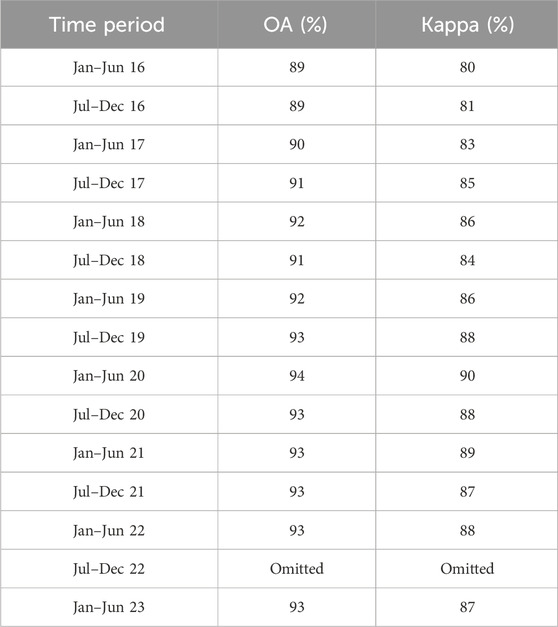
Table 3. OA and kappa coefficient is provided for each of the classified product.
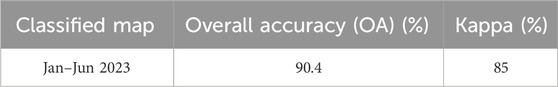
Table 4. Accuracy assessment of the random forest classification with reference to very high-spatial resolution Google Earth imagery.
3.2 Change analysis of the national-level mangrove extent of Pakistan
The values of the total areas of mangroves were computed from the biannual mean classified LULC outputs from 2016 to 2023, and the run chart was plotted (Figure 3). To study the trend in the randomly fluctuating extent of mangroves throughout the studied period, the linear trendline based on least square linear regression was drawn. It can be observed that the trendline neither depicts an increasing nor a decreasing trend and moves horizontally at 1,250 km2, which is quite inconsistent with the previous studies, where an increase in the extent of mangroves was recorded (Gilani et al., 2021; Xu et al., 2023). This behavior leads to coping up the situation by splitting the entire timeline based on two seasons, i.e., Jan–Jun (Season-1) and Jul–Dec (Season-2). Areas of mangrove cover as well as of other LULC classes for the biannual period of Jul–Dec 2022 were extremely inconsistent relative to corresponding season values and disturbing the entire trend; hence, the values are omitted considering them outliers.
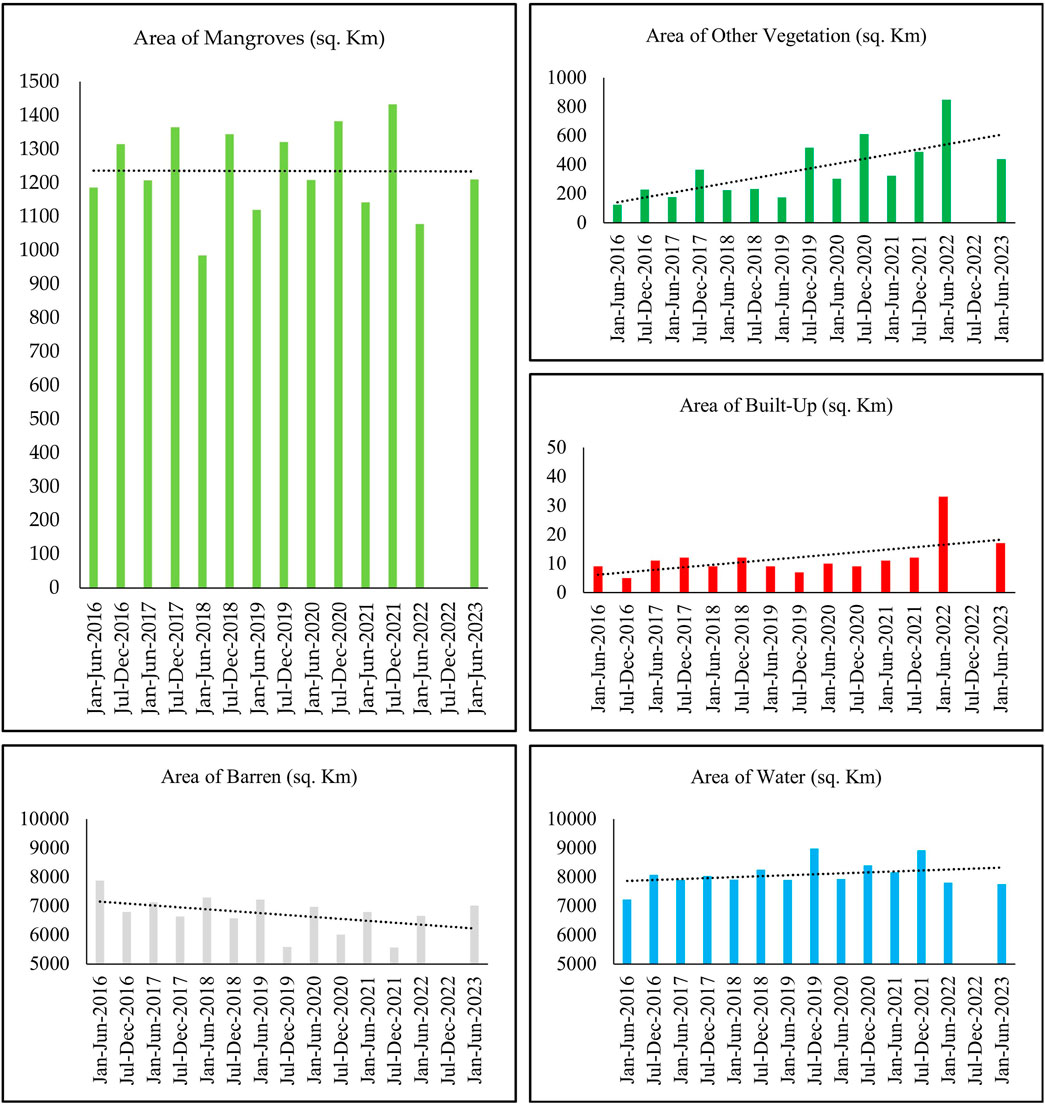
Figure 3. Trend analysis of national-level mangrove extent and other LULC classes from 2016 to 2023.
Similar to trendline analysis in the extent of mangrove cover, in order to study the spatiotemporal change in the extent of other LULC classes, individual run charts have been plotted for them as well (Figure 3). An increase in the area of water as well as in the area of other vegetation types was observed throughout the time period, while a decreasing trend was shown in the extent of barren land. The extent of built-up falling in the delineated study area boundary was found to be very small throughout the time period as compared to other four LULC classes, leading to the conclusion that its trend, either increasing or decreasing, has a minimal impact on the overall dynamics and hence can be ignored. Conversely, the large areas of water and barren land are due to their substantial presence along the country’s coastline and hence within the delineated study area boundary. The coastline of Pakistan traverses through two provinces, Balochistan and Sindh, where the former province is predominantly characterized by desert landscapes and the latter majorly comprises deltaic terrain.
3.3 Seasonal change analysis of the national-level mangrove extent of Pakistan
The analysis of the trendline of the entire study period together leads to conclude the splitting of the entire timeline by considering the values of areas separately for two seasons, i.e., Jan–Jun and Jul–Dec. Run charts were plotted, and linear regression trendlines were drawn (Figure 4). During the studied time period of season-1 (Jan–Jun) from 2016 to 2023, the extent of mangrove area has shown a net increase of 24 km2 with 1,186 km2 in 2016 to 1,210 km2 in 2023. During the studied time period of season-2 (Jul–Dec) from 2016 to 2021, again an overall increase is seen in the extent of mangrove cover.
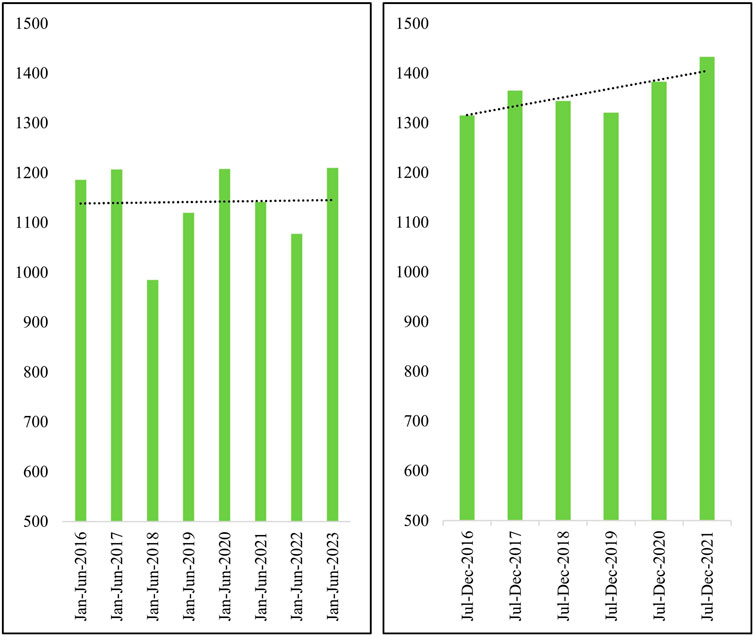
Figure 4. Trend analysis of national-level mangrove extent of Pakistan by splitting the entire timeline based on two seasons: Jan–Jun 2016–23 (left) and Jul–Dec 2016–21 (right). Area of mangroves is given in km2.
The mangrove cover change detection assessment as well as mangrove cover gain/loss assessment were conducted by considering the first and last biannual mean images from the studied time period (Figures 5, 6). Comparing the aforementioned two provinces of Pakistan, the coastline of Pakistan is predominantly characterized by desert in Balochistan Province, where a prominent landward growth of mangrove cover is majorly documented. The local observations suggest that the minimum anthropogenic activity because of comparatively insignificant human presence in this deserted region can be the potential reason behind this steady growth with the passage of time. The mangrove cover of Sindh Province, on the other hand, experienced a significant loss of mangroves at many places, especially near Karachi Harbor. It has been found that the rate of depletion in mangroves (mangrove loss) in the Indus Delta potentially appears to counterweigh the rate of growing mangroves (mangrove gain) due to natural processes as well as human-driven mangrove restoration campaigns over the past few decades. Moreover, the rise in the sea level caused coastal erosion at the very edges of deltaic islands which are home to or otherwise could be the potential site for mangroves to grow and increase in area.
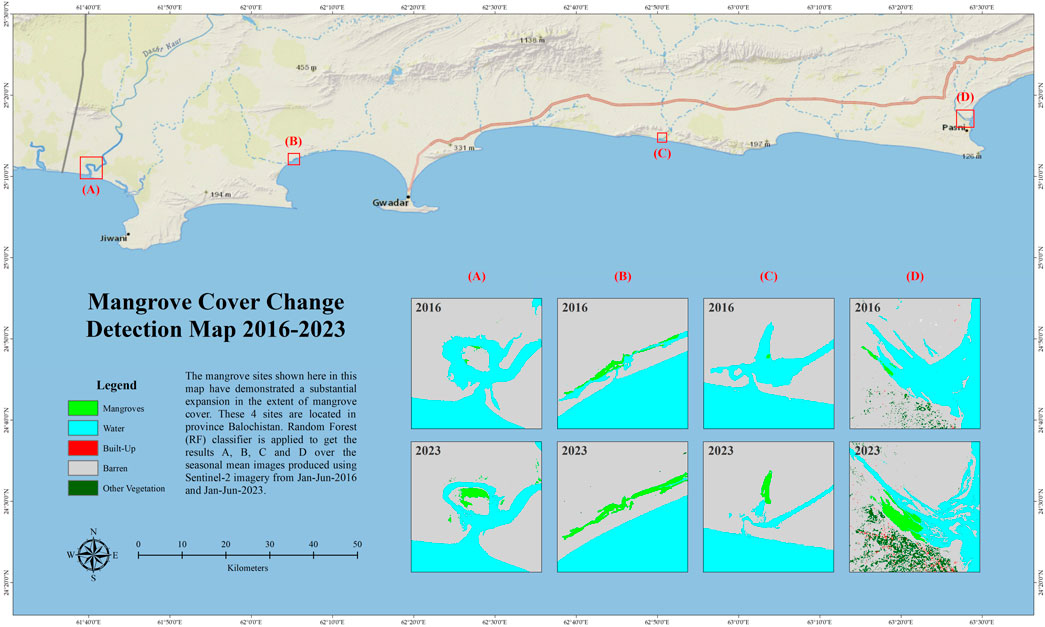
Figure 5. Increase in the extent of mangroves is shown at four different sites along Pakistan’s national coastline.
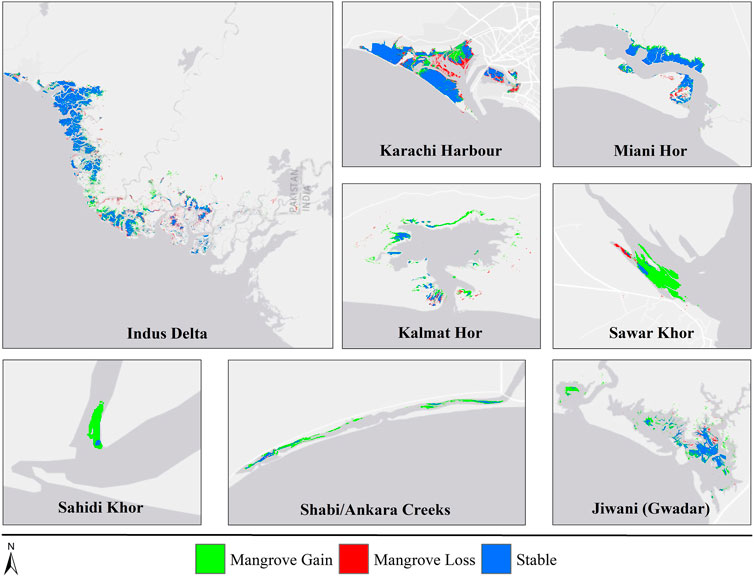
Figure 6. Mangrove gain/loss assessment is conducted taking the Jan–Jun 2016 and Jan–Jun 2023 classified biannual mean images.
The LULC transition matrix method was applied in order to detect the interchange between all five classes (mangroves, water, built-up, barren, and other vegetation) from 2016 to 2023, and the results are mapped along with plotting the chord diagram (Figure 7). During the time span of 8 years from 2016 to 2023, a net increase of 24 km2 was detected in the mangrove cover. This expansion is primarily due to conversion of barren land to mangrove cover, i.e., 66 km2, while no transformation is observed from built-up land to mangroves (Figure 7; Table 5). Notably, a net mangrove cover of 28 km2 and 14 km2 is lost to water and other vegetation, respectively, therefore offsetting the increase in mangrove area. The largest areas of retrogressive transformation are the barren—water (495 km2 net), which aligns with the observation that the area of water in the national coastal zone of Pakistan is increasing, while interestingly, the largest progressive transformation is the barren—other vegetation (303 km2 net).
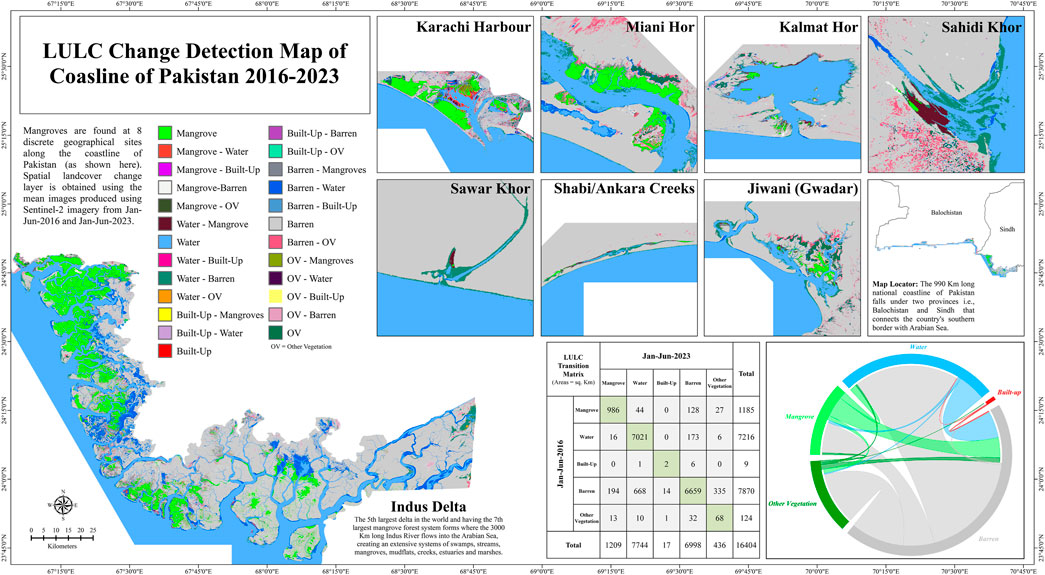
Figure 7. LULC transition matrix method is applied to get the status of LULC class interchange from 2016 to 2023.
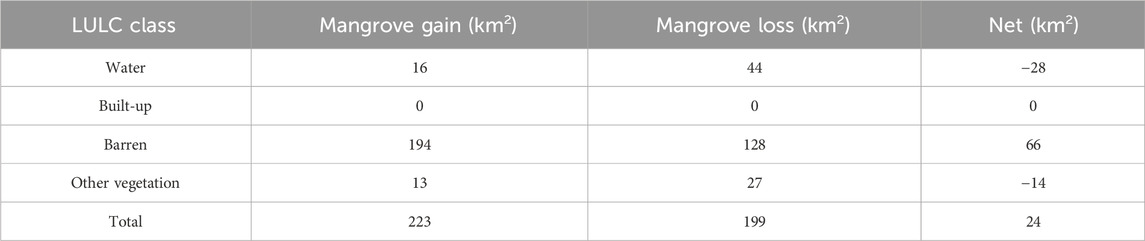
Table 5. Mangrove gain and mangrove loss from/to other LULC classes 2016–23. An increase of 24 km2 in mangrove cover is found.
3.4 Spatiotemporal trends in mangrove cover health
In this study, mangrove cover health was analyzed using an optimal measure NDVI. The values of maximum and mean NDVI of the pixels having mangroves in the whole study area were extracted, and a run chart is plotted (Figure 8). The consistently declining trend of both the maximum and mean mangrove NDVI values from 2016 to 2023 suggests a potentially increasing stress and hence decreasing health. A closer inspection of the data for maximum mangrove–NDVI reveals the biphasic recovery and relapse response. Though a declining trend from 2016 to 2019 can be seen, a significant increase (12.95%) is observed in 2019, where values exceed 0.7, suggesting NDVI growth (Table 6). However, this sudden uplift is followed by a moderate drop till 2021 but keeping all the values above 0.7 when suddenly a drastic drop occurs (0.53) in Jan–Jun 2022 and decreases till 0.46 in Jan–Jun 2023. Closely examining the mean mangrove–NDVI data, a declining trend is observed similar to maximum mangrove–NDVI data, but with a moderate rate this time. All the time-series values are randomly fluctuating in between 0.2 and 0.3, except where the values drop below 0.2, i.e., 0.19 (Jan–Jun 2022) and 0.16 (Jan–Jun 2023). The detailed standard percentage rate of change in maximum and mean values of mangrove-NDVI throughout the time period is provided in Table 6. A decline of 20.28% and 7.91% is observed in maximum and mean values of mangrove–NDVI, respectively, indicating a substantial decline in health of the mangrove cover of Pakistan.
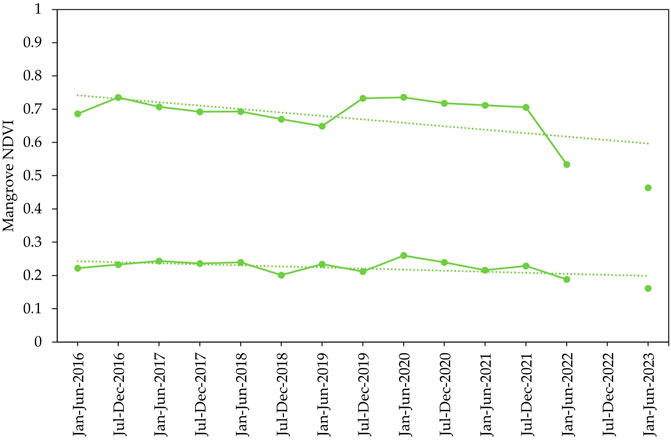
Figure 8. Maximum values of mangrove-NDVI (above) and mean values of mangrove-NDVI (below) from 2016 to 2023.
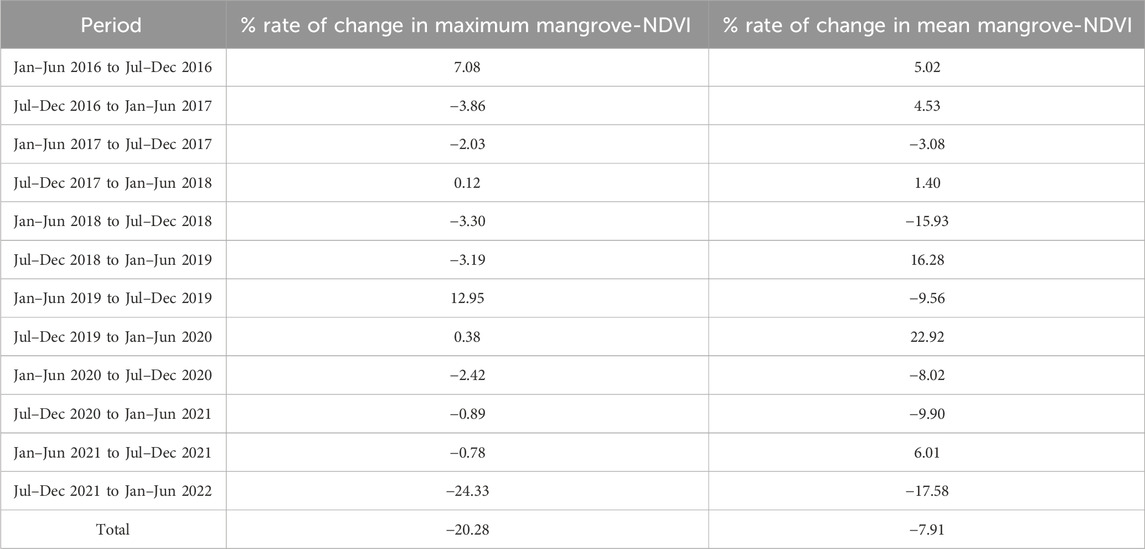
Table 6. Standard formula of the percentage rate of change is applied to obtain the percentage rate of change in maximum mangrove-NDVI and mean mangrove-NDVI.
Furthermore, mangrove health is assessed through mangrove–NDVI rasters by subjecting them to the pixel-based nonparametric Sen’s slope estimation, and the Mann–Kendall trend test is used to obtain the significance of Sen’s slope (Zhong et al., 2022). Sens’s slope is calculated first, and then Mann–Kendall analysis is conducted to get the p-values raster. Significant pixel raster is calculated based on p < 0.05 (95% significance) and is superimposed with Sen’s slope raster to create significant Sen’s slope (Figure 9). To facilitate detailed analysis, the mangrove–NDVI significant Sen’s slope raster was classified into four thematic classes using manually defined breakpoints based on data distribution: significantly increasing (0.1–1), weakly increasing (0–0.1), weakly decreasing (0 to −0.1), and significantly decreasing (−0.1 to −1). The results indicate that during the time span of 8 years from 2016 to 2023, 0.03% and 11.17% of areas of mangroves had significant increases and weak increases, respectively. The area with a weak decrease in mangrove–NDVI is accounted for 88.79%, while 0.01% of the area is found to have a significant decrease. The area of mangroves where mangrove-NDVI is observed to be weakly decreasing in the 8-year time period is mostly found near Karachi City and in the northern part of the Indus Delta.
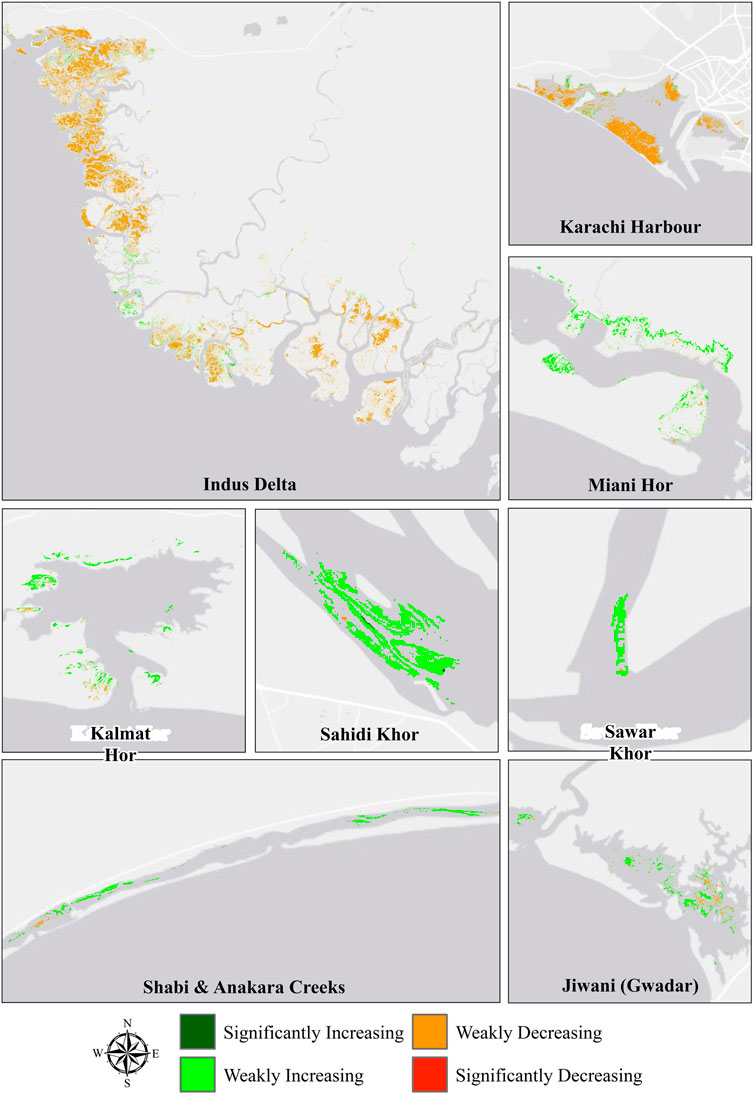
Figure 9. Significant Sen’s slope based on p < 0.05 (95% significance) from the Mann–Kendall trend test.
4 Discussion
4.1 Accuracy assessment of RF classification results
In addition to computing accuracy based on the error matrix method for the 80/20 train–test split method and for external validation data from very high-spatial resolution Google Earth imagery, a comparison of the results of the classification with the already established estimations from recent independent research publications indicates that the methodology applied in the current study delivered accurate mangrove discrimination. ESA WorldCover 10 m v100 (74.4% OA) (Zanaga et al., 2021) identified a total of 1,056 km2 of mangrove cover along the coastline of Pakistan in 2020 which is less than identified in the current research, i.e., 1,295.5 km2 (mean 2020 mangrove cover). However, being a global LULC map ESA WorldCover 10 m v100 does not capture all the local sites of mangrove presence along Pakistan’s national coastline (Figure 10). Another global 30-m spatial distribution of mangroves, GMF30_2000-2020 (88% OA) (Liao, 2022) identified 610 km2 (less than current research) of mangrove cover in 2020 along Pakistan’s national coastline, though again overlooking mangroves at various locations (Figure 10). Gilani et al. (2021) performed a comprehensive mangrove habitat change assessment from 1990 to 2020 and revealed (greater than the current research) a national mangrove cover of 1,463.59 km2 in 2020. However, this research was based on 30 m medium spatial resolution, and the methodology adopted by Gilani et al. (2021) was to classify three classes, i.e., mangrove, water, and other vegetation. Comparatively, the lower spatial resolution and creating no separate class for other vegetation possibly included other vegetation pixels in the mangrove pixels.
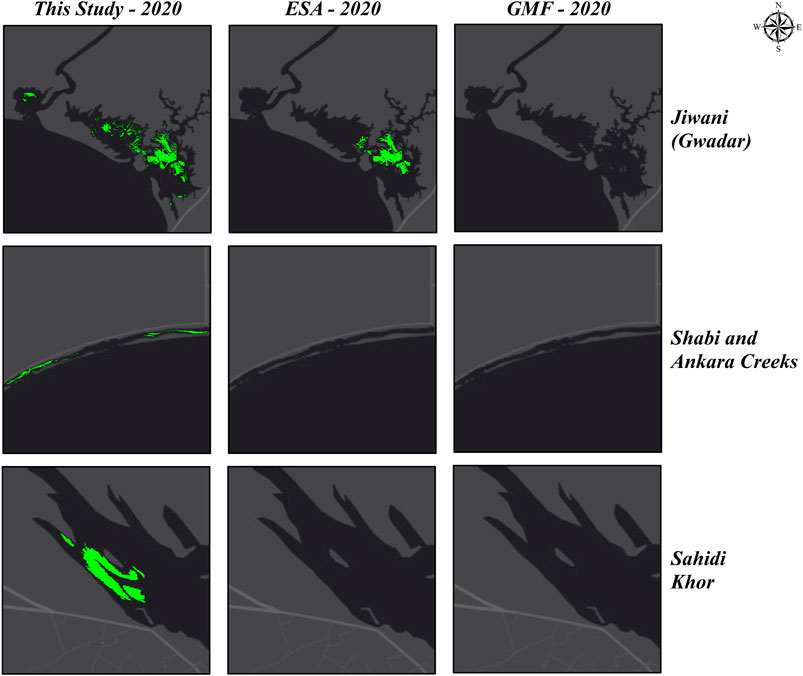
Figure 10. Comparison of currently classified products with ESA WorldCover 10 m v100 land cover map and GMF30_2000–2020 global mangrove map.
4.2 Change assessment of Pakistan’s mangrove cover
During the timeline of season-1 (Jan–Jun) from 2016 to 2023, the mangrove extent has shown a net increase of 24 km2 with 1,186 km2 in 2016 to 1,210 km2 in 2023. The average annual rate of increase in area is 3.42 km2 according to compound interest law (Puyravaud, 2003). Table 7 shows the detailed percentage annual rates of changes in areas of mangrove cover from 2016 to 2023 for season-1. During the temporal period of season-2 (Jul–Dec) from 2016 to 2021, again an overall increase is seen in the extent of mangrove cover. This finding not only aligns but also strengthens the conclusions derived from season-1 data, providing further evidence for an increase in the extent of mangrove cover in the study area. Table 7 shows the detailed percentage annual rates of changes (based on formula by Puyravaud, 2003) in areas of mangrove cover from 2016 to 2021 for season-2. In order to assess the trend of the percentage annual rate of change in the extent of national-level mangrove cover, run charts were plotted and linear regression trendlines were drawn (Figure 11). The increasing trends suggest a potential acceleration in the annual rate of increase, i.e., a higher growth rate in later years compared to earlier years. A similar accelerating increasing trend was observed by Gilani et al. (2021). Since the beginning of the 21st century, mangrove cover restoration campaigns have been conducted through various government and non-government organizations, which can potentially be the cause of this percentage annual rate of increase.
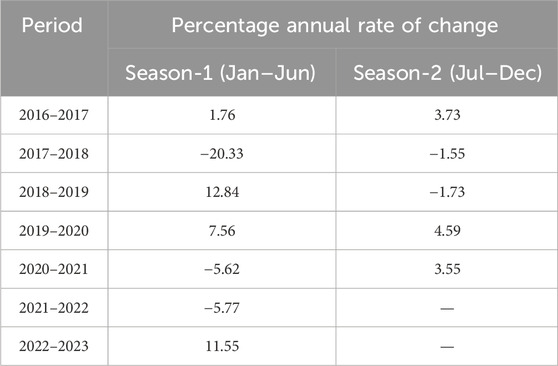
Table 7. Percentage annual rate of change in the area of mangroves for season-1 and season-2.
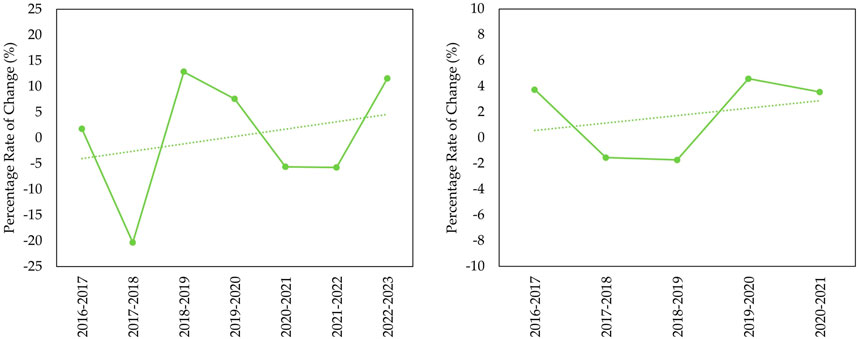
Figure 11. Trend analysis of the percentage annual rate of change in the mangrove extent for season-1 (left) and season-2 (right).
Pakistan, lying in the sub-tropical region, directly comes under the significant influence of summer monsoon, resulting in substantial precipitation every year starting from July to September (Nawaz et al., 2020; Khan et al., 2022). These large volumes of freshwater flowing through the rivers ultimately discharge into coastal zones, potentially inundating the mangrove habitats (Figure 12). In this study, notably, the increase in mangrove areas observed in season-2 (Jul–Dec) compared to season-1 (Jan–Jun) is due to the seasonal influx of freshwater. Mangrove productivity is highly correlated with the amount of freshwater intake, which otherwise depends on saline water during season-1 when there is minimal availability of freshwater (Santini et al., 2015). Pakistan was hit by the most devastating monsoon event of recent times in 2022 where the exceptional influx of water from extreme precipitation flooded almost the entire country, including the inundation of the coastal zones (Ashfaq et al., 2023). Consequently, the on-ground LULC patterns got perturbations, which were evident from the visuals of the satellite imagery as well as the anomalies present in the data trends. Therefore, the exclusion of the data for this particular time period (Jul–Dec 2022) was essential. A dynamic temporal interplay is depicted between the area of water and the area of barren land in the study area through a run chart plotted together (Figure 12). The chart clearly demonstrates that the season-2 (Jul–Dec) reading for the area of water is greater than the corresponding season-1 (Jan–Jun) reading, showing the consistency with the influx of freshwater from substantial rainfall events during summer monsoon. Second, through the linear trendlines drawn, it is evident that the area of water in the national coastal zone of Pakistan is increasing, which ultimately depicts the potential sea-level rise.
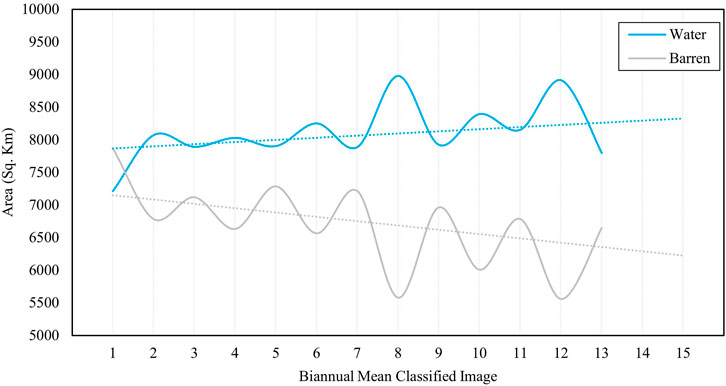
Figure 12. A dynamic interplay between areas of water and barren land from 2016 to 2023 in 15 biannual LULC maps (incrementing from left to right direction).
Mangrove gain/loss assessment was conducted in this study, revealing 223 km2 of mangrove cover increase in these 8 years, whereas 199 km2 of mangrove cover loss occurred, counterweighing the overall gain to 24 km2. Results revealed that most of this conflict takes place in the Indus Delta. Aeman et al. (2023) documented a huge increase in the eastern part of the Indus Delta (629 km2) from 1990 to 2020, whereas, the western part of the delta and mid-western and mid-eastern parts of the delta together have observed a loss of 70 km2 and 14 km2, respectively. Abbas et al. (2021) reported a mangrove cover increase of 117 km2 in the western part of the Indus Delta between 2000 and 2010 and an 89 km2 mangrove cover loss between 2010 and 2020. Investigations of the current research revealed that an overall 66 km2 of barren land was transformed into mangrove area. This progressive transformation is due to the natural regrowth of mangroves (Hina Masood et al., 2015; Abbas et al., 2021). Previously, most of the research work focused on the mangroves of Sindh Province, whereas the results of the current research revealed this progressive natural growth of mangroves was prominent in Balochistan Province, especially in Jiwani (Gwadar), Shabi and Ankara Creeks, Sawar Khor, and Sahidi Khor. Furthermore, this study found that 28 km2 of mangrove area underwent retrogressive transformation to water regions. This transformation is due to coastal erosion and rise in sea-levels (Ahsanullah et al., 2021; Aeman et al., 2023). Additionally, a prominent mangrove cover loss is observed in Karachi Harbor in the current investigation from 2016 to 2023. Ahsanullah et al. (2021) reported a loss of 1.3 km2 in Karachi Harbor from 2011 to 2020.
4.3 Effects of anthropogenic pressures on mangrove cover in Pakistan
This study provides the mangrove health insights through mapping the spatial and temporal distribution and trends of NDVI along the national coastline of Pakistan (Ruan et al., 2022). In addition, 20.28% (slope = −0.01) and 7.91% (slope = −0.003) declines are observed from 2016 to 2023 in maximum and mean values of mangrove–NDVI, respectively. No study investigating such trends in Pakistan was found. Ruan et al. (2022) conducted a global-level investigation revealing the slowly increasing trend (slope = 0.00289) of mean mangrove-NDVI (2000–2018), however altogether for South Asian countries including Pakistan, India, Bangladesh, and Sri Lanka. Pixel-based significant Sen’s slope analysis (p < 0.05 based on the Mann–Kendall trend test) was conducted, revealing that 88.79% mangrove area exhibited a decreasing trend of NDVI (slightly decreasing), whereas only 11.17% exhibited an increasing trend (slightly increasing). Further examination revealed that most of the area with a decreasing trend is observed in the Indus Delta and Karachi Harbor. The decline in NDVI trends of mangrove cover suggests a decrease in mangrove health, leading to disrupted ecosystem balance including carbon release (Ruan et al., 2022; Wang et al., 2023).
Unfortunately, a little less than 90% of Pakistan’s national-level mangroves are found to be under health stress. Mangroves in the neighborhoods of Karachi City as well as the northern edge of Indus Delta touching with the city are the sites where mangrove-NDVI is observed to be decreasing in the 8-year time period. This is a similar finding as in the case of mangrove gain/loss mapping, where it was found that most of the loss is observed near Karachi City. The national coastline of Pakistan traverses through the two provinces of Pakistan, Balochistan and Sindh, namely, Makran coast and Sindh coast. The Makran coast is an arid to semi-arid coastal zone dominating the western portion of country’s national coastline, and it falls entirely within Balochistan Province. Occupied by extensive stretches of mudflats, rocky cliffs, and sandy beaches, the mangroves of Balochistan Province experiencing minimal to negligible human-induced direct and indirect disruptions are not only growing in extent, rather the health conditions are getting improved. Whereas Sindh Province, home to the sixth largest mangrove ecosystem “Indus Delta mangroves” along with the Karachi Harbor mangrove ecosystem, owning a population of 50 million, is a major source of anthropogenic impacts over mangroves of the Sindh coast. At the southern-most bank of Sindh Province is the city of Karachi, which is the largest city in Pakistan in terms of area and population both, i.e., 15 million plus population (Pakistan Bureau of Statistics, 2024). The pressures from the urban population and urban activities from Karachi City as well as the other parts of the province seem potentially responsible for the deterioration of mangrove cover (Abbas et al., 2021). Being the most populated city of an underdeveloped country as well as the largest sea port of Pakistan, Karachi’s ongoing unplanned development as well as other urban operations may pose several anthropogenic threats to the surrounding mangrove habitat, and a comprehensive assessment is crucial to cope up with these threats as soon as possible in order to sustainably conserve the habitat. This deterioration is not newly introduced but started emerging in the 1990s and has been prevailing since then. Syed M. Saifullah’s work was included in a book as a chapter with the title, “Management of Indus Delta Mangroves” from 1997, which mentioned a decrease in freshwater influx to mangrove habitat, harvesting and grazing (fuel, fodder, and overfishing), urbanization, pollution, sea-level rise, and socio-economic factors (poverty, illiteracy, and lack of municipal services) to be the causes behind this continuous and increasing deterioration and destruction of mangrove cover in the Indus Delta (Saifullah, 1997). He further suggested deforestation, dredging, channelization, soil erosion, and waste disposal to be the core issues happening due to urbanization. The city of Karachi alone, other than the province, is contributing 471 million gallons of untreated waste water per day to the open sea in the surroundings of mangrove areas, while 6,000 heavy industries in the city as well discharge high-impact contaminants to the sea that directly encounters and affects the mangrove cover of Karachi Harbor and Indus Delta (Ijoabs An Open Access Journal and Abro, 2020).
5 Conclusion
Assessment of the progress the Islamic Republic of Pakistan has made in protecting, conserving, restoring, and afforesting and sustainably managing the country’s expanse of mangrove ecosystems, the prerequisite to achieve SDG-14 necessitates a comprehensive remotely sensed national-level investigation. The findings of the current research revealed that 1,210 km2 of the area is covered with mangroves in Pakistan in 2023, whereas this was 1,186 km2 in 2016; an average annual increase rate of 3.42 km2. Mangrove cover gain/loss assessment was done, revealing a gain and loss of 223 km2 and 199 km2, respectively, in this 8-year duration, signifying a 24 km2 net increase in the extent of mangrove cover in Pakistan. National-level mangrove health condition is assessed by providing insights into the spatiotemporal distribution and trends in an optimal measure Normalized Difference Vegetation Index (NDVI) of mangrove cover. In addition, 20.28% decline was found in maximum mangrove-NDVI, whereas 7.97% decline was found in mean mangrove-NDVI from 2016 to 2023. Additionally, significant Sen’s slope assessment based on p < 0.05 (95% significance) from the Mann–Kendall trend test indicated that 0.01% of the pixels having mangrove exhibited a significant decrease in NDVI; 88.79% exhibited a weak decrease; 11.17% exhibited a weak increase; and 0.03% in case of significant increase. Extended analysis of the data at the local scales reveals the most concerning declines in the mangrove extent and health to be concentrated around Karachi Harbor and in the Indus Delta mangroves.
Mangroves being the vulnerable ecosystems in the world, fortunately an increasing trend in the mangrove extent has been found in Pakistan depicting an impressive role of Pakistan toward the achievement of SDG-14.2. However, despite sustainably managing and implementing the mangrove afforestation activities, measures need to be taken in order to comprehend and address Pakistan’s declining mangrove cover health conditions. The proposed methodology and results will be helpful for national and provincial forest departments and other corresponding agencies of Pakistan in developing short- to long-term policies for addressing the mangrove extent and health degradation issues. Being part of the blue carbon ecosystem, mangroves are of great significance to the Earth’s carbon cycle, which makes it necessary to study mangroves in a more comprehensive way in order to conserve and restore them. The often existence of Pakistan’s mangroves in the shape of narrow patches (e.g., Sawar Khor), much smaller to be detected by 10-m spatial resolution, limits the more exact identification and mapping of mangroves in Pakistan. Further refinements beyond the available resolutions are necessary. Future research can explore the potentials of other parameters including LST and evapotranspiration in combination with the NDVI for an in-depth analysis of the health status of mangroves.
Data availability statement
The raw data supporting the conclusion of this article will be made available by the authors, without undue reservation.
Author contributions
SR: conceptualization, formal analysis, investigation, methodology, software, and writing–original draft. ZL: supervision, validation, and writing–review and editing. ZJ: writing–review and editing. BC: supervision, validation, and writing–review and editing.
Funding
The author(s) declare that financial support was received for the research, authorship, and/or publication of this article. The work was supported by the National Natural Science Foundation of China (Grant No. 42071305) and the Hainan Provincial Natural Science Foundation of China (Grant No. 322MS100).
Acknowledgments
The authors would like to pay regards to Alliance of International Science Organizations (ANSO) for providing ANSO Scholarship for Young Talents scholarship programme. Moreover, the authors are sincerely grateful in anticipation to the reviewers and editors for their constructive comments toward the improvement of the manuscript.
Conflict of interest
The authors declare that the research was conducted in the absence of any commercial or financial relationships that could be construed as a potential conflict of interest.
Publisher’s note
All claims expressed in this article are solely those of the authors and do not necessarily represent those of their affiliated organizations, or those of the publisher, the editors, and the reviewers. Any product that may be evaluated in this article, or claim that may be made by its manufacturer, is not guaranteed or endorsed by the publisher.
References
Abbas, N., Khan, N., and Habib, W. (2021). Monitoring of mangrove cover of western Indus delta Karachi Pakistan. Int. J. Innovations Sci. Technol. 3 (2), 59–66. doi:10.33411/IJIST/2021030202
Abbas, S., Qamer, F. M., Ali, G., Tripathi, N., Shehzad, K., Rashid, S., et al. (2013). An assessment of status and distribution of mangrove forest cover in Pakistan. J. Biodivers. Environ. Sci. 3 (June), 2222–3045.
Aeman, H., Shu, H., Abbas, S., Aisha, H., and Usman, M. (2023). Sinking delta: quantifying the impacts of saltwater intrusion in the Indus delta of Pakistan. Sci. Total Environ. 880 (July), 163356. doi:10.1016/j.scitotenv.2023.163356
Ahmed, N., and Glaser, M. (2016). Coastal aquaculture, mangrove deforestation and blue carbon Emissions: is REDD+ a solution? Mar. Policy 66 (April), 58–66. doi:10.1016/j.marpol.2016.01.011
Ahsanullah, S. H. K., Ahmed, R., and Luqman, M. (2021). Morphological change detection along the shoreline of Karachi, Pakistan using 50 Year time series satellite remote sensing data and GIS techniques. Geomatics, Nat. Hazards Risk 12 (1), 3358–3380. doi:10.1080/19475705.2021.2009044
Ali, M. H., and Dinshaw, R. C. (2016). A handbook on Pakistan’s coastal and marine resources (Karachi: Mangroves for the Future).
Ashfaq, M., Johnson, N., Kucharski, F., Diffenbaugh, N. S., Abid, M. A., Horan, M. F., et al. (2023). The influence of natural variability on extreme monsoons in Pakistan. Npj Clim. Atmos. Sci. 6 (1), 148–214. doi:10.1038/s41612-023-00462-8
Aslam, S., Siddiqui, G., Kazmi, S. J. H., and Moura, C. J. (2019). First occurrence of the non-indigenous bryozoan amathia verticillata (della chiaje, 1882) at the hab river mouth in Pakistan. Regional Stud. Mar. Sci. 30 (July), 100706. doi:10.1016/j.rsma.2019.100706
Belgiu, M., and Drăguţ, L. (2016). Random forest in remote sensing: a review of applications and future directions. ISPRS J. Photogrammetry Remote Sens. 114 (April), 24–31. doi:10.1016/j.isprsjprs.2016.01.011
Bhowmik, A. K., Padmanaban, R., Cabral, P., and Romeiras, M. M. (2022). Global mangrove deforestation and its interacting social-ecological drivers: a systematic review and synthesis. Sustainability 14 (8), 4433. doi:10.3390/su14084433
Brollo, F., Hanedar, E., and Walker, S. (2021). Pakistan: spending needs for reaching sustainable development goals (SDGs). Available at: https://www.imf.org/en/Publications/WP/Issues/2021/04/29/Pakistan-Spending-Needs-for-Reaching-Sustainable-Development-Goals-SDGs-50285.
Chen, F., Jiang, Y., Liu, Z., Lin, R., and Yang, W. (2023). Framework system of marine sustainable development assessment based on systematic review. Mar. Policy 154 (August), 105689. doi:10.1016/j.marpol.2023.105689
Chen, Na (2020). Mapping mangrove in dongzhaigang, China using sentinel-2 imagery. J. Appl. Remote Sens. 14 (01), 1. doi:10.1117/1.JRS.14.014508
Chen, W., Liu, L., Zhang, C., Wang, J., Wang, J., and Pan, Y. (2004). “Monitoring the seasonal bare soil areas in Beijing using multi-temporal TM images.” in IEEE Int. Geoscience Remote Sens. Symposium, 2004. IGARSS ’04. Proc. 2004. (Anchorage, AK, USA: IEEE). 5, 3379–3382. doi:10.1109/IGARSS.2004.1370429
Chen, Y., and Kirwan, M. L. (2024). Rapid greening in mangroves. Nat. Ecol. Evol. 8 (2), 186–187. doi:10.1038/s41559-023-02247-x
Cinco-Castro, S., and Herrera-Silveira, J. (2020). Vulnerability of mangrove ecosystems to climate change effects: the case of the Yucatan Peninsula. Ocean Coast. Manag. 192 (July), 105196. doi:10.1016/j.ocecoaman.2020.105196
Corbane, C., Politis, P., Kempeneers, P., Simonetti, D., Soille, P., Burger, A., et al. (2020). A global cloud free pixel- based image composite from sentinel-2 data. Data Brief 31 (May), 105737. doi:10.1016/j.dib.2020.105737
Duarte, D., Fonte, C., Costa, H., and Caetano, M. (2023). Thematic comparison between ESA WorldCover 2020 land cover product and a national land use land cover map. Land 12 (2), 490. doi:10.3390/land12020490
ESA (2024). ESA WorldCover 2020. Available at: https://worldcover2020.esa.int/ (Accessed February 7, 2024).
Federal SDGs Support Unit (2023). Federal SDGs Support Unit. Available at: https://www.sdgpakistan.pk/ (Accessed November 6, 2023).
Ferreira, B., Iten, M., and Silva, R. G. (2020). Monitoring sustainable development by means of earth observation data and machine learning: a review. Environ. Sci. Eur. 32 (1), 120. doi:10.1186/s12302-020-00397-4
Foody, G. M. (2010). Assessing the accuracy of land cover change with imperfect ground reference data. Remote Sens. Environ. 114 (10), 2271–2285. doi:10.1016/j.rse.2010.05.003
Friess, D. A., Aung, T. T., Huxham, M., Lovelock, C., Mukherjee, N., and Sasmito, S. (2019). “SDG 14: life below water – impacts on mangroves,” in Sustainable development goals: their impacts on forests and people. Editors C. J. Pierce Colfer, G. Winkel, G. Galloway, P. Pacheco, P. Katila, and W. de Jong (Cambridge: Cambridge University Press), 445–481. Available at: https://www.cambridge.org/core/books/sustainable-development-goals-their-impacts-on-forests-and-people/sdg-14-life-below-water-impacts-on-mangroves/905F654614DC8FBB343DE67C109063CF.
Gao, B. (1996). NDWI—a normalized difference water Index for remote sensing of vegetation liquid water from Space. Remote Sens. Environ. 58 (3), 257–266. doi:10.1016/S0034-4257(96)00067-3
Gilani, H., Naz, H. I., Arshad, M., Nazim, K., Akram, U., Abrar, A., et al. (2021). Evaluating mangrove conservation and sustainability through spatiotemporal (1990–2020) mangrove cover change analysis in Pakistan. Estuar. Coast. Shelf Sci. 249 (February), 107128. doi:10.1016/j.ecss.2020.107128
Goldberg, L., Lagomasino, D., Thomas, N., and Fatoyinbo, T. (2020). Global declines in human-driven mangrove loss. Glob. Change Biol. 26 (10), 5844–5855. doi:10.1111/gcb.15275
Google For Developers (2024). Harmonized Sentinel-2 MSI: MultiSpectral Instrument, Level-1C | Earth Engine Data Catalog. Available at: https://developers.google.com/earth-engine/datasets/catalog/COPERNICUS_S2_HARMONIZED (Accessed February 7, 2024).
Gupta, K., Mukhopadhyay, A., Giri, S., Chanda, A., Majumdar, S. D., Samanta, S., et al. (2018). An Index for discrimination of mangroves from non-mangroves using LANDSAT 8 OLI imagery. MethodsX 5, 1129–1139. doi:10.1016/j.mex.2018.09.011
Heumann, B. W. (2011). An object-based classification of mangroves using a hybrid decision tree—support vector machine approach. Remote Sens 3, 2440–2460. doi:10.3390/rs3112440
Hill, M. J. (2013). Vegetation Index suites as indicators of vegetation state in grassland and savanna: an analysis with simulated SENTINEL 2 data for a north American transect. Remote Sens. Environ. 137 (October), 94–111. doi:10.1016/j.rse.2013.06.004
Horan, D. (2020). National baselines for integrated implementation of an environmental sustainable development goal assessed in a new integrated SDG Index. Sustainability 12 (17), 6955. doi:10.3390/su12176955
Hu, L., Xu, N., Liang, J., Li, Z., Chen, L., and Zhao, F. (2020). Advancing the mapping of mangrove forests at national-scale using sentinel-1 and sentinel-2 time-series data with Google earth engine: a case study in China. Remote Sens. 12 (19), 3120. doi:10.3390/rs12193120
Ijoabs An Open Access Journal Abro, A. A. (2020). Effects of untreated sewage on marine environment-A case study of Karachi. Available at: https://www.academia.edu/45592775/Effects_of_Untreated_Sewage_on_Marine_Environment_A_Case_Study_of_Karachi.
IUCN (2021). Sindh forest department dedicates part of island to Tahir Qureshi – baba-e-mangroves as Tahir Qureshi garden | IUCN. Gland, Switzerland: IUCN. Available at: https://www.iucn.org/news/pakistan/202102/sindh-forest-department-dedicates-part-island-tahir-qureshi-baba-e-mangroves-tahir-qureshi-garden.
Jia, M., Wang, Z., Mao, D., Ren, C., Song, K., Zhao, C., et al. (2023). Mapping global distribution of mangrove forests at 10-m resolution. Sci. Bull. 68 (12), 1306–1316. doi:10.1016/j.scib.2023.05.004
Kavhu, B., Mashimbye, Z. E., and Luvuno, L. (2021). Climate-based regionalization and inclusion of spectral indices for enhancing transboundary land-use/cover classification using deep learning and machine learning. Remote Sens. 13 (24), 5054. doi:10.3390/rs13245054
Khan, M. U., Cai, L., Nazim, K., Ahmed, M., Zhao, X., and Yang, D. (2022). Effects of the summer monsoon on the polychaete assemblages and benthic environment of three mangrove swamps along the Sindh coast, Pakistan. Regional Stud. Mar. Sci. 56 (November), 102613. doi:10.1016/j.rsma.2022.102613
Liao, J. (2022). Global 30-m spatial distribution of mangroves in 2000-2020 (GMF30_2000-2020). Beijing: International Research Center of Big Data for Sustainable Development Goals CBAS. doi:10.12237/casearth.62ff4caa819aec75a535cbe8
Liao, J., Zhen, J., Zhang, Li, and Metternicht, G. (2019). Understanding dynamics of mangrove forest on protected areas of hainan island, China: 30 Years of evidence from remote sensing. Sustainability 11 (19), 5356. doi:10.3390/su11195356
Liu, Y., Lin, Yu, Liu, W., Zhou, J., and Wang, J. (2024). Remote sensing perspective in exploring the spatiotemporal variation characteristics and post-disaster recovery of ecological environment quality, a case study of the 2010 Ms7.1 yushu earthquake. Geomatics, Nat. Hazards Risk 15 (December). doi:10.1080/19475705.2024.2314578
Liu, Y., Lin, Yu, Wang, F., Xu, N., and Zhou, J. (2023). Post-earthquake recovery and its driving forces of ecological environment quality using remote sensing and GIScience, a case study of 2015 Ms8.1 Nepal earthquake. Geomatics, Nat. Hazards Risk 14 (1), 2279496. doi:10.1080/19475705.2023.2279496
Lovelock, C. E., Cahoon, D. R., Friess, D. A., Guntenspergen, G. R., Krauss, K. W., Reef, R., et al. (2015). The vulnerability of indo-pacific mangrove forests to sea-level rise. Nature 526 (7574), 559–563. doi:10.1038/nature15538
Mahar, G. A., Hussain, B., Riaz, A. W., Tahir Hussain, A., and Khan, S. H. (2020). Remote sensing (RS) monitoring of mangroves plantation against the guinness world record (GWR) of maximum plantation in Indus delta. Pak. J. Bot. 52 (4). doi:10.30848/PJB2020-4(16)
Masood, H., Afsar, S., Bin Zamir, U., and Hassan Kazmi, J. (2015). Application of comparative remote sensing techniques for monitoring mangroves in Indus delta, Sindh, Pakistan. Biol. Forum 7 (1).
Mcfeeters, S. K. (1996). The use of the normalized difference water Index (NDWI) in the delineation of open water features. Int. J. Remote Sens. 17 (7), 1425–1432. doi:10.1080/01431169608948714
McSherry, M., Davis, R. P., Andradi-Brown, D. A., Ahmadia, G. N., Van Kempen, M., and Brian, S. W. (2023). Integrated mangrove aquaculture: the sustainable choice for mangroves and aquaculture? Front. For. Glob. Change 6. doi:10.3389/ffgc.2023.1094306
Merzdorf, J. (2020). NASA study maps the roots of global mangrove loss - NASA. Available at: https://www.nasa.gov/centers-and-facilities/goddard/nasa-study-maps-the-roots-of-global-mangrove-loss/ (Accessed August 18, 2020).
Nawaz, Z., Li, X., Chen, Y., Nawaz, N., Gull, R., and Elnashar, A. (2020). Spatio-temporal assessment of global precipitation products over the largest agriculture region in Pakistan. Remote Sens. 12 (21), 3650. doi:10.3390/rs12213650
Osgouei, E. P., Kaya, S., Sertel, E., and Alganci, U. (2019). Separating built-up areas from bare land in mediterranean cities using sentinel-2A imagery. Remote Sens. 11 (3), 345. doi:10.3390/rs11030345
Pakistan Bureau of Statistics (2024). Population Census. Available at: https://www.pbs.gov.pk/content/population-census (Accessed March 31, 2024).
Parashar, N. (2023). “Classification techniques in remote sensing: a review,” in Communication, networks and computing. Editors R. Singh Tomar, S. Verma, B. Kumar Chaurasia, V. Singh, J. H. Abawajy, S. Akasheet al. (Cham: Springer Nature Switzerland), 40–50. doi:10.1007/978-3-031-43140-1_5
Parman, R. P., Kamarudin, N., Ibrahim, F. H., Nuruddin, A. A., Omar, H., and Wahab, Z. A. (2022). Geostatistical analysis of mangrove ecosystem health: mapping and modelling of sampling uncertainty using kriging. Forests 13 (8), 1185. doi:10.3390/f13081185
Pastor-Guzman, J., Dash, J., and Atkinson, P. M. (2018). Remote sensing of mangrove forest phenology and its environmental drivers. Remote Sens. Environ. 205 (February), 71–84. doi:10.1016/j.rse.2017.11.009
Puyravaud, J.-P. (2003). Standardizing the calculation of the annual rate of deforestation. For. Ecol. Manag. 177 (1), 593–596. doi:10.1016/S0378-1127(02)00335-3
Reithmaier, G. M. S., Cabral, A., Akhand, A., Bogard, M. J., Borges, A. V., Bouillon, S., et al. (2023). Carbonate chemistry and carbon sequestration driven by inorganic carbon outwelling from mangroves and saltmarshes. Nat. Commun. 14 (1), 8196. doi:10.1038/s41467-023-44037-w
Ruan, L., Yan, M., Zhang, Li, Fan, X. S., and Yang, H. (2022). Spatial-temporal NDVI pattern of global mangroves: a growing trend during 2000–2018. Sci. Total Environ. 844 (October), 157075. doi:10.1016/j.scitotenv.2022.157075
Sachs, J. D., Lafortune, G., Fuller, G., and Drumm, E. (2023). Sustainable development report 2023. Available at: https://s3.amazonaws.com/sustainabledevelopment.report/2023/sustainable-development-report-2023.pdf.
Sadaiyandi, J., Arumugam, P., Kumar Sangaiah, A., and Zhang, C. (2023). Stratified sampling-based deep learning approach to increase prediction accuracy of unbalanced dataset. Electronics 12 (21), 4423. doi:10.3390/electronics12214423
Saeed, U., Sajid Rashid, A., Hammad, G., Rab, N., Naeem, S., Ashraf, I., et al. (2019). Monitoring mangroves plantation sites through integration of repeat terrestrial photographs and spaceborne imagery. Biol. Pak.
Saifullah, S. M. (1997). “Management of the Indus delta mangroves,” in Coastal zone management imperative for maritime developing nations. Coastal systems and continental margins. Editors B. U. Haq, S. M. Haq, G. Kullenberg, and J. H. Stel (Dordrecht: Springer Netherlands), 3, 333–346. doi:10.1007/978-94-017-1066-4_18
Santini, N. S., Reef, R., Lockington, D. A., and Lovelock, C. E. (2015). The use of fresh and saline water sources by the mangrove Avicennia marina. Hydrobiologia 745 (1), 59–68. doi:10.1007/s10750-014-2091-2
Sasmito, S. D., Basyuni, M., Kridalaksana, A., Saragi-Sasmito, M. F., Lovelock, C. E., and Murdiyarso, D. (2023). Challenges and opportunities for achieving sustainable development goals through restoration of Indonesia’s mangroves. Nat. Ecol. Evol. 7 (1), 62–70. doi:10.1038/s41559-022-01926-5
SDGs in Pakistan (2023). Sustainable Development Goals. Available at: https://sdgs.punjab.gov.pk/sdgs-in-pakistan (Accessed November 6, 2023).
Sun, Z., Jiang, W., Ling, Z., Zhong, S., Zhang, Ze, Song, J., et al. (2023). Using multisource high-resolution remote sensing data (2 m) with a habitat–tide–semantic segmentation approach for mangrove mapping. Remote Sens. 15 (22), 5271. doi:10.3390/rs15225271
Sustainable Development Goals (2023). THE 17 GOALS. Available at: https://sdgs.un.org/goals (Accessed November 6, 2023).
Tang, W., Zheng, M., Xiang, Z., Shi, J., Yang, J., and Trettin, C. C. (2018). Big geospatial data analytics for global mangrove biomass and carbon estimation. Sustainability 10 (2), 472. doi:10.3390/su10020472
Traganos, D., Poursanidis, D., Aggarwal, B., Chrysoulakis, N., and Reinartz, P. (2018). Estimating satellite-derived bathymetry (SDB) with the Google earth engine and sentinel-2. Remote Sens. 10 (6), 859. doi:10.3390/rs10060859
Tucker, C. J. (1979). Red and photographic infrared linear combinations for monitoring vegetation. Remote Sens. Environ. 8 (2), 127–150. doi:10.1016/0034-4257(79)90013-0
UN-DESA (2020). The community of ocean action for mangroves – towards the implementation of SDG14 | interim report to UN-desa. New York, USA: United Nations Department of Economic and Social Affairs. Available at: https://sdgs.un.org/sites/default/files/documents/22784Mangrove_COA_interim_assessment.pdf.
Waleed, M., Sajjad, M., Acheampong, A. O., and Alam, Md T. (2023). Towards sustainable and livable cities: leveraging remote sensing, machine learning, and geo-information modelling to explore and predict thermal field variance in response to urban growth. Sustainability 15 (2), 1416. doi:10.3390/su15021416
Wang, Y., Wang, X., Khan, S., Zhou, D., and Ke, Y. (2023). Evaluation of mangrove restoration effectiveness using remote sensing indices - a case study in Guangxi Shankou mangrove national natural reserve, China. Front. Mar. Sci. 10 (November), 1280373. doi:10.3389/fmars.2023.1280373
Wang, Z., Yang, Z., Shi, H., Han, F., Liu, Q., Qi, J., et al. (2020). Ecosystem health assessment of world natural heritage sites based on remote sensing and field sampling verification: Bayanbulak as case study. Sustainability 12 (7), 2610. doi:10.3390/su12072610
Whitfield, A. K. (2017). The role of seagrass meadows, mangrove forests, salt marshes and reed beds as nursery areas and food sources for fishes in Estuaries. Rev. Fish Biol. Fish. 27 (1), 75–110. doi:10.1007/s11160-016-9454-x
Xiao, H., Su, F., Fu, D., Qi, W., and Huang, C. (2020). Coastal mangrove response to marine erosion: evaluating the impacts of spatial distribution and vegetation growth in Bangkok Bay from 1987 to 2017. Remote Sens. 12 (2), 220. doi:10.3390/rs12020220
Xu, C., Wang, J., Sang, Yu, Li, K., Liu, J., and Yang, G. (2023). An effective deep learning model for monitoring mangroves: a case study of the Indus delta. Remote Sens. 15 (9), 2220. doi:10.3390/rs15092220
Yan, Z., Sun, X., Xu, Y., Zhang, Q., and Li, X. (2017). Accumulation and tolerance of mangroves to heavy metals: a review. Curr. Pollut. Rep. 3 (4), 302–317. doi:10.1007/s40726-017-0066-4
Zanaga, D., Van De Kerchove, R., Daems, D., De Keersmaecker, W., Brockmann, C., Kirches, G., et al. (2022). ESA WorldCover 10 m 2021 V200. doi:10.5281/ZENODO.7254221
Zanaga, D., Van De Kerchove, R., De Keersmaecker, W., Souverijns, N., Brockmann, C., Quast, R., et al. (2021). ESA WorldCover 10 m 2020 V100. doi:10.5281/ZENODO.5571936
Zha, Y., Gao, J., and Ni, S. (2003). Use of normalized difference built-up Index in automatically mapping urban areas from TM imagery. Int. J. Remote Sens. 24 (3), 583–594. doi:10.1080/01431160304987
Keywords: mangrove extent mapping, mangrove health mapping, Sustainable Development Goal-14, Sustainable Development Goal target 14.2, Google Earth Engine
Citation: Raza SA, Zhang L, Zuo J and Chen B (2024) Time series monitoring and analysis of Pakistan’s mangrove using Sentinel-2 data. Front. Environ. Sci. 12:1416450. doi: 10.3389/fenvs.2024.1416450
Received: 15 April 2024; Accepted: 12 July 2024;
Published: 05 August 2024.
Edited by:
Erhan Sener, Süleyman Demirel University, TürkiyeReviewed by:
Sinan Demir, Isparta University of Applied Sciences, TürkiyeYaohui Liu, Shandong Jianzhu University, China
Copyright © 2024 Raza, Zhang, Zuo and Chen. This is an open-access article distributed under the terms of the Creative Commons Attribution License (CC BY). The use, distribution or reproduction in other forums is permitted, provided the original author(s) and the copyright owner(s) are credited and that the original publication in this journal is cited, in accordance with accepted academic practice. No use, distribution or reproduction is permitted which does not comply with these terms.
*Correspondence: Bowei Chen, Y2hlbmJ3QGFpcmNhcy5hYy5jbg==