 Qiaochu Li
 Junhua Chen1
95% of researchers rate our articles as excellent or good
Learn more about the work of our research integrity team to safeguard the quality of each article we publish.
Find out more
ORIGINAL RESEARCH article
Front. Environ. Sci. , 22 July 2024
Sec. Environmental Economics and Management
Volume 12 - 2024 | https://doi.org/10.3389/fenvs.2024.1414730
Clarifying the key sectors and influencing factors of carbon emissions from energy consumption is an important prerequisite for achieving the “carbon peaking and carbon neutrality” goals. This study calculated the carbon emissions of fuel combustion in 7 major departments and regional electricity trading of Sichuan Province from 2000 to 2021, and empirically analyzed the impact of energy structure effect, energy intensity effect, industrial structure effect, economic development level effect, and population size effect on the carbon emissions of energy consumption based on the LMDI model. The main research conclusions are as follows: (1) LMDI model has the advantages of no residual and high interpretation. By refining the multi-departments of energy consumption and different types of fuel, it is helpful to improve the accuracy of empirical analysis results. (2) The carbon emissions of energy consumption mainly come from the fuel combustion process. Specifically, the industry sector composed of steel, building materials, chemicals and machinery is the key emission sector, and transportation and residential life are also vital. Regional electricity trading can indirectly reduce the intensity of carbon emissions while ensuring the safety of energy supply. (3) From 2000 to 2021, the energy intensity effect and the economic development level effect were key factors in slowing down and promoting the carbon emission growth of energy consumption in Sichuan Province, respectively. The population scale effect mainly played a positive role in driving carbon emissions, but the impact is small and almost negligible. Before 2012, the energy structure effect and the industrial structure effect were mainly positive driving effects, and after 2012, they all turned into negative inhibitory effects. This was mainly due to the low-carbon transformation of energy structure and the optimization of industrial structure.
Climate change has become a major issue related to human survival and sustainable development, with increasing risks such as high temperatures, extreme precipitation, and natural disasters (Capua and Rahmstorf, 2023). The main cause of climate change is greenhouse gas emissions caused by human activities. Once greenhouse gases are formed in the atmosphere, they will change the thermal balance of the earth while capturing solar radiation. Under the influence of solar radiation, more heat enters the earth, which eventually leads to the rising ambient temperature. The frequent occurrence of glacier melting and extreme weather phenomena caused by global warming will lead to increasing casualties and economic losses. This will not only threaten some cities and even countries to disappear from the earth’s surface, but also seriously affect the supply of fresh water and food and human health. Therefore, it is urgent for countries around the world to unite and cooperate to achieve carbon reduction on a global scale (Maher and Symons, 2022). In March 2023, the AR6 Synthesis Report: Climate Change 2023 issued by the intergovernmental panel on climate change (IPCC) further clarified that greenhouse gas emissions from human energy activities are the main cause of global warming. Energy resources are the material foundation of human social progress, and the explosive growth in the development and utilization of fossil fuels has driven a rapid increase in global carbon dioxide emissions (Slameršak et al., 2022). The energy system with fossil energy as the main body contributes significantly to the greenhouse effect, and addressing climate change has become a huge challenge for human society (Huang Y. M. et al., 2023). According to the Statistical Bulletin of National Economic and Social Development in 2023 issued by the National Bureau of Statistics, China’s total energy consumption exceeded 5.72 billion tons of standard coal, of which coal consumption accounted for 55.30% and oil accounted for more than 18%. The stable dominant position of high carbon fossil fuels in the energy consumption structure has led to the continuous exacerbation of issues such as climate warming and ecological environment damage in China (Xu et al., 2024).
As the largest developing country in the world, China has become the first contributor to global carbon emissions since 2009, which has caused the pressure of international climate negotiations and domestic environmental degradation (Ai et al., 2023). During the general debate of the 75th United Nations General Assembly, China proposed that it would strive to reach the carbon peaking by 2030 and achieve the carbon neutrality by 2060. However, China is currently still in a period of economic growth and carbon emission growth, so it is necessary to comprehensively consider the contradiction between carbon emission reduction and economic and social development (Zhang et al., 2023). Meanwhile, addressing climate change is a systematic project that involves various aspects of economic and social development, and it is urgent for all walks of life to face the enormous challenge of greenhouse gas emission reduction together (Zeng et al., 2021). With the implementation of “carbon peaking and carbon neutrality,” the low-carbon transformation of energy has become the key to carbon emission reduction (Yang et al., 2021).
As an important high-quality clean energy base in China, Sichuan Province has unique advantages in natural gas and hydropower resources (Tian et al., 2021). However, its consumption of non-clean energy such as coal and oil products still accounts for more than 60%, and the high-carbon characteristics of energy consumption have brought great pressure to economic and social development and ecological environment protection (Luo et al., 2021). Therefore, it is urgent for Sichuan Province to complete the gradual substitution of clean energy for high-carbon fossil energy and promote the optimization of energy consumption structure under the new pattern of low-carbon development (Liu et al., 2020). With the construction of the Chengdu-Chongqing dual city economic circle becoming a national strategy, it will form an important growth driving force for regional high-quality development (Yi Ding et al., 2023). This will provide new impetus, new paths, and new goals for the creation of a clean energy demonstration province in Sichuan Province, and help solve the important problem of regional low-carbon energy transformation (Pan et al., 2021).
The important premise of scientifically analyzing the key areas of carbon emissions of energy consumption is to accurately construct a carbon emission inventory. Meanwhile, clarifying the differential effects of key influencing factors is an important starting point for carbon emission reduction. Therefore, it is of practical significance to pay attention to the regional carbon emission characteristics and its influencing factors. In this regard, the major contributions of this research are as follows: (1) By systematically investigating the time evolution path of carbon emissions over a long time span from 2000 to 2021, it is helpful to make up for the lack of existing research that mainly focuses on spatial differences. Meanwhile, the indirect carbon emissions during the regional electricity trading was calculated to clarify the responsibility of carbon emissions in Sichuan Province and its surrounding provinces, which was rarely considered in previous research. (2) The basic structural decomposition model does not take into account the impact of different energy users and fuel types. In this study, the original Kaya identity and logarithmic mean divisia decomposition (LMDI) model were expanded and decomposed to consider the multiple departments and energy consumption types related to carbon emissions. This is helpful to optimize the analytical framework of LMDI model in theory, and improve the accuracy of empirical analysis results. (3) As the largest province in the western region, Sichuan Province is an important ecological barrier and water source conservation area in the upper reaches of the Yangtze River, as well as an important high-quality clean energy base in China. Taking Sichuan Province as the research object, it is helpful to explore demonstration paths for the low-carbon transformation of regional energy consumption. Meanwhile, it can guide the energy producing areas to comprehensively promote the implementation of national independent contribution goals from the bottom up based on its resource endowment advantages.
The rest of this paper is structured as follows: The relevant literature review is in point 2. Model and data are introduced in point 3. Empirical analysis results are in point 4. Main conclusions and policy implications are in point 5.
The calculation of carbon emissions from energy consumption is mainly based on the inventory estimation method, which multiplies the consumption of different types of energy by the corresponding CO2 emission coefficients to investigate the carbon emission level. Specific methods can be classified into the following 3 categories.
The first is the general method of calculating by departments, and it adopts a “bottom-up” research framework. Based on the statistics of various types of energy consumption in different industries by departments, it uses the reference emission coefficients proposed in documents such as IPCC guidelines for national greenhouse gas inventories. Li et al. (2022) calculated the carbon emissions of coal, oil and natural gas consumption in Sichuan Province from 2005 to 2019 based on the standard value of carbon emission coefficients issued by IPCC. The results indicated that regional carbon emissions showed a trend of first increasing and then decreasing, and coal consumption contributed the most to the greenhouse effect. Liu and Yan (2022) calculated the carbon emissions of 11 types of energy consumption in Changxing City from 2001 to 2016 based on the carbon emission coefficients proposed in the 2006 IPCC guidelines for national greenhouse gas inventories, and the results showed that the changes in carbon emissions were mainly influenced by industrial energy consumption. Makondo (2023); Köne and Büke (2019) investigated the carbon emission characteristics of fossil energy consumption in Zambia and Turkey respectively by using IPCC inventory algorithm and its reference emission coefficients.
The second is actual method of calculating by departments. This method uses actual emission coefficients measured based on regional and industry characteristics, which is theoretically more accurate. However, due to the externality and complexity of the measurement, it may cause some uncertainty to the calculation results (Minx et al., 2021). ZHAO et al. (2012) constructed a carbon emission inventory accounting framework from a “bottom-up” perspective by combining economic sector classification, and calculated the carbon emission characteristics of China’s energy sector from 2005 to 2009 by using a newly field database of carbon emission coefficients. The results showed that using provincial energy consumption and China’s unique emission coefficients for calculation resulted in higher annual emission calculation values, thus increasing the uncertainty of evaluation. Mitra et al. (2020) calculated the carbon emission characteristics of energy consumption of shipbreaking industry in Bangladesh by combining the emission coefficients of Generation Resource Integrated Database, and the results showed that the carbon emission level of diesel fuel consumption is much higher than that of electricity consumption. Lu et al. (2023) established a database of carbon emission coefficients of construction industry in China, and conducted case analysis from five aspects: energy, manpower, materials, machinery, and green space.
The third is a reference method based on energy apparent consumption, and it adopts a “up-bottom” research framework. This method uses official energy statistical data to calculate carbon emissions of energy consumption, which has simple data requirements and can eliminate the estimation difference caused by statistical caliber on the macroscopic scale (Shamsuzzaman et al., 2021; Chen W. et al., 2023). Zhen et al. (2023) investigated the carbon emission characteristics of energy consumption in Ningxia Hui Autonomous Region based on the natural and socio-economic statistics in 2013, 2016 and 2019. Timofeyev et al. (2020) investigated the carbon emissions of St. Petersburg based on the statistical data at the city level, and compared it with the actual measurement data based on tomography method.
Existing researches mainly investigate the influencing factors of carbon emissions by using regression analysis method or structural decomposition method.
The regression analysis method mostly uses stochastic impacts by regression on population, affluence, and technology (STIRPAT) model, environmental Kuznets curve (EKC) or spatial regression model as the research framework, and investigates the impact of factors such as population, economy, technology, energy structure, and urbanization rate on carbon emissions based on econometric analysis. Lin et al. (2009) used STIRPAT model to analyze the impact of population, urbanization level, per capita GDP, industrialization level and energy intensity on carbon emissions, and the results showed that the most influential factor is population, followed by urbanization level, per capita GDP and energy intensity. Jian et al. (2023) used STIRPAT model to regress the panel data of 36 cities in the Yangtze River Delta from 2010 to 2021 and analyze the driving factors of carbon emissions. Balcilar et al. (2023) used the STIRPAT model to investigate the effects of natural resource exploitation, population, wealth and trade openness on carbon emissions in 17 African countries from 1971 to 2019. Lv et al. (2023) used STIRPAT model to analyze the differential effects of population, economy and technology factors on carbon emissions in the demonstration area of ecological civilization in China, and the results showed that reasonable population size, economic structure optimization and clean production technology development can help effectively control the regional carbon emission intensity. Narayan and Narayan (2010) investigated the relationship between economic development level and carbon emissions by using 43 developing countries as research samples. The results showed that in the short term, the increase of carbon emissions was synchronized with economic growth, while in the long term, carbon emissions had a downward trend with economic growth, which was in line with the characteristics of EKC. Thio et al. (2021) analyzed the driving factors of carbon emissions in 10 countries, such as the United States, Russia, Germany, Canada, Japan, etc., and investigated the relationship between variables and examined the EKC hypothesis by using panel quantile regression. Noman et al. (2022); Huang et al. (2022); Jiang et al. (2021) respectively verified the EKC hypothesis on carbon emissions of energy consumption in residential life, transportation sector, and power production sector. Xu (2023) used the spatial regression model to analyze the influencing factors of carbon emissions based on the panel data of different regions in Anhui Province before the COVID-19, and the results showed that urbanization rate, economic development level and population size had a significant impact, while the influence of industrial structure was the smallest. Hao et al. (2022) investigated the influencing factors of carbon emissions of animal husbandry based on spatial autocorrelation model and Tobit model, and the results showed that industrial structure, population and farmers’ income level were the incentive factors of carbon emissions, while urbanization and agricultural mechanization level were the inhibitory factors.
The structural decomposition method mainly uses the LMDI model to investigate the quantitative contribution of various influencing factors to the changes of carbon emissions, and Kaya identity is its theoretical basis. Kaya identity is a theoretical model used to decompose the variation of carbon emissions, which holds that the growth of carbon emissions is mainly driven by four factors: population size, economic development, energy consumption intensity and carbon emission intensity (González-Torres et al., 2021). Based on Kaya identity, LMDI model decomposes the changes of carbon emissions during the research period into the contributions of the above four indicators (Xia, 2011). According to research needs, the influencing factors of carbon emission changes have been expanded with the development of empirical research. Meng et al. (2023) decomposed the carbon emission changes of land utilization in 9 provinces of the Yellow River Basin into the contributions of population scale, economic scale, land utilization structure and land utilization efficiency by using LMDI model. He et al. (2022) decomposed the carbon emission growth of thermal power generation industry into the contributions of carbon emission coefficient, energy consumption structure, energy intensity, power structure, power transaction, power loss, power consumption intensity, economic distribution and economic scale. Isik et al. (2020); Akyürek (2020); Dai and Gao (2016); Lin and Kui (2017) respectively decomposed the influencing factors of carbon emissions in transportation sector, manufacturing industry, logistics industry and heavy industry. In the field of carbon emissions from regional energy consumption, Guan et al. (2018); Yang et al. (2020) decomposed the changes of carbon emissions of 3 types of fossil energy consumption in China into the contributions of population size, per capita GDP, industrial structure, industrial energy intensity, energy structure and energy carbon intensity. Peng and Liu (2023) decomposed the changes of carbon emissions of coal consumption into the contributions of carbon emission intensity, energy structure, energy intensity, economic output and population size. Liu Y. X. et al., (2022) decomposed the changes of carbon emissions of urban coal, oil, natural gas, and electricity consumption into the contributions of GDP, industrial structure, energy intensity, population size, urbanization process, per capita energy consumption, and urban-rural energy structure.
So far, the researches on the calculation of carbon emissions of energy consumption and the analysis of influencing factors of carbon emissions have made some progress in theory and practice, but the existing researches have limitations in the following aspects: firstly, the analysis of carbon emission characteristics focuses more on spatial heterogeneity (Feng et al., 2022; Huang L. P. et al., 2023; Liu et al., 2023; Qu et al., 2024; Zhang et al., 2024), which is not conducive to investigating the time evolution track of regional carbon emissions. Meanwhile, existing researches mostly pay attention to the direct carbon emissions caused by energy consumption (Solazzo et al., 2021), thus ignoring the transfer of carbon emission responsibility caused by regional energy allocation. Secondly, when the number of research objects is single or small, the structural decomposition method represented by LMDI model has the advantages of no residual and high interpretation compared with regression analysis method (Li et al., 2018). However, in order to simplify the calculation, many researches have not fully considered the multiple departments and energy consumption types related to carbon emissions when carrying out structural decomposition, thus reducing the accuracy of empirical analysis results (Xin et al., 2021; Abbas et al., 2023; Ren et al., 2023; Wu et al., 2023).
In the process of energy consumption, fossil fuel combustion is the main source of carbon emissions (Paraschiv and Paraschiv, 2020). The carbon emissions comes from the intentional oxidation process of fuel inside or outside the equipment when providing heat or mechanical work for a certain process (Sadkin et al., 2023), and mainly from the terminal energy consumption of the three major industries and residential life. Referring to the IPCC guidelines for national greenhouse gas inventories, the calculation method for carbon emissions is shown in Formula 1.
where Cfb is the total carbon emissions of fuel combustion; Qi,j is the physical consumption of the j-th fuel by the i-th department; Nj is the net calorific value of the j-th fuel; Ej is the carbon emission coefficient of the j-th fuel.
In order to clarify the responsibility of carbon emissions in Sichuan Province and its surrounding provinces, it is necessary to calculate the indirect carbon emissions during the regional electricity trading (du Can et al., 2015). Referring to the guideline for the preparation of provincial greenhouse gas inventory (trial) proposed by the National Development and Reform Commission, the calculation method is shown in Formula 2.
where Cet is the indirect carbon emissions of regional electricity trading; Ap is the difference in electricity transferred in and out of Sichuan province; Q is the average carbon emission coefficient of regional power supply.
Scholar Kaya proposed the Kaya identity at the IPCC seminar in 1989 (Tavakoli, 2018), and expressed the changes in carbon emissions as the result of the combined effects of energy consumption, economic development, and population growth. The basic equation is shown in Formula 3.
where C is the carbon emissions; E is the regional energy consumption; Q is the regional gross domestic product (GDP); P is the population size.
Due to the excellent openness and scalability of Kaya identity, this study extends and decomposes it to consider the multiple departments and energy consumption types (Lyu, 2016). For the macro-level carbon emissions such as provincial energy consumption, the extended Kaya identity is shown in Formula 4.
where Qi,j is the carbon emissions of the j-th energy by the i-th industry; Ei,j is the consumption of the j-th energy by the i-th industry; Qi is the GDP of the i-th industry.
By further simplifying Formula 4, the Formula 5 can be obtained.
where CECij = Cij/Eij, which is the ratio of carbon emissions to energy consumption when the i-th industry consumes the j-th energy, indicating the carbon emission coefficient; ECSij = Eij/Ei, which is the ratio of the j-th energy consumption of the i-th industry to the total energy consumption of the i-th industry, indicating the energy consumption structure; ECIi = Ei/Qi, which is the ratio of the total energy consumption of the i-th industry to the industry’s GDP, indicating the energy consumption intensity; ISi = Qi/Q, which is the ratio of the i-th industry’s GDP to regional total GDP, indicating the regional industrial structure; EDI = Q/P, which is the ratio of regional total GDP to regional total population, indicating the per capita wealth; PS = P, which is the regional total population, indicating the population size.
Combined with the extended Kaya identity, and according to the LMDI model proposed by Ang (Ang, 2005), the comprehensive effects of factors affecting carbon emissions of energy consumption are decomposed into carbon emission coefficient effect, energy structure effect, energy intensity effect, industrial structure effect, economic development level effect and population size effect (Ang, 2015). The decomposition formula is shown in Formula 6. According to the assumption of the IPCC, the carbon emission coefficient of energy consumption will not change with time, meaning that the carbon emission coefficient effect can be ignored.
where ΔC is the change in carbon emissions of energy consumption from the 0-th year to the T-th year; CT is the carbon emission in the T-th year representing the final stage; C0 is the carbon emission in the 0-th year representing the base stage; ΔCES is the change in carbon emissions caused by changes in energy consumption structure from the base period to the final period; ΔCEI is the change in carbon emissions caused by changes in energy consumption intensity from the base period to the final period; ΔCIS is the change in carbon emissions caused by changes in industrial structure from the base period to the final period; ΔCED is the change in carbon emissions caused by changes in economic development level from the base period to the final period; ΔCPS is the change in carbon emissions caused by changes in population size from the base period to the final period.
The basic equations of contribution values of different decomposition factors are shown in Formulas 7–11 respectively (González-Torres et al., 2021).
The basic equations of contribution rates of different decomposition factors are shown in Formulas 12–16 respectively.
Where rES is the contribution rate of changes in energy consumption structure to carbon emissions of energy consumption in Sichuan Province from the base period to the final period; rEI is the contribution rate of changes in energy consumption intensity to carbon emissions of energy consumption in Sichuan Province from the base period to the final period; rIS is the contribution rate of changes in industrial structure to carbon emissions of energy consumption in Sichuan Province from the base period to the final period; rED is the contribution rate of changes in economic development level to carbon emissions of energy consumption in Sichuan Province from the base period to the final period; rPS is the contribution rate of changes in population size to carbon emissions of energy consumption in Sichuan Province from the base period to the final period.
Based on the extended Kaya identity and LMDI decomposition model, this study selects the following representative carbon emission influencing factors.
The change of energy consumption structure is one of the important reasons for the change in carbon emissions. The proportion of coal and oil consumption in Sichuan Province has been around 60% for many years, and the high proportion of non-clean energy consumption has a direct impact on carbon emission level. Because the carbon emission coefficients of fossil energy is far greater than that of renewable energy, a large amount of CO2 will be produced during its combustion process, which will have great resistance to regional carbon emission reduction. This study selects the proportion of different types of energy consumption to the total energy consumption to represent the current energy consumption structure in Sichuan Province, which is expressed by ECS.
Energy consumption intensity is an economic index used to measure the energy utilization efficiency of a country or region. The lower the energy consumption intensity, the more mature the regional energy utilization technology. Meanwhile, the innovative development of energy technology can significantly improve energy utilization efficiency and reduce the total energy consumption, thus effectively controlling CO2 emission in the energy system. Therefore, energy consumption intensity can be used to reflect the level of regional technological innovation. This study selects the ratio of the regional total energy consumption to the actual GDP (calculated at the constant price of the base period) to represent the current situation of energy consumption intensity in Sichuan Province, which is expressed by ECI.
The mutual transformation among the three major industries and the internal adjustments of each industry will have an important impact on the carbon emission intensity. In the process of economic and social development in Sichuan Province, the secondary industry occupies an important position. However, due to the characteristics of its production process, a lot of fossil energy will be consumed during the daily operations, thus inevitably resulting in a large amount of carbon emissions. This study selects the proportion of output values of different industries in regional total GDP to represent the current situation of industrial structure in Sichuan Province, which is expressed by IS.
Per capita GDP is an important reflection of national wealth. With the improvement of people’s living standards, the total energy consumption continues to increase, and its impact on the ecological environment is becoming increasingly significant. However, according to the concept of carbon emission intensity, if the growth rate of GDP exceeds the growth rate of CO2 emissions, the carbon emission intensity will decrease. Therefore, the impact of economic development level on regional carbon emissions is uncertain, and it depends on the relative size of CO2 emission and GDP growth. This study selects per capita GDP to reflect the situation of economic development level in Sichuan Province, which is expressed by EDI.
There is a positive correlation between population size and carbon emissions. The huge population and sustained growth trend are important reasons why China has become one of the largest contributors to greenhouse gases in the world. Therefore, it is necessary to investigate the impact of population size on regional carbon emissions. The population factors mainly affects regional energy consumption and carbon emissions through two modes: “crowd effect” and “civilization effect”. “Crowd effect” means that the larger the population, the greater the demand for energy, and the more CO2 it produces. That is, it has a positive driving effect on carbon emissions. “Civilization effect” means that with the increasing population concentration, the utilization efficiency of urban public infrastructure is improved, and residents’ quality and low-carbon awareness are constantly enhanced, which is helpful to reduce energy consumption and carbon emissions. That is, it also has a negative inhibitory effect on carbon emissions. In summary, the impact of population size on regional carbon emissions is uncertain. This study selects the number of permanent residents at the end of the year to reflect the current population size of Sichuan Province, which is expressed by PS.
This study selects Sichuan Province, a demonstration province of clean energy in China, as the research object, and the research period is from 2000 to 2021. CO2 can absorb and release infrared radiation, and is the main cause of the greenhouse effect (Ramos et al., 2024). Therefore, this study mainly calculates CO2 emissions during the process of energy consumption. The calculation scope of terminal energy consumption includes the three major industries and residential life. According to the national standard of the People’s Republic of China “Industrial classification for national economic activities (GB/T 4754–2017),” and China Energy Statistics Yearbook, the division of the three major industries and energy types are summarized in Table 1.
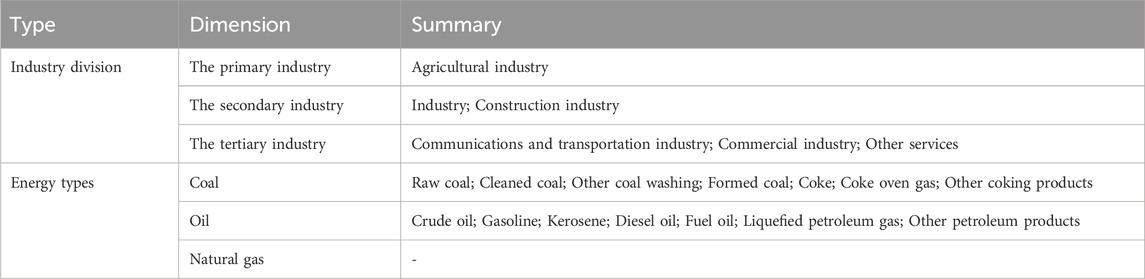
Table 1. Industry division and energy types.
The basic data and emission coefficients for calculating carbon emissions of energy consumption, as well as the basic data for analyzing influencing factors, are summarized in Table 2.

Table 2. Data sources.
According to the calculation method of carbon emissions of energy consumption, the carbon emission inventory of Sichuan province is obtained as shown in Table 3.
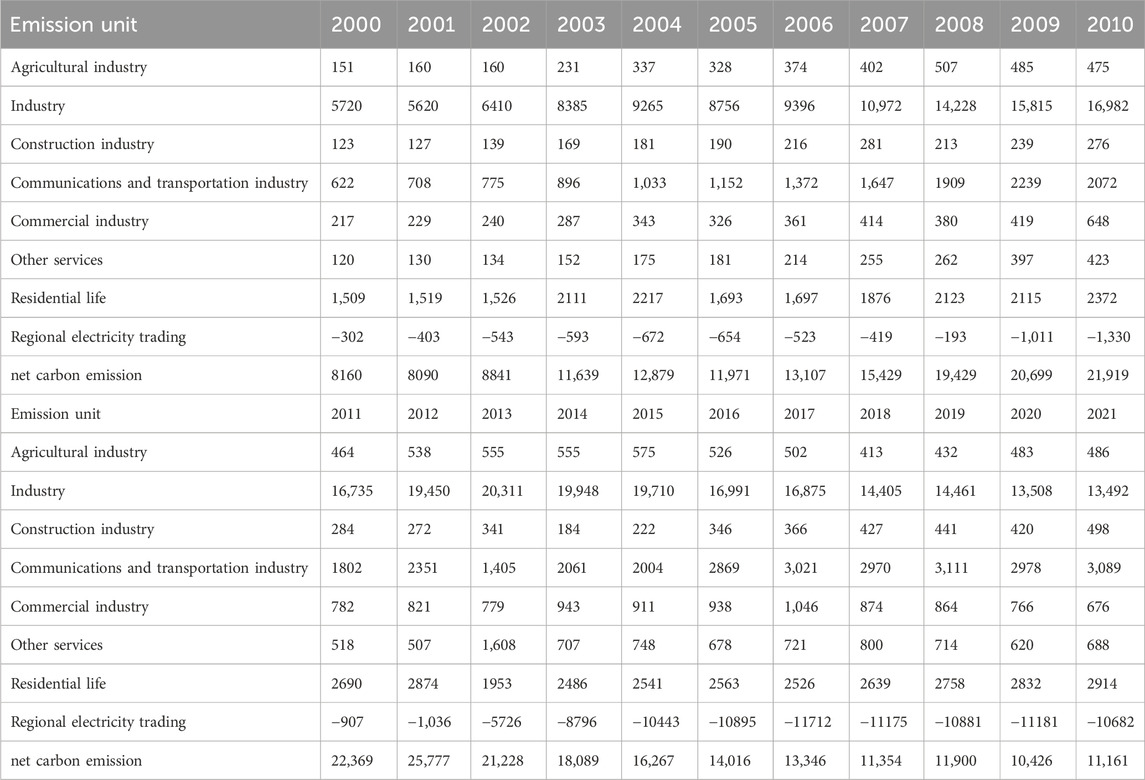
Table 3. Carbon emission inventory of energy consumption in Sichuan Province from 2000 to 2021 (Unit: 10,000 tons).
From 2000 to 2021, the overall carbon emissions of energy consumption in Sichuan Province showed a trend of first increasing and then decreasing. It reached its peak in 2012 and then began to decline year by year, which is consistent with the findings of Li et al. (2022). From 2012 to 2021, the carbon emissions of energy consumption slowed down at an average annual rate of 8.88%, which supported the rapid growth of regional GDP at an average annual rate of 9.43%. Therefore, the carbon emissions of energy consumption and regional economic development began to show a decoupling trend, which agrees with the findings of Chen et al. (Chen L. et al., 2023). This is mainly due to the fact that since 2013, with the prevention and control of air pollution becoming a national strategy, the carbon emission effect of energy activities had been given more attention. Sichuan Province began to carry out the “oil to gas” and “coal to gas” projects in the fields of residential life, industrial production and communications and transportation, and made great efforts to increase the proportion of clean energy in terminal energy consumption. In 2008, the growth rate of carbon emissions of energy consumption in Sichuan Province reached a historic high of 25.92%. The main reason for this phenomenon is that the international financial crisis in 2008 had a negative impact on the economic development of Sichuan Province. Meanwhile, the post-disaster recovery and reconstruction of the Wenchuan earthquake also led to a significant increase in energy consumption of the whole society. A large amount of refined oil products were transferred from outside the province for earthquake relief work, which brought great pressure on regional energy conservation and emission reduction. From 2019 to 2021, the carbon emissions of energy consumption in Sichuan Province showed a fluctuating trend, which was mainly due to the technical bottleneck of further promotion of clean and low-carbon energy utilization, and also affected by black swan events such as the COVID-19 epidemic. Currently, energy activities are still the largest contributor to carbon emissions in Sichuan Province. Regional development depends on a large amount of fossil energy consumption, which has become the bottleneck of low-carbon economic development in Sichuan Province. During the 14th Five Year Plan period, Sichuan Province should take advantage of its resource endowment to embark on a clean, low-carbon transformation and high-quality development path of “reducing coal, stabilizing oil, increasing gas, and vigorously developing new energy.”
The carbon emissions of energy consumption mainly come from the process of fuel combustion. The sector composition of carbon emissions from fuel combustion in 2021 is shown in Figure 1. Specifically, the industry sector composed of steel, building materials, chemicals and machinery is the key sector for carbon emissions of energy consumption, which is consistent with the research result of Wang et al. (2019) based on the perspective of city capital. In 2021, it produced 134.92 million tons of CO2 emissions, accounting for 61.77% of the total carbon emissions from fuel combustion. Therefore, in the process of industrial production, if the proportion of clean energy consumption can be continuously increased through electrification transformation and fuel substitution, it will greatly improve the level of energy saving and carbon reduction in Sichuan Province. Transportation and residential life are also vital in the carbon emission inventory of regional energy consumption. In 2021, they accounted for 14.14% and 13.34% of the total carbon emissions from fuel combustion, respectively. This was mainly due to the continuous promotion of urbanization in Sichuan Province, as well as the lifestyle changes caused by the improvement of residents’ wealth level. Meanwhile, transportation and residential life depended on the consumption of unclean fossil energy such as coal, gasoline and diesel during their daily operation, which inevitably lead to a large number of greenhouse gas emissions.
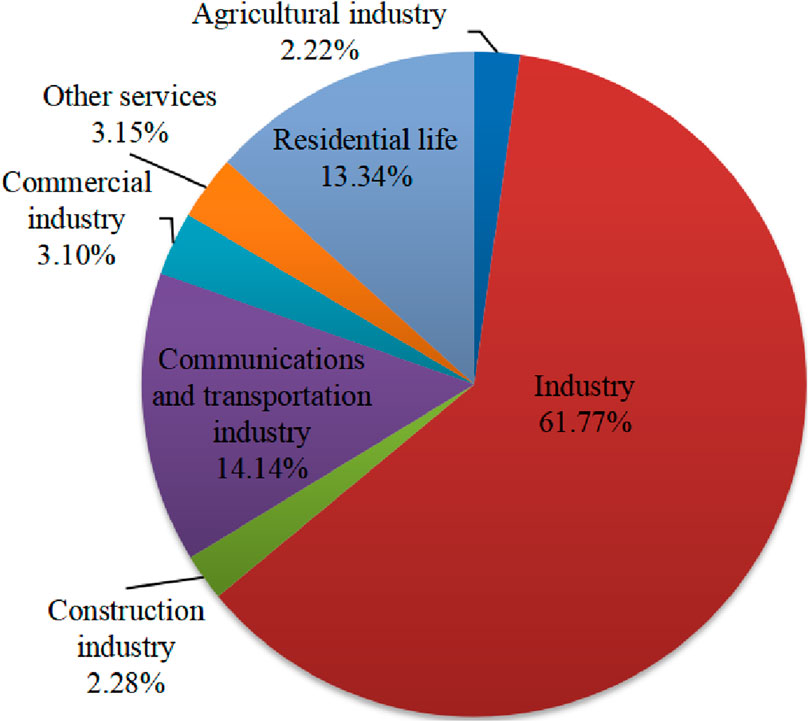
Figure 1. The sector composition of carbon emissions from fuel combustion in 2021.
Regional electricity trading could indirectly reduce the carbon emission contribution of energy consumption by exporting excess renewable energy generation, and the indirect emission reduction reached 106.82 million tons in 2021, which extends the previous research that did not consider the transfer of carbon emission responsibility caused by energy allocation (Han et al., 2021; Wang et al., 2024). In recent years, Sichuan Province had actively participated in the energy strategy of “Power Transmission from West to East.” Through the export of hydropower, it effectively guaranteed the safety of China’s energy supply and significantly reduced the carbon emission intensity of energy consumption. In this regard, regional electricity export had increased from 4.138 billion kWh in 2000 to 141.630 billion kWh in 2021, and the indirect emission reduction of electricity trade had also increased from 3.02 million tons to 106.82 million tons. This was helpful to promote full lifecycle emission reduction of energy utilization through clean power production. From the perspective of resource endowment, Sichuan Province has numerous rivers and particularly abundant hydropower resources. According to data from the Ministry of Water Resources of the People’s Republic of China, the total amount of water resources in Sichuan Province reaches 220.92 billion cubic meters, ranking third in China only after Xizang and Guangdong. The technical exploitable capacity of hydropower resources in Sichuan Province is about 148 million kilowatts, accounting for 21.29% of the national total. As a result, Sichuan Province has become an important sending end of “Power Transmission from West to East.” By the beginning of 2022, the installed capacity of hydropower in Sichuan Province had reached 88.87 million kilowatts, ranking first in the country. Therefore, during the 14th Five Year Plan period, Sichuan Province should continuously accelerate the construction of ultra-high voltage power grids, improve the peak shaving capacity and strengthen the optimal dispatching operation. Meanwhile, Sichuan Province should effectively promote the priority consumption within the province and the coordinated consumption across regions, and play a leading role to improve the clean and low-carbon utilization of energy in the western region and even the whole country.
Based on the time series data of Sichuan Province from 2000 to 2021, combined with the Kaya identity and LMDI model, this study empirically analyzes the impact of energy consumption structure, energy consumption intensity, industrial structure, economic development level, and population size on the carbon emissions of regional energy consumption. The annual effects during the research period of each influencing factor are shown in Table 4; Figure 2.
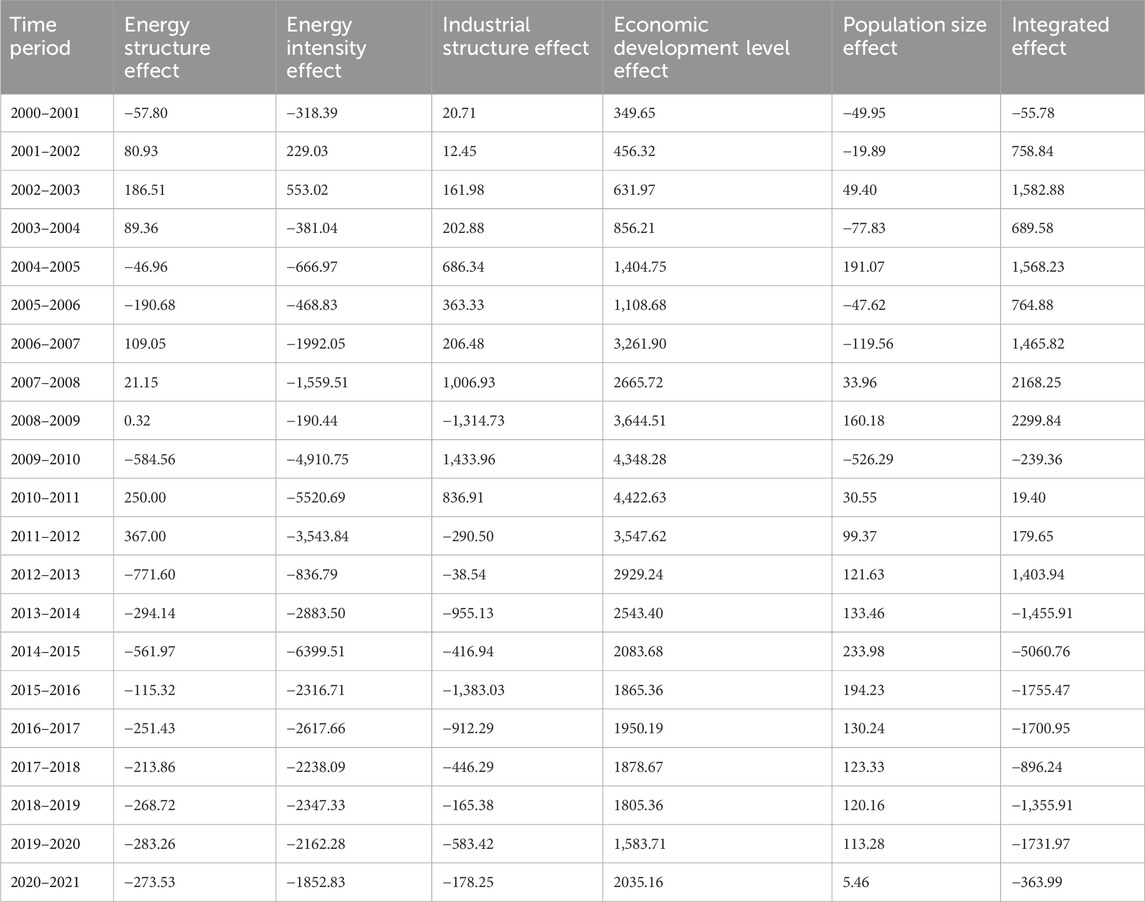
Table 4. Decomposition results of influencing factors of carbon emissions from energy consumption (Unit: 10,000 tons).
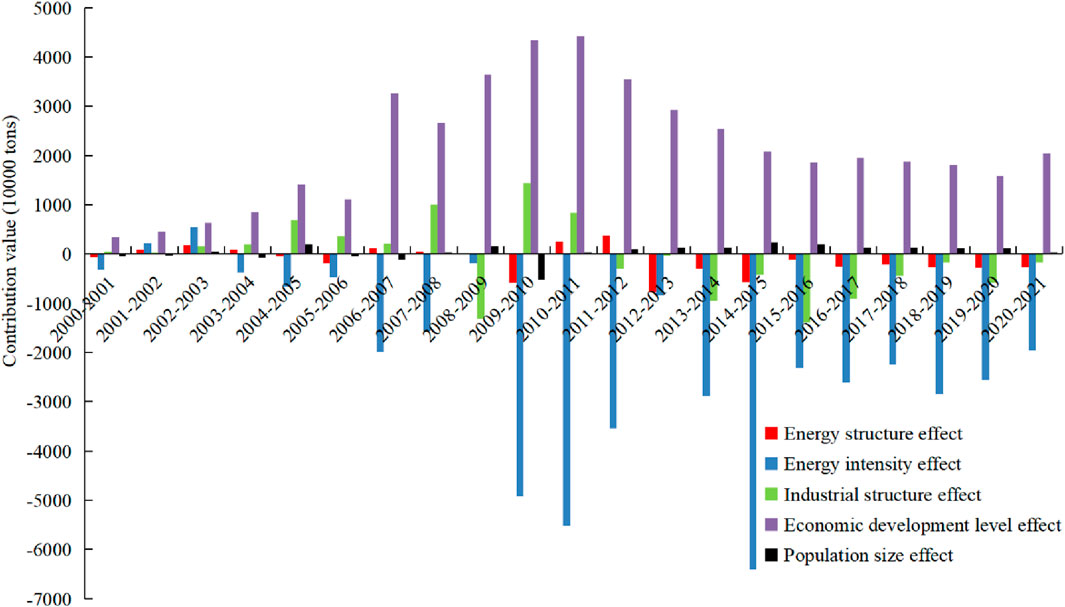
Figure 2. Decomposition effect of influencing factors of carbon emissions of energy consumption.
According to the decomposition results of the LMDI model, the cumulative contribution value of energy structure effects from 2000 to 2021 is −28.10 million tons, and its average contribution rate to carbon emissions from energy consumption in Sichuan Province is −163.82%. From 2000 to 2012, the impact of energy consumption structure on carbon emissions mainly showed a positive driving effect, and after 2013, it turned into a negative inhibitory effect, which is different from the result of Wang et al. (2022) on the Yangtze River Delta. This is mainly due to the resource endowment advantage of Sichuan province in clean energy such as natural gas and hydropower. The influence characteristics of energy structure effect is consistent with the changing trend that the consumption proportion of unclean fossil energy such as coal and oil in Sichuan Province first increased and then decreased from 2000 to 2021. Energy activities are the main source of greenhouse gas emissions in Sichuan Province. Due to the nature of fossil fuels, the carbon emission coefficients of coal and oil are much higher than that of other types of energy, which inevitably leads to a large amount of CO2 emission during the combustion process. Therefore, it is an inevitable choice for the development of low-carbon economy in Sichuan Province to gradually establish and improve a clean, low-carbon, safe and efficient modern energy system. At present, the inhibitory effect of energy consumption structure on carbon emissions from energy consumption in Sichuan Province is not significant, which is similar to the findings of Guan (Guan, 2023) on Beijing-Tianjin-Hebei region. This is mainly because the energy transformation needs to be completed over a long time span under the constraints of technical level and infrastructure. Therefore, the advantages and benefits of energy structure optimization on regional carbon emission reduction cannot be effectively highlighted in the short term. However, at the same time, Sichuan Province is an important high-quality clean energy base in China. In recent years, relying on the advantages of resource endowment, it has continuously increased the development, promotion and utilization of clean fossil energy such as natural gas, as well as new energy sources such as wind, hydro, and photovoltaic solar energy. The regional energy structure is gradually characterized by cleanliness and low carbonization. In the future, the inhibitory effect of energy consumption structure on carbon emissions from energy consumption in Sichuan Province will gradually increase.
According to the decomposition results of the LMDI model, the cumulative contribution value of energy intensity effects from 2000 to 2021 is −434.25 million tons, and its average contribution rate to carbon emissions from energy consumption in Sichuan Province is −2532.04%. From 2000 to 2021, except for a few years, the impact of energy consumption intensity on carbon emissions showed a significant negative inhibitory effect, which became the key factor to slow down the growth of regional carbon emissions, which is different from the findings of Liu et al. (Liu Y. X. et al., 2022) on Tianjin and Chongqing. The reason for this phenomenon is that the government of Sichuan has attached great importance to energy intensity and is taking active measures to maintain this index, while the rapid growth in energy consumption of the other two municipalities did not appear synchronously when regional GDP increased rapidly. It is worth noting that in addition to the impact of black swan events such as the COVID-19 in 2020, the inhibitory effect of energy consumption intensity on carbon emissions had significantly increased in the three time nodes of 2004-2005, 2009-2010, and 2014-2015. This was mainly due to the acceleration of energy conservation and carbon reduction goals of the 10th, 11th, and 12th Five Year Plans, which indirectly highlights the important correlation between national development strategy and regional emission reduction efficiency. It provides effective support for the continuous implementation of the Five Year Plan in China. In recent years, the energy intensity effect has shown a slowing trend, indicating that there is a certain barrier to the further development of clean and low-carbon energy utilization technology, which is consistent with the findings of González et al. (González et al., 2024) on Spain. During the 14th Five Year Plan period, Sichuan Province should propose more detailed and reasonable plans for the energy sector, focus on strengthening energy technology innovation, and continue to introduce advanced production processes and efficient energy-saving equipments. It is conducive to continuously strengthening the utilization level of new energy while effectively improving the utilization efficiency of conventional energy, and better exerting the incentive contribution of energy intensity effect to carbon reduction of energy consumption in Sichuan Province. Ultimately, it can serve the strategic goal of creating a national clean energy demonstration province.
According to the decomposition results of the LMDI model, the cumulative contribution value of industrial structure effects from 2000 to 2021 is −17.53 million tons, and its average contribution rate to carbon emissions from energy consumption in Sichuan Province is −102.19%, which is contrary to the result of Xiao et al. (Xiao and Peng, 2023) on China. The reason for this phenomenon is that the proportion of primary industry in Sichuan Province is higher than the national level, while the proportion of secondary industry is lower than the national level. From 2000 to 2011, the impact of industrial structure on carbon emissions mainly showed a positive driving effect, and after 2012, it turned into a negative inhibiting effect. This characteristic is basically consistent with the changing trend that the proportion of the secondary industry in Sichuan Province first increased and then decreased during 2000–2021. Among the three major industries, the primary industry dominated by agriculture, forestry, animal husbandry, and fishery had a low energy consumption level and a certain carbon sequestration effect. The secondary industry, which was dominated by industry and construction, generally had the problem of overcapacity. Its energy consumption had a high degree of aggregation, and its carbon emission intensity was significantly higher than that of the other two industries. With the continuous upgrading and adjustment of the industrial structure in Sichuan Province, the proportion of the secondary industry had gradually decreased from 48% in 2011 to 37% in 2021. It had driven the secondary industry development to exhibit a suppressive effect on regional carbon emissions since 2011. The energy consumption level of the tertiary industry, which was dominated by service industry, was relatively small. Before 2012, it mainly showed an inhibitory effect on carbon emissions of energy consumption. However, with the continuous improvement of residents’ quality of life, human beings began to focus on higher quality material and spiritual needs, and drived the continuous increase in energy consumption in the tertiary industry. The impact of the tertiary industry development on carbon emissions of energy consumption begun to show a positive driving effect. With the proposal of the “Chengdu-Chongqing Dual City Economic Circle” strategy, it will further promote the optimization and upgrading of regional industrial structure. The proportion of the secondary industry in the regional economy of Sichuan Province will continue to decrease. Therefore, the inhibitory effect of industrial structure on carbon emissions from energy consumption in Sichuan Province will be further strengthened in the future, which agrees with the findings of Ye et al. (Ye, 2022).
According to the decomposition results of the LMDI model, the cumulative contribution value of economic development level effects from 2000 to 2021 is 453.73 million tons, and its average contribution rate to carbon emissions from energy consumption in Sichuan Province is 2645.61%. From 2000 to 2021, the impact of economic development level on carbon emissions all showed a positive driving effect, with the highest contribution value among all influencing factors, which agrees with the findings of Gu et al. (2019) on Shanghai. It had become a key factor to promote the growth of regional carbon emissions. The incentive effect of economic development level was in stark contrast to the inhibitory effect of energy consumption intensity. It was the mutual cancellation of the two effects that prevented regional carbon emissions from showing a linear growth trend with accelerated economic development. After entering the 21st century, with significant changes in the domestic and international economic environment, in order to adapt to the new pattern of low-carbon development and accelerate the transformation towards a comprehensive, coordinated and sustainable economic development mode, Sichuan Province gradually entered the stage of new industrialization. This had led to a steady decline in energy consumption per unit GDP, and the driving effect of economic development level was gradually decreasing. With the proposal of the “Chengdu-Chongqing Dual City Economic Circle” strategy, it will form an important growth pole of high-quality development in the western region. Under the new pattern of low-carbon development, Sichuan Province will constantly change its economic development mode in the future, and improve the quality of development based on the source. Therefore, the driving effect of economic development level on carbon emissions from energy consumption in Sichuan Province will be reduced.
According to the decomposition results of the LMDI model, the cumulative contribution value of population size effects from 2000 to 2021 is 8.99 million tons, and its average contribution rate to carbon emissions from energy consumption in Sichuan Province is 52.43%. From 2000 to 2021, the impact of population size on carbon emissions mainly showed a positive driving role, but the contribution value was small, which is consistent with the result of Liu Z. Y. et al. (2022) on the affected areas of the lower Yellow River. The main reason for this phenomenon is that there were significant differences in the development level among different regions in Sichuan Province. For urban areas, population growth lead to urban expansion, and the construction process of roads and infrastructure was accompanied by a large amount of energy consumption. With the continuous improvement of living standards, people’s consumption scale and habits changed greatly, resulting in a significant increase in carbon emissions. For rural areas, a large number of rural residents had low cultural literacy, low education level, and weak environmental awareness. As a result, in these areas, the green and low-carbon concept and clean lifestyle were difficult to promote, and the implementation of emission reduction measures was not effective. Since the 21st century, the slowdown of population growth caused by the family planning policy had effectively controlled the impact of population size on carbon emissions. However, in recent years, with the gradual aggravation of the aging problem in China, the new three-child birth encouragement policy has been fully implemented. In the future, the positive driving effect of population size on carbon emissions from energy consumption in Sichuan Province will be further strengthened. On the one hand, the expansion of population size will inevitably require more resources to meet people’s production, circulation and consumption needs. As a result, the direct energy consumption and the indirect energy consumption caused by the supply of goods and services increase, and the carbon emissions increase simultaneously. On the other hand, the expansion of population scale has further increased the impact of human beings on the ecological environment. More forest and land resources are invested in production and residential life, thereby weakening the carbon sequestration effect of forest ecosystems. However, judging from the current situation of population growth, after the implementation of the policy of encouraging birth, Sichuan Province did not produce the expected population fluctuation. The regional birth rate had continuously decreased from 11.3% in 2017 to 6.9% in 2021. Meanwhile, with the improvement of residents’ quality, green and low-carbon lifestyles and consumption concepts will gradually take root. Therefore, the likelihood of significant increases in carbon emissions caused by population size effect in the future is small, which is similar to the findings of Jung et al. (Jung et al., 2012) on South Korea.
This study calculated the carbon emissions of fuel combustion in 7 major departments and regional electricity trading of Sichuan Province from 2000 to 2021, which is helpful to systematically investigate the time evolution path of carbon emissions over a long time span, and consider the transfer of carbon emission responsibility caused by energy allocation. Meanwhile, the impact of energy structure effect, energy intensity effect, industrial structure effect, economic development level effect, and population size effect on the carbon emissions of energy consumption was empirically analyzed based on the LMDI model, which is helpful to guide the energy producing areas to explore demonstration paths for the low-carbon transformation of regional energy consumption. The main research conclusions are as follows: (1) LMDI model has the advantages of no residual and high interpretation. By refining the multi-departments of energy consumption and different types of fuel, it is helpful to improve the accuracy of empirical analysis results. (2) The carbon emissions of energy consumption mainly come from the fuel combustion process. Specifically, the industry sector composed of steel, building materials, chemicals and machinery is the key emission sector, and transportation and residential life are also vital. Regional electricity trading can indirectly reduce the intensity of carbon emissions while ensuring the safety of energy supply. (3) From 2000 to 2021, the energy intensity effect and the economic development level effect were key factors in slowing down and promoting the carbon emission growth of energy consumption in Sichuan Province, respectively. The population scale effect mainly played a positive role in driving carbon emissions, but the impact is small and almost negligible. Before 2012, the energy structure effect and the industrial structure effect were mainly positive driving effects, and after 2012, they all turned into negative inhibitory effects. This was mainly due to the low-carbon transformation of energy structure and the optimization of industrial structure.
Based on the research findings, the following policy implications are proposed: (1) Sichuan Province should take advantage of its resource endowment to embark on a clean, low-carbon transformation and high-quality development path of “reducing coal, stabilizing oil, increasing gas, and vigorously developing new energy,” and give full play to its unique resource advantages of hydropower, wind energy and solar energy. (2) It is necessary to simultaneously improve the utilization level of electricity and natural gas in the residential, industrial and transportation sectors. (3) Technological innovation in the energy field should be strengthened. Based on the West (Chengdu) Science City and China (Mianyang) Science City, it is necessary to focus on promoting scientific research and achievements transformation in key areas such as clean coal production and utilization, carbon capture and storage, unconventional oil and gas exploration, hydrogen energy and fuel cells. (4) Green, low-carbon, recycling and sustainable lifestyles and consumption concepts should be vigorously advocated. Meanwhile, it is necessary to establish a low-carbon price mechanism that efficiently reflects ecological value and environmental cost, so as to realize the large-scale utilization of low-carbon energy and reduce the use cost of clean energy.
This study offers some innovative insights, but it also has significant limitations that may open up new areas for further study. First, it is assumed that the energy combustion efficiency is the same in the calculation of carbon emissions, which increases the possibility of repeated calculation. In the future, the influence of differentiated combustion efficiency can be further considered in combination with experimental results. Moreover, future research can consider combining the LMDI model with spatial econometric analysis model to more comprehensively investigate the regional heterogeneity difference of various influencing factors on carbon emissions.
The original contributions presented in the study are included in the article, as shown in Tables 2–4, and Figures 1, 2. Further inquiries can be directed to the corresponding author.
QL: Formal Analysis, Methodology, Software, Writing–original draft, Writing–review and editing. JC: Investigation, Methodology, Writing–review and editing. PZ: Formal Analysis, Resources, Writing–review and editing.
The author(s) declare that financial support was received for the research, authorship, and/or publication of this article. This research was funded by the National Social Science Fund of China (Grants No. 22&ZD105).
The authors declare that the research was conducted in the absence of any commercial or financial relationships that could be construed as a potential conflict of interest.
All claims expressed in this article are solely those of the authors and do not necessarily represent those of their affiliated organizations, or those of the publisher, the editors and the reviewers. Any product that may be evaluated in this article, or claim that may be made by its manufacturer, is not guaranteed or endorsed by the publisher.
Abbas, Z., Waqas, M., Lun, Z., Khan, S. S., Amjad, M., and Larkin, S. (2023). Predicting Energy Consumption through the LEAP Model Based on LMDI Technique Along with Economic Analysis: A Case Study. Energ. Explor. Exploit. 41 (6), 1919–1941. doi:10.1177/01445987231202802
Ai, H. S., Tan, X. Q., Zhou, S. W., Zhou, Y. H., and Xing, H. Y. (2023). The Impact of Environmental Regulation on Carbon Emissions: Evidence from China. Econ. Anal. Policy 80, 1067–1079. doi:10.1016/j.eap.2023.09.032
Akyürek, Z. (2020). LMDI Decomposition Analysis of Energy Consumption of Turkish Manufacturing Industry: 2005–2014. Energ. Effic. 13 (4), 649–663. doi:10.1007/s12053-020-09846-8
Ang, B. W. (2005). The LMDI Approach to Decomposition Analysis: A Practical Guide. Energ. Policy 33 (7), 867–871. doi:10.1016/j.enpol.2003.10.010
Ang, B. W. (2015). LMDI Decomposition Approach: A Guide for Implementation. Energ. Policy 86, 233–238. doi:10.1016/j.enpol.2015.07.007
Balcilar, M., Ekwueme, D. C., and Ciftci, H. (2023). Assessing the Effects of Natural Resource Extraction on Carbon Emissions and Energy Consumption in Sub-Saharan Africa: A STIRPAT Model Approach. Sustainability 15, 9676. doi:10.3390/su15129676
Capua, G. D., and Rahmstorf, S. (2023). Extreme Weather in a Changing Climate. Res. Lett. 18 (10), 102001. doi:10.1088/1748-9326/acfb23
Chen, L., Li, X., Liu, L., Sun, B., Hu, X. Y., and Wang, M. X. (2023b). Decoupling Analysis and Peak Prediction of Carbon Emission in Less Developed Provinces: A Case Study of Sichuan Province, China. Greenh. Gases 13 (3), 340–356. doi:10.1002/ghg.2200
Chen, W., Zhang, Q., Hu, L. L., Geng, Y., and Liu, C. Q. (2023a). Understanding the Greenhouse Gas Emissions From China’s Wastewater Treatment Plants: Based on Life Cycle Assessment Coupled with Statistical Data. Ecotox. Environ. Safe. 259, 115007. doi:10.1016/j.ecoenv.2023.115007
Dai, Y., and Gao, H. O. (2016). Energy Consumption in China’s Logistics Industry: A Decomposition Analysis Using the LMDI Approach. Transp. Res. D-Tr. E. 46, 69–80. doi:10.1016/j.trd.2016.03.003
du Can, S. D., Price, L., and Zwickel, T. (2015). Understanding the Full Climate Change Impact of Energy Consumption and Mitigation at the End-Use Level: A Proposed Methodology for Allocating Indirect Carbon Dioxide Emissions. Appl. Energ. 159, 548–559. doi:10.1016/j.apenergy.2015.08.055
Feng, L. G., Shang, S., An, S. F., and Yang, W. L. (2022). The Spatial Heterogeneity Effect of Green Finance Development on Carbon Emissions. Entropy 24 (8), 1042. doi:10.3390/e24081042
González, P. F., Presno, M. J., and Landajo, M. (2024). Tracking the Change in Spanish Greenhouse Gas Emissions through an LMDI Decomposition Model: A Global and Sectoral Approach. J. Environ. Sci. 139, 114–122. doi:10.1016/j.jes.2022.08.027
González-Torres, M., Pérez-Lombard, L., Coronel, J. F., and Maestre, I. R. (2021). Revisiting Kaya Identity to Define an Emissions Indicators Pyramid. J. Clean. Prod. 317, 128328. doi:10.1016/j.jclepro.2021.128328
Gu, S., Fu, B. T., Thriveni, T., Fujita, T., and Ahn, J. W. (2019). Coupled LMDI and System Dynamics Model for Estimating Urban CO2 Emission Mitigation Potential in Shanghai, China. J. Clean. Prod. 240, 118034. doi:10.1016/j.jclepro.2019.118034
Guan, D., Meng, J., Reiner, D. M., Zhang, N., Shan, Y. L., Mi, Z. F., et al. (2018). Structural Decline in Structural Decline in China’s CO2 Emissions through Transitions in Industry and Energy Systems. Nat. Geosci. 11, 551–555. doi:10.1038/s41561-018-0161-1
Guan, Q. F. (2023). Decomposing and Decoupling the Energy-Related Carbon Emissions in the Beijing–Tianjin–Hebei Region Using the Extended LMDI and Tapio Index Model. Sustainability 15 (12), 9681. doi:10.3390/su15129681
Han, X. J., Yu, J. L., Xia, Y., and Wang, J. J. (2021). Spatiotemporal Characteristics of Carbon Emissions in Energy-Enriched Areas and the Evolution of Regional Types. Energy Rep. 7, 7224–7237. doi:10.1016/j.egyr.2021.10.097
Hao, D. Q., Wang, R., Gao, C. J., Song, X. Y., Liu, W. X., and Hu, G. Y. (2022). Spatial-Temporal Characteristics and Influence Factors of Carbon Emission from Livestock Industry in China. Int. J. Env. Res. Pub. He. 19 (22), 14837. doi:10.3390/ijerph192214837
He, Y., Xing, Y. T., Zeng, X. C., Ji, Y. J., Hou, H. M., Zhang, Y., et al. (2022). Factors Influencing Carbon Emissions from China’s Electricity Industry: Analysis Using the Combination of LMDI and K-Means Clustering. Environ. Impact Asses. 93, 106724. doi:10.1016/j.eiar.2021.106724
Huang, L. P., Geng, X. Y., and Liu, J. X. (2023b). Study on the Spatial Differences, Dynamic Evolution and Convergence of Global Carbon Dioxide Emissions. Sustainability 15 (6), 5329. doi:10.3390/su15065329
Huang, S. Y., Xiao, X. P., and Guo, H. (2022). A Novel Method for Carbon Emission Forecasting Based on EKC Hypothesis and Nonlinear Multivariate Grey Model: Evidence from Transportation Sector. Environ. Sci. Pollut. R. 29 (40), 60687–60711. doi:10.1007/s11356-022-20120-5
Huang, Y. M., Kuldasheva, Z., Bobojanov, S., Djalilov, B., Salahodjaev, R., and Abbas, S. (2023a). Exploring the Links between Fossil Fuel Energy Consumption, Industrial Value-Added, and Carbon Emissions in G20 Countries. Environ. Sci. Pollut. R. 30 (4), 10854–10866. doi:10.1007/s11356-022-22605-9
Isik, M., Sarica, K., and Ari, I. (2020). Driving Forces of Turkey’s Transportation Sector CO2 Emissions: An LMDI Approach. Transp. Policy 97, 210–219. doi:10.1016/j.tranpol.2020.07.006
Jian, K. R., Shi, R. Y., Zhang, Y. X., and Liao, Z. G. (2023). Research on Carbon Emission Characteristics and Differentiated Carbon Reduction Pathways in the Yangtze River Delta Region Based on the STIRPAT Model. Sustainability 15 (21), 15659. doi:10.3390/su152115659
Jiang, Q. Q., Khattak, S. I., and Rahman, Z. U. (2021). Measuring the Simultaneous Effects of Electricity Consumption and Production on Carbon Dioxide Emissions (CO2e) in China: New Evidence from an EKC-Based Assessment. Energy 229, 120616. doi:10.1016/j.energy.2021.120616
Jung, S., An, K. J., Dodbiba, G., and Fujita, T. (2012). Regional Energy-Related Carbon Emission Characteristics and Potential Mitigation in Eco-Industrial Parks in South Korea: Logarithmic Mean Divisia Index Analysis Based on the Kaya Identity. Energy 46 (1), 231–241. doi:10.1016/j.energy.2012.08.028
Köne, A. Ç., and Büke, T. (2019). Factor Analysis of Projected Carbon Dioxide Emissions According to the IPCC Based Sustainable Emission Scenario in Turkey. Renew. Energ. 133, 914–918. doi:10.1016/j.renene.2018.10.099
Li, J. X., Chen, Y. N., Li, Z., and Liu, Z. H. (2018). Quantitative Analysis of the Impact Factors of Conventional Energy Carbon Emissions in Kazakhstan Based on LMDI Decomposition and STIRPAT Model. J. Geogr. Sci. 28 (7), 1001–1019. doi:10.1007/s11442-018-1518-5
Li, W. J., Yu, X. Z., Hu, N., Huang, F., Wang, J., and Peng, Q. N. (2022). Study on the Relationship between Fossil Energy Consumption and Carbon Emission in Sichuan Province. Energy Rep. 8 (4), 53–62. doi:10.1016/j.egyr.2022.01.112
Lin, B. Q., and Kui, L. (2017). Using LMDI to Analyze the Decoupling of Carbon Dioxide Emissions from China’s Heavy Industry. Sustainability 9 (7), 1198. doi:10.3390/su9071198
Lin, S. F., Zhao, D. T., and Marinova, D. (2009). Analysis of the Environmental Impact of China Based on STIRPAT Model. Environ. Impact Asses. 29 (6), 341–347. doi:10.1016/j.eiar.2009.01.009
Liu, H. J., and Yan, F. Y. (2022). Quantitative Analysis of Impact Factors and Scenario Prediction of Energy Related Carbon Emissions at County Level. Int. J. Green Energy 20 (12), 1342–1351. doi:10.1080/15435075.2022.2110379
Liu, L., Chen, J., Li, X., and Wu, T. (2020). The Socioeconomic and Policy Drivers of China’s Regional Energy Consumption: A Study of Sichuan Province. Clean. Technol. Envir. 22 (7), 1467–1483. doi:10.1007/s10098-020-01885-0
Liu, L. Y., Xun, L. L., Wang, Z. Y., Liu, H. W., Huang, Y., and Bedra, K. B. (2023). Peak Carbon Dioxide Emissions Strategy Based on the Gray Model between Carbon Emissions and Urban Spatial Expansion for a Built-Up Area. Appl. Sci-basel. 13 (1), 187. doi:10.3390/app13010187
Liu, Y. X., Jiang, Y. J., Liu, H., Li, B., and Yuan, J. H. (2022a). Driving Factors of Carbon Emissions in China’s Municipalities: A LMDI Approach. Environ. Sci. Pollut. R. 29 (15), 21789–21802. doi:10.1007/s11356-021-17277-w
Liu, Z. Y., Yang, D., Zhang, P. Y., Jiang, L., Li, Y. Y., Rong, T. Q., et al. (2022b). Spatial–Temporal Characteristics and Scenario Simulation of Carbon Emissions from Energy Consumption Based on Multiscale in the Affected Areas of the Lower Yellow River. Int. J. Low-Carbon Tec. 17, 818–830. doi:10.1093/ijlct/ctac027
Lu, K., Deng, X. Y., Zhang, Y. B., Jiang, X. Y., Cheng, B. Q., and Tam, V. W. Y. (2023). Extensible Carbon Emission Factor Database: Empirical Study for the Chinese Construction Industry. Environ. Sci. Pollut. R. 31, 41482–41501. doi:10.1007/s11356-023-29092-6
Luo, S. H., Hu, W. H., Liu, W., Xu, X., Huang, Q., Chen, Z., et al. (2021). Transition Pathways towards a Deep Decarbonization Energy System—a Case Study in Sichuan, China. Appl. Energ. 302, 117507. doi:10.1016/j.apenergy.2021.117507
Lv, T. G., Hu, H., Xie, H. L., Zhang, X. M., Wang, L., and Shen, X. Q. (2023). An Empirical Relationship Between Urbanization and Carbon Emissions in an Ecological Civilization Demonstration Area of China Based on the STIRPAT Model. Environ. Dev. Sustain. 25 (3), 2465–2486. doi:10.1007/s10668-022-02144-6
Lyu, Y. (2016). A Study on the Energy Consumption Nitrogen Emission and Its Influence Factors Based on the Expand Kaya in Zhejiang Province. J. Zhejiang Univ. Sci. Ed. 43 (5), 610–614. doi:10.3785/j.issn.1008-9497.2016.05.019
Maher, B., and Symons, J. (2022). The International Politics of Carbon Dioxide Removal: Pathways to Cooperative Global Governance. Glob. Environ. Polit. 22 (1), 44–68. doi:10.1162/glep_a_00643
Makondo, C. C. (2023). Green Growth, Sustainability, and Decoupling Carbon Emissions from Industrial Activities in Emerging Economies: A Focus on Zambia’s Energy Sector. Extr. Ind. Soc. 14, 101271. doi:10.1016/j.exis.2023.101271
Meng, Q. X., Zheng, Y. N., Liu, Q., Li, B. L., and Wei, H. J. (2023). Analysis of Spatiotemporal Variation and Influencing Factors of Land-Use Carbon Emissions in Nine Provinces of the Yellow River Basin Based on the LMDI Model. Land 12 (2), 437. doi:10.3390/land12020437
Minx, J. C., Lamb, W. F., Andrew, R. M., Canadell, J. G., Crippa, M., Döbbeling, N., et al. (2021). A Comprehensive and Synthetic Dataset for Global, Regional, and National Greenhouse Gas Emissions by Sector 1970–2018 with an Extension to 2019. Earth. Syst. Sci. Data 13 (11), 5213–5252. doi:10.5194/essd-13-5213-2021
Mitra, N., Shahriar, S. A., Lovely, N., Khan, M. S., Rak, A. E., Kar, S. P., et al. (2020). Assessing Energy-Based CO2 Emission and Workers’ Health Risks at the Shipbreaking Industries in Bangladesh. Environments 7 (5), 35. doi:10.3390/environments7050035
Narayan, P. K., and Narayan, S. (2010). Carbon Dioxide Emissions and Economic Growth: Panel Data Evidence from Developing Countries. Energy Policy 38 (1), 661–666. doi:10.1016/j.enpol.2009.09.005
Noman, A., Kamran, H., Asma, S., and Naveed, Y. (2022). The Cultural Differences in the Effects of Carbon Emissions — an EKC Analysis. Environ. Sci. Pollut. R. 29 (42), 63605–63621. doi:10.1007/s11356-022-20154-9
Pan, H. Z., Yang, C., Quan, L. R., and Liao, L. H. (2021). A New Insight into Understanding Urban Vitality: A Case Study in the Chengdu-Chongqing Area Twin-City Economic Circle, China. Sustainability 13 (18), 10068. doi:10.3390/su131810068
Paraschiv, S., and Paraschiv, L. S. (2020). Trends of Carbon Dioxide (CO2) Emissions from Fossil Fuels Combustion (Coal, Gas and Oil) in the EU Member States from 1960 to 2018. Energy Rep. 6, 237–242. doi:10.1016/j.egyr.2020.11.116
Peng, D., and Liu, H. B. (2023). Measurement and Driving Factors of Carbon Emissions from Coal Consumption In China Based on the Kaya-LMDI Model. Energies 16 (1), 439. doi:10.3390/en16010439
Qu, H. J., You, C., Feng, C. C., and Guo, L. (2024). Spatial Responses of Ecosystem Services to Carbon Emission Efficiency Based on Spatial Panel Models in the Yangtze River Economic Belt. J. Clean. Prod. 434, 139953. doi:10.1016/j.jclepro.2023.139953
Ramos, C., Aroca, P., Miranda, J. C., and Acum, F. (2024). Analyzing Regional Imbalances in CO2 Emissions: A Study for Chile. Environ. Dev. Sustain. 26 (1), 1391–1412. doi:10.1007/s10668-022-02764-y
Ren, H. Y., Du, R. L., Xie, G. L., Jin, W. H., Li, X., Deng, Y. P., et al. (2023). Research Status of Influencing Factors and Identification Methods of Carbon Emissions in China. Environ. Eng. 41 (10), 195–203+244. doi:10.13205/j.hjgc.202310023
Sadkin, I., Mukhina, M., Kopyev, E., Sharypov, O., and Alekseenko, S. (2023). Low-Emission Waste-To-Energy Method of Liquid Fuel Combustion with a Mixture of Superheated Steam and Carbon Dioxide. Energies 16 (15), 5745. doi:10.3390/en16155745
Shamsuzzaman, M., Shamsuzzoha, A., Maged, A., Haridy, S., Bashir, H., and Karim, A. (2021). Effective Monitoring of Carbon Emissions from Industrial Sector Using Statistical Process Control. Appl. Energ. 300, 117352. doi:10.1016/j.apenergy.2021.117352
Slameršak, A., Kallis, G., and O’Neill, D. W. (2022). Energy Requirements and Carbon Emissions for a Low-Carbon Energy Transition. Nat. Commun. 13 (1), 6932. doi:10.1038/s41467-022-33976-5
Solazzo, E., Crippa, M., Guizzardi, D., Muntean, M., Choulga, M., and Janssens-Maenhout, G. (2021). Uncertainties in the Emissions Database for Global Atmospheric Research (EDGAR) Emission Inventory of Greenhouse Gases. Atmos. Chem. Phys. 21 (7), 5655–5683. doi:10.5194/acp-21-5655-2021
Tavakoli, A. (2018). A Journey among Top Ten Emitter Country, Decomposition of “Kaya Identity”. Sustain. Cities Soc. 38, 254–264. doi:10.1016/j.scs.2017.12.040
Thio, E., Tan, M. X., Li, L., Salman, M., Long, X. L., Sun, H. P., et al. (2021). The Estimation of Influencing Factors for Carbon Emissions Based on EKC Hypothesis and STIRPAT Model: Evidence from Top 10 Countries. Environ. Dev. Sustain. 24 (9), 11226–11259. doi:10.1007/s10668-021-01905-z
Tian, C. Y., Huang, G. H., and Xie, Y. L. (2021). Systematic Evaluation for Hydropower Exploitation Rationality in Hydro-Dominant Area: A Case Study of Sichuan Province, China. Renew. Energ. 168, 1096–1111. doi:10.1016/j.renene.2020.12.121
Timofeyev, Y. M., Nerobelov, G. M., Virolainen, Y. A., Poberovskii, A. V., and Foka, S. C. (2020). Estimates of CO2 Anthropogenic Emission from the Megacity St. Petersburg. Dokl. Earth S. C. 494, 753–756. doi:10.1134/s1028334x20090184
Wang, J. B., Chen, L., Chen, L., Zhao, X. H., Wang, M. X., Ju, Y. Y., et al. (2019). City-Level Features of Energy Footprints and Carbon Dioxide Emissions in Sichuan Province of China. Energies 12 (10), 2025. doi:10.3390/en12102025
Wang, L. K., Zhang, M., and Song, Y. (2024). Research on the Spatiotemporal Evolution Characteristics and Driving Factors of the Spatial Connection Network of Carbon Emissions in China: New Evidence from 260 Cities. Energy 291, 130448. doi:10.1016/j.energy.2024.130448
Wang, W. W., Chen, H., Wang, L. Z., Li, X. Y., Mao, D. Y., and Wang, S. (2022). Exploration of Spatio-Temporal Characteristics of Carbon Emissions from Energy Consumption and Their Driving Factors: A Case Analysis of the Yangtze River Delta, China. Int. J. Environ. Res. Public Health 19 (15), 9483. doi:10.3390/ijerph19159483
Wu, X. T., Zhang, K., Wang, Q. B., Wang, D. Y., and Ku, G. Y. (2023). Analysis of Carbon Emission Drivers of Secondary Industries in Energy “Golden Triangle” Area Based on LMDI and Two-Dimensional Decoupling Model. Environ. Sci. Pollut. R. 30 (3), 8154–8169. doi:10.1007/s11356-022-22593-w
Xia, Y. Q. (2011). The Impact of Technology and Structure Change on GHG Emissions in China: An Analysis Based on LMDI Model. Int. J. Glob. Warm. 3 (3), 307–327. doi:10.1504/ijgw.2011.043425
Xiao, M., and Peng, X. Z. (2023). Decomposition of Carbon Emission Influencing Factors and Research on Emission Reduction Performance of Energy Consumption in China. Front. Env. Sci-Switz. 10, 1096650. doi:10.3389/fenvs.2022.1096650
Xin, L. L., Jia, J. S., Hu, W. H., Zeng, H. Q., Chen, C. D., and Wu, B. (2021). Decomposition and Decoupling Analysis of CO2 Emissions Based on LMDI and Two-Dimensional Decoupling Model in Gansu Province, China. Int. J. Env. Res. Pub. He. 18 (11), 6013. doi:10.3390/ijerph18116013
Xu, J. (2023). Study on Spatiotemporal Distribution Characteristics and Driving Factors of Carbon Emission in Anhui Province. Sci. Rep. 13, 14400. doi:10.1038/s41598-023-41507-5
Xu, M., Zhang, S. L., Li, P. W., Weng, Z. X., Xie, Y., and Lan, Y. (2024). Energy-Related Carbon Emission Reduction Pathways in Northwest China towards Carbon Neutrality Goal. Appl. Energ. 358, 122547. doi:10.1016/j.apenergy.2023.122547
Yang, C. X., Hao, Y., and Irfan, M. (2021). Energy Consumption Structural Adjustment and Carbon Neutrality in the Post-COVID-19 Era. Struct. Change Econ. D. 59, 442–453. doi:10.1016/j.strueco.2021.06.017
Yang, P., Liang, X., and Drohan, P. J. (2020). Using Kaya and LMDI Models to Analyze Carbon Emissions from the Energy Consumption in China. Environ. Sci. Pollut. Res. 27, 26495–26501. doi:10.1007/s11356-020-09075-7
Ye, Q. X. (2022). Study on the Impact of Industrial Structure on Carbon Emissions in Sichuan Province -- Empirical Analysis Based on VAR Model. Front. Soc. Sci. Technol. 4 (3), 49–56. doi:10.25236/FSST.2022.040310
Yi Ding, Y., Yin, J., Jiang, H. T., Xia, R. C., Zhang, B., Luo, X. Y., et al. (2023). A Dual-Core System Dynamics Approach for Carbon Emission Spillover Effects Analysis and Cross-Regional Policy Simulation. J. Environ. Manage. 348, 119374. doi:10.1016/j.jenvman.2023.119374
Zeng, L. J., Du, W. J., Zhao, L. J., and Sun, Z. M. (2021). Modeling Interprovincial Cooperative Carbon Reduction in China: An Electricity Generation Perspective. Front. Energy Res. 9, 649097. doi:10.3389/fenrg.2021.649097
Zhang, B., Xin, Q. Y., Chen, S., Yang, Z., and Wang, Z. (2024). Urban Spatial Structure and Commuting-Related Carbon Emissions in China: Do Monocentric Cities Emit More? Energy Policy 186, 113990. doi:10.1016/j.enpol.2024.113990
Zhang, Q. F., Li, J. F., Li, Y., and Huang, H. (2023). Coupling Analysis and Driving Factors between Carbon Emission Intensity and High-Quality Economic Development: Evidence from the Yellow River Basin, China. J. Clean. Prod. 423, 138831. doi:10.1016/j.jclepro.2023.138831
Zhao, Y., Nielsen, C. P., and Mcelroy, M. B. (2012). China’s CO2 Emissions Estimated from the Bottom Up: Recent Trends Spatial Distributions and Quantification of Uncertainties. Atmos. Environ. 59, 214–223. doi:10.1016/j.atmosenv.2012.05.027
Keywords: energy consumption, carbon emission characteristics, influencing factors, inventory accounting method, LMDI model, Sichuan Province
Citation: Li Q, Chen J and Zhang P (2024) Study on carbon emission characteristics and its influencing factors of energy consumption in Sichuan Province, China. Front. Environ. Sci. 12:1414730. doi: 10.3389/fenvs.2024.1414730
Received: 09 April 2024; Accepted: 01 July 2024;
Published: 22 July 2024.
Edited by:
Huaping Sun, Jiangsu University, ChinaReviewed by:
Huwei Wen, Nanchang University, ChinaCopyright © 2024 Li, Chen and Zhang. This is an open-access article distributed under the terms of the Creative Commons Attribution License (CC BY). The use, distribution or reproduction in other forums is permitted, provided the original author(s) and the copyright owner(s) are credited and that the original publication in this journal is cited, in accordance with accepted academic practice. No use, distribution or reproduction is permitted which does not comply with these terms.
*Correspondence: Qiaochu Li, MjAyNDk5MDEwMDAzQHN3cHUuZWR1LmNu
Disclaimer: All claims expressed in this article are solely those of the authors and do not necessarily represent those of their affiliated organizations, or those of the publisher, the editors and the reviewers. Any product that may be evaluated in this article or claim that may be made by its manufacturer is not guaranteed or endorsed by the publisher.
Research integrity at Frontiers
Learn more about the work of our research integrity team to safeguard the quality of each article we publish.