 Dong Zhao1
 Lanbo Guo
94% of researchers rate our articles as excellent or good
Learn more about the work of our research integrity team to safeguard the quality of each article we publish.
Find out more
ORIGINAL RESEARCH article
Front. Environ. Sci., 31 July 2024
Sec. Land Use Dynamics
Volume 12 - 2024 | https://doi.org/10.3389/fenvs.2024.1414639
This article is part of the Research TopicThe Sustainable Management of Land SystemsView all 24 articles
The unprecedented growth in population and swift industrial advancements exert considerable strains on the ecosystem, particularly within medium-sized and large urban landscapes. The critical investigation into the intricate links between current and prospective land utilization, as well as the ecosystem service value (ESV), holds considerable empirical relevance for the calibration of land usage frameworks, thereby contributing to the sustainable evolution of extensive urban zones. Utilizing GlobeLand 30 data, the present research probes into the pattern of land transformation and the spatial-temporal dispersal of ESV in Henan’s Yellow River vicinity over a span from 2000 to 2020. For the enhancement of land usage alignment, a Markov-PLUS fusion model was devised to gauge three disparate ESV transition scenarios slated for 2030, namely, natural development scenario (NDS), cropland protection scenario (CPS), and ecological protection scenario (EPS). The principal determinants of land transformation within the 2000–2020 period were recognized as elevation, populace concentration, and atmospheric temperature. Amid the rapid accretion of construction land engulfing substantial cropland and grassland areas, there was an ESV diminution to the tune of 1.432 billion RMB between 2000 and 2020. The ESV’s high-value regions were discerned within relatively undisturbed ecosystem zones, with the lower-value sections identified in cropland and constructed areas, where human interventions exerted pronounced effects on the ecosystem. In accordance with the 2030 land usage simulations and analyses, in contrast to alternative scenarios, the EPS exhibited the least fluctuation in land type alterations in 2030, demonstrated the most pronounced escalation in cold spot concentration, and reached a peak agglomeration level. This underscores that the EPS not only offers a refinement in land utilization configuration but also mediates the equilibrium between economic and ecological considerations. The insights derived from this investigation afford innovative evaluative methods for spatial planning, ecological recompense, and sustainable land exploitation within large- and medium-scale urban domains.
The judicious utilization of land epitomizes a vital modality for the symbiotic relationship between human civilization and nature, performing a key function in fostering human sustainability and conserving ecological equilibrium (Besser and Hamed, 2021). Ecosystem services, encompassing the tangible and intangible benefits furnished by ecosystems for human subsistence through ecological structure and function, operate under multifaceted constraints such as population expansion, economic progression, resource limitations, and environmental factors (Fu, 2020). As fundamental supports for human survival, ecosystem services both influence and are influenced by human activities. Specifically, demographic escalation and economic growth instigate human-induced land alterations, which consequently modify the land-use configuration. The ensuing ecological ramifications of varying land use types reciprocally influence spatial distribution patterns of land utilization, thereby inducing disruptions in the ecosystem’s functional aspects. These transformations most directly affect the ecosystem service value (ESV) (Hao et al., 2021). The Yellow River, venerated as China’s cradle river, and its surrounding ESV have garnered substantial attention. The implementation of pertinent ecological conservation policies within the Yellow River Basin has rendered high-quality development therein an essential task for adjacent provinces and regions, particularly in Henan Province, an agricultural stronghold in central China (Gong et al., 2023; Liu et al., 2023). In recent epochs, relentless urbanization and human interventions have perceptibly altered the ecosystem’s structure, impairing its functionality (Yang et al., 2021). In the urbanization trajectory of Ningxia Province, the equilibrium between the ecosystem, resources, and the environment has been undermined, intensifying the ecological vulnerability in the Yellow River’s upper reaches (Lin M. et al., 2020a; Fang et al., 2020). Over-extraction of groundwater and deforestation have precipitated a precarious ecological milieu in this region. The ecologically fragile zones, exemplified by drastic landscape transformations in the Galapagos Islands (Benítez et al., 2018) and demographic pressures threatening the ecosystem in Alaphuzha, Kerala (Prasad and Ramesh, 2019), have become focal areas for scholarly investigation. Such incessant human interventions have augmented the rate of conversion between land categories, notably swelling construction land areas, thereby fracturing the urban ecosystem’s supply-demand balance (Liu et al., 2015, pp. 1990–2010). This direct consequence manifests in land use/land cover (LULC) interchange (Yuan et al., 2018; Rimal et al., 2019), subsequently instigating rapid modifications in the ecosystem’s structure and function within a confined timeframe (Zhang et al., 2020a; Gomes et al., 2021). As a conspicuous indicator of human influences on ecosystems, alterations in land usage have ascended as a global research nexus for appraising ESV’s evolutionary characteristics through the lens of land-use transformations (Zhang et al., 2020b; Cao et al., 2021).
The valuation of ecosystem services transcends mere historical and current scenario analysis, extending to the prognostication and simulation of spatial distribution of future ESV in the context of land use alterations, thereby furnishing an empirical foundation for pertinent agencies (Wang et al., 2020; Liu et al., 2024). In the pursuit to forecast forthcoming land use type modifications, scholars have sequentially devised models such as the Markov, logistic, gray prediction, CA, CLUS-S, and FLUS models (Lin W. et al., 2020b; Hu et al., 2020; Liu et al., 2020; Tan et al., 2020; Peng et al., 2021). Despite these advancements, these models manifest discernible deficiencies, often concentrating on isolated aspects like spatial or structural optimization of land use types, and neglecting the multifaceted shifts in land use configurations (Wang et al., 2018). Through sustained endeavors, Liang (Liang et al., 2021) introduced the patch-generating land-use simulation (PLUS) model in 2021, which, while preserving merits of adaptive inertial and roulette competition mechanisms (Liu et al., 2017), enhances patch simulation protocols. Thus, it accommodates not merely spatial variations but also structural adaptations in land use types (Liu et al., 2017; Rao et al., 2018; Liang et al., 2021). More saliently, the model’s simulation precision has been markedly augmented, finding extensive applications in future land simulation. Concurrently, the integration of the PLUS model with gray multi-objective optimization (GMOP) (Li et al., 2021), the INVEST model (Fang et al., 2022; Shen and Zeng, 2022; Tian et al., 2022), and the Markov model (Yang et al., 2021; Han et al., 2022) facilitates evaluations of present and forecasts of future ecosystem service provision, ESV, ecosystem carbon neutrality (Li et al., 2020; Wang et al., 2022), and more. The PLUS model thereby performs an instrumental function in supporting regional sustainable development.
When scrutinizing ecosystem services’ worth, the attributes of ecologically fragile zones with stable ecosystems and prevalent forest and grassland regions have captivated broad scholarly interest. Nevertheless, within large and medium-sized urban areas, where construction land perpetually proliferates and cropland maintains a baseline, an emergent imperative arises to investigate ESV alterations to judiciously orchestrate land use composition. This is indispensable for the sustenance of regional sustainable growth. To bridge this research void concerning ESV dynamics within expansive urban zones, the current study amalgamated analyses of land use change degree, driving factor contribution rate, Moran index, and hot spot to assess both present and prospective ESV distribution trends and evolutionary traits in Henan Province’s Yellow River region. Initially, 13 determinative factors were harnessed to anticipate land use type pixel numbers via the Markov chain. Subsequently, the PLUS model was employed to emulate land-use type transitions in three distinct scenarios for 2030. Lastly, the spatiotemporal evolutionary properties of ESV, inclusive of concentration areas and cold and hot spot domains of ESV alteration, were evaluated. This inquiry thus offers a valuable reference for shaping land spatial planning and ecological compensation strategies in large and medium-sized cities.
The Yellow River region within Henan Province encompasses 8 cities and 1 county, namely, Zhengzhou, Luoyang, Kaifeng, Jiaozuo, Xinxiang, Sanmenxia, Puyang, and Jiyuan cities, along with Anyang Hua County, cumulatively extending across 59,200 km2. Geographically situated between longitudes 112°12′and 115°1′E and latitudes 34°47′and 35°44′N, the topography is characterized by an elevated eastern terrain that gradually descends towards the west. The study region’s diverse geomorphological features include mountains, hills, basins, and highlands, under the influence of a continental monsoon climate delineated by four pronounced seasons. The climatic conditions are featured by mean precipitation of 550–650 mm/year and mean temperature of 12.0°C–14.8°C (Figure 1). As of the conclusion of 2022, the regional population reached 41,946,400 individuals, with an urbanization rate of 66.87%, a figure that significantly transcends the 56.45% urbanization rate observed within Henan Province as a whole. Marked by a high population density, the rapid trajectory of economic development and urbanization within the study area has engendered a complex juxtaposition between urban growth and ecological consequences, thereby presenting intricate challenges to the sustainable evolution of territorial space. Furthermore, the initiation of strategies focused on ecological preservation and sustainable development has elevated significances of these goals. Specifically, within Henan Province’s Yellow River vicinity, the approach to ecological protection and the construction of ecological civilization have been escalated to unprecedented standards, reflective of the area’s contemporary significance.
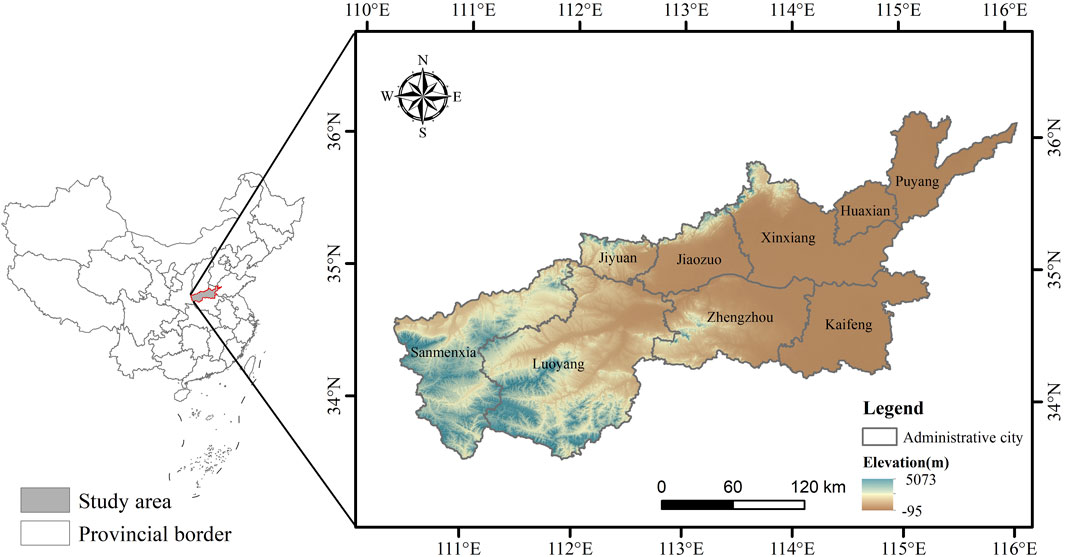
Figure 1. The research region.
Land cover information was sourced from GlobeLand 30 data (http://www.globallandcover.com/), compiled by the National Geographic Information Centre, possessing an overall accuracy reaching 85.72% and a spatial resolution of 30 m × 30 m, including integration of shrubland into woodland. The research region is featured by several types of land uses, including construction land, water, grassland, forest, cropland, and unused land. To assess influence of land-use alterations along the Yellow River in Henan Province spanning the period from 2000 to 2020, a set of 13 representative driving factors were selected for analysis. Elevation data were acquired from the ASTER GDEM dataset (http://www.gscloud.cn/) with a 30 m × 30 m spatial resolution, from which slope data were extracted. Data pertaining to gross domestic product (GDP), population spatial distribution, soil type spatial distribution, precipitation, and average temperature were obtained from the Resource and Environment Science and Data Centre of the Chinese Academy of Sciences (https://www.resdc.cn/), with a spatial resolution of 1 km × 1 km. Distances to primary roads, highways, and railways were sourced from the National Geographic Information Resources Catalog Service (https://www.webmap.cn/), while distances to hospitals, schools, and governmental facilities were derived from the 2018 Gaode Map POI dataset.
Within the scope of the study, the aforementioned 13 selected driving factors were subject to standardization and resampling to ensure conformity with a uniform coordinate system and spatial resolution of 30 m × 30 m. Additionally, distances from first-class roads, high-speed roads, railways, hospitals, schools, and government locations were determined utilizing Euclidean distance analysis within the framework of ArcGIS10.7. Subsequently, the mask tool was employed to extract the driving factor data pertinent to the definitive study region.
Calculations pertaining to the output, sown area, and average price of agricultural products were conducted through integration with the Henan Statistical Yearbook and the Compilation of Cost and Income Data of National Agricultural Products, following a comprehensive statistical and analytical process.
The analytical methodology coupling Markov and PLUS models includes two steps (Figure 2). First, the PLUS model was used for simulating the spatial distribution of land use/land cover (LULC) in the year of 2030 under the defined scenarios. Second, these simulated results were leveraged to analyze the spatiotemporal evolution of the ecosystem services value (ESV) corresponding to each scenario.
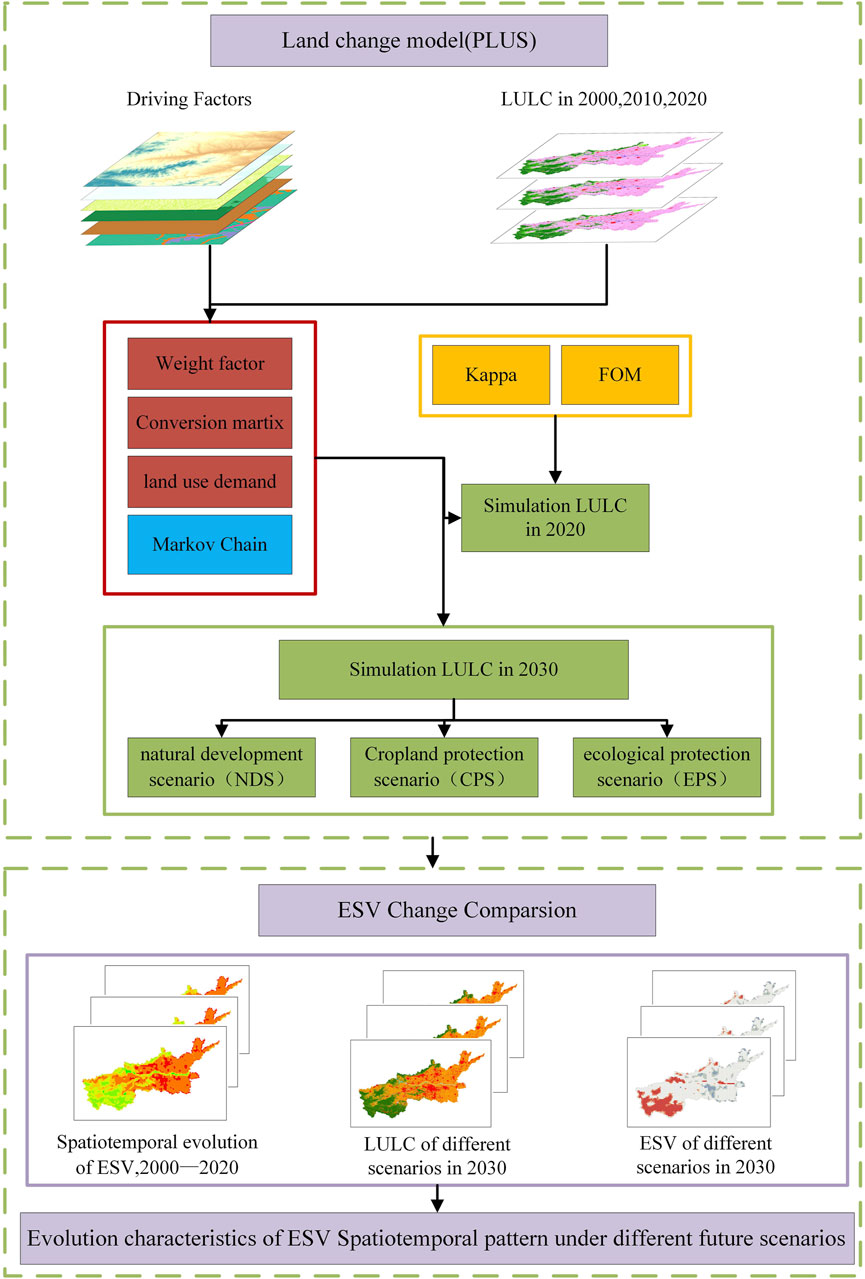
Figure 2. Research framework.
The Markov model, extensively utilized for predicting the scale of land use demand, operates under the assumption that the land use pattern at a given time t+1 is influenced solely by its state at the preceding moment t. The mathematical formulation of this process is represented by (Gong et al., 2023):
where
The PLUS model is an advanced land use change simulation approach known for its comprehensive and dynamic characteristics (Liang et al., 2021). The modeling process involves several key steps. First, it is necessary to ensure that the row number of the land cover data within the study region is consistent, and that the type number starts from 1 to determine the land use expansion area across two distinct phases. Next, the Land Expansion Analysis Strategy Model (LEAS) is used, which explains the intrinsic change mechanism of land use within a given range, thereby determining the rate of change for different land types under specific driving factors (Rao et al., 2018). Following this, a Cellular Automata (CA) Model is utilized for simulating future land use types (Liu et al., 2017), and it is combined with a Markov model to predict the pixel number and area for land use types in subsequent years. Finally, a validation step is performed, where the simulated data are compared with actual land use information, evaluating overall accuracy, kappa coefficient, and figure of merit (FOM). The PLUS model has been empirically validated as reliable in predicting land use.
The
where
FOM serves as an essential measure to verify spatial agreement between forecast results and actual scenarios (Pontius et al., 2008). Its mathematical expression is as follows:
where
In the context of the Yellow River area of Henan Province, ESV in the study region was classified into 11 distinct categories, according to the Xiegaodi value equivalent method, tailored to unique land use characteristics in this region (Xie et al., 2017). This required modification of the correlation coefficient of the value equivalent factor per unit area, as formulated in:
where
ESV is further articulated as:
where
During 2000 to 2020, wheat, corn, and soybean were identified as the principal grains cultivated in the Yellow River region of Henan Province. The associated average price, yield, and sown area for these crops were computed, leading to the derivation of the revised coefficient, calculated at 1,380.14 RMB/hm2, following Eq. 4. It was found that the ESV index corresponding to construction land equaled zero (Zhang et al., 2022). Consequently, the ESV coefficient of unit area along the Yellow River in Henan Province was obtained, discounting the impact of construction land on the ESV (Table 1).
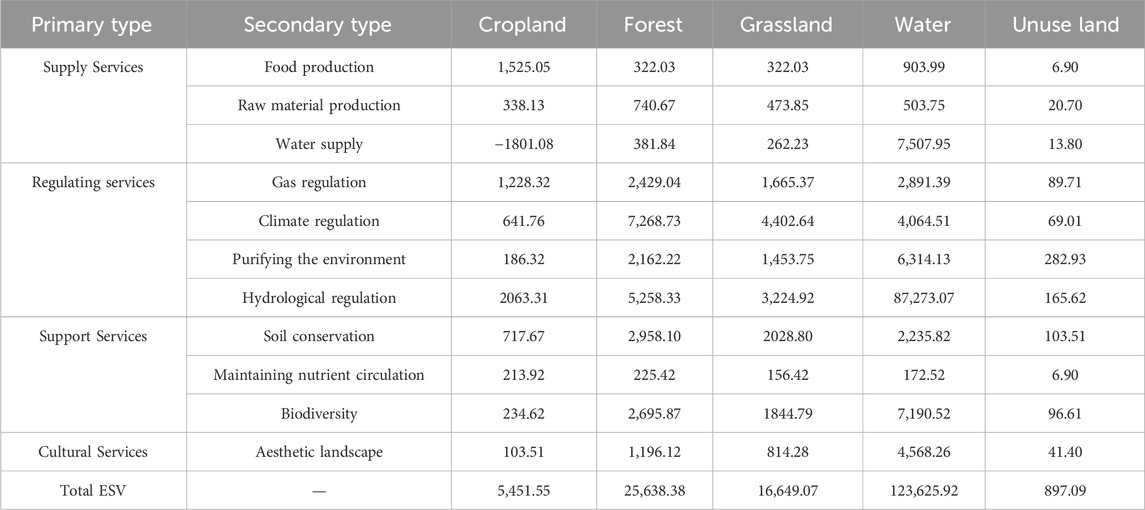
Table 1. ESV coefficients per unit area along the Yellow River region of Henan Province (RMB/hm2).
For a more refined analysis of the spatial distribution characteristics of ESV, the research region was partitioned into 2,623 square grids, each measuring 5 km × 5 km. This division was informed by existing research and allowed for exploratory spatial analysis and additional operations, balancing the need for accuracy with the goal of reducing computational labor (Su et al., 2020; Li et al., 2021). A vital aspect of this analysis involved the use of the spatial global analysis of the Moran index to express the spatial aggregation distribution of ESV. Furthermore, a hot spot analysis function was employed to identify significant distribution locations of high- and low-value regions within ESV space. This characterization facilitated the discernment of the cold and hot spot distribution pattern of ESV, enabling a subsequent examination and interpretation of the underlying law.
The hot spot analysis functions by pinpointing statistically significant hot spot and cold spot areas through the spatial clustering method, utilizing the z-score and p-value as evaluative metrics. The core algorithm is
where
As shown in Table 2, cropland, forest, and construction land are the dominant types of land use in 2000–2020, constituting 55.68%, 24.72%, and 14.18% of the total area, respectively. During this period, the following alterations in land use were observed: Cropland and Grassland show a consistent decrease in area. Forest and Water present an initial increase in area followed by a decrease. Construction Land and Unused Land is featured by a continuous increase in area. Water Area is relatively stable.
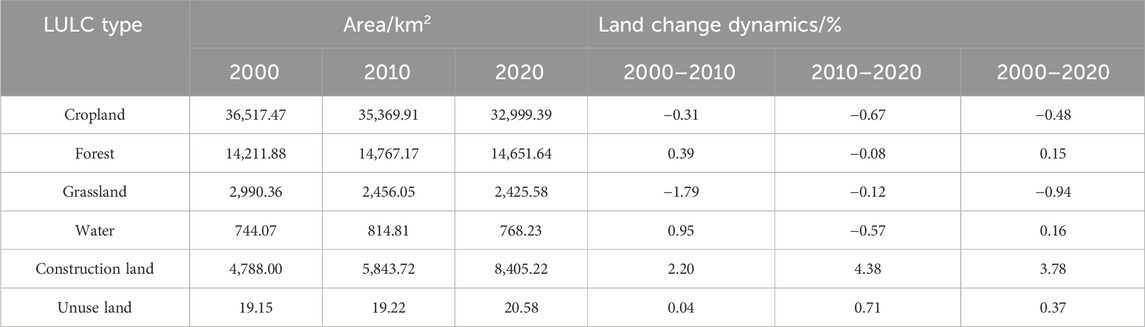
Table 2. Changes of LULC in 2000–2020.
Examining the quantitative aspects of these changes, the following was noted: Construction land increased by 3,617.22 km2, representing 44.30% of the total change. Cropland decreased by 3,518.09 km2, amounting to 43.09% of the total change. Grassland shrank by 564.78 km2, constituting 6.92% of the total change. Forest expanded by 439.75 km2, equivalent to 5.39% of the total change. Water area grew by 24.16 km2, comprising 0.30% of the total change. Unused land area escalated by 1.42 km2, accounting for 0.02% of the total change.
From the perspective of dynamic land use change (Table 2), an analysis of the construction land and cropland from 2010 to 2020 revealed significant alterations. The changes were quantified as 4.38% for construction land and −0.67% for cropland. These figures were markedly higher than the values of 2.20% and −0.31% obtained for the period from 2000 to 2010, illustrating a twofold increase in the dynamic attitude of these land types. Additionally, the dynamic attitude of grassland underwent a noteworthy transformation. During the period from 2000 to 2010, the change was recorded at −1.79%, whereas from 2010 to 2020, it diminished to −0.12%. This change represents a 15-fold decrease in the dynamic attitude of grassland over the time span considered.
Construction land is characterized by its fast expansion, which was predominantly facilitated by the conversion of cropland and grassland. Conversely, these areas were minimally augmented by forest, water area, and unused land. This transformation can be attributed to the acceleration of urbanization and agricultural modernization, which have introduced new demands for the utilization of cropland and construction land. Consequently, these demands have precipitated continuous modifications in land use patterns over time.
Within the framework of the PLUS model, LEAS was employed for determining contribution rates of driving factors to each type of land use in 2000–2020 (Table 3), along with the spatial distribution (Figure 3). The contribution rate data provide a significant measure of the influence exerted by driving factors on land use types, with values approaching 1 indicating an increasing impact of the corresponding factor on the observed land use.
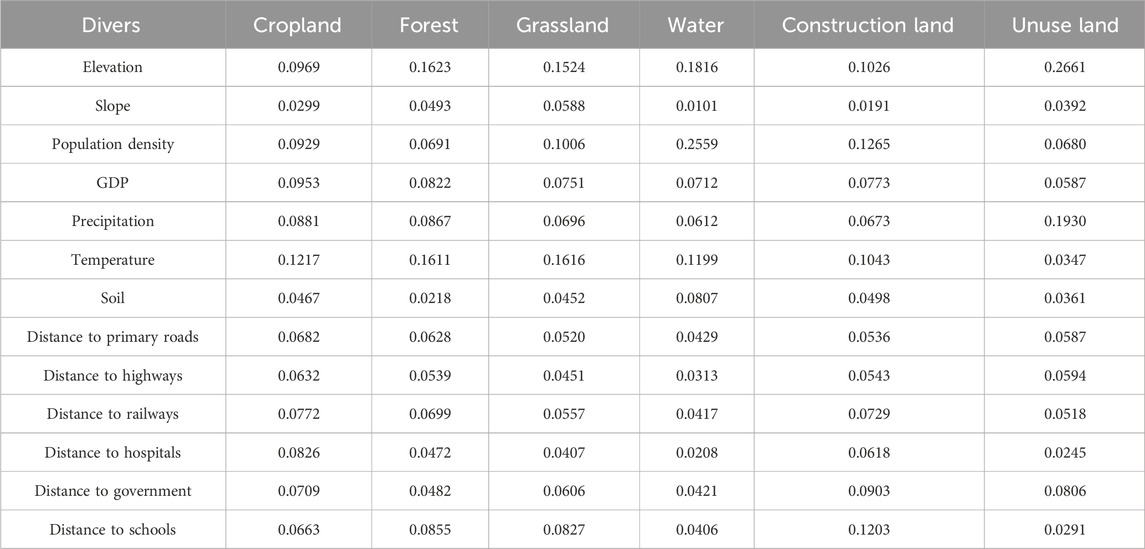
Table 3. Contribution of drivers to each land use type for 2000–2020.
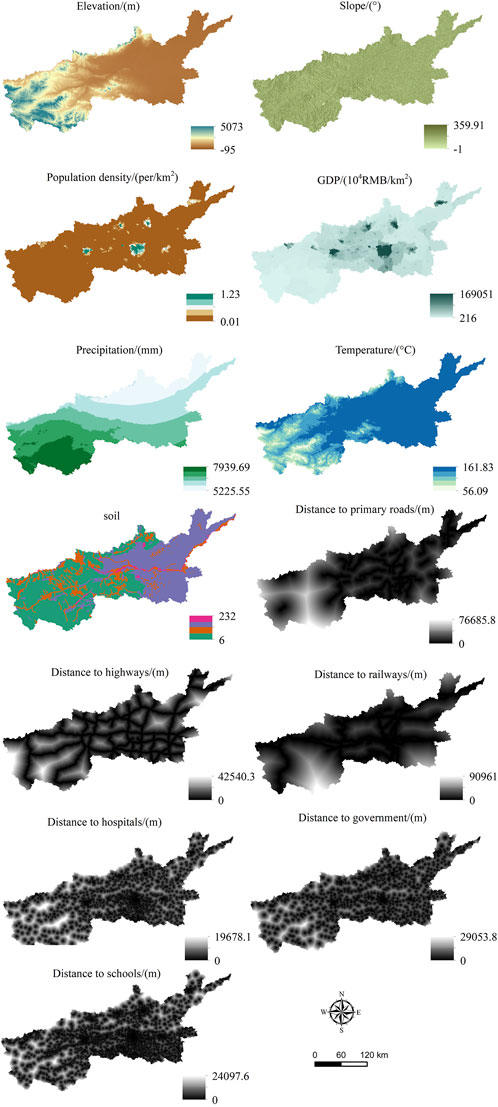
Figure 3. Thirteen types of driving factors affecting LULC.
For cropland, temperature exerted the most substantial influence. Appropriate temperatures are instrumental in crop production, while an escalation in population density and GDP amplifies the necessities for food supply and corresponding demand for cropland (Zhang and Xie, 2019; Tian et al., 2022). In the case of forest change, the predominant drivers were elevation, temperature, and precipitation. Forests were primarily located in the western part of the Yellow River region of Henan Province, an area typically characterized by higher elevations, conducive temperatures, and abundant precipitation. Temperature and population density emerged as the central drivers of grassland change, signifying that grasslands are responsive to temperature fluctuations and are influenced by areas with elevated population densities (Liang et al., 2021; Zhai et al., 2021; Tian et al., 2022). Construction to support denser populations was the principal factor engendering changes in water availability, encroaching on either cropland or grassland (Zhai et al., 2021; Guo et al., 2022; Wang et al., 2022). In the context of construction land changes, population density was the primary driver, as increasing population densities necessitated additional construction land to house the burgeoning populace (Tian et al., 2022); this includes the requirement for specific distances to schools and government resources to enhance living conditions, education, and transportation accessibility. Collectively, assessment of drivers influencing land use contribution underscored that elevation, population density, and temperature were critical determinants in land use conversion. This observation is congruent with prevailing understanding and perceptions of land use dynamics, irrespective of the specific type of land use.
The Moran index values for the Yellow River region within Henan Province during the years 2000, 2010, and 2020 were recorded as 0.674, 0.656, and 0.674, respectively. These positive values indicate a positive correlation between ecosystem service value (ESV) and an agglomeration trend.
In 2000, the ESV for this region amounted to 70,523.7 million RMB; by 2010, it had increased to 71,306.7 million RMB, but in 2020, it fell to 69,917 million RMB. This pattern demonstrates an initial increase followed by a decline, and the overall ESV decreased by 1,432 million RMB over the 20-year period (Table 4). This decrease is indicative of the continual reduction in cropland and grassland area, which contributed to the decline in ESV. Conversely, the ESV of unused land did not exhibit significant fluctuations. Specifically, the ESVs of cropland and grassland decreased by 1917.9 million RMB and 940.3 million RMB, respectively, while those of forest and water area increased by 1,127.5 million RMB and 298.7 million RMB, respectively.
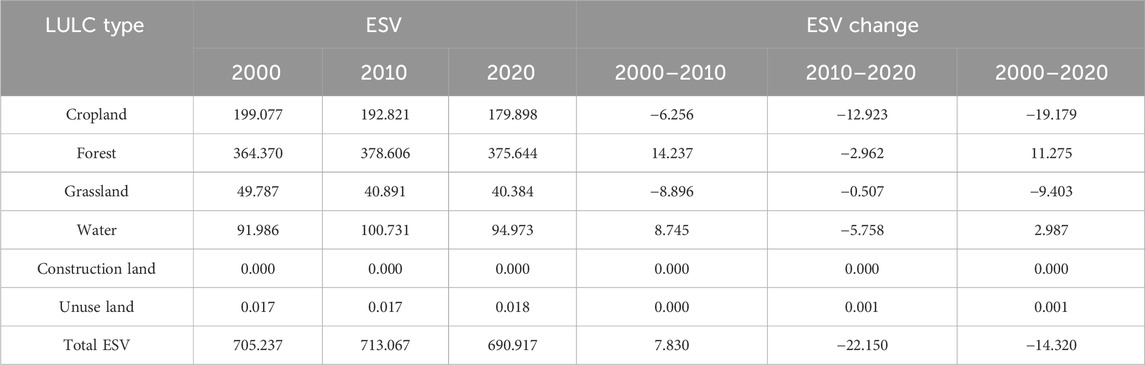
Table 4. ESV changes during 2010–2020 (×108 RMB/hm2).
The ESV distribution along the Yellow River in Henan Province was assessed using the spherical kriging interpolation method. Subsequently, the ESV from 2000 to 2020 was categorized into six intervals employing the natural discontinuities method (Figure 4), enabling a spatial analysis and evaluation. Generally, the spatial distribution of ESV in this region remained relatively stable. Areas with high values are clustered in southern parts of Sanmenxia and Luoyang cities, as well as the northern regions of Jiyuan and Jiaozuo cities. These locales are primarily characterized by extensive grassland and forest coverage, and the ecosystem is comparatively intact. The strategy of converting cultivated land back to forest also contributed to an increase in forestland area, incrementally enhancing ESV. Conversely, areas with low values are in the northern parts of Luoyang, Zhengzhou, Jiaozuo, Xinxiang, and Hua County, along with Puyang and Kaifeng cities. The abundance of cropland and construction land in these areas has significantly compromised the ecosystem. Human activities related to production and daily living have inflicted serious damage, resulting in a substantial negative impact on ESV.
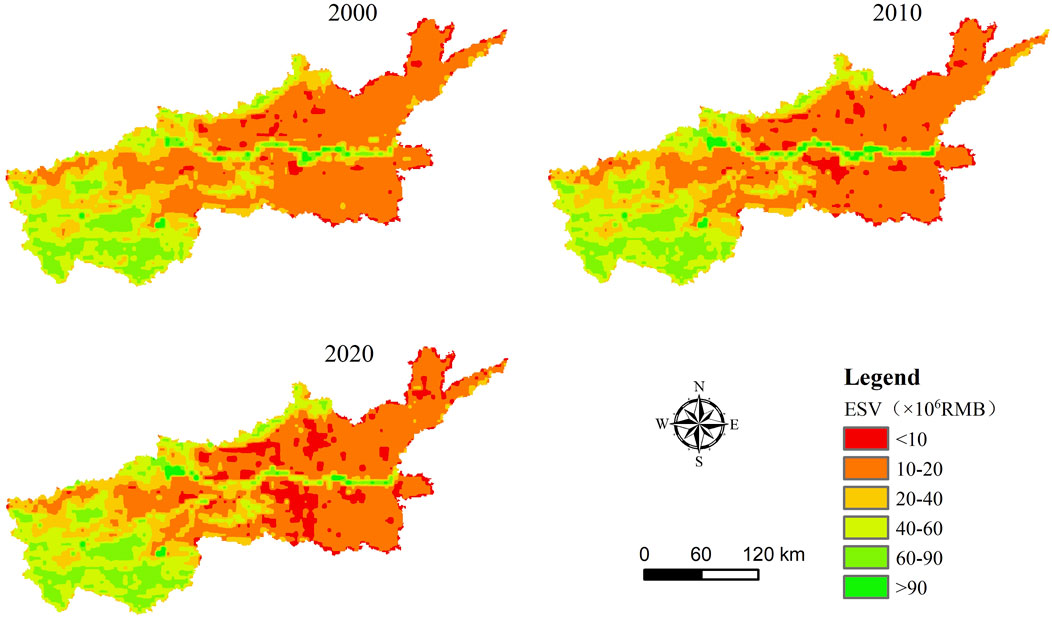
Figure 4. Spatial ESV distribution during 2000–2020.
Employing land use records from the years 2000 and 2010 as foundational data, this research integrated development probabilities of influential factors and the proportion of individual land use types to the aggregate classification into the PLUS model. Simulations were executed to depict land use categorizations for the years 2010 and 2020, with the ensuing outcomes being cross verified against real-world instances. The analysis manifested an overall precision of 89.7% and 88.7% for 2010 and 2020 respectively, with corresponding kappa statistics of 0.820 and 0.811, and FOM metrics of 0.136 and 0.088. A kappa statistic exceeding 0.8 (Huang et al., 2019; Lin W. et al., 2020b) corroborated the efficacy of the PLUS model simulation in the Henan Province’s Yellow River zone, substantiating the authenticity of the methodology for foreseeing future transformations in land utilization.
To investigate the evolving trends of population, economy, and regulatory influence on land use, this research simulated land use type distributions under three distinct scenarios in Henan Province’s Yellow River region for 2030.
The natural development scenario (NDS) holds the development likelihood for 2020–2030 constant with the probability of 2010–2020, disregarding additional variables. In contrast, the cropland protection scenario (CPS) acknowledges the vital need to conserve cropland near the Yellow River in Henan Province. It is necessary to ensure the reasonable expansion of construction land, but also to strictly observe the quantity of cultivated land. This means mitigating the probability of converting forestland and cropland to construction land by 30%, while simultaneously augmenting the construction land’s conversion probability to cropland by 10%. Other lands follow the natural trend of development. Meanwhile, the ecological protection scenario (EPS) is aligned with contemporary ecological conservation demands, prioritizing land use forms that fortify ecosystem stability, emphasis needs to be placed on increasing the amount of grassland, forest, and cropland. Consequently reducing the probability of converting grassland, forest, and cropland to construction land by 40% while raising the probability of construction land to cropland by 40%. Other lands follow the natural trend of development. The domain weight was determined according to land use type proportions.
Under NDS, a comparative study with 2020 reveals a reduction in cropland by 1,874.84 km2, forest by 132.26 km2, and grassland by 21.82 km2. Conversely, expansions in water and construction land areas are observed, increasing by 39.88 km2 and 1999.02 km2, respectively (Figure 5; Tables 5, 6). In monetary terms, ESV declined by 921.0 million RMB during this period. This reduction comprises a decrease in cropland ESV by 1,022.1 million RMB, offset partially by an increase in water ESV by 493.1 million RMB. The accelerated growth of construction land, encompassing substantial portions of cropland, forest, and grassland, has instigated significant concerns for both ecological integrity and food safety. The emergent data points to a pronounced structural disequilibrium among the various land use categories.
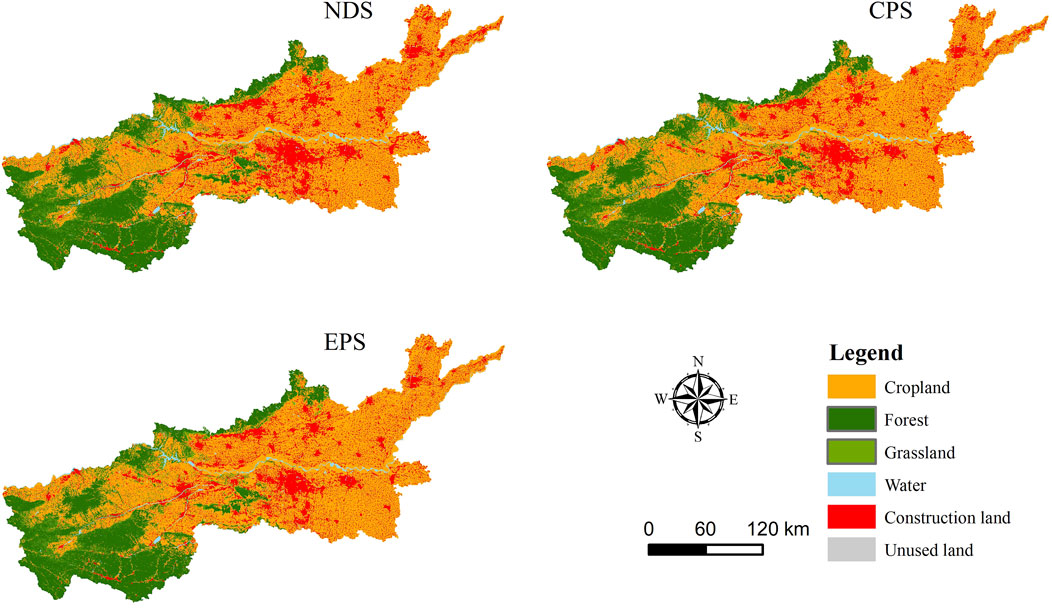
Figure 5. Spatial LULC distribution in 2030.
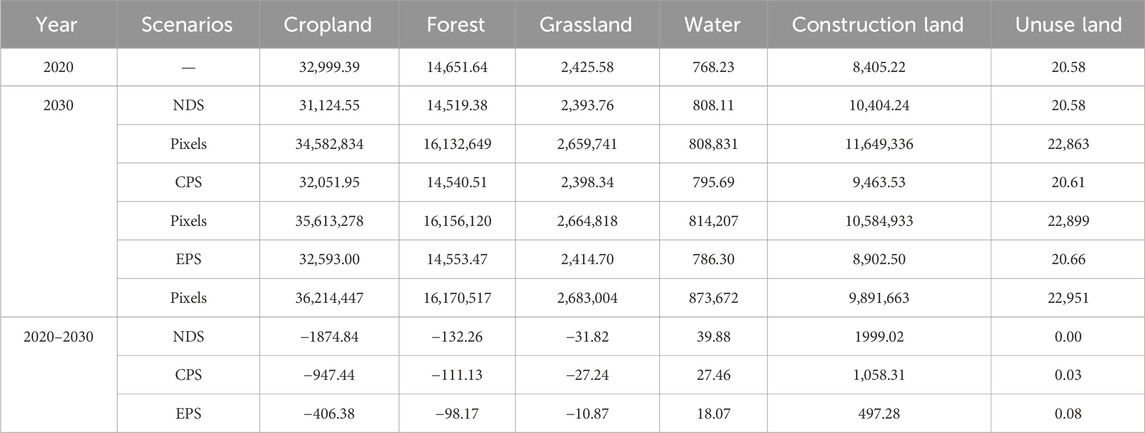
Table 5. Projected LULC area and pixels under three different scenarios in 2030 (km2 and numbers).
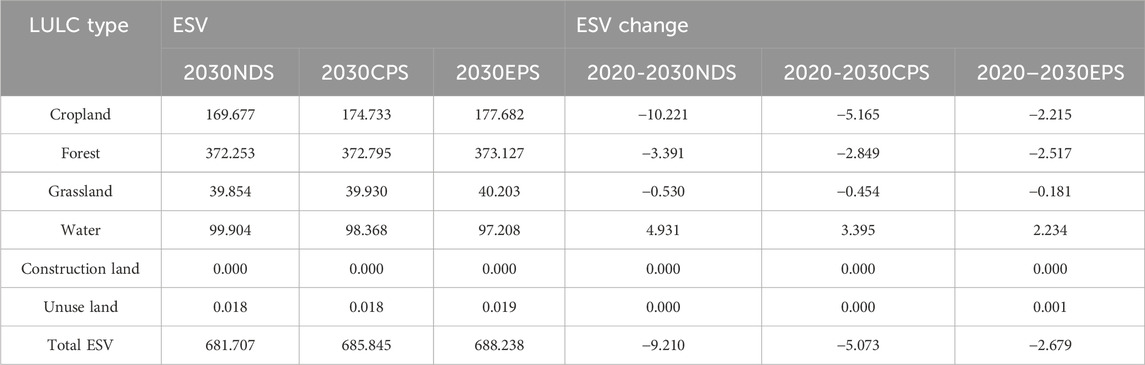
Table 6. Total ESV in 2030 compared with 2020 (×108 RMB/hm2).
Under CPS, and in comparison to the state in 2020, there were reductions in the areas of cropland by 947.44 km2, forest by 111.13 km2, and grassland by 27.2 km2. Concurrently, increments were observed in water and construction land areas, increasing by 27.46 km2 and 1,058.31 km2, respectively (Figure 5; Tables 5, 6). In relation to NDS forecasted for 2030, the overall ESV experienced a growth of 413.8 million RMB. This alteration is characterized by augmentations in the areas of cropland, forest, and grassland, accompanied by a moderated expansion rate in construction land. Specifically, the decline in ESV pertaining to cropland was halved in comparison to the NDS, a finding that is congruent with the objectives of cropland conservation, leading to an enhanced rationalization of the land use architecture.
Under EPS, a comparative analysis with 2020 reveals a decrease in cropland area by 406.38 km2, forest by 98.17 km2, and grassland by 10.87 km2. Concurrently, the construction land and water areas have increments of 497.28 and 18.07 km2, respectively (Figure 5; Tables 5, 6). When contrasted with the 2030 cropland protection scenario, the overall ESV rose by 239.3 million RMB. This includes a decrease in the areas of cropland, construction land, and grassland equal to 2/5 of the reduction observed in the CPS, and a 4/5 reduction in forest area. Such findings point to an optimized land use structure within the EPS, emphasizing a harmonized balance between economic demands and ecological preservation. Although the overall ESV contracted by 267.9 million RMB relative to 2020, a restorative trend is discernible, signaling that policies fostering the transition of cropland to forest coupled with sustainable development initiatives have engendered a symbiotic enhancement for both ecological stewardship and socioeconomic sustainability.
The hot spot analysis conducted for the three scenarios within the study area divulged distinct patterns (Figure 6). Under NDS, hot spot regions were primarily clustered and largely confined to areas where ecosystem integrity was most robust. Conversely, cold spot regions were predominantly localized within Zhengzhou, Xinxiang, and Jiaozuo cities, where urbanization processes have been expedited. The consequential vast expansion of construction land has wielded a considerable impact on ecosystem functionality, culminating in a decline in ESV. In the context of CPS, both cold spot and hot spot concentrations manifested a minor increment, reflective of the fact that containment of cropland and forest areas can decelerate the rate of ESV degradation. Lastly, under EPS, clustering of cold spots escalated more markedly, and the spatial clustering of these cold spots intensified.

Figure 6. Spatial distribution of ESV hot/cold spots across various scenarios in 2020–2030.
The correlation between land use structure and ESV is pronounced, with varying degrees of impact on ESV. Utilizing the Markov-PLUS coupled model, it is feasible to not only enhance the land use structure but also to balance both quantitative and spatial optimization objectives. This harmonization contributes to the dual goals of fostering ecological civilization construction and sustaining social and economic development, thereby promoting the synergistic evolution of ESV. In the context of the cropland protection and ecological protection scenarios, the simulated ESV exceeded that of the 2030 natural development scenario. This outcome signifies the capacity of combining Markov and PLUS models to refine land-use patterns and capitalize on the benefits associated with ESV. Through a detailed hot spot analysis of ESV in 2030 across the three scenarios, specific cold spot and hot spot regions were identified under varying conditions. By managing these targeted areas and concentrating on strategic renovation, the model facilitates precise, well-reasoned utilization of land resources.
For urban regions within the Yellow River Basin, the central dilemma in accessing ESV lies in preserving ecosystem stability to the greatest extent possible, all the while facilitating rapid economic expansion and ensuring sustainability. A variety of coupled models have been deployed in major urban centers or ecological function zones; however, due to the pronounced disparities in the geographic characteristics such as " lakes, fields, forests, rivers, mountains, and grasslands” across different cities, these coupled models are not universally applicable. Tailored strategies must be crafted in alignment with the unique conditions of the study area.
Leveraging the foundational Markov model, the PLUS model was integrated to architect a coupled land use model specifically for the Henan Province region along the Yellow River. This model is attuned to the particular attributes of the study region, allowing for the formulation of regionally specific scenarios and the attainment of predefined objectives. By simulating land use data across three disparate scenarios, comparisons were made regarding both the changes in land use types and the spatial distribution of ESV’s cold and hot spot areas. The establishment of diverse land use scenarios through this method offers valuable insights that can guide comprehensive land use planning and regional ecological preservation in the future.
In the broader context, governmental policies are pivotal in shaping changes in land use, with specific actions such as converting farmland to forestry having substantial impacts on ESV.
Furthermore, this study undertook a correction process for ESV coefficients to enhance their accuracy within China, particularly in the Henan Province region along the Yellow River. Notwithstanding, the study established the correction coefficient for construction land at zero, meaning it did not account for the extent of construction land’s influence on ESV. This omission only partially represents the true impact on ESV of construction land when deployed, resulting in residual uncertainty in the findings. Significant spatial heterogeneity characterizes the Yellow River region in Henan Province, primarily due to substantial environmental variations. To accurately reflect these regional differences, it is advisable to refine spatiotemporal coefficients for ecosystem service values using data such as net primary productivity (NPP) and precipitation. Furthermore, conducting accuracy assessments through comparative analysis of simulation outcomes under different domain weights is essential to enhance the credibility of future land use simulations and validate the model’s reliability. Consequently, integrating a variety of factors in future land use planning is crucial for developing more accurate predictive models and thereby deriving more precise outcomes. Additionally, implementing standardized, precise, and sustainable strategies will promote the effectiveness of land use planning and ecological conservation efforts in the region.
In addressing the challenge of population and economic growth impacting ecosystem service value (ESV) within large neutral cities, this study proposed the Markov-PLUS coupled model to sustain ESV stability through the optimization of land use structure. The model’s accuracy was validated using data from the Yellow River region of Henan Province. This investigation encompassed an analysis of changes in land area, the effect of key driving factors on land use, and ESV trends in the Yellow River region of Henan Province from 2000 to 2020. Additionally, the study simulated types of land use under three distinct scenarios for 2030 and performed cold and hot spot analysis of ESV for discerning spatial and temporal distribution laws of ESV.
The findings revealed that elevation, population density, and air temperature were primary contributors to changes in land use during 2000–2020. The occupation of significant amounts of cropland and grassland by rapidly expanding construction land led to a decrease in ESV by 1.432 billion RMB over this period. High-value ESV zones corresponded to areas with relatively intact ecosystems, while low-value ESV regions were predominantly found in cropland and construction land, where human activities exerted considerable influence on the ecosystem. Land use for 2030 was simulated and assessed. In the ecological protection scenario, optimization of the land use structure was achieved along with a balanced consideration of economic and ecological aspects, leading to a synergistic realization of ecological civilization construction and sustainable socioeconomic development. Concurrently, hot spot analysis showed relative stability in cold and hot spot areas under various 2030 scenarios. Notably, under the ecological protection scenario, there was a more pronounced increase in cold spot concentration, coupled with higher agglomeration.
Indeed, the utilization of the Markov-PLUS coupled model, combined with multiscenario analysis, offers a valuable reference framework for the sustainable growth of large and medium-sized cities, land use optimization, and ESV preservation. Within the principles of territorial spatial planning, recognition of regional disparities and specificities is integral, as is the bolstering of ecological protection, to ascertain the sustainable utilization of land resources, thereby culminating in the high-quality advancement of large and medium-sized urban areas. In areas where ecosystems are thriving, it is prudent to further enhance the ecosystem service functions. Give full play to the advantages of different regions, increase the coverage of woodland, grassland and other vegetation, and maintain the stability of the ecosystem to the maximum extent. Conversely, in locales experiencing a swift diminishment in cropland, stringent adherence to cropland protection measures is paramount, with primary focus on controlling and diminishing the loss of ecosystem service functions. At the same time, ensure the effective expansion of urban development boundaries, and coordinate the relationship between land use, urban expansion and ecological environment in the process of urban development along the Yellow River region of Henan Province. The achievement of regional governance mandates the creation of an ecological coordinated development mechanism and the formulation of a novel blueprint for ecological protection in the Yellow River region of Henan Province.
Future inquiries necessitate a consideration of governmental decisions and an enhancement of the correction techniques for the ESV coefficients. The derivation of a more holistic method for attaining the corrected coefficients is required, as this would furnish more precise ESV data to steer the future planning of comprehensive land use. Such precision is instrumental in fostering expeditious and stable development across ecological, economic, and agricultural domains within the Yellow River region of Henan Province.
The original contributions presented in the study are included in the article/Supplementary Material, further inquiries can be directed to the corresponding author.
DZ: Conceptualization, Data curation, Methodology, Writing–review and editing, Writing–original draft, Formal Analysis, Funding acquisition, Project administration, Resources, Supervision. LG: Conceptualization, Methodology, Writing–review and editing, Data curation, Writing–original draft. GC: Conceptualization, Methodology, Writing–review and editing. LY: Resources, Software, Writing–review and editing. TS: Validation, Visualization, Writing–review and editing.
The author(s) declare that financial support was received for the research, authorship, and/or publication of this article. This research was funded by the National Natural Science Foundation of China (No. 41807018) Henan Provincial Science and Technology Research Project (No. 232102320269) and Henan Province basic research fund project (No. 240601087).
Author LG was employed by Henan Kebo Information Technology Co., LTD.
The remaining authors declare that the research was conducted in the absence of any commercial or financial relationships that could be construed as a potential conflict of interest.
All claims expressed in this article are solely those of the authors and do not necessarily represent those of their affiliated organizations, or those of the publisher, the editors and the reviewers. Any product that may be evaluated in this article, or claim that may be made by its manufacturer, is not guaranteed or endorsed by the publisher.
Benítez, F. L., Mena, C. F., and Zurita-Arthos, L. (2018). Urban land cover change in ecologically fragile environments: the case of the Galapagos islands. Land 7, 21. doi:10.3390/land7010021
Besser, H., and Hamed, Y. (2021). Environmental impacts of land management on the sustainability of natural resources in Oriental Erg Tunisia, North Africa. Environ. Dev. Sustain 23, 11677–11705. doi:10.1007/s10668-020-01135-9
Cao, Y., Kong, L., Zhang, L., and Ouyang, Z. (2021). The balance between economic development and ecosystem service value in the process of land urbanization: a case study of China’s land urbanization from 2000 to 2015. Land Use Policy 108, 105536. doi:10.1016/j.landusepol.2021.105536
Fang, F., Ma, L., Fan, H., Che, X., and Chen, M. (2020). The spatial differentiation of quality of rural life based on natural controlling factors: a case study of Gansu Province, China. J. Environ. Manag. 264, 110439. doi:10.1016/j.jenvman.2020.110439
Fang, Z., Ding, T., Chen, J., Xue, S., Zhou, Q., Wang, Y., et al. (2022). Impacts of land use/land cover changes on ecosystem services in ecologically fragile regions. Sci. Total Environ. 831, 154967. doi:10.1016/j.scitotenv.2022.154967
Fu, B. (2020). Promoting geography for sustainability. Geogr. Sustain. 1, 1–7. doi:10.1016/j.geosus.2020.02.003
Gomes, E., Inácio, M., Bogdzevič, K., Kalinauskas, M., Karnauskaitė, D., and Pereira, P. (2021). Future land-use changes and its impacts on terrestrial ecosystem services: a review. Sci. Total Environ. 781, 146716. doi:10.1016/j.scitotenv.2021.146716
Gong, W., Zhang, H., Wang, C., Wu, B., Yuan, Y., and Fan, S. (2023). Analysis of urban carbon emission efficiency and influencing factors in the Yellow River Basin. Environ. Sci. Pollut. Res. 30, 14641–14655. doi:10.1007/s11356-022-23065-x
Guo, R., Wu, T., Wu, X., Luigi, S., and Wang, Y. (2022). Simulation of urban land expansion under ecological constraints in Harbin-Changchun urban agglomeration, China. Chin. Geogr. Sci. 32, 438–455. doi:10.1007/s11769-022-1277-1
Han, J., Hu, Z., Mao, Z., Li, G., Liu, S., Yuan, D., et al. (2022). How to account for changes in carbon storage from coal mining and reclamation in eastern China? Taking Yanzhou coalfield as an example to simulate and estimate. Remote Sens. 14, 2014. doi:10.3390/rs14092014
Hao, L., Chang, S., Tingting, Z., and Peng, L. (2021). Trade-off and synergy relationships of ecosystem services and driving force analysis based on land cover change in Altay prefecture. Jore 12, 777–790. doi:10.5814/j.issn.1674-764x.2021.06.006
Hou, Y., Chen, Y., Li, Z., Li, Y., Sun, F., Zhang, S., et al. (2022). Land use dynamic changes in an arid inland river basin based on multi-scenario simulation. Remote Sens. 14, 2797. doi:10.3390/rs14122797
Hu, S., Chen, L., Li, L., Zhang, T., Yuan, L., Cheng, L., et al. (2020). Simulation of land use change and ecosystem service value dynamics under ecological constraints in Anhui province, China. Int. J. Environ. Res. Public Health 17, 4228. doi:10.3390/ijerph17124228
Huang, D., Huang, J., and Liu, T. (2019). Delimiting urban growth boundaries using the CLUE-S model with village administrative boundaries. Land Use Policy 82, 422–435. doi:10.1016/j.landusepol.2018.12.028
Li, C., Wu, Y., Gao, B., Zheng, K., Wu, Y., and Li, C. (2021). Multi-scenario simulation of ecosystem service value for optimization of land use in the Sichuan-Yunnan ecological barrier, China. Ecol. Indic. 132, 108328. doi:10.1016/j.ecolind.2021.108328
Li, J., Gong, J., Guldmann, J.-M., Li, S., and Zhu, J. (2020). Carbon dynamics in the northeastern qinghai–Tibetan plateau from 1990 to 2030 using landsat land use/cover change data. Remote Sens. 12, 528. doi:10.3390/rs12030528
Liang, X., Guan, Q., Clarke, K. C., Liu, S., Wang, B., and Yao, Y. (2021). Understanding the drivers of sustainable land expansion using a patch-generating land use simulation (PLUS) model: a case study in Wuhan, China. Comput. Environ. Urban Syst. 85, 101569. doi:10.1016/j.compenvurbsys.2020.101569
Lin, M., Biswas, A., and Bennett, E. M. (2020a). Socio-ecological determinants on spatio-temporal changes of groundwater in the Yellow River Basin, China. Sci. Total Environ. 731, 138725. doi:10.1016/j.scitotenv.2020.138725
Lin, W., Sun, Y., Nijhuis, S., and Wang, Z. (2020b). Scenario-based flood risk assessment for urbanizing deltas using future land-use simulation (FLUS): guangzhou Metropolitan Area as a case study. Sci. Total Environ. 739, 139899. doi:10.1016/j.scitotenv.2020.139899
Liu, L., Xu, X., Liu, J., Chen, X., and Ning, J. (2015). Impact of farmland changes on production potential in China during 1990–2010. J. Geogr. Sci. 25, 19–34. doi:10.1007/s11442-015-1150-6
Liu, X., Liang, X., Li, X., Xu, X., Ou, J., Chen, Y., et al. (2017). A future land use simulation model (FLUS) for simulating multiple land use scenarios by coupling human and natural effects. Landsc. Urban Plan. 168, 94–116. doi:10.1016/j.landurbplan.2017.09.019
Liu, Y., Hou, X., Li, X., Song, B., and Wang, C. (2020). Assessing and predicting changes in ecosystem service values based on land use/cover change in the Bohai Rim coastal zone. Ecol. Indic. 111, 106004. doi:10.1016/j.ecolind.2019.106004
Liu, Y., Lin, Y., Liu, W., Zhou, J., and Wang, J. (2024). Remote sensing perspective in exploring the spatiotemporal variation characteristics and post-disaster recovery of ecological environment quality, a case study of the 2010 Ms7.1 Yushu earthquake. Geomatics, Nat. Hazards Risk 15, 2314578. doi:10.1080/19475705.2024.2314578
Liu, Y., Lin, Y., Wang, F., Xu, N., and Zhou, J. (2023). Post-earthquake recovery and its driving forces of ecological environment quality using remote sensing and GIScience, a case study of 2015 Ms8.1 Nepal earthquake. Geomatics, Nat. Hazards Risk 14, 2279496. doi:10.1080/19475705.2023.2279496
Peng, K., Jiang, W., Ling, Z., Hou, P., and Deng, Y. (2021). Evaluating the potential impacts of land use changes on ecosystem service value under multiple scenarios in support of SDG reporting: a case study of the Wuhan urban agglomeration. J. Clean. Prod. 307, 127321. doi:10.1016/j.jclepro.2021.127321
Pontius, R. G., Boersma, W., Castella, J.-C., Clarke, K., de Nijs, T., Dietzel, C., et al. (2008). Comparing the input, output, and validation maps for several models of land change. Ann. Reg. Sci. 42, 11–37. doi:10.1007/s00168-007-0138-2
Prasad, G., and Ramesh, M. V. (2019). Spatio-temporal analysis of land use/land cover changes in an ecologically fragile area—alappuzha district, southern Kerala, India. Nat. Resour. Res. 28, 31–42. doi:10.1007/s11053-018-9419-y
Rao, Y., Zhou, M., Ou, G., Dai, D., Zhang, L., Zhang, Z., et al. (2018). Integrating ecosystem services value for sustainable land-use management in semi-arid region. J. Clean. Prod. 186, 662–672. doi:10.1016/j.jclepro.2018.03.119
Rimal, B., Sharma, R., Kunwar, R., Keshtkar, H., Stork, N. E., Rijal, S., et al. (2019). Effects of land use and land cover change on ecosystem services in the Koshi River Basin, Eastern Nepal. Ecosyst. Serv. 38, 100963–100971. doi:10.1016/j.ecoser.2019.100963
Shen, L., and Zeng, Q. (2022). Multiscenario simulation of land use and land cover in the Zhundong mining area, Xinjiang, China. Ecol. Indic. 145, 109608. doi:10.1016/j.ecolind.2022.109608
Singh, S. K., Laari, P. B., Mustak, Sk., Srivastava, P. K., and Szabó, S. (2018). Modelling of land use land cover change using earth observation data-sets of Tons River Basin, Madhya Pradesh, India. Geocarto Int. 33, 1202–1222. doi:10.1080/10106049.2017.1343390
Su, L., Fan, J., and Fu, L. (2020). Exploration of smart city construction under new urbanization: a case study of Jinzhou-Huludao Coastal Area. Sustain. Comput. Inf. Syst. 27, 100403. doi:10.1016/j.suscom.2020.100403
Tan, Z., Guan, Q., Lin, J., Yang, L., Luo, H., Ma, Y., et al. (2020). The response and simulation of ecosystem services value to land use/land cover in an oasis, Northwest China. Ecol. Indic. 118, 106711. doi:10.1016/j.ecolind.2020.106711
Tian, L., Tao, Y., Fu, W., Li, T., Ren, F., and Li, M. (2022). Dynamic simulation of land use/Cover change and assessment of forest ecosystem carbon storage under climate change scenarios in Guangdong Province, China. Remote Sens. 14, 2330. doi:10.3390/rs14102330
Wang, X., Li, Y., Chu, B., Liu, S., Yang, D., and Luan, J. (2020). Spatiotemporal dynamics and driving forces of ecosystem changes: a case study of the national barrier zone, China. Sustainability 12, 6680. doi:10.3390/su12166680
Wang, Y., Li, X., Zhang, Q., Li, J., and Zhou, X. (2018). Projections of future land use changes: multiple scenarios-based impacts analysis on ecosystem services for Wuhan city, China. Ecol. Indic. 94, 430–445. doi:10.1016/j.ecolind.2018.06.047
Wang, Z., Li, X., Mao, Y., Li, L., Wang, X., and Lin, Q. (2022). Dynamic simulation of land use change and assessment of carbon storage based on climate change scenarios at the city level: a case study of Bortala, China. Ecol. Indic. 134, 108499. doi:10.1016/j.ecolind.2021.108499
Xie, G., Zhang, C., Zhen, L., and Zhang, L. (2017). Dynamic changes in the value of China’s ecosystem services. Ecosyst. Serv. 26, 146–154. doi:10.1016/j.ecoser.2017.06.010
Yang, X., Bai, Y., Che, L., Qiao, F., and Xie, L. (2021). Incorporating ecological constraints into urban growth boundaries: a case study of ecologically fragile areas in the Upper Yellow River. Ecol. Indic. 124, 107436. doi:10.1016/j.ecolind.2021.107436
Yuan, Y., Wu, S., Yu, Y., Tong, G., Mo, L., Yan, D., et al. (2018). Spatiotemporal interaction between ecosystem services and urbanization: case study of Nanjing City, China. Ecol. Indic. 95, 917–929. doi:10.1016/j.ecolind.2018.07.056
Zhai, H., Lv, C., Liu, W., Yang, C., Fan, D., Wang, Z., et al. (2021). Understanding spatio-temporal patterns of land use/land cover change under urbanization in Wuhan, China, 2000–2019. Remote Sens. 13, 3331. doi:10.3390/rs13163331
Zhang, S., Zhong, Q., Cheng, D., Xu, C., Chang, Y., Lin, Y., et al. (2022). Landscape ecological risk projection based on the PLUS model under the localized shared socioeconomic pathways in the Fujian Delta region. Ecol. Indic. 136, 108642. doi:10.1016/j.ecolind.2022.108642
Zhang, Y., and Xie, H. (2019). Interactive relationship among urban expansion, economic development, and population growth since the reform and opening up in China: an analysis based on a vector error correction model. Land 8, 153. doi:10.3390/land8100153
Zhang, Z., Liu, Y., Wang, Y., Liu, Y., Zhang, Y., and Zhang, Y. (2020a). What factors affect the synergy and tradeoff between ecosystem services, and how, from a geospatial perspective? J. Clean. Prod. 257, 120454. doi:10.1016/j.jclepro.2020.120454
Keywords: LULC change analysis, Markov-PLUS model, scenario simulation, ESV, land use planning
Citation: Zhao D, Guo L, Chen G, Yan L and Sun T (2024) Simulation and evaluation of ecosystem service value along the Yellow River in Henan Province, China. Front. Environ. Sci. 12:1414639. doi: 10.3389/fenvs.2024.1414639
Received: 09 April 2024; Accepted: 17 July 2024;
Published: 31 July 2024.
Edited by:
Sérgio António Neves Lousada, University of Madeira, PortugalReviewed by:
Martina Zelenakova, Technical University of Košice, SlovakiaCopyright © 2024 Zhao, Guo, Chen, Yan and Sun. This is an open-access article distributed under the terms of the Creative Commons Attribution License (CC BY). The use, distribution or reproduction in other forums is permitted, provided the original author(s) and the copyright owner(s) are credited and that the original publication in this journal is cited, in accordance with accepted academic practice. No use, distribution or reproduction is permitted which does not comply with these terms.
*Correspondence: Lanbo Guo, Z3VvbGIxMjI0QDE2My5jb20=
†These authors have contributed equally to this work
Disclaimer: All claims expressed in this article are solely those of the authors and do not necessarily represent those of their affiliated organizations, or those of the publisher, the editors and the reviewers. Any product that may be evaluated in this article or claim that may be made by its manufacturer is not guaranteed or endorsed by the publisher.
Research integrity at Frontiers
Learn more about the work of our research integrity team to safeguard the quality of each article we publish.