 Tania Rus
 Raluca-Paula Moldovan
 Miguel Ángel Pardo Picazo
94% of researchers rate our articles as excellent or good
Learn more about the work of our research integrity team to safeguard the quality of each article we publish.
Find out more
ORIGINAL RESEARCH article
Front. Environ. Sci., 03 June 2024
Sec. Environmental Systems Engineering
Volume 12 - 2024 | https://doi.org/10.3389/fenvs.2024.1413629
This article is part of the Research TopicEnvironmental Impacts of Materials and their Life CycleView all 9 articles
Using solar photovoltaic power sources has become a discussed topic in the construction and energy industry. The pressing need to reduce reliance on fossil fuels, increasing costs of traditional electricity generation, and affording photovoltaic modules has sparked a growing interest in solar photovoltaics. This study aims to optimis e the layout of solar photovoltaic systems to minimise environmental impact and building load, comparing the performing south-oriented panels with east-west-oriented panels. The comprehensive analysis performed hinges on a diverse array of determinative factors that demand thoughtful consideration before embarking upon implementing any photovoltaic installation. These salient factors, including but not limited to structural integrity, incorporating ballast for stability enhancement, integrating requisite electrical components, selecting solar panels, quantifying energy production capabilities, assessing carbon emissions, and discerning associated benefits, require thoughtful consideration before implementing any photovoltaic installation. The findings derived from this study underscore that, within the context of the given geographical location, the solar photovoltaic system configured with an East-West orientation represents the optimal choice to reduce both emissions and structural load. This study provides a scientific basis for the construction industry and the energy field and guides the future development of photovoltaic installation projects in a more economic and environmentally friendly direction.
Solar photovoltaic (PV) installations have gained widespread adoption because of their zero-emission electricity generation, but it is important to recognise that their lifecycle, including manufacturing and disposal, has environmental implications. PV systems are becoming more popular as people and businesses aim to reduce their carbon footprint and go green. The advancement of PV systems is also driven by falling costs to install such technologies, which could significantly vary based on location, electricity costs and government subsidies (Kim et al., 2020), but mostly because of the desire for energy independence, especially as electricity prices become more volatile. When planning a solar photovoltaic facility, several aspects must be considered. These encompass the choice of materials (Mahmud et al., 2018) and the tilt and azimuth angle (Meng et al., 2020; Ebhota and Tabakov, 2022). In the northern hemisphere, solar panels are oriented towards the south. The tilt angle is optimal for the latitude of the installation site. Changing the angle and direction of solar PV systems can improve their performance in different regions (Tillmann et al., 2019). Many approaches (Ben Amara et al., 2021; Varo-martínez et al., 2021; Pardo et al., 2022) considered the azimuth (0°C) as this was optimal for achieving the greatest energy production in PV installations.
A part of the solar radiation received by photovoltaic panels undergoes conversion into heat, posing a potential challenge to the efficiency of PV power plants. The efficiency of solar panels decreases by 0.5% per degree. Celsius increases in temperature, depending on the solar cells used (Chandel and Agarwal, 2017). Therefore, temperature regulation is critical for PV efficiency, especially in hotter regions (Amelia et al., 2016; Lv et al., 2023). Different materials and locations were compared to evaluate environmental effects (Zimmerman et al., 2020). Müller et al. (2021) (Müller et al., 2021) compared the environmental effects of single-crystalline silicon (sc-Si) glass-back sheets and glass-glass modules produced in China, Germany, and the EU. They found the lowest environmental effects in glass-glass modules in the EU and Germany. Koester et al. (2022) (Koester et al., 2022) researched the breakdown of solar panels and emphasised the need to recognise, find, and evaluate their financial impact.
Solar PV systems do not generate operational emissions as they rely on renewable energy sources, rather than fossil fuels. Solar PV installations are eco-friendly, yet the debate over the most sustainable designs persists. To answer this question, various experts turn to life cycle assessment (LCA) analysis (Bracquene et al., 2018). Producing and transporting the system’s components—PV panels, batteries, charge regulators, inverters, and structures—consume a lot of energy. The embedded energy encompasses the energy required to extract, process, manufacture, assemble, and transport the system. Studies show a solar PV system’s embodied energy is a small fraction of its total energy (Rahman et al., 2019). Efforts are ongoing to decrease the embodied energy of solar PV systems and make them even more sustainable (Zabalza Bribián et al., 2009).
Significant gaps exist in the study of PV plant lifecycles, particularly about the end-of-life (EoL) stage, because of the limited availability of discarded panels for research (Latunussa et al., 2016). LCA evaluates the environmental impact of a product or process from production to disposal (Gerbinet et al., 2014). Experts predict that PV panels will pose challenges in end-of-life management from the early 2030s (Gautam et al., 2021). Proper disposal of PV panels is necessary to prevent environmental hazards. Disposal of crystalline silicon (c-Si) PV panels should be done to recover valuable materials and assess the environmental effects (Ansanelli et al., 2021; Seo et al., 2021). Treatments to recover silicon metal, silver, copper, and aluminium follow the incineration of the panel’s layers. A novel approach to EoL management of crystalline silicon PV panels has been developed (Ganesan and Valderrama, 2022). This enables sustainable decision-making for emerging technologies by incorporating stakeholder participation.
The LCA assessment showed that an industrial-scale process has environmental obligations. To get good results, the amount of PV waste needs to be around 20,000 tonnes (Mahmoudi et al., 2020). The research conducted by (Tawalbeh et al., 2021; Paiano et al., 2023) showed that we cannot assume zero emissions from a PV system. It is necessary to examine the emissions from production and end-of-life. Many factors affect PV technology’s environmental performance. The energy pay-back time (EPBT) and greenhouse gas (GHG) emissions of different PV systems varied. Thin film technology is the most eco-friendly, with a short EPBT of 0.75–3.5 years and a low GHG emission rate (GHGER) of 10.5–50 (gCO2-eq/kWh) (Peng et al., 2013). Other materials, such as multi-Si PV systems and mono-Si PV, showed EPBT ranging from 1.5 to 2.6 years (and 1.7 and 2.7 years), and the GHGER ranged from 23 to 44 (and 29 and 45) gCO2-eq/kWh, respectively. The environmental performance of photovoltaic technologies is expected to improve. Experts predict that photovoltaic technologies will become more environmentally friendly in the future. A comprehensive analysis (Turconi et al., 2013) examined 167 instances of life cycle assessment across different electricity generation technologies (including 22 cases involving PV technology). The primary emissions in PV technology arise from manufacturing solar cells. GHG emission levels for producing electricity from solar photovoltaic sources fluctuated between 13 and 190 g CO2-eq/kWh.
It is crucial to consider the structure when performing an LCA for a PV technology, regardless of where the photovoltaic system is placed (on the ground, roof, or facades). Structure refers to the physical supports and frames that hold the solar panels in place, however, with integrated photovoltaics systems, the panels are embedded within the building’s structure, eliminating the need for additional support.
Structures such as fixed-tilt, single-axis tracking, and dual-axis tracking can offer support for solar panels (Balaji et al., 2020). Structural design must be sound for system safety and stability, as well as to get the most sunlight. The structure must withstand the weight of the panels, wind loads and other environmental factors. Each structure has its advantages and disadvantages. Therefore, decision-makers should consider the energy production, structure, and weight of the photovoltaic system especially for PV systems mounted on roofs. Adding weight to secure a PV installation on an existing roof could be a problem because of the building’s overall load. Also, when precise indications are given by the roof’s manufacturer to not penetrate the roof’s membrane to hold the structure of a photovoltaic system, the ballast plays a crucial role. Ballast is important for keeping solar panels secure and stable against external forces (Fanney et al., 2003). Incorporating ballast strategically is important for the durability and effectiveness of the solar PV installation, protecting it from harsh conditions and ensuring continuous energy production. Therefore, it is imperative to consider all the components of a PV system (modules, structure, ballast, electrical components, and inverter) when performing a life cycle analysis. The LCA results of a PV installation depend also in a small fraction, yet not negligible, on the location of the system to be more precise, depending on the national energy mix, the energy used from the national grid in the installation phase.
In Romania, in 2022, the share of electricity production from renewable sources was 42% and from solar around 3.2% (Ritchie et al., 2020). Solar PV technologies have recorded one of the fastest increase rates in electricity generation (Cristea et al., 2020). The solar PV cumulative capacity rose to 1.4 GW in 2021 (Ritchie et al., 2020) and over 1.7 GW in 2022 (Renewable Market Watch, 2023). Experts project that the capacity will reach 4.25 GW by 2030 (Vladimir Spasić, 2021).
Choosing the right energy mix is crucial for moving away from fossil fuels to low-carbon options. Notably, Romania’s electricity blend stands out as one of the most well-rounded within the European Union (Stochitoiu and UȚ;U, 2018), exhibiting proportional contributions from various sources: hydro (25.2%), nuclear (20%), coal (18.5%), gas (17.6%) and wind (12.5%). The price of electricity rose, the cost of PV decreased, and carbon intensity decreased (from 441 gCO2-eq/kWh in 2000 to 264 gCO2-eq/kWh in 2022) (Ritchie et al., 2020), highlighting the importance of harnessing solar energy through PV power plants. Coal (1,260 gCO2-eq/kWh), oil (1,125 gCO2-eq/kWh), and gas (808 gCO2-eq/kWh) have higher carbon intensity than renewable energy sources such as solar (30 gCO2-eq/kWh), wind (13 gCO2-eq/kWh), hydro (11 gCO2-eq/kWh), and nuclear (5 gCO2-eq/kWh). In Romania in 2022, coal handled 60% of electricity emissions, gas for 38%, and solar for less than 1%, with other low-carbon sources making up the rest (Electricity maps, 2023).
Less than 15% of 3000 electricity production studies passed the review process, as per a study by the National Renewable Energy Laboratory (Nicholson and Heath, 2012a). Studies show that renewable energy produces fewer emissions than fossil fuels. Notably, Hsu et al., Kim et al. and Nicholson and Health (Nicholson and Heath, 2012a; Hsu et al., 2012; Kim et al., 2012) have presented evidence supporting this notion. The Intergovernmental Panel on Climate found that rooftop solar PV emits between 26 and 60 gCO2-eq/kWh, with an average of 41 gCO2-eq/kWh (Schlömer et al., 2014). Some approaches studied the environmental effects of the materials phase of a net-zero energy building, achieving that the largest environmental impacts are caused by concrete, structural steel, photovoltaic (PV) panels, inverters, and gravel (Thiel et al., 2013), and many approaches to calculate cost benefits analyses by practitioners, researchers and professionals when adopting decisions (Asdrubali et al., 2019) such as new concepts of buildings envelopes (Luo et al., 2022). The study performed by (Tumminia et al., 2020) emphasised that by incorporating on-site energy storage, buildings gain significant flexibility in managing their energy use, reducing reliance on the grid during periods of low solar production, and through his research concluded that pairing an appropriately sized on-site generation system (like lithium-ion batteries) can significantly reduce CO2 emissions.
The present research aims to compare energy production in panels-oriented azimuth 0° S) vs. panels-oriented E-W. This work expects to solve the following questions: 1) Which are the advantages of this E-W orientation? 2) Which of both orientations (South vs. E-W) is most profitable from an energy standpoint? 3) And, from an emissions standpoint? 4) How are the structures resulting from both alternatives? and 5) What is the ballast influence for choosing between alternatives?
Professionals who are designing a solar power station on a roof can use this work to decide whether to orientate panels towards the South S) or the East-West (E-W). When operating in an off-grid installation (but not only), professionals can solve having higher energy at sunrise and sundown by using PV-oriented East-West (azimuth 270º–90°) panels. East-oriented panels produce energy at sunrise and the West-oriented panels at sundown. Other stakeholders should adopt this method to assess surplus energy injected into their grids and support grid management, bypassing blackouts or overload.
Decision-making tools play a crucial role in planning PV installation in the early stages of selecting optimal locations that maximise energy yield while ensuring minimal structural strain on the buildings. Building performance simulation tools are crucial, fostering collaboration between architectural, construction and facilities teams, enabling professionals to make sustainable buildings (Fernandez-Antolin et al., 2022). These tools can help assess the technical feasibility, cost-effectiveness, and environmental impact of different options, guiding informed decision-making.
The paper is organised as follows. Section 2 presents the problem formulation. Section 3 presents the Case Study. Section 4 presents the results and Section 5 discusses the numerical results. Section 6 highlights the conclusions and points for future research.
The study aims to assess and compare the environmental effects of a roof-mounted PV system for two different scenarios, namely, South and East-West orientated panels. To do a complex evaluation, a multi-criteria analysis was performed, using different tools and software, to highlight the differences between scenarios.
The first step was the employment of a widely used tool by professionals and practitioners to ease the design and development of an assembly plan, do the structural analysis, and find the requisite ballast for anchoring the photovoltaic system onto the roof, called K2 Base (BaseK2-systems, 2023). Version 3.1.70.2 of the free planning software K2 Base was used. The software’s design criteria adhere to the guidelines outlined in the Romanian Standard (SR EN, 1990/NA, 1990). Additionally, snow load calculations were executed under the Romanian Standard (SR EN, 1991-1-3/NA, 1991) recommendations, while wind load assessments were based on the specifications provided by the Romanian Standard (SR EN, 1991-1-4/NB, 2006). One advantage of this tool is that it provides the user with a detailed report with the bill of quantities for the structure and the exact location and weight of the ballast needed to secure the PV installation. Using K2 Base in the study shows the practicality and relevance of the research findings. It shows the researchers’ familiarity with industry-standard tools and their ability to translate theoretical concepts into actionable solutions for PV installers and developers.
The next step in the research method was to use the PVsyst software version 7.1.0. The software, also widely used by engineers, professionals, and researchers, has the advantage of a user-friendly approach with various features (Mermoud, 2012; Villoz et al., 2022). It simulates PV system design, loss determination, shading studies and economic evaluation The PVsyst software considers a wide range of factors in the PV system design, variables like site characteristics (location, altitude, shading, and orientation), PV module specifications (type, efficiency, and power rating), inverter specifications (type, capacity, and efficiency), climate data (solar radiation, temperature, and wind speed) and grid connection parameters (voltage level, grid code, and interconnection requirements). By pondering these factors, the PVsyst program generated a detailed design for the PV installation, including the optimal number and layout of PV modules, inverter sizing, and electrical connections.
The simulation is carried out over an entire year and provides a comprehensive report with information like energy and specific production, performance ratio, and losses along the system.
To evaluate the environmental performance of the two scenarios, the OneClick LCA software was used. This software analyses the life cycle carbon (LCC) and the life cycle assessment using EN 15978 guidelines (European Committee for Standardization, 2011). The standard covers the whole building life cycle and uses data from Environmental Products Declarations (EPDs) created by EN 15804 (CEN, 2019). The two indicators differ based on the environmental impact category analysed. LCC focuses on greenhouse gas emissions, while LCA considers multiple impact categories. In the present study, twelve factors were analysed in the life cycle assessment.
• Global Warming Potential (GWP) [kgCO2-eq]
• Acidification Potential (AP) [kgSO2-eq]
• Ozone Depletion Potential (ODP) [kgCFC11-eq]
• Eutrophication Potential (EP) [kgPO4-eq]
• Photochemical Ozone Creation Potential (POCP) [kgC2H4-eq]
• Abiotic Depletion Potential for Fossil Resources (ADPF) [MJ]
• Abiotic Depletion Potential for Non-Fossil Resources (ADPE) [kgSb-eq]
• Total Use of Renewable Primary Energy Resources (PERT) [MJ]
• Total Use of Non-Renewable Primary Energy Resources (PENRT) [MJ]
• Renewable Primary Energy Resources as Raw Materials (PERM) [MJ]
• Renewable Primary Energy Resources excluding Raw Materials (PERE) [MJ]
• Net Fresh Water (FW) [m3].
However, OneClick LCA software had certain limitations. The Environmental Product Declarations (EPDs) do not include all the materials needed for the PV system to work properly, especially the electrical components. Selections were made by considering products possessing analogous technical and physical attributes as reference points. Another restriction came across in this study because of the insufficiency of EPDs accessible through the software, about PV modules. To discuss this limitation, a verified EPD from another LCA software was incorporated into the analysis. The lack of a comprehensive and standardised database is why this limitation exists in scientific literature. In our approach, we studied the module degradation on the energy production, which allowed our system to avoid overestimation for the years of the service life of PV (Nordin et al., 2022). Nonetheless, since the focus of the investigation was on decision-making factors, the approximation made by the software for comparing the two scenarios did not influence the results significantly. The present investigation is focused on evaluating the PV system’s effect on important factors, such as energy generation, payback time, and carbon emissions. The analysis is performed for both South and East-West orientations.
The total energy generated by one PV panel during its reference service life has been determined by Eq. 1:
Where RLS is the reference service life [years]; n is the year of operation; deg is the yearly degradation rate and E1 denotes the energy produced in the first year [kWh/year]. The service life of the system was 30 years with a degradation rate of 0.55% (as declared by the environmental product declaration, EPD, from manufacturer Canadian Solar for Mono Crystalline silicon photovoltaic modules) while the specific production was simulated in PVsyst software for the specific site from Romania, for both scenarios (South-oriented and East-West oriented).
Using the impact indicators and national electricity mix, EPBT and GHGER can be determined. EPBT indicator shows how many years, the renewable energy system needs to produce the same energy used to make it (Frischknecht, 2020):
Where Emat is the primary energy demand to produce materials comprising PV system [MJ oil-eq]; Emanuf is primary energy demand to manufacture PV system [MJ oil-eq], Etrans is primary energy demand to transport materials used during the life cycle [MJ oil-eq], Einst is primary energy demand to install the system [MJ oil-eq]; EEOL is the primary energy demand for end-of-life management [MJ oil-eq]; EO&M is the annual primary energy demand for operation and maintenance [MJ oil-eq]; Eagen is the mean annual electricity generation [kWh] and ηG the grid efficiency (the primary energy to electricity conversion efficiency at the demand side) [kWh electricity/MJ oil-eq].
According to the national conversion factors from final energy to primary energy, for electricity produced with photovoltaic panels and consumed by the aim the conversion factor was considered 1 and injected into the National Energetic System 2.5 (Mc 001-2022, 2023).
For assessing the effectiveness of PV system from the global warming viewpoint, the GHG emission rate was calculated as shown in Eq. 3 (Ito, 2011; Peng et al., 2013)
Where
The Romanian Government approved in 2022 the construction of a new building which will host several research centres and laboratories, called the Artificial Intelligence Research Institute (Figures 1A, B). In the city of Cluj-Napoca, the building is owned by the Technical University of Cluj-Napoca. The construction phase of the building will equip it with various green technologies, such as heat pumps and photovoltaic systems, to cover the annual energy demand. Therefore, the present study aims to compare the installation of the PV system from various perspectives. The roof areas for placing the PV system (totalling 506.2 m2 and divided into two sections) pose a challenge in optimising the number of solar panels to be installed and, therefore, the total power output. In the architectural design of the building, the solar panels are orientated towards the South, as we can observe in Figure 1B.
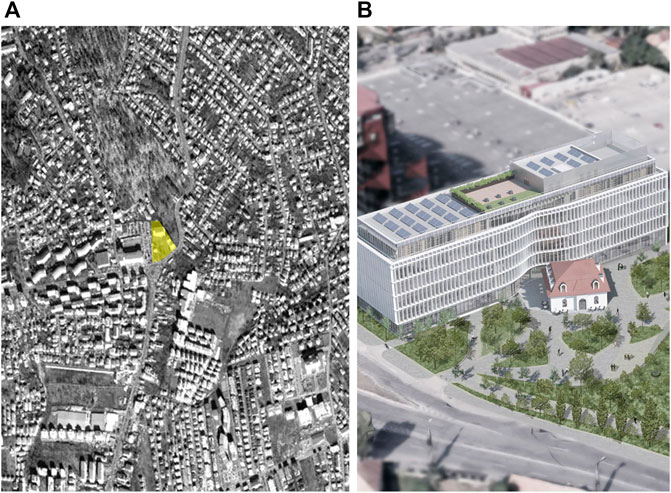
Figure 1. Building location (A); Architectural design (B).
Because of the surging growth of the solar PV panel market, choosing the most suitable panel for specific needs necessitates careful evaluation. Solar panel manufacturers are making panels that generate more and more power, reaching up to 700–800 W peak (Wp). However, these larger capacity panels are also bigger and heavier. This can cause issues during installation, especially on roofs, and can also lead to structural problems down the line, like bending from wind or snow load. To minimise these effects, smaller panels are preferable. However, using lower-powered panels necessitates installing more of them to achieve the same system capacity. This increases both labour and structural costs. Therefore, a balance must be considered between the size and power output of the photovoltaic panels. In this study, we considered a photovoltaic panel with a power of 550 Wp. These PV panels are widely used in roof systems mainly because they have a good mechanical strength supporting heavy snow up to 5,400 Pa and wind load up to 2,400 Pa, which are the standard values for Cluj area also providing enough power to minimise the cost with the labour and structure.
The structure supporting the solar panels is stationary, and the whole solar installation includes both direct and alternating currents. This optimal choice of solar modules for integration within the installation is contingent upon diverse factors, encompassing emissions engendered during their fabrication, as well as their power generation capability.
The first step in finding the best location and angles for the PV modules on the new building was to locate the two available roofs. This was achieved by using geographical coordinates and referring to the placement and situation plans. Two solar panel setups (scenarios) for the AI Research Institute building were studied. The dimensions of the installation are constrained by the building’s roof measurements, and this size remains consistent for all configurations, resulting in a combined area of 506.2 m2. Of this total, 325.1 m2 is allocated to the lower roof, while the upper roof has 181.1 m2.
The first scenario considered involves the implementation of a South orientation, as depicted in Figure 2A. In this arrangement, solar panels are on both the northern and southern roofs of the building. However, because of the limited surface area, we allocate a reduced number of panels to the northern roof. As shown in Figure 2B, the second scenario requires reorienting the installation to face East-West. This modification results in variations to the number of panels and generated power levels, as displayed in Table 1.
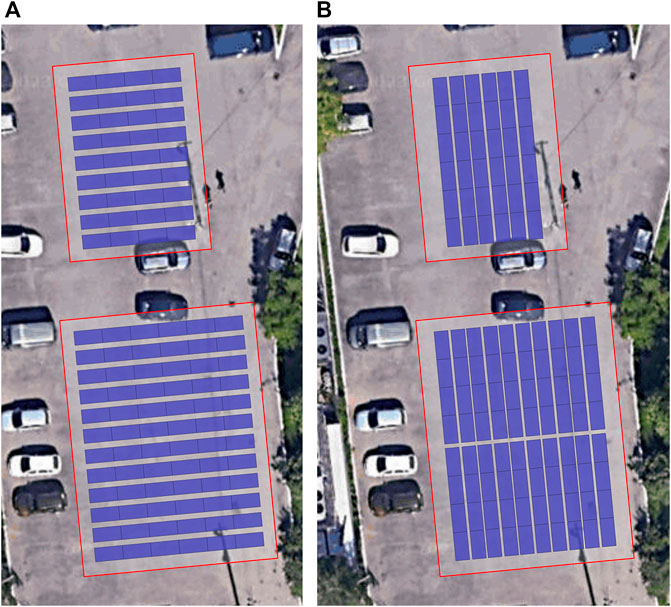
Figure 2. PV modules oriented South (A) oriented East-West (B)
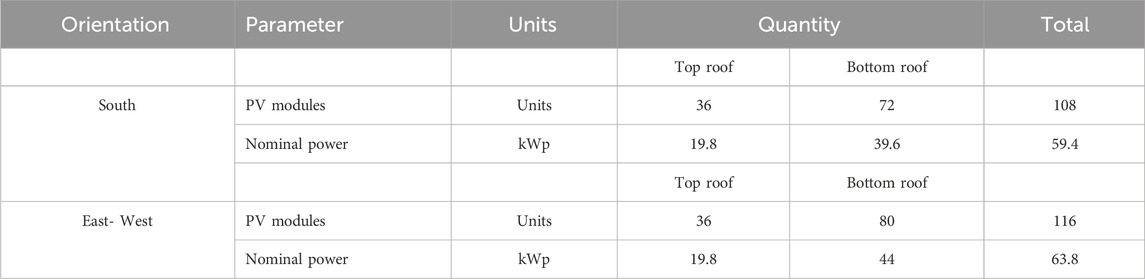
Table 1. Installation size and power output in South and East-West orientation.
The quantity of materials needed for installation will vary based on the system’s orientation. The available surface area determines how many panels can be installed based on their size. Consequently, the required quantity of installation materials will also change accordingly.
To enhance comprehension of the decision-making factors considered in this study, we divide the results of the research into three parts. The first one shows the planning and the simulation outcomes for each scenario of the PV system (bill of quantities and produced energy). In the second part are presented the LCC results for the PV systems components (structure, ballast, electrical elements, except the PV panels), while in the last section, the outcomes of the life cycle assessment for the entire PV systems are revealed. By dividing the results section in this manner, a comprehensive analysis can be conducted to support the decision-making for the sustainable development of a PV installation.
Several key factors influence the optimal design configuration of a photovoltaic (PV) system. These include energy demand profile, available roof area and structural capacity, solar irradiance patterns, budgetary limitations, system conversion efficiency, operation and maintenance requirements, and future scalability. However, these factors may need to be prioritised based on site-specific constraints. With the Artificial Intelligence Institute case study in Cluj-Napoca, limited roof space for PV installation was a primary constraint. Consequently, factors like overall energy needs and future expansion potential were not prioritised during the design phase.
The results obtained with the planning tool K2 Base, for the structure and the ballast of the two scenarios, are presented in Table 2.
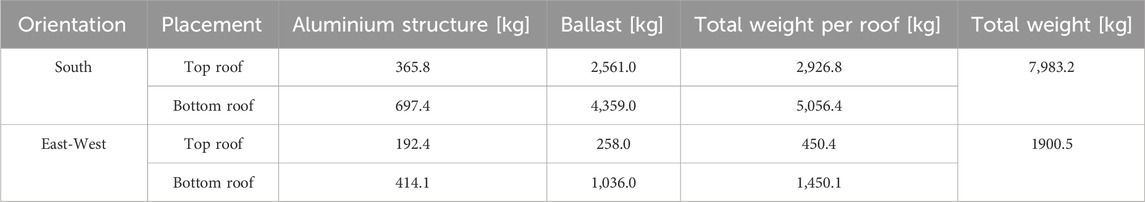
Table 2. Total weight of the structure and ballast for the PV system in South and East-West orientation.
The study highlights the significant difference in weight between the South-facing and East-West-facing PV installations, primarily because of the differing structural requirements associated with different orientations. The aluminium structure and ballast weigh 8 tonnes when PV faces South and 2 tonnes when PV faces E-W. South-facing installations typically require larger and heavier structures to withstand the increased snow and wind loads they receive because of their higher exposure to these forces. On the other hand, East-West-facing installations can often use lighter structures as they are less exposed to snow and wind, resulting in a substantial difference in overall weight.
This difference in weight has implications for both the cost and sustainability of PV installations. Heavier structures require more material and labour, leading to higher installation costs. Additionally, heavier structures can contribute to increased carbon emissions associated with material production and transportation.
Given these considerations, the study’s findings underscore the importance of carefully evaluating structural requirements when designing and selecting PV installations. By considering the specific site conditions, orientation, and local weather patterns, installers can optimise structural design to minimise weight, cost, and environmental impact.
Cluj-Napoca, Romania is within a region experiencing an annual solar irradiation ranging from 1,200 kWh/m2 to 1,300 kWh/m2. Photovoltaic system (PV) modelling software, PVsyst, was employed to simulate solar irradiance on a specific building in Cluj-Napoca. The simulation results showed a global horizontal irradiation of 1,270 kWh/m2 for the east-west oriented system and 1,269 kWh/m2 for the south-oriented system. Demonstrating the software’s accuracy in predicting solar energy availability for this location, the findings from PVsyst simulations align with the expected solar irradiation values for Cluj-Napoca, Romania. The simulations also suggested that a south-facing solar panel system would capture slightly less solar energy annually compared to an east-west system at this location in Cluj-Napoca.
The simulation results using PVsyst software show that south-facing PV panels produce more electric energy than East-West panels when installed with a certain kWp. South-oriented panels produce 1,162 kWh/kWp/year while E-W orientation panels produce 1,095 kWh/kWp/year. However, the East-West photovoltaic system produces more energy annually than the South-facing system because of the different number of installed modules, 116 panels compared to 108 panels (69.86 MWh/year vs. 69.04 MWh/year). While the annual energy production of PV installations is certainly important, it is also crucial to consider the stability of renewable energy sources, as this can significantly impact the reliability and predictability of the energy grid. The installation of PV panels in an east-west orientation can mitigate the effects of peak demand on the grid and optimise the utilisation of solar energy for self-consumption. Consequently, they can reduce their dependence on grid electricity during these periods, resulting in potential cost savings and increased energy autonomy. East-west orientation can also improve energy production on cloudy days by capturing sunlight from different angles throughout the day. It is essential to acknowledge this stability aspect of PV installations, as it directly addresses one of the primary concerns associated with renewable energy integration into the grid. By understanding the variability of energy production from different orientations, we can make informed decisions about PV deployment strategies that optimise both energy output and system stability.
Figure 3 presents a comparative graph of the energy production per month for the two scenarios. This figure also highlights that southern-oriented PV systems provide a more consistent and predictable energy output.
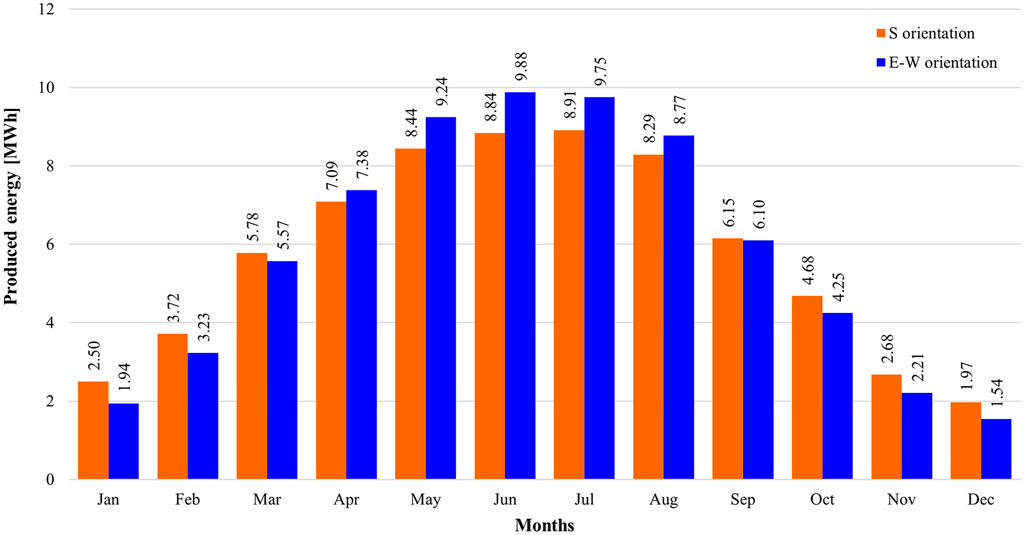
Figure 3. Comparative graph of the energy production for both scenarios.
There are several crucial points to consider when evaluating the orientation of the solar installation. The South orientation requires almost double the number of aluminium profiles as the East-West orientation to support the solar panels. Additionally, it requires over five times the amount of ballast for the foundation of the aluminium structure. Remarkably, this is despite the South orientation generating less energy and using a smaller number of panels. These discrepancies occur within the same installation surface area. It is reasonable to conclude that arranging the solar installation in the East-West orientation is optimal, as it offers a lower overload on the building while still generating enough power. However, the global warming potential (GWP) of both layouts is analysed to compare solar installations.
We extracted the fixed elements, such as the panel support structure, from the software database. Some materials will have a fixed amount in the installation like electrical box, fuse switch disconnector, power supply distributor, switches/circuit breakers, inverter, and perforated metal cable bed. Other materials will vary depending on the final orientation of the panels, such as: solar cable Black for Direct Current (DC), solar cable Red for Alternative Current (AC), solar cable protector, cover clamp, aluminium structure for PV panels, and ballast for aluminium structure.
The LCC results, total emissions of global warming, show that the E-W scenario has lower impacts (Table 3) than the south one, because of a lower quantity of aluminium and ballast required for the installation. Consequently, the emissions produced in the transportation stage (A4) for the South-oriented panels are higher. A larger construction is necessary to accommodate more materials on site, which explains the increase in emissions during both the construction stage (A5) and the materials stage (A1-A3). Table 3 also presents the outcomes of external impacts: benefits from D (installed materials), A5 (construction site - material wastage), B4-B5 (material replacement) and D2 (exported energy).
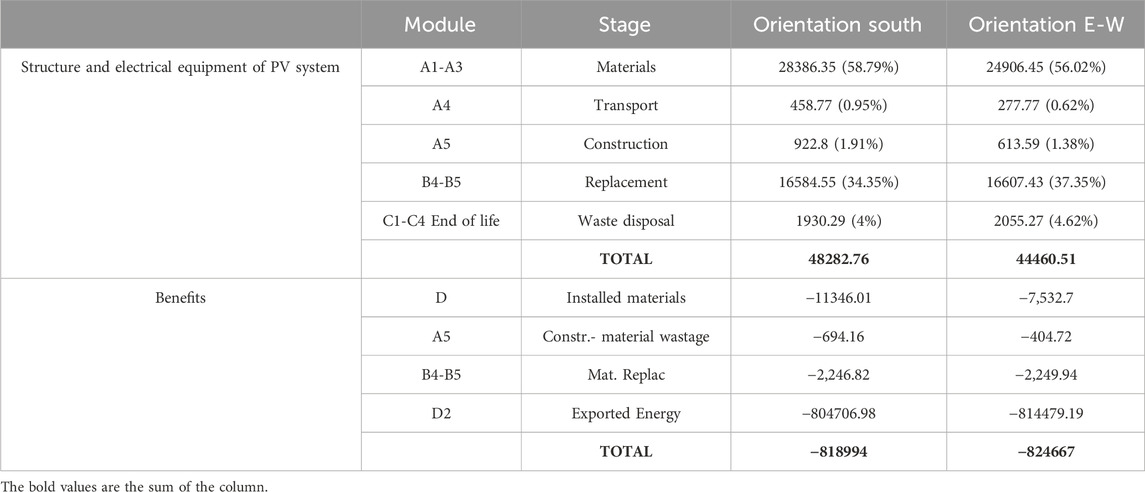
Table 3. Level(s) life-cycle carbon results [kgCO2-eq].
When analysing global warming by resource (Figure 4), we noticed that for both scenarios, electrification components and systems (including a three-phase inverter, electrical box, power supply distributor, switches, and fuse switch disconnector) were the dominant resource, followed by aluminium, cables and other building technology systems. In the East-West orientation, the components and systems associated with electrification accounted for almost 67% of the global warming impact, showcasing a higher value than the South orientation. The South orientation had a higher environmental impact than the other scenario, as it was supposed at aluminium and natural stone (ballast). In the South orientation, the contribution of ballast to global warming stands below 2%, while in the East-West configuration, this impact is notably reduced by 81%.
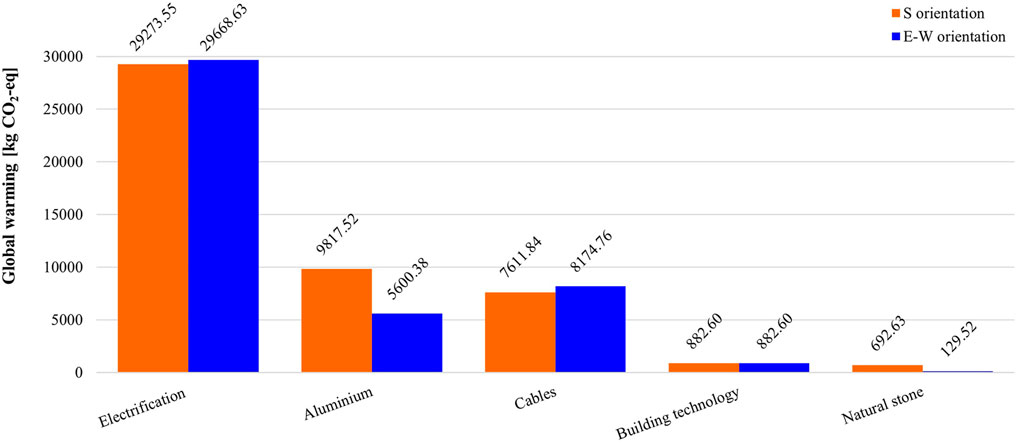
Figure 4. Life-cycle carbon by resource [kgCO2-eq].
In the cradle-to-gate assessment (Table 4), we found that aluminium profiles in the South scenario contribute to 31.6% of global warming emissions. It accounts for 28462.23 kgCO2-eq while for the East-West scenario it accounts for 24916.23 kgCO2-eq. Table 4 displays contributions from the inverter, solar cables, cable protection, and ballast. The solar cables handle 32.51% of emissions in the East-West orientation, followed by inverter, aluminium profiles, cable protection, perforated metal cable bed, mounting plate cover for electrical equipment, and stone pavement tiles.
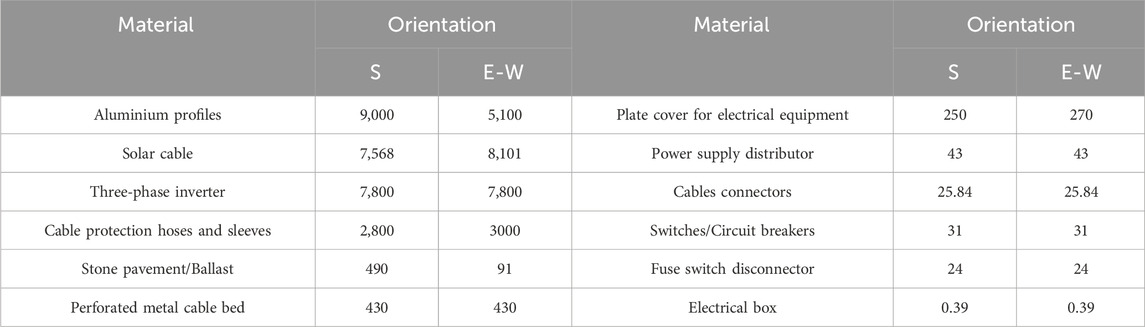
Table 4. Global warming for most contributing materials [kgCO2-eq].
The life cycle assessment of the photovoltaic installation’s components encompassed twelve distinct impact categories. Figure 5 illustrates the impacts of these twelve indicators, categorised by life-cycle stages and materials. Across all indicators except ADPE, the materials stage (A1-A3) exhibited the most substantial contribution, while for ADPE the highest value was recorded for the replacement stage (B4-B5). For A1-A3, E-W orientation implies a lower contribution for most indicators, apart from ODP, EP, POCP and ADPE. For E-W, for all indicators except ODP, EP and ADPE, the replacement stage was the biggest contributor, while for transport (A4), excluding POCP and ADPE, all the rest indicators recorded lower values. Regarding the construction stage (A5), for all indicators, E-W orientation causes lower impacts than S, while for the end-of-life stage (C1-C4), for all indicators excluding GWP, PERT and FW.
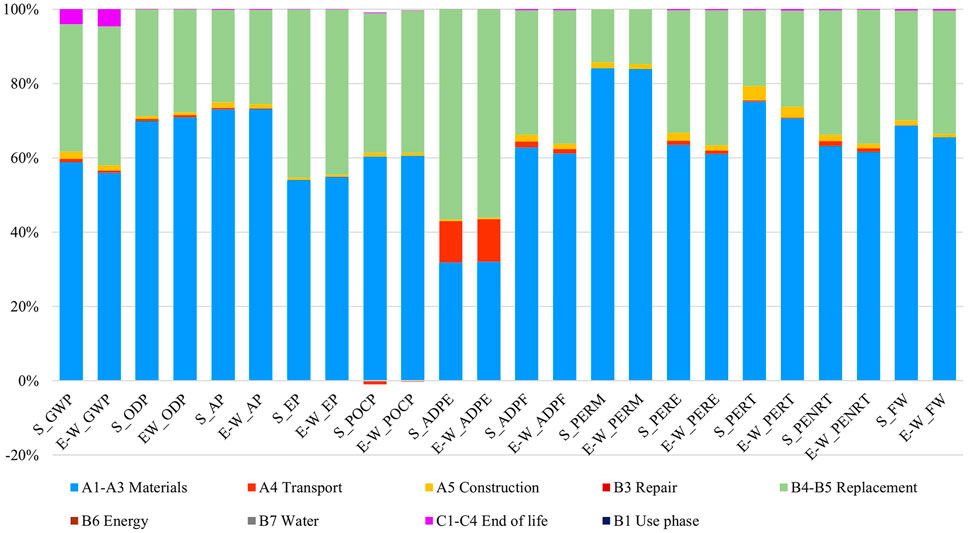
Figure 5. Life cycle impacts by stage for South (S) and East-West (E-W) orientation.
In Figure 5, Photochemical Ozone Creation Potential (POCP) has negative values. We can explain this by looking at the Module A4 calculation, which splits NOx emissions into NO2 and NO emissions for the environmental category of POCP of trucks (DNV, 2021). The reason for a negative value is because of NO emissions, which provide a credit for POCP by reducing the close ground ozone formation. During the night, NO and O2 react to form NO2 and O2, resulting in a reduction of the POCP. So net negative impacts occur when NO > NO2. NOx is emitted by transportation processes and contributes to ozone depletion (Gervasio and Dimova, 2018). However, it should be considered that POCP is only one of the analysed environmental impact categories, even though these negative values may seem unusual.
Table 5 provides a detailed overview of the comprehensive evaluation of the entire PV system (including the panels) across all twelve impact categories. The outcomes of the life cycle assessment for the PV system show that the East-West (E-W) orientation is poised to diminish the following impact categories in contrast to the South orientation.
• Global warming potential (GWP) by 4.08%,
• Abiotic Depletion Potential for Fossil Resources (ADPF) by 3.52%,
• Acidification Potential (AP) by 0.67%,
• All environmental resource use indicators by 0.73%–14%.
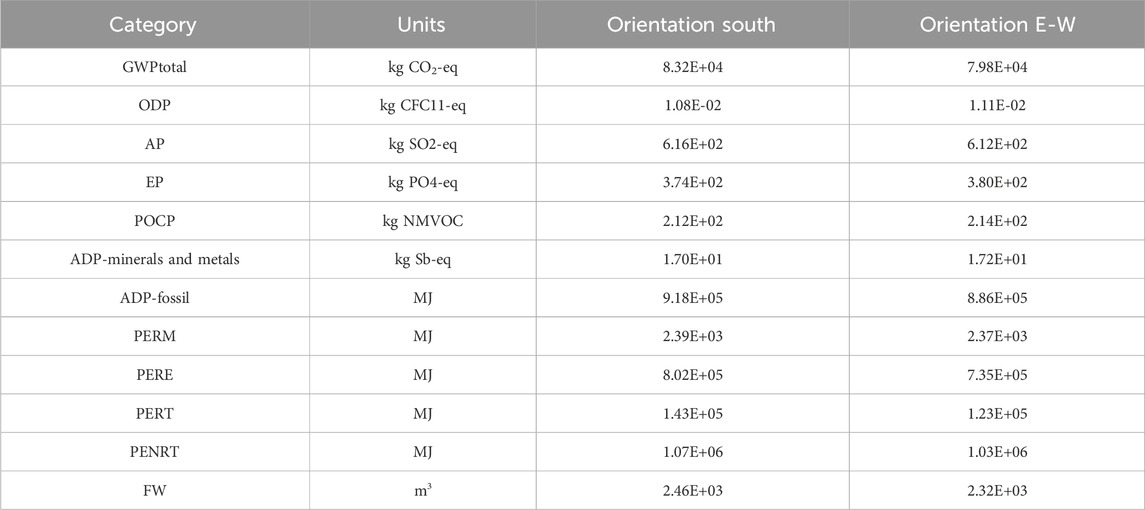
Table 5. LCA results for PV system.
The E-W scenario has the potential to have better environmental outcomes compared to the South scenario.
Across the spectrum of components within the PV system, researchers observed that PV panels had the most significant influence on four out of seven environmental impact indicators. These impacts encompass global warming, ozone depletion, the formation of ozone in the lower atmosphere, as well as abiotic depletion of fossil resources. Conversely, the inverter emerged as the primary contributor to the abiotic depletion of non-fossil resources, eutrophication, and acidification impact indicators (Figure 6). The third highest contributor to global warming, acidification and abiotic depletion for fossil was aluminium profiles. The second major contribution to EP originated from low voltage cable, while for ODP, their influence followed PV panels and inverters.
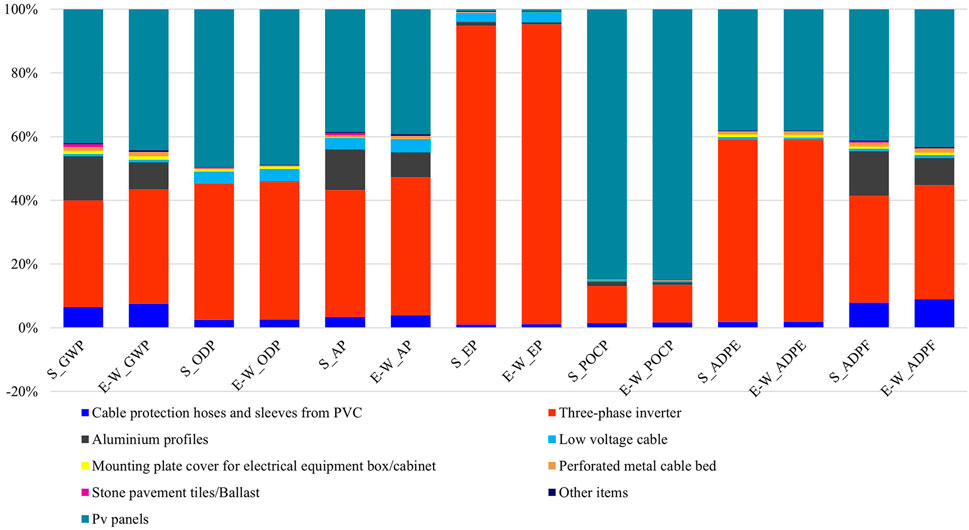
Figure 6. Contribution of PV system’s components to the environmental impact indicators for South (S) and East-West (E-W) orientation.
From the environmental resource use indicators, PERM was dominated by cable protection hoses and sleeves and PERE by the inverter for both orientations. PERT for south orientation was dominated by aluminium profiles, while for E-W by PV panels. For the total use of non-renewable primary energy and net fresh water, the PV panels were the most energy-demanding processes for both orientations (Figure 7).
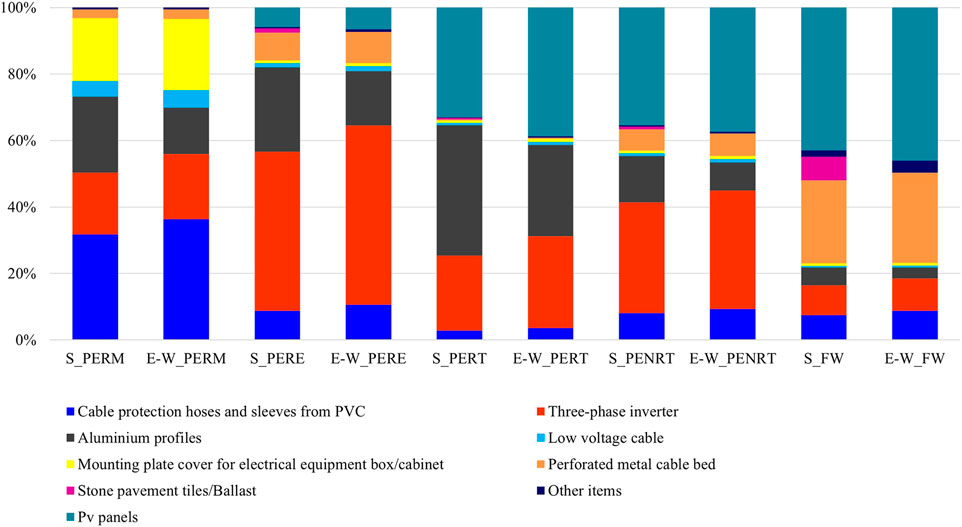
Figure 7. Contribution of PV system’s components to the environmental resource use indicators for South (S) and East-West (EW) orientation.
The results of the energy production of the PV system calculated according to Eq. 1, energy payback time (Eq. 2) and carbon emission rate (Eq. 3) for South and East-West scenarios are given in Table 6. The East-West oriented PV system generates a higher amount of energy, with lower EPBT and GHG emission rates compared to the South-oriented PV system.
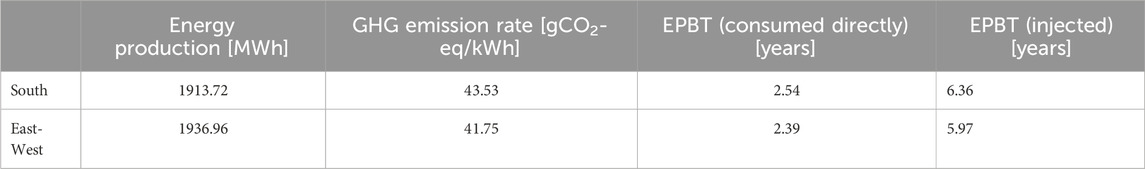
Table 6. Assessment of the PV system.
This study aimed to repurpose unused roof space at the Artificial Intelligence Research Institute in Cluj-Napoca (Romania), to address electricity consumption and reduce carbon emissions towards achieving carbon neutrality (De La Peña et al., 2022). By implementing photovoltaic systems (Cristea et al., 2022) on one building belonging to the Technical University in Cluj-Napoca, Romania, the study aimed to both fulfil a portion of the electricity demand and contribute to carbon emission mitigation.
The life-cycle assessment of the support structure revealed that, in the East-West scenario, global warming diminished by 8% compared to the South orientation. Notably, the most substantial reductions were clear in specific life-cycle stages: transportation (A4) with a 39% decrease, construction/installation (A5) with a 34% decrease, and materials (A1-A3) with a 12% decrease. Among different resource types, for the East-West orientation, global warming potential exhibited reductions for aluminium, and ballast, while it was higher for cables, electrification components and systems.
Considering a cradle-to-gate viewpoint, the primary contributing materials for the East-West orientation were the solar cables (32.51%), three-phase inverter (31.3%), and aluminium profiles (20.5%). In contrast, for the South orientation, aluminium profiles accounted for 31.6%, the inverter for 27.4%, and the cables for 26.59% of the impact from a cradle-to-gate standpoint.
PV panels are the biggest cause of global warming, ozone depletion, photochemical ozone creation potential and fossil fuel depletion among the components of the PV system (Palanov, 2014; Alam and Xu, 2023). The GHG emission rate of 43.53 gCO2-eq/kWh obtained for South and 41.75 gCO2-eq/kWh for East-West is in line with the average value from the literature: 29–45 gCO2-eq/kWh (Peng et al., 2013), 13–190 gCO2-eq/kWh (Turconi et al., 2013), 42 gCO2-eq/kWh (Nicholson and Heath, 2012b), 41 gCO2-eq/kWh (IPCC, 2014), 30–45 gCO2-eq/kWh (Fthenakis and Alsema, 2006), 42.5 gCO2-eq/kWh (Frischknecht, 2020), 21–107 gCO2-eq/kWh (Jones and Gilbert, 2018).
The photovoltaic system in Romania produces fewer greenhouse gases than fossil fuels but more than hydropower, wind, or nuclear energy. This observation aligns with a similar comparison made by (Ali et al., 2022). Building upon this insight and evaluating diverse electricity generation technologies, researchers unveiled that a PV system, compared to coal, might reduce GHG emissions by almost 97% (96.55% for South orientation and 96.69% for East-West).
The energy payback time indicator serves as a valuable tool for assessing the sustainability of a photovoltaic (PV) system. EPBT measures how long it takes for a PV system to produce enough energy to offset the energy used to create and install it, resulting in a net energy gain for the user. However, this indicator’s calculation is contingent on a multitude of influencing factors, including.
1. Type of PV Module: Different PV module technologies exhibit varying energy production and efficiency characteristics.
2. Efficiency of conversion: The efficiency at which sunlight is converted into electricity by the PV modules plays a significant role.
3. Insolation: The amount of solar irradiance a location receives affects the energy output of the PV system.
4. Performance Ratio: The ratio of actual energy output to the expected energy output affects the energy payback time.
5. Installation Type: The installation type of the PV system, whether on a roof, on the ground, or integrated into a structure, can affect its energy production.
6. Support Structure: The design and materials of the support structure can influence the system’s overall efficiency.
7. Application: Whether the PV system is connected to the grid (on-grid) or operates independently (off-grid) affects its energy contribution.
8. Grid Efficiency: The efficiency of the electricity grid in the installation location can influence the overall energy balance.
Considering these factors helps determine the system’s sustainability, and energy payback time and shows its potential to contribute a net gain of energy over its operational lifespan (Peng et al., 2013; Salibi et al., 2021). Compliant with the national conversion factors from final energy to primary energy, for electricity produced with PV panels (Mc 001-2022, 2023), energy payback time resulted in 2.4–2.5 years if the energy generated is consumed directly and 6–6.4 years if it is injected into the National Energy System, the results for E-W orientation being better than for the South. EPBT values from the literature range between 1.7 and 2.7 years (Peng et al., 2013), 1.6–3.3 years for rooftop mounting, 2.7–4.7 years for façade (Gaiddon and Jedliczka, 2006), 1–4.1 years (Bhandari et al., 2015), 8–12 years for a campus university of 67.27 kW in the U.S. (Lee et al., 2016), and 5.5 years for a faculty from a university in Jordan for an on-grid PV system of 56.7 kW (Al-Najideen and Alrwashdeh, 2017).
The number achieved for waste disposal (stages C1-C4) is 1930.29 (4%) for South orientation and 2055.27 (4.62%) for E-W orientation (Table 3), values lower compared to 30% because of post-incineration treatments life in other processes such as sandwich layer incineration (Latunussa et al., 2016). Transport (A4 stage) accounts for 458.77 (0.95%) and 277.77 (0.62%) for both orientations, the same values as 10% achieved in (Latunussa et al., 2016).
We analyze the environmental benefits of using a solar panel system, considering emissions and external factors. The latter includes the benefits of using materials efficiently, reducing waste, and exporting energy. Figure 8 portrays the global warming potential of the photovoltaic panels and the auxiliary components comprising the photovoltaic system (comprising both structural elements and electrical equipment) over varying durations within the system’s life cycle. Specifically, the graph spans from year 0, representing effects incurred before the commencement of system utilization, to year 31, marking the conclusion of the system’s operational life. Furthermore, we evaluate years 10 and 20 for the replacement of specific electrical components, with a particular emphasis on the inverter.
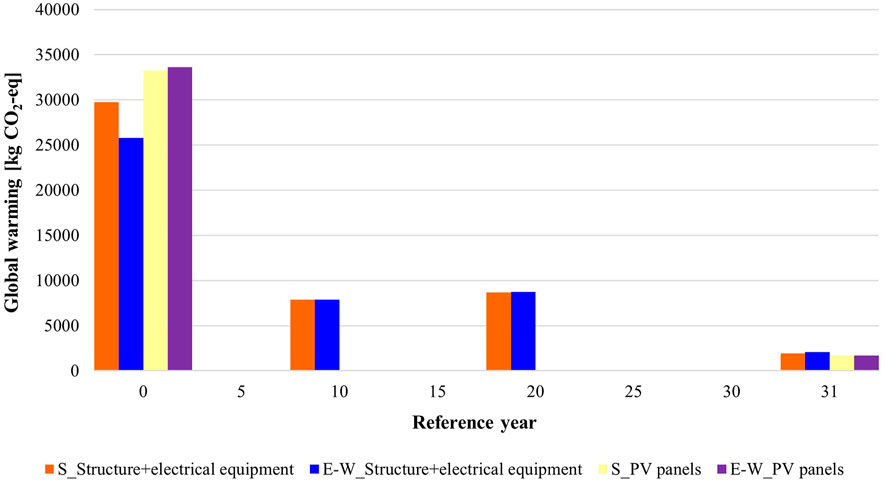
Figure 8. Yearly global warming potential of PV panels and auxiliary components for South (S) and East-West (E-W) orientation.
Considering the benefits’ contribution of using a photovoltaic system (especially the electricity generated), the annual results emphasise that, by implementing such a photovoltaic system, emissions will be considerably reduced, savings being greater (although similar) for the East-West scenario (Figure 9). The figure emphasises the emission savings attained through the utilization of PV systems from a PV system’s lifecycle perspective.
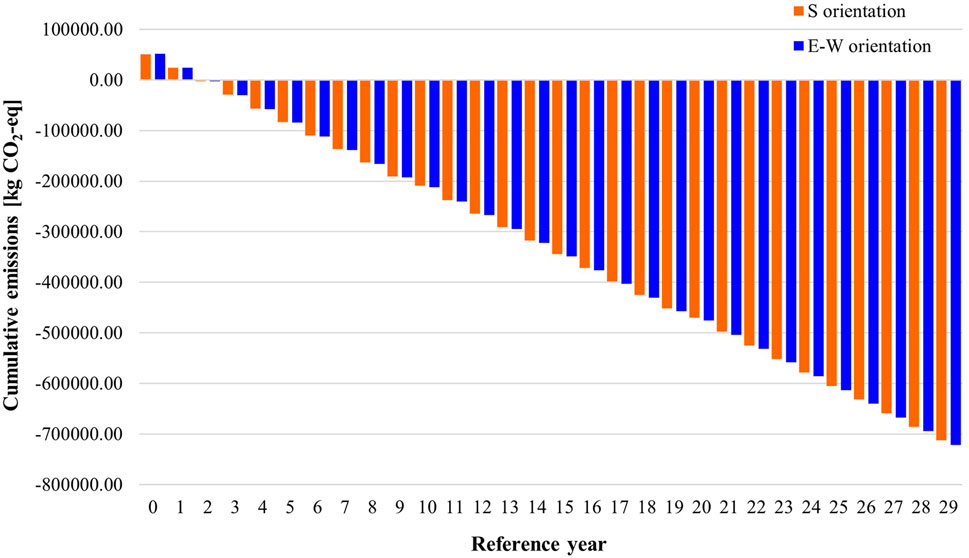
Figure 9. Yearly global warming and benefits of PV system for South (S) and East-West (E-W) orientation.
Based on previous studies (Peng et al. (2013); Zhang et al. (2023) (Peng and Lu, 2013; Zhang et al., 2023)), PV systems can harvest more energy savings and environmental benefits compared to their life cycle investment or other fossil fuel-based technologies. Cusenza et al. (2019) (Cusenza et al., 2019) proposed a potential solution for addressing the growing demand for storage systems in buildings by utilizing the increasing amount of waste batteries from the automotive sector. These batteries, in their second life, have the potential to keep approximately 80% of their initial energy capacity. This approach allows us to repurpose batteries effectively for building storage needs.
Many practical applications underscore the preference for E-W orientation over south orientation. For instance, in residential settings with constrained rooftop space, where rooftops are diminutive or irregularly shaped, E-W orientation may be favoured to exploit space fully. In regions with fluctuating electricity prices based on demand, like those with time-of-use pricing models, an east-west orientation allows homeowners to maximise self-consumption by utilising morning and evening sunlight, which may coincide with peak electricity prices. In off-grid or remote locations where energy storage is imperative, E-W orientation facilitates a more equitable distribution of energy production throughout the day. This permits enhanced use of energy storage systems and diminishes reliance on backup generators or costly battery replacements. For instance, in off-grid irrigation networks powered by photovoltaic modules, the E-W configuration enables prolonged irrigation periods. In commercial establishments experiencing evening energy demand spikes, such as restaurants, theatres, or shopping malls, E-W orientation proves helpful. It aligns energy production with peak demand hours, reducing dependence on grid electricity during costly peak periods.
Future research on rooftop solar panels should move beyond just looking at individual systems. Instead, it should consider the entire energy setup. This may involve studying the impact of combining PV systems with tracking devices and energy storage for energy generation, consumption, and grid interaction. PV tracking systems can significantly enhance the performance of PV installations, particularly in terms of annual energy production and stability. We must assess how various energy sources and grids affect the sustainability of solar panels. This information would help make better decisions about policies and infrastructure planning. Additionally, leveraging the knowledge gained from this study, we can embark on a path towards sustainable practices. This will involve making informed decisions that minimise the environmental footprint while maximising the long-term benefits, by analysing every phase of a product’s lifecycle, from the procurement of raw materials to its eventual disposal. A sustainable approach refers to prioritising selecting materials for all PV system components by comparing environmental impact for different materials, e.g., searching materials with a lower carbon footprint, incorporating recycled silicon, using steel instead of aluminium for mounting structure. Another way relates to exploring alternative transportation methods that have lower emissions, such as using electric vehicles or rail transport for long distances. Additionally, the use of locally sourced materials can significantly decrease the environmental impact associated with transportation. Embracing a circular economy for PV systems plays a key role in diminishing emissions. Recycling system’s components instead of disposal not only lowers the environmental impact but also promotes resource management. Researchers from different fields can give accurate and complete information by examining various standpoints. This manuscript contributes to better decision-making and developing more sustainable PV systems in several ways. By comparing the energy production of different orientations, the study provides insights into how to maximise energy generation, crucial for off-grid installations where energy availability throughout the day is important. This helps stakeholders make informed decisions about system design to make sure a reliable power supply. The analysis of greenhouse gas emissions associated with different orientations sheds light on the environmental implications of PV system configurations. Lower emissions can be achieved by certain orientations, according to the findings, offering a way to reduce the carbon footprint of PV installations. Because of panels and structures being lighter in the E-W orientation, installations become safer and more efficient. This is important for rooftop installations, where structural integrity and weight considerations are key factors. Lighter panels not only ease the strain on building frames but also make maintenance and handling easier. This can lead to improved system performance and longevity, reducing downtime and maintenance costs. The study suggests that the E-W orientation can offer higher annual energy production with fewer materials, potentially leading to long-term cost savings, despite the preference for South orientation in unitary energy production. The study’s detailed analysis and insights enhance understanding of PV system performance and emission profiles. This empowers stakeholders to make informed decisions about system design, installation, and operation. Overall, the conclusions drawn from the study contribute significantly to advancing sustainable PV systems by providing valuable insights into optimising performance, minimising environmental impact, enhancing structural integrity, and informing decision-making processes. These findings are essential for the ongoing development of more efficient and sustainable photovoltaic technologies.
Selecting the design configuration for a photovoltaic system causes both suitable evaluation tools and effective decision-making processes involving multiple stakeholders, practitioners, and decision-makers. The study examines two solar PV systems–one with south-oriented panels and the other with east-west-oriented ones–and their potential and environmental impact. The outcomes obtained address the predetermined questions, and these results unveil.
(i) E-W oriented allows having higher power production when sunrise and sunset. This point is important in off-grid installations (that can have power in a wide range of hours of the day).
(ii) With a configuration of 116 modules the E-W scenario has higher annual energy production (69.86 MWh/year) compared to the South scenario (69.04 MWh/year for 108 modules). However, considering the unitary energy production, the South orientation of the panels is preferred.
(iii) The E-W oriented PV system has lower emissions because of the Aluminium structure (5,100 and 9,000 kg CO2-eq) for E-W and South orientation respectively (Table 4). GHG emission rate is also smaller for E-W with 4.08% compared to South. The East-West orientation contributes to reduced carbon emissions, presenting a more environmentally friendly option.
(iv) The aluminium structures for hosting the modules for the E-W choice have a lower weight (606.5 kg) than the South scenario (1,063.2 kg) (Table 2).
(v) The ballast required by the installation is 1,294 kg and 6,920 kg for the E-W and S panels-oriented, respectively (Table 2).
As a result, E-W orientation’s key advantage is the reduced weight of the solar panels on the rooftop and a higher annual energy production. This improvement enhances the building’s structural integrity, leading to a safer and more efficient installation process and reducing the strain on the building’s frame. Additionally, lighter panels facilitate easier handling and maintenance, optimising overall system performance. Selecting the right design configuration is crucial for photovoltaic systems, as it impacts the potential, environment, and performance of various orientations.
Overall, the paper’s conclusions offer a valuable contribution to the understanding of PV performance and emission profiles. While the statement about south orientation is well-known, the paper’s detailed analysis and insights provide a deeper layer of understanding that can inform practical decision-making and contribute to the development of more sustainable PV systems.
Exploring several avenues can achieve further advancement in understanding and improving decision-making regarding the comparison of South-oriented PV modules to E-W-oriented PV modules. Some of the tasks involve optimising hybrid orientations (like tilted panels or variable tilt angles), integrating energy storage for maximum self-consumption and grid independence, prioritising technological innovation, and evaluating long-term performance and durability.
The original contributions presented in the study are included in the article/supplementary material, further inquiries can be directed to the corresponding author.
TR: Conceptualization, Data curation, Formal Analysis, Methodology, Software, Writing–review and editing. R-PM: Conceptualization, Data curation, Formal Analysis, Methodology, Software, Writing–review and editing. MP: Conceptualization, Formal Analysis, Methodology, Writing–original draft, Writing–review and editing.
The author(s) declare that financial support was received for the research, authorship, and/or publication of this article. This research was funded by the project “Hi-Edu Carbon” Erasmus Plus Programme, Key Action KA22021, action type 2021–1-SK01-KA220-HED-000023274.
The authors declare that the research was conducted in the absence of any commercial or financial relationships that could be construed as a potential conflict of interest.
All claims expressed in this article are solely those of the authors and do not necessarily represent those of their affiliated organizations, or those of the publisher, the editors and the reviewers. Any product that may be evaluated in this article, or claim that may be made by its manufacturer, is not guaranteed or endorsed by the publisher.
AP [kgSO2-eq], Acidification Potential; deg, yearly degradation rate; DSS, Decision support system; Eagen [kWh], mean annual electricity generation; Einst [MJ oil-eq], primary energy demand to install the system; EEOL [MJ oil-eq], primary energy demand for end-of-life management; Egen [kWh], total electricity power generated; Emat [MJ oil-eq], primary energy demand to produce materials comprising PV system; Emanuf [MJ oil-eq], primary energy demand to manufacture PV system; EO&M [MJ oil-eq], annual primary energy demand for operation and maintenance; ERLS [kWh], Energy produced during the service life of the PV panel; Etrans [MJ oil-eq], primary energy demand to transport materials used during the life cycle;
Alam, E., and Xu, X. (2023). Life cycle assessment of photovoltaic electricity production by mono-crystalline solar systems: a case study in Canada. Environ. Sci. Pollut. Res. 30, 27422–27440. doi:10.1007/s11356-022-24077-3
Ali, A., Koch, T. W., Volk, T. A., Malmsheimer, R. W., Eisenbies, M. H., Kloster, D., et al. (2022). The environmental life cycle assessment of electricity production in New York state from distributed solar photovoltaic systems. Energies (Basel) 15, 7278. doi:10.3390/en15197278
Al-Najideen, M. I., and Alrwashdeh, S. S. (2017). Design of a solar photovoltaic system to cover the electricity demand for the faculty of Engineering-Mu’tah University in Jordan. Resource-Efficient Technol. 3, 440–445. doi:10.18799/24056529/2017/4/164
Amelia, A. R., Irwan, Y. M., Leow, W. Z., Irwanto, M., Safwati, I., and Zhafarina, M. (2016). Investigation of the effect temperature on photovoltaic (PV) panel output performance. Int. J. Adv. Sci. Eng. Inf. Technol. 6, 682. doi:10.18517/ijaseit.6.5.938
Ansanelli, G., Fiorentino, G., Tammaro, M., and Zucaro, A. (2021). A life cycle assessment of a recovery process from end-of-life photovoltaic panels. Appl. Energy 290, 116727. doi:10.1016/j.apenergy.2021.116727
Asdrubali, F., Ballarini, I., Corrado, V., Evangelisti, L., Grazieschi, G., and Guattari, C. (2019). Energy and environmental payback times for an NZEB retrofit. Build. Environ. 147, 461–472. doi:10.1016/j.buildenv.2018.10.047
Balaji, J., Rao, P. N., and Rao, S. S. (2020). Solar tree with different installation positions of photovoltaic module-part 2. J. Green Eng. 10.
BaseK2-systems (2023). K2 systems, Base. Available at: https://base.k2-systems.com/#/dashboard.
Ben Amara, H., Bouadila, S., Fatnassi, H., Arici, M., and Allah Guizani, A. (2021). Climate assessment of greenhouse equipped with south-oriented PV roofs: an experimental and computational fluid dynamics study. Sustain. Energy Technol. Assessments 45, 101100. doi:10.1016/j.seta.2021.101100
Bhandari, K. P., Collier, J. M., Ellingson, R. J., and Apul, D. S. (2015). Energy payback time (EPBT) and energy return on energy invested (EROI) of solar photovoltaic systems: a systematic review and meta-analysis. Renew. Sustain. Energy Rev. 47, 133–141. doi:10.1016/j.rser.2015.02.057
Bracquene, E., Peeters, J. R., Dewulf, W., and Duflou, J. R. (2018). “Taking evolution into account in a parametric LCA model for PV panels,” in Procedia CIRP. doi:10.1016/j.procir.2017.11.103
Cen, E. N. (2019) 15804: 2012+ A2: 2019 sustainability of construction works—environmental product declarations—core rules for the product category of construction products. Brussels, Belgium: European Committee for Standardization CEN.
Chandel, S. S., and Agarwal, T. (2017). Review of cooling techniques using phase change materials for enhancing efficiency of photovoltaic power systems. Renew. Sustain. Energy Rev. 73, 1342–1351. doi:10.1016/j.rser.2017.02.001
Cristea, C., Cristea, M., Birou, I., and Tîrnovan, R. A. (2020). Economic assessment of grid-connected residential solar photovoltaic systems introduced under Romania’s new regulation. Renew. Energy 162, 13–29. doi:10.1016/j.renene.2020.07.130
Cristea, C., Cristea, M., Micu, D. D., Ceclan, A., Tîrnovan, R. A., and Șerban, F. M. (2022). Tridimensional sustainability and feasibility assessment of grid-connected solar photovoltaic systems applied for the technical university of cluj-napoca. Sustain. Switz. 14, 10892. doi:10.3390/su141710892
Cusenza, M. A., Guarino, F., Longo, S., Mistretta, M., and Cellura, M. (2019). Reuse of electric vehicle batteries in buildings: an integrated load match analysis and life cycle assessment approach. Energy Build. 186, 339–354. doi:10.1016/j.enbuild.2019.01.032
De La Peña, L., Guo, R., Cao, X., Ni, X., and Zhang, W. (2022). Accelerating the energy transition to achieve carbon neutrality. Resour. Conserv. Recycl 177, 105957. doi:10.1016/j.resconrec.2021.105957
DNV (2021) External pavement sustainability study. Würzburg. Available at: https://www.natursteinverband.de/fileadmin/user_upload/Nachhaltigkeitsstudie/Bodenbel%C3%A4ge/Studie-Englisch-Nachhaltigkeit-Boden-web.pdf (Accessed October 11, 2023).
Ebhota, W. S., and Tabakov, P. Y. (2022). Impact of photovoltaic panel orientation and elevation operating temperature on solar photovoltaic system performance. Int. J. Renew. Energy Dev. 11, 591–599. doi:10.14710/ijred.2022.43676
Electricity maps (2023) Electricity maps. Romania. Available at: https://app.electricitymaps.com/zone/RO.
European Committee for Standardization (2011) UNE-EN 15978:2011 Sustainability of construction works - assessment of environmental performance of buildings - calculation method.
Fanney, A. H., Weise, E. R., and Henderson, K. R. (2003). Measured impact of a rooftop photovoltaic system. J. Sol. Energy Eng. 125, 245–250. doi:10.1115/1.1591799
Fernandez-Antolin, M. M., del Río, J. M., and González-Lezcano, R. A. (2022). Building performance simulations and architects against climate change and energy resource scarcity. Earth Switz. 3, 31–44. doi:10.3390/earth3010003
Frischknecht, R. (2020). Methodology guidelines on life cycle assessment of photovoltaic task 12 PV sustainability. Available at: www.iea-pvps.org.
Fthenakis, V., and Alsema, E. (2006). Photovoltaics energy payback times, greenhouse gas emissions and external costs: 2004-early 2005 status. Prog. Photovoltaics Res. Appl. 14, 275–280. doi:10.1002/pip.706
Gaiddon, B., and Jedliczka, M. (2006) Compared assessment of selected environmental indicators of photovoltaic electricity in OECD cities COMPARED ASSESSMENT OF SELECTED ENVIRONMENTAL INDICATORS OF PHOTOVOLTAIC ELECTRICITY IN OECD CITIES.
Ganesan, K., and Valderrama, C. (2022). Anticipatory life cycle analysis framework for sustainable management of end-of-life crystalline silicon photovoltaic panels. Energy 245, 123207. doi:10.1016/j.energy.2022.123207
Gautam, A., Shankar, R., and Vrat, P. (2021). End-of-life solar photovoltaic e-waste assessment in India: a step towards a circular economy. Sustain Prod. Consum. 26, 65–77. doi:10.1016/j.spc.2020.09.011
Gerbinet, S., Belboom, S., and Léonard, A. (2014). Life Cycle Analysis (LCA) of photovoltaic panels: a review. Renew. Sustain. Energy Rev. 38, 747–753. doi:10.1016/j.rser.2014.07.043
Gervasio, H., and Dimova, S. (2018) Model for life cycle assessment (LCA) of buildings. Brussels: Publications Office of the European Union.
Hsu, D. D., O’Donoughue, P., Fthenakis, V., Heath, G. A., Kim, H. C., Sawyer, P., et al. (2012). Life cycle greenhouse gas emissions of crystalline silicon photovoltaic electricity generation: systematic review and harmonization. J. Ind. Ecol. 16. doi:10.1111/j.1530-9290.2011.00439.x
Jones, C., and Gilbert, P. (2018). Determining the consequential life cycle greenhouse gas emissions of increased rooftop photovoltaic deployment. J. Clean. Prod. 184, 211–219. doi:10.1016/j.jclepro.2018.02.140
Kim, D., Cho, H., Koh, J., and Im, P. (2020). Net-zero energy building design and life-cycle cost analysis with air-source variable refrigerant flow and distributed photovoltaic systems. Renew. Sustain. Energy Rev. 118, 109508. doi:10.1016/j.rser.2019.109508
Kim, H. C., Fthenakis, V., Choi, J. K., and Turney, D. E. (2012). Life cycle greenhouse gas emissions of thin-film photovoltaic electricity generation: systematic review and harmonization. J. Ind. Ecol. 16. doi:10.1111/j.1530-9290.2011.00423.x
Koester, L., Lindig, S., Louwen, A., Astigarraga, A., Manzolini, G., and Moser, D. (2022). Review of photovoltaic module degradation, field inspection techniques and techno-economic assessment. Renew. Sustain. Energy Rev. 165, 112616. doi:10.1016/j.rser.2022.112616
Latunussa, C. E. L., Ardente, F., Blengini, G. A., and Mancini, L. (2016). Life Cycle Assessment of an innovative recycling process for crystalline silicon photovoltaic panels. Sol. Energy Mater. Sol. Cells 156, 101–111. doi:10.1016/j.solmat.2016.03.020
Lee, J., Chang, B., Aktas, C., and Gorthala, R. (2016). Economic feasibility of campus-wide photovoltaic systems in New England. Renew. Energy 99, 452–464. doi:10.1016/j.renene.2016.07.009
Luo, Y., Cui, D., Cheng, N., Zhang, S., Su, X., Chen, X., et al. (2022). A novel active building envelope with reversed heat flow control through coupled solar photovoltaic-thermoelectric-battery systems. Build. Environ. 222, 109401. doi:10.1016/j.buildenv.2022.109401
Lv, S., Ren, J., Zhang, Q., Zhang, B., Lai, Y., Yang, J., et al. (2023). Design, fabrication and performance analysis of a cost-effective photovoltaic interface seawater desalination hybrid system for co-production of electricity and potable water. Appl. Energy 336, 120811. doi:10.1016/j.apenergy.2023.120811
Mahmoudi, S., Huda, N., and Behnia, M. (2020). Environmental impacts and economic feasibility of end of life photovoltaic panels in Australia: a comprehensive assessment. J. Clean. Prod. 260, 120996. doi:10.1016/j.jclepro.2020.120996
Mahmud, M. A. P., Huda, N., Farjana, S. H., and Lang, C. (2018). Environmental impacts of solar-photovoltaic and solar-thermal systems with life-cycle assessment. Energies (Basel) 11, 2346. doi:10.3390/en11092346
Mc 001-2022 (2023). CALCULATION METHODOLOGY OF ENERGY PERFORMANCE OF BUILDINGS, CODE Mc 001-2022. Available at: https://aaecr.ro/wp-content/uploads/2023/01/Mc-001-2022-Metodologie-calcul-performanta-energetica-cladiri.pdf (Accessed September 14, 2023).
Meng, B., Loonen, R. C. G. M., and Hensen, J. L. M. (2020). Data-driven inference of unknown tilt and azimuth of distributed PV systems. Sol. Energy 211, 418–432. doi:10.1016/j.solener.2020.09.077
Mermoud, A. (2012). “Optimization of row-arrangement in PV Systems, shading loss evaluations according to module positioning and connexions,” in 27th European Photovoltaic Solar Energy Conference, Frankfurt, Germany, 24-28 September 2012.
Müller, A., Friedrich, L., Reichel, C., Herceg, S., Mittag, M., and Neuhaus, D. H. (2021). A comparative life cycle assessment of silicon PV modules: impact of module design, manufacturing location and inventory. Sol. Energy Mater. Sol. Cells 230, 111277. doi:10.1016/j.solmat.2021.111277
Nicholson, S., and Heath, G. (2012a). Life cycle greenhouse gas emissions from electricity generation: update life cycle assessment of energy systems. Available at: https://data.nrel.gov/submissions/171.
Nicholson, S., and Heath, G. (2012b). Life cycle greenhouse gas emissions from electricity generation: update life cycle assessment of energy systems. Available at: https://data.nrel.gov/submissions/171.
Nordin, A. H. M., Sulaiman, S. I., and Shaari, S. (2022). Life cycle impact of photovoltaic module degradation on energy and environmental metrics. Energy Rep. 8, 923–931. doi:10.1016/j.egyr.2022.05.257
Paiano, A., Lagioia, G., and Ingrao, C. (2023). A combined assessment of the energy, economic and environmental performance of a photovoltaic system in the Italian context. Sci. Total Environ. 866, 161329. doi:10.1016/j.scitotenv.2022.161329
Palanov, N. (2014) Life-cycle assessment of Photovoltaic systems: analysis of environmental impact from the production of PV system including solar panels produced by Gaia Solar. TVBH-5074.
Pardo, M. A., Navarro-González, F. J., and Villacampa, Y. (2022). An algorithm to schedule water delivery in pressurized irrigation networks. Comput. Electron Agric. 201, 107290. doi:10.1016/j.compag.2022.107290
Peng, J., and Lu, L. (2013). Investigation on the development potential of rooftop PV system in Hong Kong and its environmental benefits. Renew. Sustain. Energy Rev. 27, 149–162. doi:10.1016/j.rser.2013.06.030
Peng, J., Lu, L., and Yang, H. (2013). Review on life cycle assessment of energy payback and greenhouse gas emission of solar photovoltaic systems. Renew. Sustain. Energy Rev. 19, 255–274. doi:10.1016/j.rser.2012.11.035
Rahman, M. M., Alam, C. S., and Ahsan, T. M. A. (2019). A life cycle assessment model for quantification of environmental footprints of a 3.6 kWp photovoltaic system in Bangladesh. Int. J. Renew. Energy Dev. 8, 113–118. doi:10.14710/ijred.8.2.113-118
Renewable Market Watch (2023) Romania solar photovoltaic (PV) power market outlook 2023÷2032. Renewable market WatchTM. Available at: https://renewablemarketwatch.com/news-analysis/488-romania-solarphotovoltaic-pv-power-market-outlook-2023-2032-with-trends-investments-financial-model-analysis-forecast (Accessed September 14, 2023).
Salibi, M., Makolli, Q., and Almajali, S. (2021). “ENERGY PAYBACK TIME OF PHOTOVOLTAIC ELECTRICITY GENERATED BY PASSIVATED EMITTER AND REAR CELL (PERC) SOLAR MODULES: A NOVEL METHODOLOGY PROPOSAL,” in EU pvsec 2021, 677–683. doi:10.4229/EUPVSEC20212021-4CO.4.5
Schlömer, S., Bruckner, T., Fulton, L., Hertwich Austria, E., McKinnon, A. U., Perczyk, D., et al. (2014). III ANNEX technology-specific cost and performance parameters editor: lead authors: contributing authors: to the fifth assessment report of the intergovernmental panel on climate change edenhofer technology-specific cost and performance parameters annex III AIII contents. Available at: https://www.ipcc.ch/site/assets/uploads/2018/02/ipcc_wg3_ar5_annex-iii.pdf (Accessed June 26, 2023).
Seo, B., Kim, J. Y., and Chung, J. (2021). Overview of global status and challenges for end-of-life crystalline silicon photovoltaic panels: a focus on environmental impacts. Waste Manag. 128, 45–54. doi:10.1016/j.wasman.2021.04.045
Spasić, V. (2021). Romania to triple its solar capacity to 4.25 GW by 2030 (Romania: Vladimir Spasić), 1.
SR EN 1991-1-3/NA (1991). EN 1991-1-3: eurocode 1: actions on structures - Part 1-3: general actions - snow loads. Available at: https://www.phd.eng.br/wp-content/uploads/2015/12/en.1991.1.3.2003.pdf (Accessed September 14, 2023).
SR EN 1991-1-4/NB (2006) EN 1991-1-4: eurocode 1: actions on structures - Part 1-4: general actions - wind actions.
Stochitoiu, M. D., and Utu, I. (2018). “Romania’s electricity mix-one of the most balanced,” in The European union.
Tawalbeh, M., Al-Othman, A., Kafiah, F., Abdelsalam, E., Almomani, F., and Alkasrawi, M. (2021). Environmental impacts of solar photovoltaic systems: a critical review of recent progress and future outlook. Sci. Total Environ. 759, 143528. doi:10.1016/j.scitotenv.2020.143528
Thiel, C. L., Campion, N., Landis, A. E., Jones, A. K., Schaefer, L. A., and Bilec, M. M. (2013). A materials life cycle assessment of a net-zero energy building. Energies (Basel) 6, 1125–1141. doi:10.3390/en6021125
Tillmann, P., Jäger, K., and Becker, C. (2019). Minimising the levelised cost of electricity for bifacial solar panel arrays using Bayesian optimisation. Sustain Energy Fuels 4, 254–264. doi:10.1039/c9se00750d
Tumminia, G., Guarino, F., Longo, S., Aloisio, D., Cellura, S., Sergi, F., et al. (2020). Grid interaction and environmental impact of a net zero energy building. Energy Convers. Manag. 203, 112228. doi:10.1016/j.enconman.2019.112228
Turconi, R., Boldrin, A., and Astrup, T. (2013). Life cycle assessment (LCA) of electricity generation technologies: overview, comparability and limitations. Renew. Sustain. Energy Rev. 28, 555–565. doi:10.1016/j.rser.2013.08.013
Varo-martínez, M., Fernández-ahumada, L. M., López-luque, R., and Ramírez-faz, J. (2021). Simulation of self-consumption photovoltaic installations: profitability thresholds. Appl. Sci. Switz. 11, 6517. doi:10.3390/app11146517
Villoz, A., Wittmer, B., Mermoud, A., Oliosi, M., Bridel-Bertomeu, A., and Pvsyst, S. A. (2022). “A model correcting the effect of sub-hourly irradiance fluctuations on overload clipping losses in hourly simulations,” in 8th World Conference on Photovoltaic Energy Conversion.
Zabalza Bribián, I., Aranda Usón, A., and Scarpellini, S. (2009). Life cycle assessment in buildings: state-of-the-art and simplified LCA methodology as a complement for building certification. Build. Environ. 44, 2510–2520. doi:10.1016/j.buildenv.2009.05.001
Zhang, H., Yu, Z., Zhu, C., Yang, R., Yan, B., and Jiang, G. (2023). Green or not? Environmental challenges from photovoltaic technology. Environ. Pollut. 320, 121066. doi:10.1016/j.envpol.2023.121066
Keywords: solar photovoltaic modules, life cycle assessment, energy production, structure, ballast, emissions
Citation: Rus T, Moldovan R-P and Pardo Picazo MÁ (2024) LCA analysis of a roof mounted PV system: a Romanian case study. Front. Environ. Sci. 12:1413629. doi: 10.3389/fenvs.2024.1413629
Received: 07 April 2024; Accepted: 14 May 2024;
Published: 03 June 2024.
Edited by:
Silvia Fiore, Polytechnic University of Turin, ItalyReviewed by:
Roberto Alonso González-Lezcano, CEU San Pablo University, SpainCopyright © 2024 Rus, Moldovan and Pardo Picazo. This is an open-access article distributed under the terms of the Creative Commons Attribution License (CC BY). The use, distribution or reproduction in other forums is permitted, provided the original author(s) and the copyright owner(s) are credited and that the original publication in this journal is cited, in accordance with accepted academic practice. No use, distribution or reproduction is permitted which does not comply with these terms.
*Correspondence: Raluca-Paula Moldovan, cmFsdWNhLm1vbGRvdmFuQGluc3RhLnV0Y2x1ai5ybw==
Disclaimer: All claims expressed in this article are solely those of the authors and do not necessarily represent those of their affiliated organizations, or those of the publisher, the editors and the reviewers. Any product that may be evaluated in this article or claim that may be made by its manufacturer is not guaranteed or endorsed by the publisher.
Research integrity at Frontiers
Learn more about the work of our research integrity team to safeguard the quality of each article we publish.