 Svetlana Illarionova1,2*
 Polina Tregubova1
 Islomjon Shukhratov1Dmitrii Shadrin1,3Alexander Kedrov4
 Evgeny Burnaev1,5
- 1Skolkovo Institute of Science and Technology, Moscow, Russia
- 2Biomedically Informed Artificial Intelligence Laboratory (BIMAI-Lab), University of Sharjah, Sharjah, United Arab Emirates
- 3Institute of Information Technology and Data Science, Irkutsk National Research Technical University, Irkutsk, Russia
- 4Space Technologies and Services Center, Ltd., Perm, Russia
- 5Autonomous Non-Profit Organization Artificial Intelligence Research Institute (AIRI), Moscow, Russia
In the context of global climate change and rising anthropogenic loads, outbreaks of both endemic and invasive pests, pathogens, and diseases pose an increasing threat to the health, resilience, and productivity of natural forests and forest plantations worldwide. The effective management of such threats depends on the opportunity for early-stage action helping to limit the damage expand, which is difficult to implement for large territories. Recognition technologies based on the analysis of Earth observation data are the basis for effective tools for monitoring the spread of degradation processes, supporting pest population control, forest management, and conservation strategies in general. In this study, we present a machine learning-based approach for recognizing damaged forests using open source remote sensing images of Sentinel-2 supported with Google Earth data on the example of bark beetle, Polygraphus proximus Blandford, polygraph. For the algorithm development, we first investigated and annotated images in channels corresponding to natural color perception—red, green, and blue—available at Google Earth. Deep neural networks were applied in two problem formulations: semantic segmentation and detection. As a result of conducted experiments, we developed a model that is effective for a quantitative assessment of the changes in target objects with high accuracy, achieving 84.56% of F1-score, determining the number of damaged trees and estimating the areas occupied by withered stands. The obtained damage masks were further integrated with medium-resolution Sentinel-2 images and achieved 81.26% of accuracy, which opened the opportunity for operational monitoring systems to recognize damaged forests in the region, making the solution both rapid and cost-effective. Additionally, a unique annotated dataset has been collected to recognize forest areas damaged by the polygraph in the region of study.
1 Introduction
Forest ecosystems play a crucial role in biosphere processes, performing a range of key ecosystem functions and services, including supporting biodiversity, regulating the climate, regulating water and air quality, and providing timber, fiber, fuel, and food (Saarikoski et al., 2015; De Frenne et al., 2021). Although deforestation within recent years has slowed down, it still continues, while anthropogenically induced damages significantly intensifying degradation processes in adjacent ecosystems and leading to overall biodiversity loss, posing a threat to the stability of economic processes (FAO and UNEP, 2020).
Having 10%–15% of terrestrial land area, boreal forests contribute significantly to global carbon sequestration, being one of the largest carbon pools (Noce et al., 2019; Schepaschenko et al., 2021; Peichl et al., 2023). Besides forest resources utilization for economic purposes, several primary causes of forest degradation and deforestation are identified, including fires and other extreme weather events, infestations of pests, diseases, the spread of invasive species, and the impact of anthropogenic pollution (Leskinen et al., 2020; Högberg et al., 2021). In the context of global climate change, precisely due to increases in average global temperatures and corresponding shifts in temperature optimums and, consequently, in niches, the outbreaks of endemic and invasive insect pests and other pathogens pose an increasing threat to the health, resilience, and productivity of natural forests and forest plantations worldwide. It is estimated that insect outbreaks damage around 35 million hectares of forests annually (FAO, 2010), while together with diseases and severe weather events, it caused tree loss in the areas of about 40 million ha of forests in 2015 (FAO and UNEP, 2020). Climate change’s impact on forest ecosystems is expected to be most significant in northern latitudes (Boulanger et al., 2016; Reich et al., 2022), where significant forest losses are already documented due to destructive wildfires (Whitman et al., 2019) and pest infestations (Sánchez-Pinillos et al., 2019). Without optimized management based on monitoring and precautionary actions, this problem is likely to worsen.
Insect pest damage to forests results in a range of negative consequences. First of all, it worsens the ecological condition at both the local and landscape levels by reducing forest productivity in affected areas, altering the composition and structure of the tree canopy, and decreasing overall biodiversity through the destruction of natural habitats. Areas with affected trees become loci for further pest spread and pose increased fire risks (Canelles et al., 2021). Additionally, there are losses in raw materials, primarily timber, which can be especially critical for regions where timber harvesting constitutes a significant portion of the budget (Hlásny et al., 2021; Panzavolta et al., 2021). Depending on the characteristics of the insect pests, both weakened trees and productive stands, as well as saplings, can be subject to damage (Ferrenberg, 2016).
It is noted that operational monitoring and predictive assessments are effective tools for forming management strategies aimed at maintaining forest ecosystem productivity and reducing timber losses, with a specific focus on forest pathology issues (fao, 2020). Solutions based on remote sensing (RS) data are required to monitor large forested areas, reduce the costs of ground surveys, and overcome limitations related to accessibility and processing vast amounts of information. Machine learning methods, particularly computer vision, have already proven effective for assessing forest stand conditions (Duarte et al., 2022; Illarionova et al., 2022; She et al., 2022). By leveraging spectral characteristic distribution data and machine learning and deep learning algorithms, information about the state of target objects can be obtained, with accuracy and quality often surpassing visual inspection results (Gao et al., 2023). Solution for detection of bark beetle infestation using medium resolution satellite images has been provided by Bárta et al. (202). They used Random forest algorithm to delineate damaged areas. Another classical machine learning approach was discussed by Zhan et al. (2020). Zhan et al. (2020) proposed an approach based on UNet++ architecture to detect pest-infested forest damage in medium-resolution multispectral images (Zhang et al., 2022). Usage of machine learning algorithms in combination with various vegetation indices for forest health monitoring were also discussed in a number of studies (Bhattarai et al., 2020). High-resolution satellite data provide more detailed maps of damaged forests, although they are often more expensive (Yu et al., 2020; Liu et al., 2021).
A key limitation of modern RS-based approaches in the context of forest ecosystem degradation capturing and assessment is the constrained ability to differentiate the causes of disturbances and the requirement of proper introduction of additional resources of local assessments, including high-resolution data (Gao et al., 2020). Moreover, early infestation signals could likely be observed only from the ground investigations, e.g., stem disturbances and other manifestations such as streaks. Other consequences making the outbreak detectable from remote sensing, therefore relevant for spatial assessments, accompany next stages of the damage on the likely irreversible way to the death of tree, such as leaves discoloration, defoliation, or dieback (Luo et al., 2023). However, there is still a difference when the separated trees are affected this heavily or larger stands, if the scale and duration of the outbreak become too large leading to the ecosystem sustainability threshold break (Marini et al., 2022). Thus, local assessment can be crucial for early-stage damage detection helping to localise the spread of pests and pathogens. With that, the scale of analysis challenge occurs. An open-source medium-resolution data helps with large-area processing, however, constrained by the aggregation of both diseased trees with occurrences of healthy trees due to pixel size larger than separate trees. To address it, fusion of high and medium resolution data in a single pipeline is required. Additionally, spread of pathogens is commonly species dependent, resulted in diversified spectral signals confusing for imagery processing without ground-truth supported annotation. Open and available datasets for various regions and agents are currently limited. Thus, collection and annotation of ground-truth data, preserving information about specific agents contributing to forest deterioration in each case are of high importance for development of automatised monitoring tools. Solving all these tasks is essential for transitioning to sustainable forest management, ensuring multifunctional forest use, conservation, protection, and forest regeneration.
Thus, the aim of this study was to develop a machine learning (ML) model for recognizing damaged forests resulting from pest infestations, using the example of the bark beetle, Polygraphus proximus, polygraph. To achieve this, data collection and annotation were conducted in the region of pest infestation. The annotated data is publicly available for the research community to facilitate further studies on forest health assessment. YOLOv8 and HRNet algorithms were trained for the detection and semantic segmentation tasks of recognizing withered trees on high-resolution satellite images. We explored the applicability of Sentinel-2 data for detecting disease in forest areas where only several trees within the stand are affected.
Developed model approaches enable the automatic identification of forest areas damaged by the polygraph, followed by the mapping of affected territories using open-source high- and medium-resolution RS data. Both the approach and results make significant contributions to the development of semi-automated pipelines for ecological assessment of the territories affected by pest outbreaks and pathogens and can be further utilized to monitor and analyze the pest’s spread dynamics, to construct predictive models of their distribution, and to plan the optimized management actions limiting the influence of the forest damage actors.
2 Materials and methods
2.1 Research area
2.1.1 Territory description
The development and testing of the algorithm were conducted in the Perm Region territory (Russia). The total research area covered 7,810 ha (Figure 1).
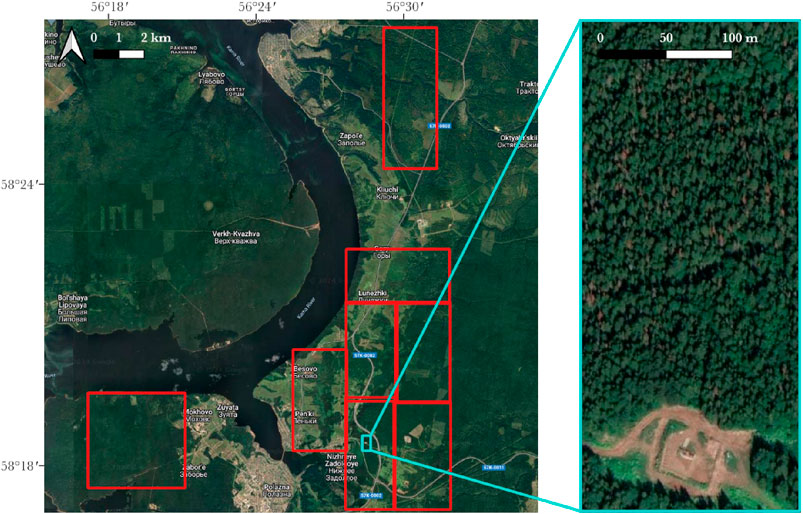
Figure 1. Research area description. Red polygons correspond to areas processed for algorithms training and testing. On the enlarged image on the right, an example of forest damage caused by a pest is presented—the damaged trees are clearly distinguishable against the green background. The images are provided based on a Google satellite base map layer, imagery credit: Google maps, ⓒ2024 CNES/Airbus, Maxar Technologies, Map data ⓒ2024.
The Perm region is situated on the eastern edge of the Russian Plain and in the western part of the Ural Mountains. The total area of forest-covered managed territories is no less than 9 million hectares, with forest ecosystems consisting of fir-spruce, deciduous, and pine species. The area under study represents a gently rolling plain with elevations ranging from 200 to 400 m above sea level and falls within the zone of coniferous and broad-leaved forests, with Finnish spruce (Picea fennica (Regel) Kom.) being the predominant tree species (Zhulanov et al., 2023). Siberian fir (Abies sibirica Ledeb.) is widely distributed in the forests of the Pre-Kama basin and is a constant companion of spruce. This species is almost always present in the composition of mixed dark coniferous plantations found in the research area. The average proportion of Siberian fir in such plantations ranges from 10% to 30% of the total stock. Moreover, the predominance of Siberian fir in the species composition is mainly characteristic of mature plantations, where, due to natural dynamics and the absence of anthropogenic impact, its share naturally increases.
2.1.2 Polygraphus proximus spread
The forests of the territory of study, Perm region, are currently experiencing the spread of the invasive P. proximus, polygraph. The natural habitat of this bark beetle spans across the Russian Far East, Japan, Korea, and Northeast China, while it has become invasive in West Siberia, with ongoing westward expansion (Bykov et al., 2020; Dedyukhin and Titova, 2021). As invasion, currently infestations of polygraph are observed in both commercial forests and also in forests that serve protective functions and forests of specially protected natural areas, such as green zones around settlements, spawning protection zones, and water protection forests. The polygraph inhabits not only pure fir stands but also dark coniferous forests with a small admixture of fir, affecting flat and mountainous territories.
Significantly, in case of outbreaks, the polygraph affects not only stands that have lost resistance to stem pests, such as older trees and trees weakened by diseases and adverse climate conditions but also outwardly healthy trees. It is noted that the pest can also infest medium and large fir saplings with diameters as small as 6 cm. Signs of tree infestation by the polygraph starts from the resin streaks and develops to the change in the color of needles to red from the bottom of the crown to the whole crown to the turning to the dead wood. Period of tree resistance to the polygraph mass attacks on the stage of resin streaks can reach 2–3 years. After reaching a critical population level in a specific stand, mass tree withering begins approximately 3–5 years later, ultimately leading to the complete breakdown of the forest stand (Krivets et al., 2015; Dedyukhin and Titova, 2021).
2.2 Data
2.2.1 Reference data
A research area near Perm city with a total area of 7,810 ha was selected for the study, where the spread of the polygraph was observed. The infestation by polygraph began approximately in the years 2019–2020, according to the visual ground forest pathology investigations. In 2021, corresponding stands withering was detected in the area of study. Figure 2A shows a forested area with individual damaged trees, which can be identified on high-resolution satellite images of recent years on the stage of crown color change.
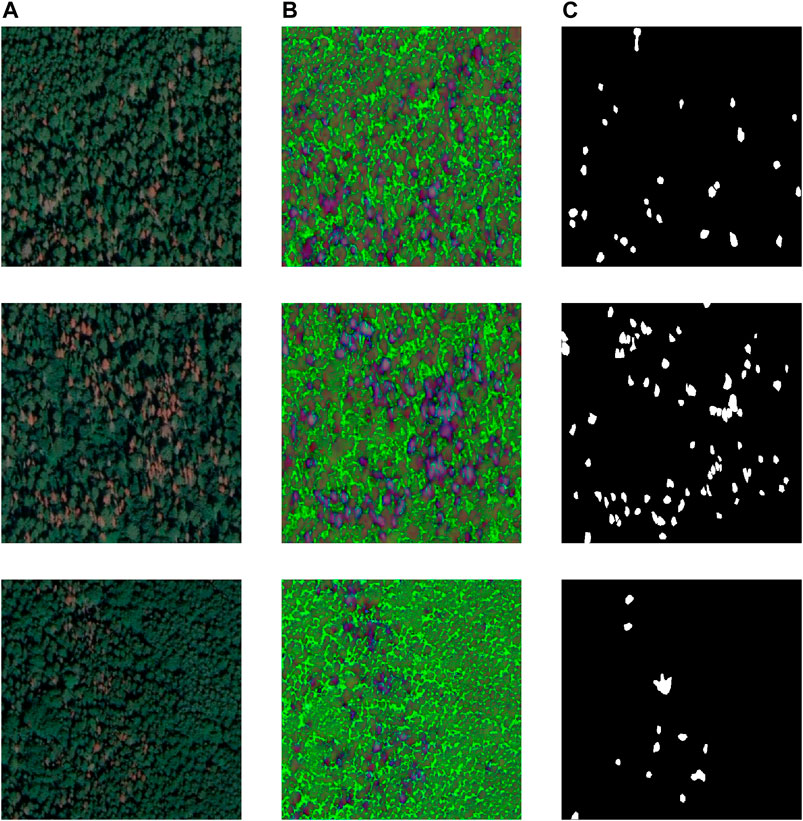
Figure 2. Examples of Dataset: (A) satellite RGB image, (B) HSV image and (C) a binary segmentation mask. RGB images are provided based on a Google satellite base map layer, imagery credit: Google maps, ⓒ2024 CNES/Airbus, Maxar Technologies, Map data ⓒ2024.
To provide the research, available high-resolution imagery based on Google Earth and medium-resolution imagery from Sentinel-2 were used.
First, the annotation data were collected based on orange and red-color crown search in the area of the outbreak during July. To do this, Google Earth service was used, allowing users to inspect large territories with help of the high-resolution imagery. Spatial resolution up to 0.5 m per pixel is suitable for the visual identification of individual damaged trees reducing the expenses on ground surveys which are still impossible with the same level of detailing for extensive areas. At the same time, Google Earth mosaics are updated at least every two to 3 years, with some areas having access to current-year images, and area under the user observation contains information about the date the image was taken (Google, 2024). Thus, an assessment of the vegetation cover’s condition was made based on the identification of damaged trees distinguishable by the color (Figures 1, 2A) for the 23 July 2022. Then, for the same imagery date sites, images were retrieved at the resolution of 0.5 m through the open-source geospatial platform QGIS (QGIS Development Team, 2024) following the approach presented earlier (Li et al., 2022). A total of eight GeoTIFF tiles were acquired, effectively covering the targeted region of interest.
The Computer Vision Annotation tool, CVAT (Intel, 2024), was used for manual annotation preparation. For the convenience of data annotation and subsequent neural network algorithm training, the satellite images were divided into patches of 512 by 512 pixels. The annotation included two classes: damaged forest (label 1) and undamaged forest areas (label 0). Examples of RGB composites and reference annotations are shown in Figure 2A, C.
The total annotated area covered 2,837 ha. Dataset statistics are presented in Table 1. A total of 433 annotated patches were prepared, which were then split into training and testing datasets.
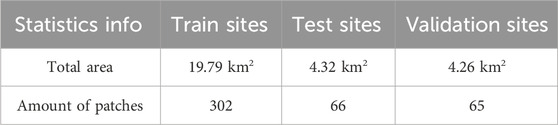
Table 1. Annotation dataset statistics.
2.2.2 Medium-resolution data
As additional satellite data, we considered images from the Sentinel-2 mission. The openly distributed images are available from the SentinelHub service (Sentinelhub, 2024). One of the main advantages of this data source in the context of the considered forest degradation task is the availability of historical data. This will further allow one to analyze disease spread over several years. Sentinel-2 data contains 13 spectral bands with spatial resolutions ranging from 10 m, 20 m, and 60 m per pixel. The central wavelength varies from 443 nm (Ultra Blue) to 2,190 nm (Short Wave Infrared). The level of image preprocessing is a Level-2A product that includes atmospheric correction of Surface Reflectance images. For further investigation, we excluded the spectral band associated with Coastal and Aerosol measurements (B1 band) with a 60 m spatial resolution, as well as two Short Wave Infrared bands with 60 m spatial resolution (B9 and B10 bands). All other bands are resampled to a 10 m spatial resolution. We collected cloud-free Sentinel-2 images for the summer period of 2022 years to match the observation year of the imagery from Google Maps. The dates of observations are 4, 14, 29 June, 7 July, 23, 28 August. For each observation date, a single image is acquired. Each image has 10 spectral bands and additionally 3 vegetation indices were computed.
2.2.3 Remote sensing data processing
2.2.3.1 High-resolution data processing
In addition to the RGB color data, the HSV (Hue, Saturation, Value) color model was also considered (Figure 2B). Transitioning to the HSV color model allows for the assessment of the color value of an individual pixel on a specified scale. Damaged forest areas exhibit a distinct orange color and can be visually separated from the healthy forest cover based on this color feature. In the RGB image representation, the color orange corresponds to specific values across three channels. In the HSV representation, the color component is represented by a single channel named Value, and changes in lighting (the use of satellite images from different dates) do not have a significant impact on the Value component as it does in the case of the RGB color representation. Therefore, the transition to this color model holds potential interest for the task of recognizing damaged forest areas.
Before feeding the image into the neural network model, the image for both color representation models was normalized and scaled to a range of values from 0 to 1, which ensures better algorithm convergence.
2.2.3.2 Medium-resolution data processing
Although RGB high-resolution satellite data provide precise information on surface structure, multispectral medium-resolution data provide valuable spectral features. These satellite bands can be used independently as input features for ML algorithms or can be combined to create new advanced features. Vegetation Indices (VIs) are commonly used in remote sensing data related tasks because they combine various spectral bands into a single value in order to better capture particular vegetation highlights and properties depending on the use case (Xue and Su, 2017). There are many existing VIs, and in this research only three of them that are popular in academia (Zhao et al., 2020; Poblete et al., 2023) are examined. The Normalized Difference Vegetation Index (NDVI) is the highly accurate measurement of health and density of vegetation surface using NIR and red bands of the spectrometric data. It ranges from −1 to 1. In general, NDVI values vary among different land cover types and can differ significantly based on vegetation types and environmental conditions. Healthy vegetation typically exhibits a positive NDVI value higher than non-vegetated areas and water surfaces (Han and Niu, 2020; Xue et al., 2021). Green Normalized Difference Vegetation Index (GNDVI) is similar to NDVI, but instead of a red band, it uses green band, which focuses on the green part of the spectrum, making it more sensitive to the presence of green vegetation. GNDVI ranges from −1 to 1 (Taddeo et al., 2019). Enhanced Vegetation Index (EVI) is another vegetation index used to assess vegetation health and monitor environmental changes. It was designed to improve upon some limitations of the NDVI, such as its sensitivity to atmospheric conditions, soil backgrounds, and saturation effect in regions with dense vegetation. EVI values range from −1 to 1 (Taddeo et al., 2019). Higher EVI values generally indicate healthier and more densely vegetated areas, while lower EVI values can be associated with less vegetation or stressed vegetation due to factors like drought or disease, as well as other land cover types. The calculation for VIs is given in Formulas 1, 2, 3.
2.3 Recognition methods
2.3.1 Approach
Two problem formulations for recognizing damaged trees were considered: the detection and the semantic segmentation. To solve the detection task, an enclosing bounding box was constructed around each individual damaged tree or forest area, with only one class of objects being identified. Metrics were then calculated based on the localized objects. This problem formulation primarily focuses on determining the object’s position in the image and can also be used for counting and quantitatively assessing damaged areas.
On the other hand, masks of damaged forest areas were used to solve the semantic segmentation task. The model was trained to identify withered trees pixel-wise, which allows for a more accurate assessment of the damaged forest area’s size. Subsequently, a comparison and analysis of the obtained detection and segmentation results were conducted to choose the most suitable strategy for recognizing damaged trees.
The overall pipeline for recognizing damaged forest areas in high-resolution satellite images is shown in Figure 3.
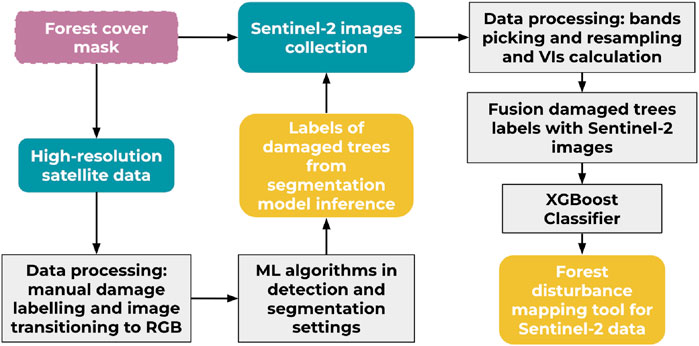
Figure 3. The scheme of proposed approach for capturing damaged forest areas using multisource remote sensing images.
To create an up-to-date forest mask, we used the output results of earlier developed algorithms (Mirpulatov et al., 2023). Briefly, it provides a land cover mask based on Sentinel-2 satellite imagery with a spatial resolution of 10 m per pixel. The F1-score for the forest mask is 0.88. The forest mask was created for the same dates of the observations. The “forest” class was extracted from the mask, and then, through the image resize operation, the binary mask was brought to the same image size as a high-resolution satellite image covering the same territory. Our objective was not to enhance the resolution of the 10 m forest cover map, but rather to upscale the binary map to align with high-resolution satellite imagery. Predictions of the models for damaged tree recognition were overlapped with the forest mask to avoid false positives outside forested areas. This step also significantly reduced the training dataset and, at the same time, avoided a strong imbalance between the target class (diseased trees) and other types of surfaces in satellite images. While the usage of Snetinel-2 based forest map can be not suitable for identifying small clearings within the forest, it is effective for excluding large areas occupied by settlements or agricultural fields from further analysis. Additionally, more detailed forest cover maps can be generated using basemaps such as Google or Mapbox (Illarionova et al., 2022). However, given our further focus on utilizing freely available Sentinel-2 data, we opted to create the forest map specifically based on this particular data source. Therefore, this step supports the transition to the analysis of large forested areas.
However, while high-resolution images provide valuable information on individual trees infected by polygraph, it is also crucial to develop a solution for analyzing medium-resolution satellite data for ecological state assessment. This is because medium-resolution images, such as those from the Sentinel-2 mission, are freely accessible and offer frequent revisit times, and have a long operation period, making them suitable for monitoring the spread of damage across stands. However, one limitation is the collection of datasets for medium-resolution data for this task. The average size of an individual tree is typically smaller than the pixel size of Sentinel-2 images (10 m per pixel), making it difficult to visually distinguish small diseased areas even if they are close to the size of a Sentinel-2 pixel. Additionally, diseased trees are often not distributed homogeneously across large forest areas, with visually healthy trees also present in the same plots. Therefore, the fundamental question is how to associate individual diseased trees or small groups of trees in high-resolution images with medium-resolution images. To address this issue, we propose a two-step approach. Firstly, we mark up damaged forest areas based on high-resolution images. This was achieved using HRNet model, which was trained with RGB data and showed best segmentation metrics, to get the damaged area mask from high-resolution image. To create more relevant samples, we selected pixels that showed confidence rate larger than 0.8. The resulting mask resolution was much higher than that of Sentinel-2 image, so simple resizing was not feasible since at 10 m resolution, the value of individual tree would almost disappear. Therefore, the following process has been carried out: we set a fixed window size based on the Sentinel-2 image pixel size relative to predicted damaged forest mask. We then iterated window across the mask, calculating the ratio of the “damaged” forest pixels to “healthy” forest pixels within each window. This allowed us to assign each 10 × 10 m pixel with a corresponding damaged area content ranging from 0 to 1. Figure 4 depicts distribution of ratios of “damaged” pixels in Sentinel-2 images. Smaller ratios occur more frequently; thus ratios of “damaged” pixels greater than 0.3 were assigned as representatives of “damaged” class, while the pixels with 0 damaged forest were used as representatives of the “healthy” forest for classification task. In total, 37,414 pixels with damaged forest were identified. This markup is then used to develop an ML model that can classify diseased forest based on Sentinel-2 spectral features. The goal is to assess the capability of ML models to distinguish key spectral patterns of damaged forest, even at the scale of an individual pixel or a small group of pixels in Sentinel-2 data.
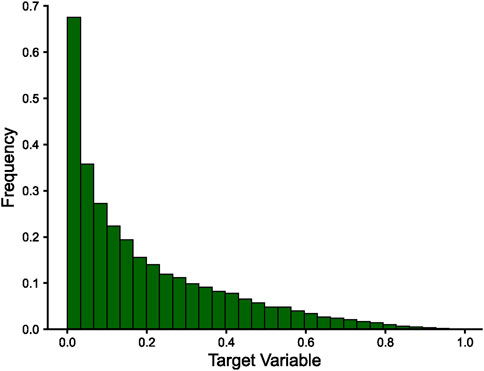
Figure 4. Distribution of the area of diseased trees within each Sentinel-2 pixel (
2.3.2 Segmentation and detection algorithms for high-resolution data
For the segmentation task, we examined HRNet (High-Resolution Network) (Wang et al., 2020) and DeepLabv3+ (Chen et al., 2018). HRNet is a neural network architecture designed for processing high-quality images in the task of image segmentation. The HRNet architecture is based on the idea of maintaining high image resolution at all levels of the network, which allows the network to maximize information about the details and structure of objects in the image. HRNet consists of several parallel branches or modules that work with different levels of image resolution. These modules exchange information and combine it at all levels, allowing HRNet to effectively work with objects of different sizes. HRNet is widely used in areas such as medical image processing, development of computer vision systems for unmanned vehicles (Chen et al., 2023), analysis of satellite images, and other areas where high detail and accuracy are required.
DeepLabv3+ is a state-of-the-art semantic segmentation model in the field of computer vision. It represents an evolution of the DeepLab family of models, designed to accurately and efficiently label and segment objects within images. What sets DeepLabv3+ apart is its remarkable ability to capture fine-grained details and intricate object boundaries, making it especially suitable for tasks like object recognition and scene understanding. This model incorporates powerful features like atrous (dilated) convolutions, atrous spatial pyramid pooling, and a decoder module with skip connections, enabling it to achieve high-quality segmentation results. DeepLabv3+ has found applications in a wide range of areas, including analyzing remote sensing data (Illarionova et al., 2023).
For the detection task, we used the YOLOv8 architecture (Jocher et al., 2023). YOLOv8 is a state-of-the-art model of one-stage object detection that is becoming widely popular because it can process images and videos in real time (Yang et al., 2023). It represents the architecture of the YOLO family. YOLOv8 consists of three main components: the backbone network, detection head, and loss function. YOLOv8 uses a new detection system called YOLO-Anchor-Free, which does not depend on predefined anchor boxes or grids to make predictions. Instead, it predicts four corner points for each bounding box and uses a centrality score to filter out false positives. This allows YOLOv8 to more efficiently and reliably handle objects of different shapes and sizes. YOLOv8 offers several model sizes, each defined by the number of parameters. In our experiments, we used only the Small (3.2 million parameters), Medium (11.2 million parameters), and Large (25.9 million parameters) models.
Patches of size 512 × 512 pixels were used as input. Subsequently, image preprocessing was performed, including normalization or conversion to a different color model other than the RGB format. In the case of the semantic segmentation task, the result of the neural network algorithm was a binary mask, where 1 corresponded to damaged areas. In the case of using the detection algorithm, the model generated bounding boxes for each detected damaged forest area. Further processing of the obtained maps was carried out. The model’s predictions were overlapped with the forest mask to avoid false positives outside forested areas.
2.3.3 Classification algorithms for medium-resolution data
To address the task of processing medium-resolution satellite imagery for identifying damaged areas, a classical ML approach was adopted, utilizing the pixel values extracted from Sentinel-2 images as input. The objective was to produce binary outputs (0 or 1) indicating the presence or absence of forest disease. For this purpose, the XGBoost Classifier, an integral part of the ensemble learning family, was employed (Chen and Guestrin, 2016). Known as Extreme Gradient Boosting, XGBoost has earned acclaim for its outstanding performance in diverse data science and machine learning competitions.
XGBoost distinguishes itself by fusing the strengths of gradient boosting algorithms with sophisticated regularization techniques and a distinctive objective function. This combination ensures resilience against overfitting, even when dealing with intricate datasets. The XGBoost algorithm functions by iteratively enhancing the predictive capabilities of an ensemble of decision trees, where each new tree corrects errors made by its predecessors. This approach effectively balances bias and variance, ultimately yielding highly accurate models. Consequently, XGBoost proves to be an invaluable tool for the specific task of satellite image analysis, offering the potential to make precise determinations in the presence of challenging data and diverse features (Chen and Guestrin, 2016). XGBoost was trained with hyperparameters tuning resulting 200 estimators, maximum depth of 20 and a learning rate of 0.1.
All available cloud-free images for the summer period of 2022 years were used to create the dataset for the ML task. To produce a representative amount of the “damaged forest” samples and “healthy forest” samples, we proposed the following approach. We used all pixels labeled as “damaged forest” and then we randomly sampled the same amount of pixels with “healthy forest”. It allows us to mitigate the gross imbalance in the original dataset. To take into account the initial variability of the “healthy forest” samples during parameters fine-tuning, we trained ML models on 5 generated datasets (only “healthy forest” samples vary). Then the results were averaged.
The splitting into train, validation, and test subsets were conducted based on the territories that do not overlapped (all observations dates were presented in each subset). We compared two settings: training only with spectral bands and with spectral bands in combination with VIs.
2.3.4 Evaluation metrics
Evaluation metrics were calculated according to the Eqs 4–7. To assess the quality of segmentation of damaged trees from satellite images, F1-score and IoU (Intersection over Union) metrics were selected, as they are among the most commonly used metrics in similar CV tasks with RS data. The F1-score metric is defined by the following formulas:
where
The IoU (Intersection over Union) metric is defined by the formula:
where
For the detection algorithm, we used mAP50 metric with IoU threshold 0.5. The formula is the following:
where
For the ML experiments, only the Accuracy metric was considered due the balance between two classes:
3 Results
3.1 Segmentation and detection algorithms for high-resolution data
To address the task of recognizing areas of the forest affected by polygraph, two problem formulations were considered from the perspective of CV algorithms: object detection and semantic segmentation. Since the problem formulations themselves significantly differ, a direct comparison of the obtained metrics was not conducted, and the evaluations were done independently. Both problem formulations achieved a high degree of correspondence between the predicted and actual damaged forest areas. The visual assessment of the results is also supported by high metrics (Tables 2 and 3).
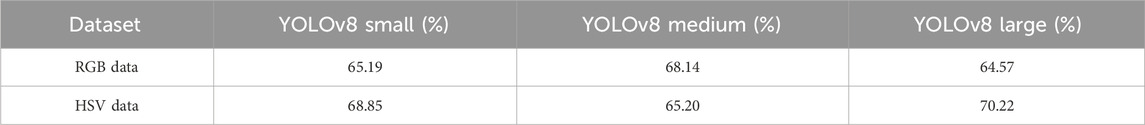
Table 2. Results of detection experiments (RGB and HSV). The mAP@50 metrics are estimated for the test area.
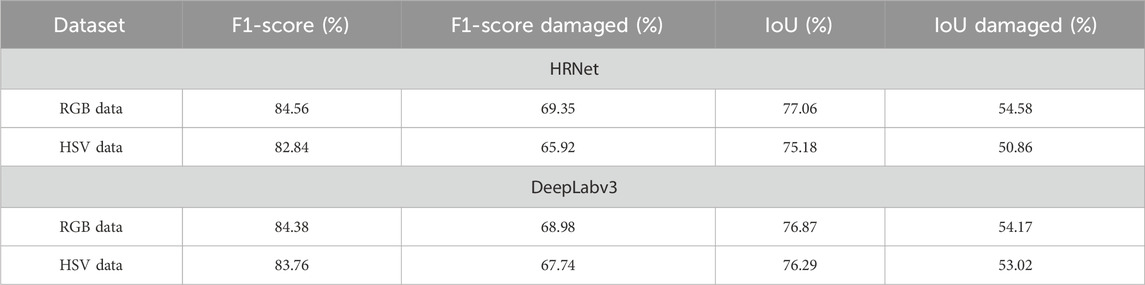
Table 3. Results of segmentation experiments for RGB and HSV datasets. Metrics estimated for the test area. F1-score and IoU are averaged metrics for the classes “damaged forest” and “healthy forest”; F1-score damaged and IoU damaged are metrics for the “damaged forest” class only.
Experiments with different encoders for YOLOv8 models showed high metrics across both datasets (Table 2). For the dataset containing RGB images, we achieved the mAP50 metric of 68% with YOLOv8 Medium size model, followed by YOLOv8 Small model with 65% and Large model with 64%. On the other hand, for HSV dataset, the Large model showed the best results overall achieving 70%, while the Small and Medium models achieved 69% and 65%, respectively. In fact, the model with the largest parameter count showed the lowest result in one dataset and achieved the best metric in the other; this may be due to the relative complexity of the models to correctly obtain certain features to detect objects in RGB and HSV color spectrogram. The results for the best models both for RGB and HSV are depicted in Figure 5.
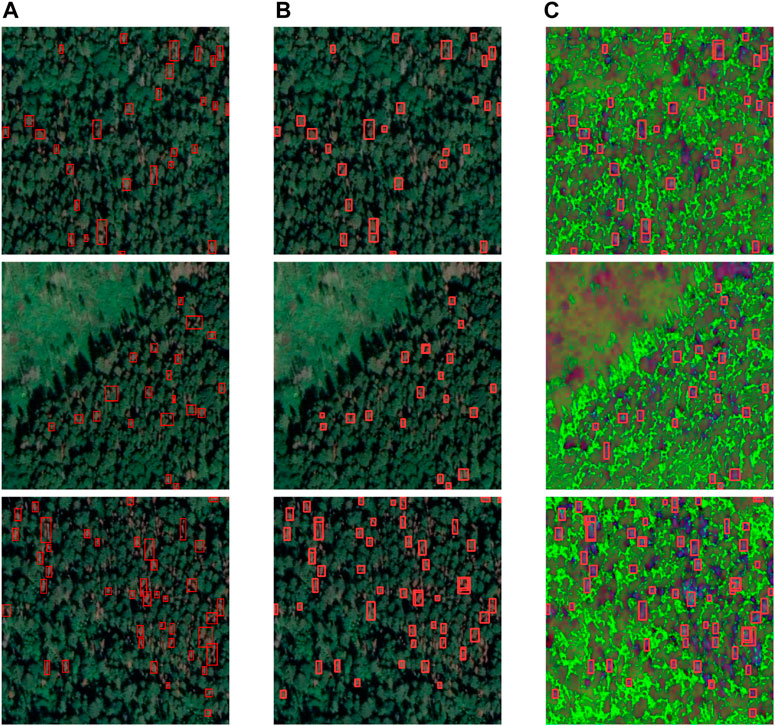
Figure 5. Prediction results for object detection (test set): (A)—ground truth, (B)—object detection for RGB images, (C)—object detection for HSV images. RGB images are provided from a Google satellite base map layer, imagery credit: Google maps, ⓒ2024 CNES/Airbus, Maxar Technologies, Map data ⓒ2024.
When addressing the task of semantic segmentation, the RGB image dataset yielded superior results when using the HRNet model, achieving a mean F1-score of 84%. The DeepLab model performed with slight variations but did not quite match the HRNet’s performance. Interestingly, when working with the HSV dataset, the DeepLab model outperformed the HRNet model, achieving 83% F1-score, while the HRNet showed only marginal differences in results. The results for the best models are presented in Figure 6.
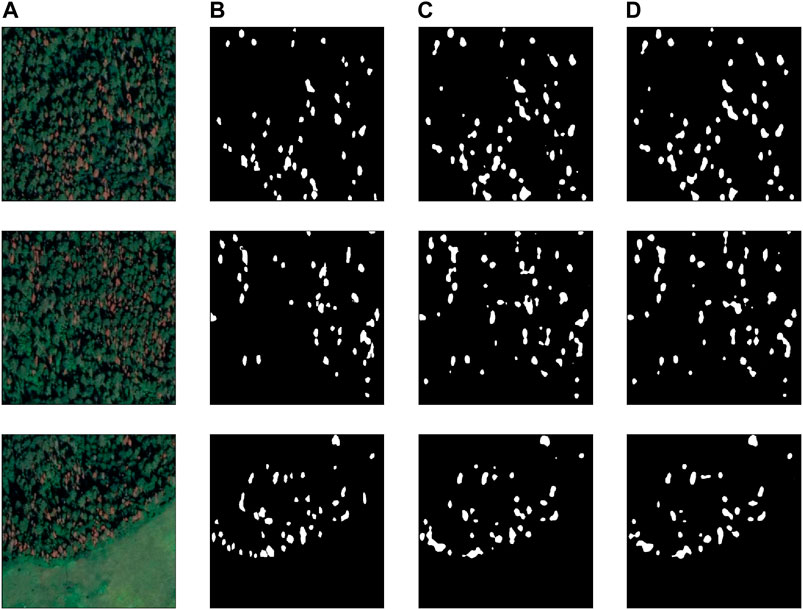
Figure 6. Predictions results for semantic segmentation (test set): (A)—RGB image, (B) —ground truth mask, (C) —segmentation for RGB images, (D) —segmentation for HSV images. RGB images are provided from Google satellite base map layer, imagery credit: Google maps, ⓒ2024 CNES/Airbus, Maxar Technologies, Map data ⓒ2024.
For the object detection algorithm utilizing RGB images, a mAP50 metric of 64% was achieved for damaged forest areas. Transitioning to the HSV color representation increased this metric to 70% (Table 2). When addressing the task of semantic segmentation, the use of the RGB color model showed good results, with F1-score equal to 84%, while the F1-score for the HSV model was 2% lower (Table 3).
The difference in metrics showing better performance of the segmentation algorithm on the RGB color model can be explained by the procedure on the manual data annotation that was performed on RGB images, which may have missed areas of damaged forest with less expressed color or of smaller size. However, such areas are much more visually distinguishable in the HSV color representation. Thus, the training dataset can be potentially expanded with annotations based on the HSV representation, allowing for the identification of damaged trees at various stages of drying.
It is worth noticing that only forested areas have been considered during training and inference stages. It allowed us to avoid false positives and focus on the most important areas. Examples of the target forested territories delineation and further predictions of the damaged trees is depicted in Figure 7.
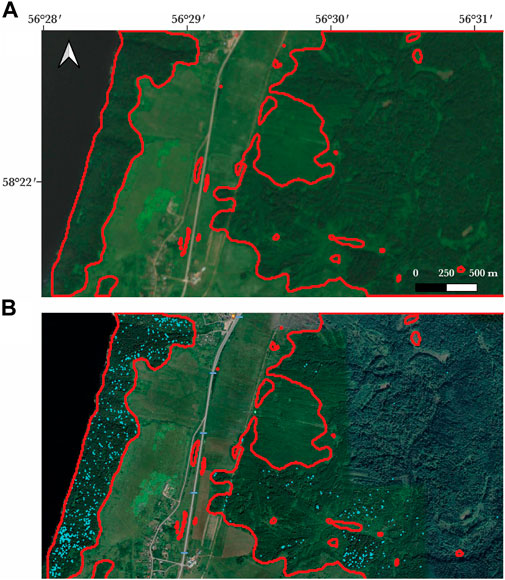
Figure 7. The results of the segmentation algorithm’s work within the area of forest mask. On the upper image (A) example of the Sentinel-2 image and corresponding forest mask visualized as a red boundary line. On the bottom image (B) the results of segmentation algorithm shown in blue. High-resolution RGB image is provided from Google satellite base map layer, imagery credit: Google maps, ⓒ2024 CNES/Airbus, Maxar Technologies, Map data ⓒ2024.
3.2 Applying segmentation algorithm results for damaged trees recognition from middle-resolution data
We also conducted experiments using Sentinel-2 data to assess the capability of multispectral medium-resolution data in recognizing forest damage. While directly labeling medium-resolution data for this task is challenging, we utilized high-resolution markup that was downscaled to a resolution of 10 m per pixel. Additionally, in the medium-resolution dataset we created, we included information about the size of the damaged area. Each pixel was assigned a proportion representing the extent of diseased tree masks within a
Unlike the case with high-resolution data, for medium-resolution data, we applied a classical ML approach. The main reason for this is that we focused on the spectral characteristics rather than texture features, which can be extracted from high-resolution images. We trained the XGBoost model in two settings: one using only spectral bands as input features, and the other using both bands and VIs. Including VIs as features allowed us to improve the accuracy from 80.36% to 81.26%. Based on the feature importance chart in Figure 8, we can conclude that VIs do not significantly influence to the model’s decisions, but they do serve as supplementary features to enhance confidence. An example of the resulting map of damaged forest based on Sentinel-2 data is shown in Figure 9.

Figure 8. Feature importances of the XGBoost model.
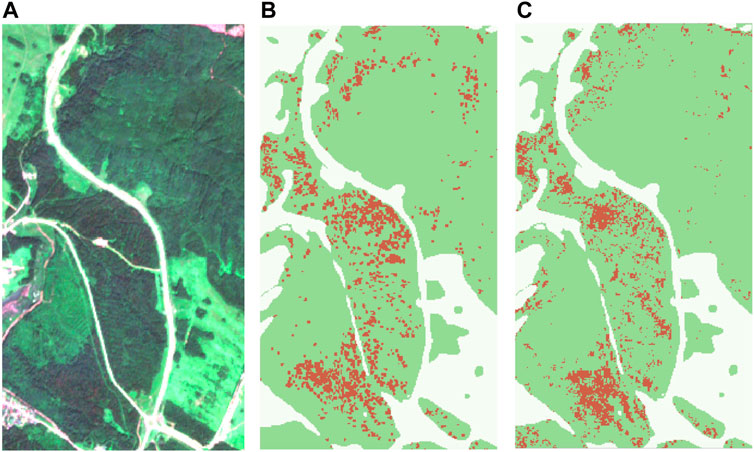
Figure 9. Classification results of the ML model for Sentinel-2 image. RGB composite for Sentinel-2 image for 07.07.2022 (A), predictions results (B), ground truth data (C). Legend: forested area (green), damaged forest (red), other surface (white).
4 Discussion
Detecting forest damage plays a pivotal role in achieving various environmental objectives, encompassing efficient natural resource management, biodiversity conservation, and climate change action (Vinceti et al., 2020; De Frenne et al., 2021; Oettel and Lapin, 2021). The urgency of addressing forest damage arising from pest outbreaks is especially difficult as the extensive geographical areas require monitoring and assessment. At the same time, it is highlighted, that if the outbreak occurs the only countermeasure to restrict its further spread is the salvage logging, which also can induce a controversial effect on the biodiversity (Cours et al., 2021). Thus, the early detection of outbreaks, in terms of both early stages of infestation and localized areas of spread is of high importance, while the utilization of the up-to-date RS data is the only information recourse to make it possible to provide assessments considering resources and time constraints. However, the direct utilization of open-source RS data is limited by its spatial resolution of up to 10 m per pixel, which is insufficient for effective tree damage recognition and manual image annotation. Consequently, fusion of the data from diverse sources could be an effective solution, as high-resolution datasets are useful to provide initial information that can be subsequently processed for monitoring large areas, including retrospective assessments, if the archive imagery data is available for the region.
Comparing the proposed approach with existing studies, it is worth noticing that in case of medium resolution images, datasets often contain large damaged territories. For instance, labels can be determined based on fieldwork on the forestry scale instead of individual tree or group of trees scale (Jolly et al., 2022; Zhang et al., 2022). Such data is valuable for a range of environmental tasks. However, more detailed maps with individual trees or groups of trees might be preferable for particular investigations and forest management. On a large scale healthy trees and damaged can locate close to each other. Therefore, in our approach, we can estimate damaged areas more precise excluding from consideration healthy areas on a large scale.
As for the limitations of the presented approach, they are related to the time precision of openly available high-resolution data of the base map sourced from Google Maps and the challenges associated with transitioning from high-resolution masks to medium-resolution image data. Google’s base map, being an aggregated product, lacks the same date or even year information for spectral data acquisition (Google, 2024). High-resolution satellite data from other sources can be further integrated into the proposed pipeline to extend and enlarge datasets for new observation periods and new territories, however, it lacks in support of specialized observation environments helping to manually inspect areas, which is possible in the Google Earth. On the other hand, even with limited amount of high-resolution data, we can automatically create the markup for medium-resolution satellite images such as Sentinel-2. The second-stage label data can be then utilized to train a machine learning model and transfer a solution to new territories and dates. One of the main advantage of the proposed approach is that transfer from high resolution markup to medium resolution allows one to distinguish automatically areas that are challenging to delineate manually due to large pixel size of Sentinel-2. Such approach minimize requirements for field observations for data collection.
In addition to the visual inspection of the results for the fusion of data with Sentinel-2 imagery, we explored one configuration of the application of ML model certainty with probabilities exceeding 0.8 that was used as a criterion for obtaining secondary label data (class “damaged forest”). However, other applications could be suggested, such as interpreting model certainty as a measure of the extent of damage. Combined with the ground-based inventory, this could be a promising direction for future research.
There are two sources of potential mismatches between Google Earth images and Sentinel-2 images that should be considered during the analysis: temporal and spatial. In terms of temporal analysis, it is important to note that all remote sensing observations were captured during the same summer period, ensuring consistency between Sentinel-2 and Google maps images. The Google Earth image was taken in the middle of the summer on 23 July 2022, while Sentinel-2 images were acquired throughout all three summer months. It is assumed that during this period, there were no significant changes at the visual level, given the spatial and temporal detail with which we are working. Regarding potential spatial mismatches, it is worth noting that Google Earth images offer more detailed views, allowing for the delineation of individual trees, whereas Sentinel-2 data provide more generalized observations for the same areas. Due to the high quality of georeferencing in both Sentinel-2 and Google maps images, we achieve a high level of alignment between the images from these two sources covering the same area. Additionally, it is observed that the transition from Google Earth to Sentinel-2 is more straightforward than the reverse transfer, making it a feasible option. Furthermore, to maximize the feasibility of the developed approach, we estimated the area of damages using Google Earth and then took it into account when transitioning to Sentinel-2. This approach eliminates the use of small plots on Google maps that cannot be accurately detected using Sentinel-2.
To support healthy forest growth and development, the proposed approach can be integrated into ecological monitoring systems. Detected diseased areas and nearby territories can be further treated with chemicals to prevent spreading of insects (Holmes and MacQuarrie, 2016). Forest resistance to insects highly depends on particular regions, forest species, and other environmental properties (Jactel et al., 2021). As additional forest characteristics for changes assessment, one can observe forest species or forest age that can be also obtained automatically through satellite data and machine learning algorithms (Smolina et al., 2023). The developed solution can be used to create maps of insect pests spreading through several years. It will allow researchers to analyze key patterns of forest degradation in particular regions and take preventive measures. Moreover, based on information about insect pests spreading during a few previous years, it is possible to forecast its spreading in future (Wang et al., 2021).
Additionally, future perspectives in this domain could be focused on harnessing additional data sources and addressing new challenges associated with spatial monitoring and planning. For instance, integrating forest-specific data, such as coniferous tree masks, has the potential to localize more precisely the area of interest and enhance model performance (Illarionova et al., 2020). Incorporating high-resolution hyperspectral data could be used for the development of spatial tools for early-stage damage detection (Yu et al., 2021). Furthermore, generating historical predictions for the region of interest could be coupled with bioclimatic, landscape, forest, and socio-economic data to develop predictive models of pests’ distribution, thereby facilitating prioritized and costs-optimized spatial planning (Srivastava et al., 2021).
5 Conclusion
Within the scope of the conducted work, the set tasks have been successfully addressed, including 1) the collection of the unique annotated dataset for recognizing forest areas damaged by P. proximus using high-resolution RS data; 2) exploring the approaches to recognizing forest damage in high-resolution RGB images using deep neural networks in two types of ML tasks: semantic segmentation and detection; 3) assessing capability of medium-resolution Sentinel-2 data in the same task. Developed model approaches enable the automatic identification of forest areas damaged by the polygraph followed by the mapping of affected territories using available high- and open-source medium-resolution RS data. Both the approach and results make significant contributions to the development of semi-automated pipelines for ecological assessment of the territories affected by pest outbreaks and pathogens and can be further utilized to monitor and analyze the pest’s spread dynamics, to construct predictive models of their distribution, and to plan the optimized management actions limiting the influence of the forest damage actors.
Data availability statement
The raw data supporting the conclusions of this article will be made available by the authors, without undue reservation.
Author contributions
SI: Conceptualization, Investigation, Methodology, Supervision, Writing–original draft. PT: Conceptualization, Data curation, Formal Analysis, Investigation, Methodology, Writing–original draft. IS: Data curation, Formal Analysis, Software, Validation, Writing–original draft. DS: Formal Analysis, Supervision, Validation, Writing–original draft. AK: Data curation, Validation, Writing–original draft. EB: Funding acquisition, Project administration, Resources, Supervision, Writing–original draft.
Funding
The author(s) declare that financial support was received for the research, authorship, and/or publication of this article. This work was supported by the Russian Science Foundation (Project No. 23-71-01122).
Acknowledgments
The authors acknowledge the use of the Skoltech supercomputer Zhores Zacharov et al. (2019) in obtaining the results presented in this paper.
Conflict of interest
Author AK was employed by Space technologies and services center, Ltd.
The remaining authors declare that the research was conducted in the absence of any commercial or financial relationships that could be construed as a potential conflict of interest.
Publisher’s note
All claims expressed in this article are solely those of the authors and do not necessarily represent those of their affiliated organizations, or those of the publisher, the editors and the reviewers. Any product that may be evaluated in this article, or claim that may be made by its manufacturer, is not guaranteed or endorsed by the publisher.
References
Bárta, V., Lukeš, P., and Homolová, L. (2021). Early detection of bark beetle infestation in Norway spruce forests of central europe using sentinel-2. Int. J. Appl. Earth Observation Geoinformation 100, 102335. doi:10.1016/j.jag.2021.102335
Bhattarai, R., Rahimzadeh-Bajgiran, P., Weiskittel, A., and MacLean, D. A. (2020). Sentinel-2 based prediction of spruce budworm defoliation using red-edge spectral vegetation indices. Remote Sens. Lett. 11, 777–786. doi:10.1080/2150704x.2020.1767824
Boulanger, Y., Gray, D. R., Cooke, B. J., and De Grandpré, L. (2016). Model-specification uncertainty in future forest pest outbreak. Glob. Change Biol. 22, 1595–1607. doi:10.1111/gcb.13142
Bykov, R., Kerchev, I., Demenkova, M., Ryabinin, A., and Ilinsky, Y. (2020). Sex-specific wolbachia infection patterns in populations of polygraphus proximus blandford (coleoptera; curculionidae: scolytinae). Insects 11, 547. doi:10.3390/insects11080547
Canelles, Q., Aquilué, N., James, P. M., Lawler, J., and Brotons, L. (2021). Global review on interactions between insect pests and other forest disturbances. Landsc. Ecol. 36, 945–972. doi:10.1007/s10980-021-01209-7
Chen, C., Wang, C., Liu, B., He, C., Cong, L., and Wan, S. (2023). Edge intelligence empowered vehicle detection and image segmentation for autonomous vehicles. IEEE Trans. Intelligent Transp. Syst. 24, 13023–13034. doi:10.1109/tits.2022.3232153
Chen, L., Zhu, Y., Papandreou, G., Schroff, F., and Adam, H. (2018). Encoder-decoder with atrous separable convolution for semantic image segmentation. Corr. abs/1802, 02611. doi:10.1007/97
Chen, T., and Guestrin, C. (2016). “Xgboost: a scalable tree boosting system,” in Proceedings of the 22nd acm sigkdd international conference on knowledge discovery and data mining, 785–794. doi:10.1145/2939672.29397
Cours, J., Larrieu, L., Lopez-Vaamonde, C., Müller, J., Parmain, G., Thorn, S., et al. (2021). Contrasting responses of habitat conditions and insect biodiversity to pest-or climate-induced dieback in coniferous mountain forests. For. Ecol. Manag. 482, 118811. doi:10.1016/j.foreco.2020.118811
[Dataset] Google (2024). Google earth help. Available at: https://support.google.com/earth?sjid=3194118049752592411-EU\#topic=7364880.
Dedyukhin, S., and Titova, V. (2021). Finding of the bark beetle polygraphus proximus blandford, 1894 (coleoptera, curculionidae: scolytinae) in udmurtia. Russ. J. Biol. Invasions 12, 258–263. doi:10.1134/s2075111721030048
De Frenne, P., Lenoir, J., Luoto, M., Scheffers, B. R., Zellweger, F., Aalto, J., et al. (2021). Forest microclimates and climate change: importance, drivers and future research agenda. Glob. Change Biol. 27, 2279–2297. doi:10.1111/gcb.15569
Duarte, A., Borralho, N., Cabral, P., and Caetano, M. (2022). Recent advances in forest insect pests and diseases monitoring using uav-based data: a systematic review. Forests 13, 911. doi:10.3390/f13060911
FAO (2010). FAO global forest resources assessment 2010. Main report. No. 163. Rome: FAO Forestry Paper.
Ferrenberg, S. (2016). Landscape features and processes influencing forest pest dynamics. Curr. Landsc. Ecol. Rep. 1, 19–29. doi:10.1007/s40823-016-0005-x
Gao, W., Xiao, Z., and Bao, T. (2023). Detection and identification of potato-typical diseases based on multidimensional fusion atrous-cnn and hyperspectral data. Appl. Sci. 13, 5023. doi:10.3390/app13085023
Gao, Y., Skutsch, M., Paneque-Gálvez, J., and Ghilardi, A. (2020). Remote sensing of forest degradation: a review. Environ. Res. Lett. 15, 103001. doi:10.1088/1748-9326/abaad7
Han, Q., and Niu, Z. (2020). Construction of the long-term global surface water extent dataset based on water-ndvi spatio-temporal parameter set. Remote Sens. 12, 2675. doi:10.3390/rs12172675
Hlásny, T., König, L., Krokene, P., Lindner, M., Montagné-Huck, C., Müller, J., et al. (2021). Bark beetle outbreaks in europe: state of knowledge and ways forward for management. Curr. For. Rep. 7, 138–165. doi:10.1007/s40725-021-00142-x
Högberg, P., Ceder, L., Astrup, R., Binkley, D., Dalsgaard, L., Egnell, G., et al. (2021). Sustainable boreal forest management challenges and opportunities for climate change mitigation. Report from an Insight Process conducted by a team appointed by the International Boreal Forest Research Association (IBFRA)
Holmes, S. B., and MacQuarrie, C. J. (2016). Chemical control in forest pest management. Can. Entomologist 148, S270–S295. doi:10.4039/tce.2015.71
Illarionova, S., Shadrin, D., Ignatiev, V., Shayakhmetov, S., Trekin, A., and Oseledets, I. (2022). Augmentation-based methodology for enhancement of trees map detalization on a large scale. Remote Sens. 14, 2281. doi:10.3390/rs14092281
Illarionova, S., Shadrin, D., Shukhratov, I., Evteeva, K., Popandopulo, G., Sotiriadi, N., et al. (2023). Benchmark for building segmentation on up-scaled sentinel-2 imagery. Remote Sens. 15, 2347. doi:10.3390/rs15092347
Illarionova, S., Trekin, A., Ignatiev, V., and Oseledets, I. (2020). Neural-based hierarchical approach for detailed dominant forest species classification by multispectral satellite imagery. IEEE J. Sel. Top. Appl. Earth Observations Remote Sens. 14, 1810–1820. doi:10.1109/jstars.2020.3048372
Jactel, H., Moreira, X., and Castagneyrol, B. (2021). Tree diversity and forest resistance to insect pests: patterns, mechanisms, and prospects. Annu. Rev. Entomology 66, 277–296. doi:10.1146/annurev-ento-041720-075234
Jolly, B., Dymond, J. R., Shepherd, J. D., Greene, T., and Schindler, J. (2022). Detection of southern beech heavy flowering using sentinel-2 imagery. Remote Sens. 14, 1573. doi:10.3390/rs14071573
Krivets, S. A., Kerchev, I. A., Bisirova, E. M., Pet’ko, V. M., Pashenova, N. V., Baranchikov, Y. N., et al. (2015). Ussuriyskiy poligraf v lesakh sibiri (rasprostranenie, biologiya, ekologiya, vy-yavleniye i obsledovaniye povrezhdennykh nasazhdeniy). (in russian).
Leskinen, P., Lindner, M., Verkerk, P. J., Nabuurs, G.-J., Van Brusselen, J., Kulikova, E., et al. (2020). Russian forests and climate change: what science can tell us 11. European Forest Institute.
Li, Q., Guo, H., Luo, L., and Wang, X. (2022). Automatic mapping of karez in turpan basin based on google earth images and the yolov5 model. Remote Sens. 14, 3318. doi:10.3390/rs14143318
Liu, X., Frey, J., Denter, M., Zielewska-Büttner, K., Still, N., and Koch, B. (2021). Mapping standing dead trees in temperate montane forests using a pixel-and object-based image fusion method and stereo worldview-3 imagery. Ecol. Indic. 133, 108438. doi:10.1016/j.ecolind.2021.108438
Luo, Y., Huang, H., and Roques, A. (2023). Early monitoring of forest wood-boring pests with remote sensing. Annu. Rev. Entomology 68, 277–298. doi:10.1146/annurev-ento-120220-125410
Marini, L., Ayres, M. P., and Jactel, H. (2022). Impact of stand and landscape management on forest pest damage. Annu. Rev. Entomology 67, 181–199. doi:10.1146/annurev-ento-062321-065511
Mirpulatov, I., Illarionova, S., Shadrin, D., and Burnaev, E. (2023). Pseudo-labeling approach for land cover classification through remote sensing observations with noisy labels. IEEE Access 11, 82570–82583. doi:10.1109/access.2023.3300967
Noce, S., Caporaso, L., and Santini, M. (2019). Climate change and geographic ranges: the implications for Russian forests. Front. Ecol. Evol. 7, 57. doi:10.3389/fevo.2019.00057
Oettel, J., and Lapin, K. (2021). Linking forest management and biodiversity indicators to strengthen sustainable forest management in europe. Ecol. Indic. 122, 107275. doi:10.1016/j.ecolind.2020.107275
Panzavolta, T., Bracalini, M., Benigno, A., and Moricca, S. (2021). Alien invasive pathogens and pests harming trees, forests, and plantations: pathways, global consequences and management. Forests 12, 1364. doi:10.3390/f12101364
Peichl, M., Martínez-García, E., Fransson, J. E., Wallerman, J., Laudon, H., Lundmark, T., et al. (2023). Landscape-variability of the carbon balance across managed boreal forests. Glob. Change Biol. 29, 1119–1132. doi:10.1111/gcb.16534
Poblete, T., Navas-Cortes, J., Hornero, A., Camino, C., Calderon, R., Hernandez-Clemente, R., et al. (2023). Detection of symptoms induced by vascular plant pathogens in tree crops using high-resolution satellite data: modelling and assessment with airborne hyperspectral imagery. Remote Sens. Environ. 295, 113698. doi:10.1016/j.rse.2023.113698
Reich, P. B., Bermudez, R., Montgomery, R. A., Rich, R. L., Rice, K. E., Hobbie, S. E., et al. (2022). Even modest climate change may lead to major transitions in boreal forests. Nature 608, 540–545. doi:10.1038/s41586-022-05076-3
Saarikoski, H., Jax, K., Harrison, P. A., Primmer, E., Barton, D. N., Mononen, L., et al. (2015). Exploring operational ecosystem service definitions: the case of boreal forests. Ecosyst. Serv. 14, 144–157. doi:10.1016/j.ecoser.2015.03.006
Sánchez-Pinillos, M., Leduc, A., Ameztegui, A., Kneeshaw, D., Lloret, F., and Coll, L. (2019). Resistance, resilience or change: post-disturbance dynamics of boreal forests after insect outbreaks. Ecosystems 22, 1886–1901. doi:10.1007/s10021-019-00378-6
Schepaschenko, D., Moltchanova, E., Fedorov, S., Karminov, V., Ontikov, P., Santoro, M., et al. (2021). Russian forest sequesters substantially more carbon than previously reported. Sci. Rep. 11, 12825. doi:10.1038/s41598-021-92152-9
She, J., Zhan, W., Hong, S., Min, C., Dong, T., Huang, H., et al. (2022). A method for automatic real-time detection and counting of fruit fly pests in orchards by trap bottles via convolutional neural network with attention mechanism added. Ecol. Inf. 70, 101690. doi:10.1016/j.ecoinf.2022.101690
Smolina, A., Illarionova, S., Shadrin, D., Kedrov, A., and Burnaev, E. (2023). Forest age estimation in northern arkhangelsk region based on machine learning pipeline on sentinel-2 and auxiliary data. Sci. Rep. 13, 22167. doi:10.1038/s41598-023-49207-w
Srivastava, V., Roe, A. D., Keena, M. A., Hamelin, R. C., and Griess, V. C. (2021). Oh the places they’ll go: improving species distribution modelling for invasive forest pests in an uncertain world. Biol. Invasions 23, 297–349. doi:10.1007/s10530-020-02372-9
Taddeo, S., Dronova, I., and Depsky, N. (2019). Spectral vegetation indices of wetland greenness: responses to vegetation structure, composition, and spatial distribution. Remote Sens. Environ. 234, 111467. doi:10.1016/j.rse.2019.111467
Vinceti, B., Manica, M., Lauridsen, N., Verkerk, P. J., Lindner, M., and Fady, B. (2020). Managing forest genetic resources as a strategy to adapt forests to climate change: perceptions of european forest owners and managers. Eur. J. For. Res. 139, 1107–1119. doi:10.1007/s10342-020-01311-6
Wang, C.-J., Wang, R., Yu, C.-M., Dang, X.-P., Sun, W.-G., Li, Q.-F., et al. (2021). Risk assessment of insect pest expansion in alpine ecosystems under climate change. Pest Manag. Sci. 77, 3165–3178. doi:10.1002/ps.6354
Wang, J., Sun, K., Cheng, T., Jiang, B., Deng, C., Zhao, Y., et al. (2020). Deep high-resolution representation learning for visual recognition. IEEE Trans. Pattern Anal. Mach. Intell. 43 (10), 3349–3364. doi:10.1109/TPAMI.2020.2983686
Whitman, E., Parisien, M.-A., Thompson, D. K., and Flannigan, M. D. (2019). Short-interval wildfire and drought overwhelm boreal forest resilience. Sci. Rep. 9, 18796. doi:10.1038/s41598-019-55036-7
Xue, J., Su, B., et al. (2017). Significant remote sensing vegetation indices: a review of developments and applications. J. sensors 2017, 1–17. doi:10.1155/2017/1353691
Xue, S.-Y., Xu, H.-Y., Mu, C.-C., Wu, T.-H., Li, W.-P., Zhang, W.-X., et al. (2021). Changes in different land cover areas and ndvi values in northern latitudes from 1982 to 2015. Adv. Clim. Change Res. 12, 456–465. doi:10.1016/j.accre.2021.04.003
Yang, G., Wang, J., Nie, Z., Yang, H., and Yu, S. (2023). A lightweight yolov8 tomato detection algorithm combining feature enhancement and attention. Agronomy 13, 1824. doi:10.3390/agronomy13071824
Yu, L., Zhan, Z., Ren, L., Zong, S., Luo, Y., and Huang, H. (2020). Evaluating the potential of worldview-3 data to classify different shoot damage ratios of pinus yunnanensis. Forests 11, 417. doi:10.3390/f11040417
Yu, R., Luo, Y., Zhou, Q., Zhang, X., Wu, D., and Ren, L. (2021). A machine learning algorithm to detect pine wilt disease using uav-based hyperspectral imagery and lidar data at the tree level. Int. J. Appl. Earth Observation Geoinformation 101, 102363. doi:10.1016/j.jag.2021.102363
Zacharov, I., Arslanov, R., Gunin, M., Stefonishin, D., Bykov, A., Pavlov, S., et al. (2019). “zhores”—petaflops supercomputer for data-driven modeling, machine learning and artificial intelligence installed in skolkovo institute of science and technology. Open Eng. 9, 512–520. doi:10.1515/eng-2019-0059
Zhan, Z., Yu, L., Li, Z., Ren, L., Gao, B., Wang, L., et al. (2020). Combining gf-2 and sentinel-2 images to detect tree mortality caused by red turpentine beetle during the early outbreak stage in north China. Forests 11, 172. doi:10.3390/f11020172
Zhang, J., Cong, S., Zhang, G., Ma, Y., Zhang, Y., and Huang, J. (2022). Detecting pest-infested forest damage through multispectral satellite imagery and improved unet++. Sensors 22, 7440. doi:10.3390/s22197440
Zhao, H., Yang, C., Guo, W., Zhang, L., and Zhang, D. (2020). Automatic estimation of crop disease severity levels based on vegetation index normalization. Remote Sens. 12, 1930. doi:10.3390/rs12121930
Keywords: remote sensing, deep learning, machine learning, computer vision, Sentinel-2
Citation: Illarionova S, Tregubova P, Shukhratov I, Shadrin D, Kedrov A and Burnaev E (2024) Remote sensing data fusion approach for estimating forest degradation: a case study of boreal forests damaged by Polygraphus proximus. Front. Environ. Sci. 12:1412870. doi: 10.3389/fenvs.2024.1412870
Received: 05 April 2024; Accepted: 05 July 2024;
Published: 31 July 2024.
Edited by:
Sawaid Abbas, University of the Punjab, PakistanReviewed by:
Yan Gao, Universidad Nacional Autonoma de Mexico, MexicoPaul Arellano, Michigan Technological University, United States
Copyright © 2024 Illarionova, Tregubova, Shukhratov, Shadrin, Kedrov and Burnaev. This is an open-access article distributed under the terms of the Creative Commons Attribution License (CC BY). The use, distribution or reproduction in other forums is permitted, provided the original author(s) and the copyright owner(s) are credited and that the original publication in this journal is cited, in accordance with accepted academic practice. No use, distribution or reproduction is permitted which does not comply with these terms.
*Correspondence: Svetlana Illarionova, cy5pbGxhcmlvbm92YUBza29sdGVjaC5ydQ==