- Research Institute of Regional Economy, Shandong University of Finance and Economics, Jinan, China
Background: Optimizing the energy consumption structure (ECS) is conducive to promoting the efficiency and quality of regional green economic development (GED). This paper discusses the current situation of green economic development (GED) in China and how optimizing the energy consumption structure (ECS) can promote green economic development (GED).
Methods: A systematic literature search (from January 2013 to July 2024) was conducted using the keywords “green economic development” and “energy consumption structure” in the following databases: Web of Science, Embase, Science Direct, and PubMed. In this paper, the entropy method was used to measure the GED indicator system, Arcgis drawing was applied to show the current status of GED development, and the theme of this paper was investigated by constructing the basic regression model, Spatial Durbin model, mediating effect model, and moderating effect model. Two researchers independently screened and extracted data.
Results: The analysis of empirical tests in 30 provinces yielded the following results: The overall development of China’s GED shows a fluctuating upward trend. However, there is a regional development imbalance, and the development level of the eastern region is significantly higher than that of the central and western regions. The optimization of ECS contributes significantly to the improvement of GED. And the effect of optimizing ECS on GED has an apparent spatial spillover effect. The optimization of ECS in neighboring regions also promotes the increase of GED in the region, and this feature is more obvious in the central and western regions. The spatial effect of ECS optimization on GED is shown as Central Region > Western Region > Eastern Region. The total effect of the upgrading of the energy consumption structure and its impact on surrounding areas is shown in the following regions: Western region > Central region > Eastern region. The analysis of the mechanism effect shows that upgrading industrial structure is the main mechanism for optimizing ECS on GED.
Discussion: The results show that the optimization and upgrading of ECS is the driving force behind the development of GED, and that there is a need to break down barriers between regions to promote the common development of GED, as well as to play a role in the mechanism of industrial structure.
1 Introduction
Climate and pollution are pressing global challenges. Diversified human economic activity has severely hampered the survival of the species as well as the stable functioning of the economy and society, in addition to causing irreversible harm to land and water resources (Ievdokymov et al., 2018). Therefore, it is now crucial for humanity to figure out how to attain economic and environmental harmony and sustainable development. Countries around the world have been actively seeking a way to address environmental challenges, pursuing a balance between steady economic growth, efficient use of resources, and equitable social development (Patzold, 2020; Ament et al., 2020). As early as after the Industrial Revolution, energy, mainly traditional fossil energy, became the main driving force behind rapid global economic growth; it put some countries at the forefront of world development. However, when economic development gradually enters a mature stage, energy shortage, environmental pollution, and other problems are becoming increasingly serious, jeopardizing human production and development. The “World Energy Statistics Review 2022” showed that the overall amount of fossil energy consumed in 2021 is 489.67 EJ, about triple the amount consumed in 1965. The worldwide primary energy consumption in 2021 is expected to reach upwards of 595.15 EJ. Environmental sustainability is receiving increasing attention globally. China is the world’s biggest energy consumer, and since 1978, the country has used almost 5 billion tons of standard coal in general, up from 571 million tons in 1978. As the main engine of socioeconomic development (Zhang et al., 2014), energy is a necessary raw element for industrialization. However, it leads to severe environmental pollution and carbon emissions while providing economic power and fostering economic development. The ranking of China’s environmental performance in the Environmental Performance Index Report (2022) reflects China’s significant environmental pressure. Facing the pressure of energy shortage, environmental pollution, and social health hazards, countries are exploring developing renewable and clean energy sources, seeking sustainable development methods (Nwozor et al., 2021; Kim et al., 2020; Castrejon-Campos, 2022), promoting the optimizing of the energy consumption, and taking the path of green economic development. Energy is a necessity for human survival and economic development, so improving the efficiency of energy use and optimizing the structure of energy consumption have become critical paths to changing the crude economic development model.
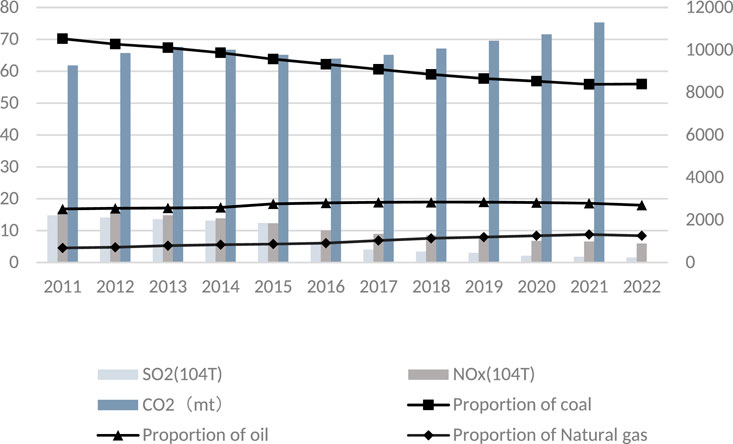
Especially in China, as China’s economy continues to grow, the adverse environmental externalities are also becoming more apparent. The ecological environment puts further strain on China’s efforts to pursue sustainable development (Niu and Jiang, 2021). China’s current energy consumption structure and environmental conditions support this. As can be seen from Figure 1, coal is still the primary source of energy consumption in China. Although the proportion of coal consumption continues to decline from 2011 to 2022, the value still reaches more than 60%, indicating that it will be difficult to change the dominant position of coal for some time in the future. The share of oil also continues to rise, reaching 18% in 2022. Natural gas is less environmentally polluting than coal and oil, but its share is still low. Carbon dioxide emissions declined from 2013 to 2016 and then showed an increase after 2017. China’s energy consumption situation determines China’s environmental pollution situation, and as people’s demand for a better life and green development rises day by day, this requires a shift to cleaner consumption patterns; otherwise, it is difficult to realize sustainable development and green development. Therefore, since the 21st century, ecological civilization has become one of the main themes of socialist development with Chinese characteristics (Wu et al., 2021; Dong et al., 2021). The 13th Five-Year Plan included green as one of its five development themes in 2014. During the 18th CPC Central Committee’s Fifth Plenary Session, it was explicitly suggested that the five development themes be implemented. Protecting the ecological environment is an indispensable part of social development. In the 20th Party Congress report, President Xi Jinping noted that we should work toward building a beautiful China and insist on comprehensive preservation and orderly management of the country’s mountains, lakes, fields, grasslands, and sands. Encourage the conservation and resources using efficiency, promote energy low-carbon transition, then accelerate the establishment of low-carbon industry and change energy structure. The International Energy Agency in Paris released the “World Energy Outlook 2023” report, which predicts that by 2030, the world energy system will transform, and clean energy technology will be crucial in boosting nations’ capacity to take action and strengthening global cooperation to address challenges related to energy security. China and even other countries are working hard to facilitate the development of a green economy and achieve “carbon peak and carbon neutrality".
Clarifying the relationship between optimizing the ECS and the GED is essential. However, a standardized view of the relationship has not yet been formed, and most of the literature neglected the role of spatial (Fang et al., 2022; Dzwigol et al., 2023). So far, there are not enough studies on how ECS optimization affects the GED, especially in terms of spatial effect. However, answers to the following questions are required: Does the optimization of ECS promote or hinder the GED? Does GED in the surrounding regions benefit spatially from the optimization of ECS? What is the mechanism variable by which ECS affects GED?
Therefore, this paper has the following marginal contributions. Firstly, this study innovatively used the entropy weight TOPSIS model to construct a comprehensive index system including economic efficiency, social efficiency, and environmental efficiency to measure the level of GED and demonstrate the current status of GED in my 30 provinces. Second, from the perspective of energy consumption structure, existing studies mostly explore the single impact of energy on GED. At the same time, this paper investigates the impact mechanism of ECS on GED by utilizing the data of each province from 2011 to 2021. Finally, considering the existence of linkages and synergies between different regions, this study explores the spatial spillover effect of energy consumption control on GED. Meanwhile, considering the differences in resource endowment and economic base between different regions, this study analyzes the heterogeneity of spillover effects in different regions. This analysis not only enriches the existing GED research but also provides new insights for improving ECS and promoting cross-regional synergistic development of GED.
This study is organized as follows: Part II is the literature review. Part III is the theoretical analysis and hypotheses. Part IV is about methods and data. Part V is results and discussion. Part VI is the conclusion and the recommendations.
2 Literature review
British economist Pearce first coined the term green economy. A “green economy” refers to a sustainable model of economic development that preserves the environment, safeguards public health, averts ecological crises, and makes prudent use of available resources. The United Nations Environment Programme (UNEP) considers GED to be the greening and decarbonization of the economy, thereby enhancing human wellbeing. According to the majority of studies now available, GED aims to achieve low-carbon and sustainable development, emphasize ecological priority, and coordinate society, economics, and environment (D’Amato et al., 2017; Zioło et al., 2023; Yang et al., 2022).
With the continuous integration of GED research into the academic field, numerous scholars have conducted studies on GED assessment. However, there is no consistent conclusion regarding the evaluation index system of GED, mainly including National Accounts (Kunanuntakij et al., 2017; Wei et al., 2020), single-indicator efficiency evaluation methods, and multi-indicator system (Wu, 2021), and the comprehensive index of GED (Pan et al., 2019; He et al., 2018). The Green National Accounts system refers to the addition of ecological and environmental performance based on the traditional national economy accounting system. The single-indicator efficiency evaluation method evaluates the level of GED by measuring the positive effect of green economy development on the environment, mainly reflecting the degree of contribution of the green economy in realizing resource conservation and environmental protection. The evaluation indicators mainly include energy efficiency (Wei et al., 2009; Wu et al., 2023), resource utilization efficiency (Feng et al., 2019), and emission reduction efficiency (Zhang et al., 2018). Multi-indicator efficiency evaluation methods introduce economic and social elements to assess green economic development. The most commonly used is green total factor productivity to evaluate GED (Chang et al., 2023). Some scholars have used the three-stage DEA model, the SBM model, and the environmental RAM model to measure green economic efficiency (Li J. et al., 2022). The comprehensive index of GED refers to the evaluation by selecting some representative core indicators (Yang, 2023; Dong and Yang, 2022). The most representative is the green growth indicator system constructed by OECD, which covers economic, environmental, and human wellbeing. Based on this, different countries and regions have innovated the indicator system according to their environmental development conditions. The GED index is calculated from the selection of key indicators, each of which is given a unique weight. The main methods of measurement are the entropy method and principal component analysis (PCA) (Lin and Zhou, 2022; Guo and Diao, 2022). However, how to drive the development of GED has become a hot issue due to the seriousness of environmental issues. Some scholars believe that economic factors underlie the development of the GED and have an important role in the GED. The level of economic development forms the basis for the GED, and regions with a high level of economic development have adequate human resources and facilities, thus promoting the innovation and application of green technologies (Lin and Zhou, 2022; Yang et al., 2023). Moreover, technological inputs will increase the level of green technology innovation, which in turn will drive GED (Zhao et al., 2022; Liu and Dong, 2021; Zhang and Li, 2022). Green financing helps to improve policies related to carbon emissions trading, environmental laws, and other areas, enhancing corporate responsibility and pushing the standard for green technical innovation, advancing the GED (Hua et al., 2024; Li, 2023; Shi and Yang, 2024). Industrial restructuring and transformation are also essential factors affecting GED, mainly through the advanced industrial structure and greening (Ding et al., 2022; Dong et al., 2021). In addition, the development of GED cannot be separated from the government’s policy support (Su et al., 2022; Wang and He, 2022; Xin Z. et al., 2022). Some environmental tax policies affect the GED through limits on pollution emissions (Liu et al., 2024). Another group of scholars believe that GED is influenced by environmental factors such as resource development and utilization. Reasonable resource development and utilization is a prerequisite for GED, and increased utilization of resource development can effectively promote economic efficiency (Zerong et al., 2024). However, overuse and development will result in resource depletion and environmental contamination, which will hinder the green economy’s ability to grow sustainably (Wang et al, 2022).
While appropriate ECS promotes GED, an inappropriate energy structure has a negative impact on the environment (Chen et al., 2021; Xu et al., 2020). The high use of non-renewable energy sources can lead to an increase in PM2.5 concentration and SO2 emissions (Ul-Haq et al., 2023; Yang et al., 2016). Clean energy helps reduce carbon emissions and protect ecosystems (Li et al., 2020). A new energy transition strategy can achieve a symbiotic balance between the economy and the environment and enhance green economic performance (Lin and Xu, 2024). A strategic and environmentally conscious management of resources often has a positive impact on a country’s economic growth, and GED can be promoted through effective management of steady-state resources (Zerong et al., 2024). At the same time, there is a coordinated relationship between energy consumption structure and green total factor productivity, and the degree of this coordination is affected by environmental regulations, technological innovations, and industrial structure, among other factors (Zhang et al., 2023). Some scholars have found a nonlinear relationship between energy and the economy and the environment, with an inverted N-shaped relationship between renewable energy and economic growth and carbon emissions (Li C. et al., 2022). However, the majority of studies only concentrate on how ECS affects environmental contamination. Studies have mainly explored the impact of ECS on environmental or economic factors from a decentralized view. There are not many studies on how ECS affects societal GED. Most studies ignore interregional linkages and spatial spillovers. ECS affects both localized regions and spreads to neighboring regions, thus affecting the surrounding regions for environmental and GED (Xiao et al., 2019). Besides, some studies lack an analysis of the mechanism effect. Therefore, this paper explores the impact of ECS from the comprehensive perspective of the socio-economic environment by constructing a comprehensive index system for green economic development, incorporating spatial effects and mechanism effects into the study, and analyzing the effects of ECS on GED.
3 Influence path of ECS on GED
This paper adopts the literature research method to analyze the effect of ECS on GED from two main perspectives, direct effect and indirect effect and puts forward the research hypothesis.
3.1 The direct effect of ECS on GED
ECS optimization promotes GED in three aspects: economic, ecological, and social benefits.
Firstly, optimizing ECS promotes the transformation of energy cleanliness, improves economic efficiency, and boosts the level of GED. Optimizing ECS means a shift from traditional reliance on coal resources to clean energy. Using clean energy is a necessary way to achieve “Carbon Peak and Neutrality” targets. Energy cleaner transformation can guide financial capital towards environmental protection. Meanwhile, green finance facilitates energy savings, which in turn increases investment in clean technology (Li, 2023; Mingxing et al., 2023), injecting more financial support for the economy.
Secondly, optimizing ECS promotes environmentally sustainable development, improves environmental efficiency, and contributes to the level of GED. China is the world’s largest energy producer and energy consumer. Coal is China’s primary energy source, and new energy sources are scarce. China’s characteristic of “more coal, less oil, less gas” has formed a long-term energy structure dominated by coal. Conventional energy sources generate large amounts of pollutant emissions. In the process of extraction, it destroys vegetation, soil erosion, and pollution of water sources. During its use, it emits large amounts of carbon dioxide, causing atmospheric deterioration and seriously affecting the environment. Clean energy is essential to solving today’s environmental problems because of its low pollution, large reserves, and sustainability. Therefore, optimizing ECS will help to increase clean energy use, reduce carbon dioxide emissions, increase the efficiency of energy use, and improve the environment’s quality and the wellbeing of individuals (Lee et al., 2023; Guo et al., 2021). Green energy transformation reduces energy dependence on the environment, reduces environmental pollution and resource waste, and improves the quality and sustainability of the ecological environment. It is positive for the promotion of ecological civilization construction and GED.
Thirdly, optimizing ECS creates new employment opportunities and improves social benefits, then promotes the GED. In the first place, optimizing ECS promotes the use of clean energy and, therefore, creates jobs producing and installing clean energy. Besides, optimizing ECS brings more investment in renewable energy (Liu et al., 2023), and the transfer of such investment will mostly have a positive effect on employment through education. In the second place, the optimization of ECS can be combined with modern agriculture, industry, and other industries to form new economic growth points, increase job possibilities, and realize the coordination economy, social benefits, and environmental benefits. Besides, the optimization of ECS is accompanied by technological innovation, which means that new opportunities will emerge in fields ranging from electric vehicles to power generation and storage. Therefore, proposing the hypotheses.
H1. Optimizing ECS can significantly promote the level of GED.
3.2 The spatial spillover effect of ECS on GED
Existing studies have shown that optimizing the ECS has spatial spillover effects on low-carbon environment preservation and economic growth. Meng et al. (2023) found that clean energy promotes the low-carbon economy and has positive spatial spillover effects. Li et al. (2022) studied the regional spillover effect of clean energy, which benefits both environmental preservation and economic growth. At present, there are different conclusions in the literature regarding how ECS affects both environmental pollution and economic growth. Most studies show that the impact is not a single positive or negative effect but is nonlinear. Energy consumption also increases regional carbon dioxide emissions and has a spillover impact over space (Zou and Zhang, 2020). The current energy situation shows that the country is rich in energy. The stock and type of energy sources in the region are similar. In response to the lack of energy in the eastern region, our country is also actively taking measures to cope with the status quo, such as the “West-to-East Gas Pipeline” project, to make up for the energy demand through spatial transfer. GED is beneficial to economic and environmental sustainability. Considering this, this research proposes the second hypothesis.
H2. The optimization of ECS has a spatial spillover effect on GED.
3.3 The mechanical effect of industrial structure upgrading
With ECS optimization, a new clean energy industry will gradually replace the traditional energy industry (Su and Fan, 2022). New energy and other means to encourage high-energy-consuming, high-polluting industries to high-efficiency, environmentally friendly, sustainable industries, the establishment of a green industrial chain, and the promotion of the adjustment and optimization of economic structure (Pan et al., 2021). The cleaner transformation of energy pushes industrial structure upgrading. Existing research shows that industrial structure increases the GED level. Upgrading an industry’s structure makes enterprises more competitive in quality, technology, and environmental preservation, then enhances the competitiveness of the economy and green innovation ability (Qiu et al., 2023). Moreover, industrial structure upgrading can decrease carbon emissions (Liang et al., 2023; Gao et al., 2022) and improves eco-efficiency (Wang and Wang, 2022). Meanwhile, the practice has proved that localities have actively constructed an ecological industrial structure, transformed the rough industrial structure, and centered on enhancing the effectiveness and quality of economic development to realize green and low-carbon development. Therefore, according to research and realistic experience, this paper proposes the following hypothesis.
H3. ECS can indirectly increase GED through upgrading industrial structures.
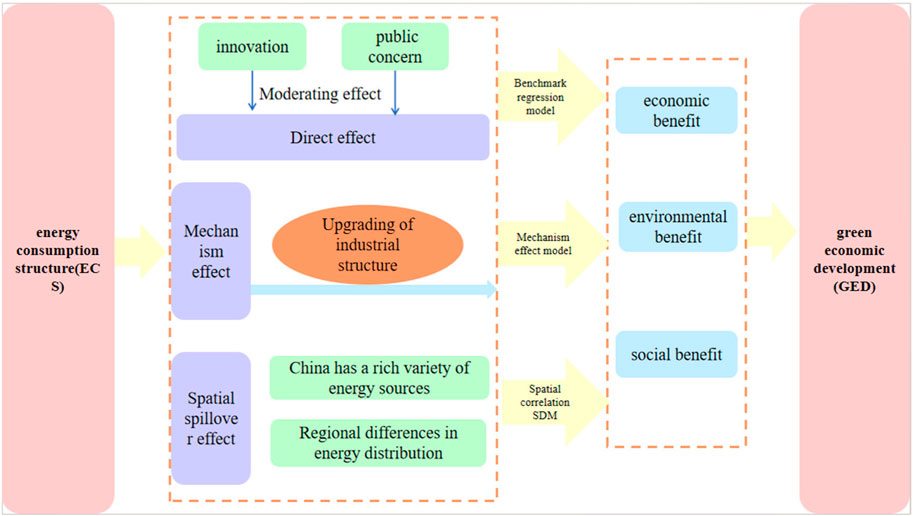
3.4 The moderating effect of technological innovation and public concern
Technological innovation has a positive moderating effect on the promotion of the upgrading of the energy consumption structure and the development of the green economy. Technological innovation is conducive to enhancing the efficiency of resource allocation. As the level of green technological innovation improves, low-carbon and zero-carbon emission technologies become more and more mature, the cost of using them gradually decreases, more clean energy enters the production field, the proportion of research and development and application of clean technology increases, and the proportion of fossil energy consumption decreases, so that carbon emissions can be choked off from the source. The industrial structure is also affected by green innovation, and improved technological innovation will facilitate the flow of factors such as talent and capital to low-carbon productive services and accelerate the transfer of high-pollution industries to low-pollution industries. The pressure of energy scarcity and sustainable development drives enterprises to accelerate technological innovation and take the path of green and low-carbon development. Thus, technological innovation ensures the stability of firms in making energy mix upgrades, controlling their costs, and improving GED levels.
Regarding public concern, the public can directly participate in pollution control, negotiate with polluting companies, resolve disputes through judicial channels, or indirectly influence energy consumption behavior by conveying environmental protection supervision opinions to the government through public opinion communication. The public can also convey the demand for green products to the market, leading to green investment and innovation activities.
Therefore, the following hypothesis is proposed.
H4a. Technological innovation positively moderates the positive correlation between ECS and GED.
H4b. Public attention plays a positive moderating role in the positive correlation between ECS and GED (Figure 2).
4 Methods, variable selection and data
4.1 Methods
4.1.1 Basic model
The basic model of the direct effect of the ECS on GED as shown in formula (1):
Where GEDit denotes the GED level, i represent province and t represents year, ECSit is the ECS development level, and ε denotes the random perturbation term; δt and μi represent time and individual fixed effects, and Xit denotes the control variables; α1 and α2 are the regression coefficients; α0 is a constant term.
4.1.2 Spatial econometric model
It has been shown that GED and ECS optimizing have strong spatial correlation, so the spatial panel model is selected for regression analysis, and before spatial analysis, the geographic correlation of the GED is measured by the Moran I index, defined as shown in formula (2):
In the equation above, X is the GED level, i and j denote the different provinces, n represents the number of provinces, and is an element in the spatial weight matrix W. In this paper, the spatial weight matrix is selected as geographic distance spatial weight matrix W1, spatial adjacency matrix W2, and economic distance matrix W3.
This paper uses SDM to assess the influence of optimizing ECS on GED; the model is shown in formula 3:
where i represents province and t represents year; Wij is the spatial weight matrix, β is the vector of parameters to be estimated for the explanatory variable-energy consumption structure optimizing, and ρ is the spatial lag coefficient. Considering that there are many factors affecting the development of a green economy, this paper introduces relevant control variables. The control variable’s spatial lag coefficient is indicated by the symbol λ, and the vector of parameters to be evaluated for the control variables is represented by Xθ. The symbols ui, vt, and εit represent area, time, and random disturbance terms, respectively.
4.1.3 Mechanism effect test
To investigate how ECS affects GED, this paper further explores the mechanisms involved. Scholars usually adopt a three-step approach to mechanism analysis. However, this approach is constantly questioned. Jiang (2022) argued that there could be endogeneity issues with the mediated effects of the third step of mediated effects, which would lower the validity of statistical tests. Therefore, only two steps are needed to illustrate the relationship between mechanism variables and GED, and the third part uses the literature or existing studies to support it. The above theoretical analysis proves that upgrading industrial structures benefits GED; therefore, this study uses a two-step method. The model is shown in formula (4):
Model (4) is the second step of the mechanism effect. In the equation, M is the mechanism variable. Both α1 andσ1 are significant, indicating that the ECS affects the GED through mechanism variables. The other variables have the same definitions as in model (1).
4.1.4 Moderating effect test
To explore the moderating effect of ECS acting on the GED process, the interaction term between the moderating variable and ECS is introduced, and formula (5) constructs that D is the moderating variable.
4.2 Variables
4.2.1 Explained variable: GED
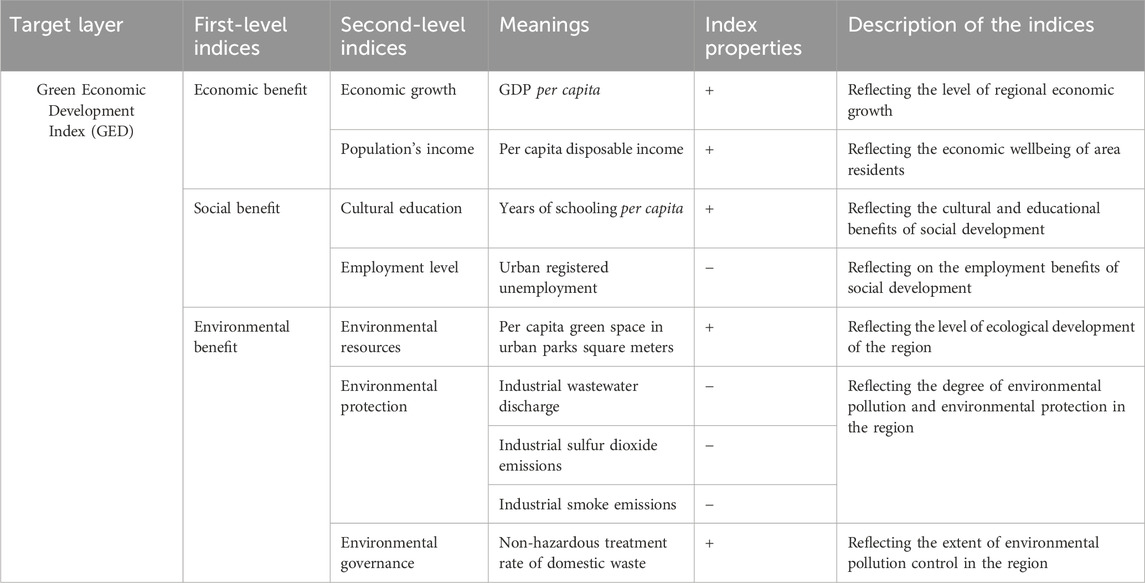
Traditionally, economic growth has been defined as a rise in GDP. The process of continuously maximizing social structure, economic structure, and the welfare of the people based on economic growth is known as economic development. In particular, economic development implies improved ecological environment optimization, enhanced infrastructure, affluent culture and education, and higher levels of happiness among the people. The negative effects of traditional economic development are environmental deterioration and energy resource waste. At the same time, GED emphasizes the addition of the concept of “green” based on economic development, which is environmental protection, ecological optimization, and taking the green development path. Therefore, based on the GED connotation, this paper defines GED as the evaluation of social development pursuing three comprehensive benefits economic, social, and environmental.
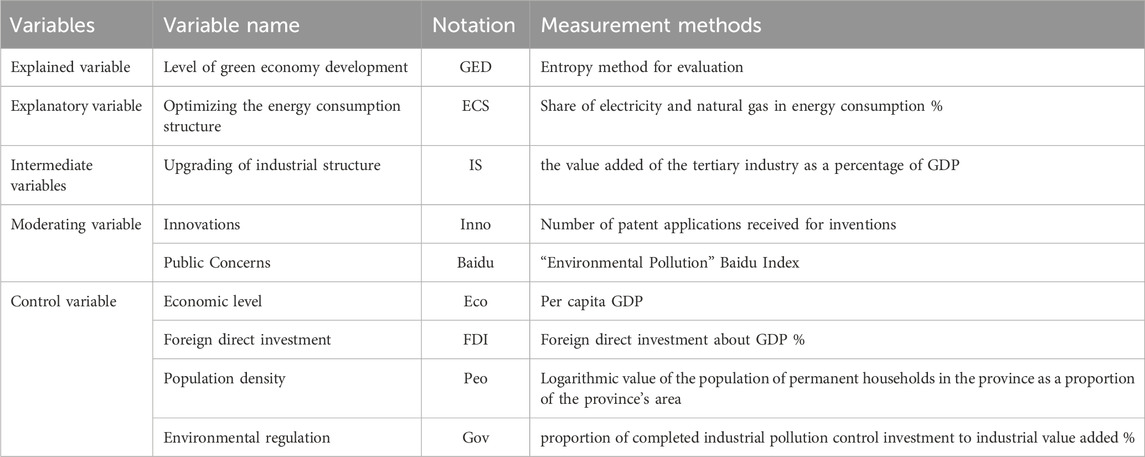
The GED’s evaluation index system was created using the entropy approach, considering the advantages to the economy, society, and environment, as well as the principles of science, comprehensiveness, and data accessibility. Table 1 shows the specific indexing system.
4.2.2 Explanatory variable: optimization of ECS
Optimization of energy consumption institutions refers to the continuous rationalization of the proportion of various energy sources consumed and the minimization of consumption and carbon dioxide emission costs. Electricity and natural gas are less polluting and are suitable substitutes for traditional energy sources. Thus, the percentage of clean energy in overall energy consumption represents the optimization of ECS. Clean energy consumption is selected from the data on electricity and natural gas consumption, and the units of both are simultaneously converted to 10,000 tons of standard coal and then summed up and finally divided by the total energy consumption for weight calculation.
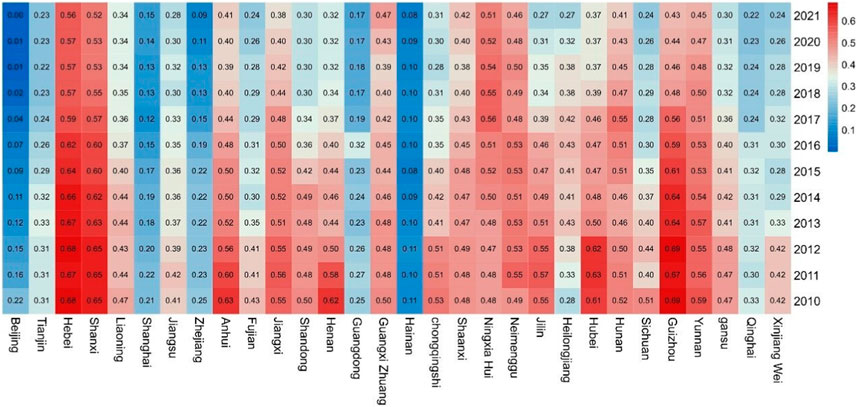
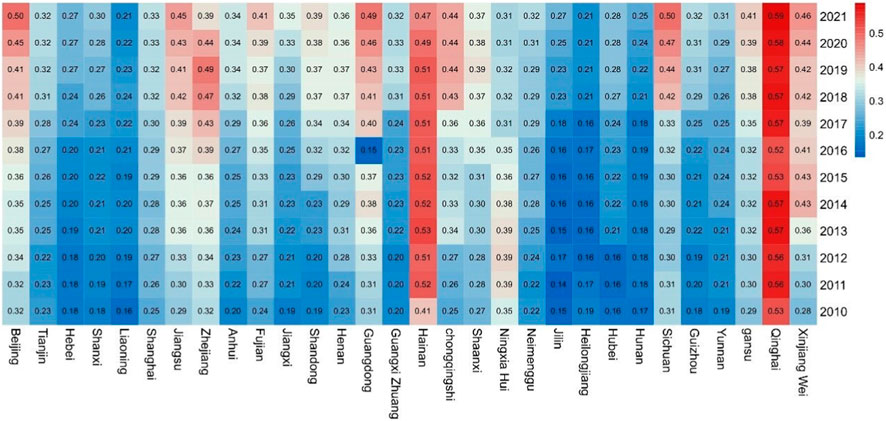
China’s coal and clean energy consumption from 2010 to 2020 are shown in Figures 3, 4. From Figure 3, the proportion of coal consumption from 2010 to 2021 shows a downward trend in general. However, there are geographical variations among various regions; the proportion of coal consumption in Beijing, Tianjin, Shanghai, Zhejiang, Guangdong, Hainan, and Qinghai has been at a low level, while the proportion of coal consumption in Hebei, Shanxi, and Ningxia is still high. As illustrated in Figure 4, the proportion of clean energy shows a steady upward trend. In addition, there is a spatial consistency between changes in clean energy consumption and coal consumption.
4.2.3 Intermediate variables
Optimization of the industrial structure is the transformation of the industrial structure from a lower to a higher form, representing a developmental turnaround of the economy. Therefore, the value added of the tertiary industry as a percentage of GDP is used to express industrial structure optimization.
4.2.4 Moderating variables
According to the above analysis of moderating effects, the first moderating variable is innovation, and the most intuitive demonstration of innovation is the invention patents of the society, which is indicated by the number of invention patent applications. The second moderating variable is public concern; the public search volume of the term “environmental pollution” intuitively demonstrates the public’s concern for the greening of social development, so the “environmental pollution” Baidu index is selected to bring off the public concern.
4.2.5 Control variables
In addition to the ECS, GED is also affected by the following control variables: referring to previous research and combining the connotation of green economy development, four relevant control variables are selected (Table 2). (1) Economic level (Eco), expressed in terms of per capita GDP. (2) Population density (Peo), measured as the proportion of permanent households in a province to the area of the province, takes logarithms in the empirical evidence. (3) Foreign direct investment (FDI) is calculated as the GDP’s percentage of foreign direct investment. (4) Environmental regulation (Gov) is proxied as industrial added value accounts for the proportion of investment in industrial pollution control.
4.3 Data sources
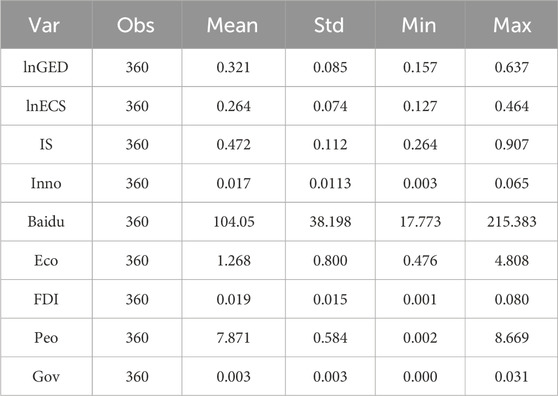
This study does not include Tibet, Hong Kong, Macao, and Taiwan because there is an overwhelming amount of missing data for the indicators. The relevant data for the GED were obtained from the “National Bureau of Statistics” and “The China Province Statistical Yearbook.” The data for the ECS were obtained from the “Energy Statistical Yearbook.” Environmental Pollution Baidu Index is calculated using the crawled daily search index to represent the annual average. The remaining variables were derived from the “China Province Statistical Yearbook,” and some missing values were supplemented by linear interpolation. The descriptive results for all variables chosen are shown in Table 3.
5 Results and discussion
5.1 GED evolution in space and time
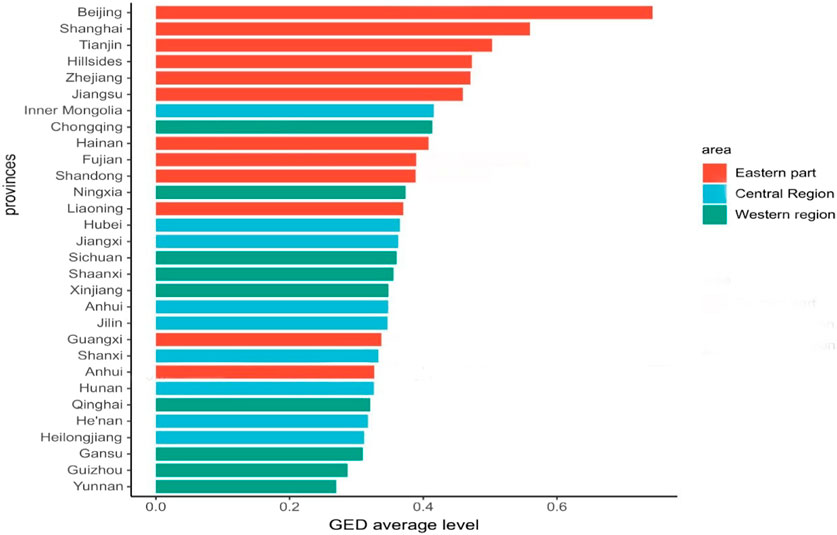
The results of ranking the average GED of each province for 2011–2021 are shown in Figure 5. In terms of the overall distribution, the provinces in the eastern region ranked high, and the provinces in the central and western regions ranked low, with the eastern region significantly higher than the central and western regions. It shows an inter-regional imbalance. This is mainly because of China’s development strategy and the foundation of the Eastern Region. The eastern region has established the groundwork for economic growth attributable to the national plan that prioritizes the eastern region, accumulating capital, talent, and experience, thus leading the GED level. By contrast, the provinces in the center and western areas, which are Yunnan, Guizhou, Gansu, Heilongjiang, and Henan, have the lowest levels of development. This shows that the GED level of this area has a great deal of space for development. The provinces of the central region are less efficient in developing GED because the central region has inherited heavily polluting industries from the eastern region, and traditional energy still accounts for a large proportion of the development. Meanwhile, innovation and technology have set restrictions on the central and western regions, making it hard to develop effectively. As a result, the level of GED stays lower.
Regarding intra-regional disparities, the province with the highest GED mean in the eastern region is Beijing, with a mean of 0.743, and the province with the lowest mean is Anhui, with a mean of 0.327. There is a difference of 0.415. In terms of the central region, the province with the highest GED mean in the central region is Inner Mongolia, with a mean of 0.416, and the province with the lowest mean is Heilongjiang, with a mean of 0.311 and a difference of 0.1. The western region has the highest mean in Chongqing, with a mean of 0.413, and the lowest in Yunnan, with a mean of 0.270 and a difference of 0.143. The province with the highest average GED value in the western region is Chongqing, with an average value of 0.413, and the province with the lowest average value is Yunnan, with an average value of 0.270, a difference of 0.143. The most significant gap within the region is in the eastern region, which may be due to the fact that when the eastern region transfers industries to the central and western parts of China, the central and western regions are limited in the environmental carrying capacity to undertake the traditional industries. So they begin to accept the traditional industries. This may be due to the fact that when the eastern region is transferring industries to the central and western regions, the central and western regions have limited environmental carrying capacity to take over traditional industries, so there are differences in the development between provinces, which are in a period of adjustment and friction. Thus there is a significant gap in the level of GED development within the region.
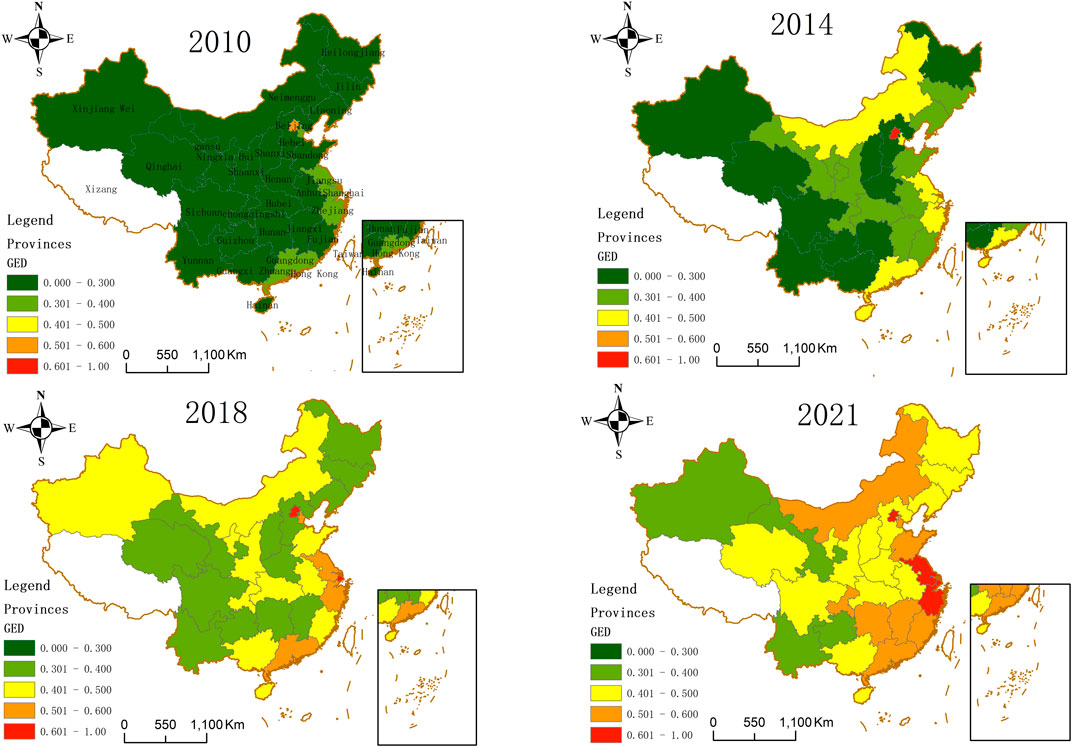
To explore the spatiotemporal characteristics of GED, GED levels were classified into five categories and visualized at four time points: 2010, 2014, 2018, and 2021 (Figure 6). The findings are as follows: (1) during 2011–2021, the GED level in all provinces shows an upward trend. It shows that the GED of China is generally showing a steady and progressive trend, and the green transformation of the economy is solidly advancing. (2) In the process of dynamic evolution, GED is characterized by agglomeration, and the agglomeration area is mainly located in the east. This indicates that the level of green economy development in the eastern region is generally higher than that in the central and western regions and can effectively drive the development of neighboring provinces.
5.2 Baseline regression results
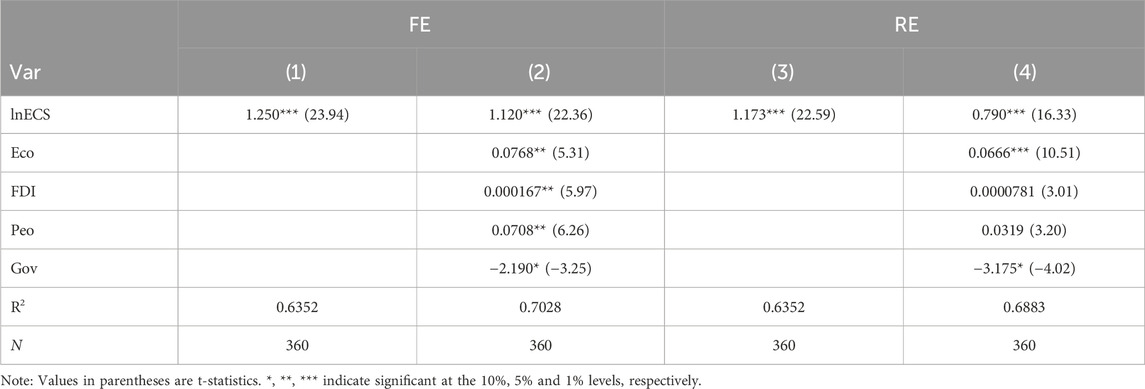
The fixed effects regression results are reported in columns (1) and (2), and the random effects regression results are reported in columns (3) and (4) in Table 4. The regression results for RE and FE prove that the influence of ECS on GED is positive, and all passed the significant test at the 1% level. According to the regression results of R2, this study chose the fixed effects model.
The results show that in column (1), when no control variables are added, GED increases by 1.250 for every 1% increase in ECS, respectively and is significant at 1%. Column (2) adds control variables to the model. The coefficient of the core explanatory variable, ECS, is still significantly positive at the 1% level after other factors are taken into account, indicating that the optimization and upgrading of ECS has a strong incentive effect on the improvement of the economic, environmental, and social benefits, which in turn improves the level of the GED, proving that H1. This is mainly because traditional coal, as the primary energy source for production and consumption in China, produces a large amount of greenhouse gases, carbon dioxide, and other harmful substances during its use, which causes serious harm to human beings and organisms. Hence, the most direct effect of the upgrading of ECS is to increase the proportion of clean energy use, increase the environmental benefits, and promote the improvement of GED through the enhancement of environmental benefits.
Moreover, the effect of economic development on GED is 0.0768, indicating that the basis of GED is still economic growth. Economic development can inject vitality into urban development, provide impetus to promote ecological improvement and improve the quality of life of residents, thus increasing GED. The impact of FDI on GED is positive and passes the 5% level of significance, but the coefficient value is small. This shows that FDI has less effect on the development of GED, which mainly depends on domestic environmental improvement rather than foreign trade. The effect of population density on GED is 0.0708 and passes the test of significance at a 5% level. This may be due to the increasing level of education of the population, high population density having a positive effect on the greening and economic vitality of the area and a higher level of GED. The negative effect of government regulation on GED suggests that government regulation alone cannot fundamentally improve GED levels and that further adjustments to government regulation are needed to make it work positively.
5.3 Regression results of a spatial econometric model
5.3.1 Spatial correlation
In this paper, we evaluate the spatial correlation of GED by calculating the Global Moran’ I index. The weight matrix uses the geographical distance matrix. The statistical test results and the Moran’s I index are shown in Table 5. The test findings show that Moran’s I index of China’s provinces is in the range of 0.2–0.4, and all p-values are less than or equal to 0.001, passing the significance test. Thus, it suggests that China’s GED is spatially correlated.
5.3.2 Spatial model selection
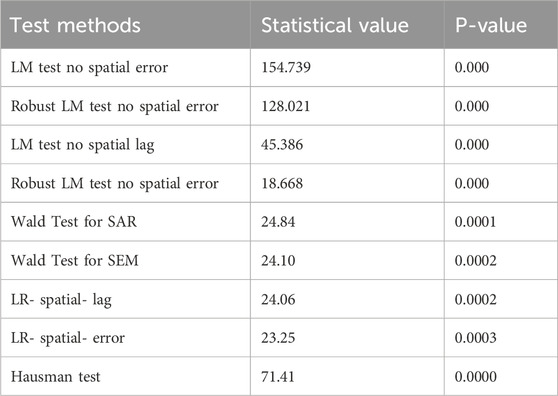
First, the LM test was done to decide whether to use the spatial error model (SEM), the spatial lag model (SAR), or the spatial Durbin model (SDM), and the results are given in Table 6, showing that SDM is appropriate because the results significantly reject SAR and SEM, with p-values of both the LM and the R-LM tests being 0.000. However, it is still necessary to check whether SDM degrades into SAR and SEM to be tested. The Wald and LR tests must be taken to determine if the model can be degraded to SAR and SEM. SDM is appropriate, as shown by the Wald and LR values evaluated to reject the initial hypothesis at the 1% level. Hausman’s test showed that the random effects hypothesis was rejected with a P-value of 0.00. Therefore, we choose a fixed effect, and through further effect tests, we find that the R2 of the double fixed effect is 0.5687, the R2 of the individual fixed effect is 0.8969, and the R2 of the time fixed effect is 0.1944. Therefore, the individual fixed effects of SDM should be adopted.
5.3.3 Regression results of SDM
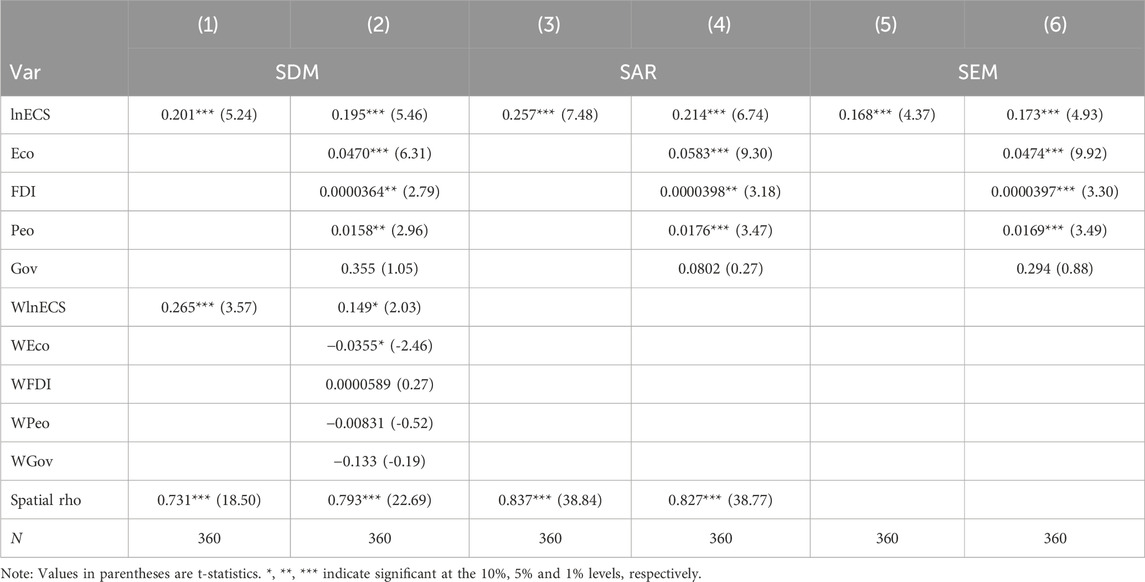
Table 7 displays the results of the spatial measures. The findings indicate that under the complete sample condition, the coefficient of ECS on GED is 0.201 and 0.195 and passes the 1% significant test, demonstrating that optimizing ECS can significantly improve the development of GED level, which verifies H1. Further examination reveals that the spatial coefficients of ECS are 0.265 and 0.149 and pass the significance test, which indicates that the ECS optimizing has a spillover impact over space, which proves H2. This means that there is a positive spatial spillover effect of ECS optimization on the development of GED, and the level of GED development in one province will be positively affected by the degree of ECS optimization in neighboring provinces, i.e., there is a “radiation effect” of the effect of ECS optimization on the development of GED. In China, burning fuel, particularly coal, is a significant contributor to pollution and carbon emissions, and the atmospheric mobility of such air pollutants tends to cause pollution on a regional scale, so when the energy consumption structure is transformed and upgraded, it will likewise lead to an increase in GED on a regional scale. To ensure the findings’ credibility, Table 7 also presents the results of SAR and SEM. The findings demonstrate that SDM has the highest R2, confirming that the model selection was sensible. Depending on the results of SEM and SAR, ECS also positively promotes GED.
The control variable estimation findings indicate that the coefficients of economic development level, foreign investment, and population density are significantly positive, which can improve GED. Government regulation has a beneficial but insignificant effect, proving that government environmental regulation has a limited impact on GED.
Direct and indirect effects are the two components of the spatial effects. Optimizing the ECS on the GED of the region has a direct effect, and the indirect effect is the impact of optimizing the ECS on the surrounding neighboring regions. As Table 8 illustrates, in terms of direct effect, the impact coefficient of optimized ECS on GED is 0.2789, indicating that the optimized ECS has a direct promotion effect on local GED, which further proves the conclusion that the adoption of sustainable energy sources can well improve local GED. In terms of indirect effect, the impact coefficient of optimized ECS on GED is 1.39. It passes the test at 1% level, indicating that the optimization of regional ECS effectively breaks down inter-regional barriers. With the help of cooperation, the optimization of ECS in neighboring regions also has a significant promotion effect on the region, which further proves the conclusion of H2. This is because inter-regional environmental, economic and social development develops together. Economic development generates spillover effects through the flow of science and technology, talents and factors, driving up the economic level of neighboring regions and improving social effects. Similarly, the optimization of a region’s environment can also play the role of positive externalities, and the optimization of the environmental carrying capacity is precisely through the positive externalities of both the economy and society and the environment to play its spillover effect, leading to the improvement of the surrounding areas of the college entrance examination. In terms of the overall effect, the total impact coefficient of the optimized EMS on the level of GED is 1.669, indicating that for every 1% increase in clean energy across the region, the level of GED will increase by 1.669%. In summary, the level of GED is positively impacted both directly and spatially by optimizing ECS.
Regarding additional control variables, the direct effect of economic development level and population density has passed the significant test. However, the indirect and total effects have not passed, indicating that the economic development level and population density mainly play their direct role. The significance of other control variables is not high, indicating that the spatial effect is still not apparent.
5.4 Robustness tests
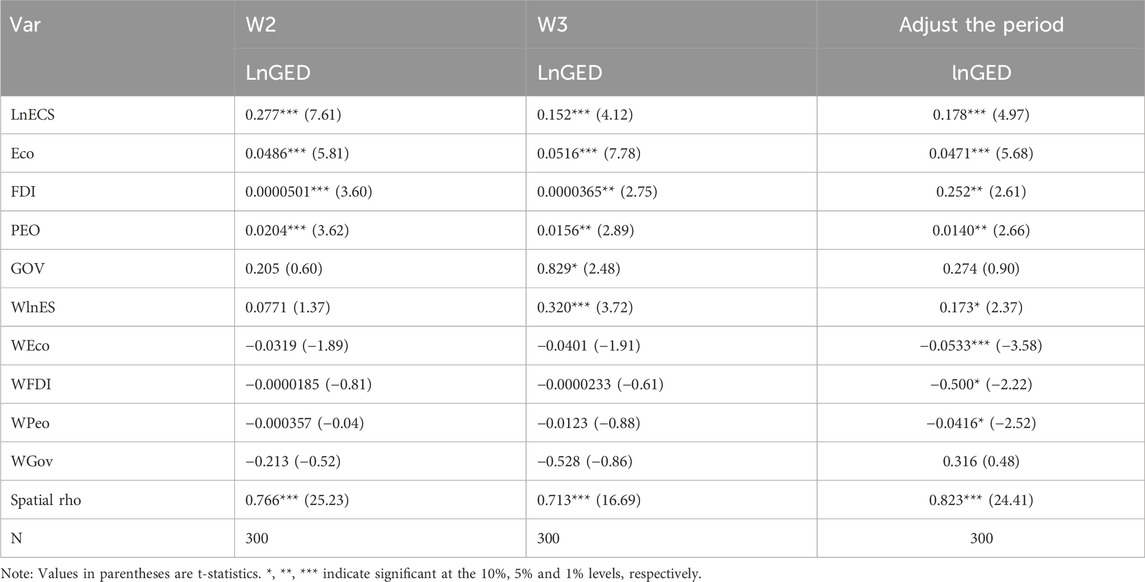
Different methods are used to continue the robustness test to confirm the result’s robustness. Table 9 displays the results. First, the matrix is changed. The model was tested by replacing the matrix with a spatial adjacency matrix and an economic distance matrix. Second, adjusting the study period. The epidemic stops socio-economic activities, and ecological construction and green economic development paths are affected to some extent, so this study excludes the data for 2020–2021.
It is visible that the significance and the positive and negative aspects of ECS remain consistent with the results above, proving the results’ robustness.
5.5 Further discussion
5.5.1 Regional heterogeneity analysis
Coal accounts for the largest share of energy consumption. Improving the ECS means consuming less fossil fuel and more clean energy. To further explore the empowering effect of ECS on GED under different fossil energy endowments, the median share of coal in each year is selected, regions above the median are defined as high fossil energy category A regions, and regions below the median are defined as low fossil energy category B regions.
According to Table 10, it can be seen that the ECS in class A areas can significantly enhance the GED of the region. In contrast, the effect of ECS on GED in class B areas is significantly less effective than in class A areas. The data demonstrates that a higher percentage of polluting industries is found in areas with a high share of fossil energy usage. The process of economic development requires the consumption of a large number of energy resources and the need to invest a large amount of money in crowding out the investment in clean industries and energy, which leads to a more significant impact of ECS on GED in regions with a high proportion of fossil energy consumption. In contrast, the environmental benefits of ECS are relatively small when regional fossil energy consumption is low. Therefore, it is essential to improve the ability of regions with a high share of coal to transform their energy consumption structure to exert a positive effect on GED.
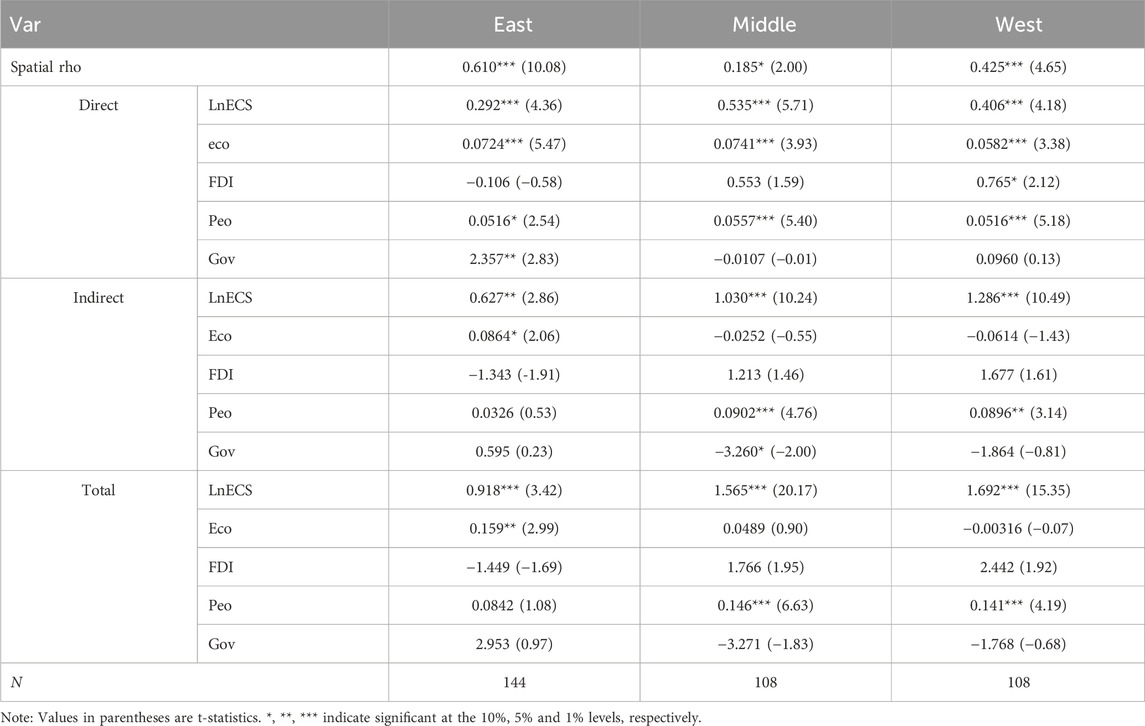
As a result of China’s significant regional variations in energy distribution, GED shows regional differences in spatial distribution. The study was carried out separately from the eastern, central, and western regions. Therefore, the three regions were tested for heterogeneity. Table 11 illustrates the impact of optimizing ECS on the region, which is presented as Central Region > Western Region > Eastern Region. However, optimizing ECS affects the neighboring regions and the total effect, presenting the Western region > Central region > Eastern region. From the perspective of the eastern region, the coefficients of the direct, indirect, and total effects of optimizing ECS are 0.292, 0.627, and 0.918. This shows that the eastern region, because of its economic and technological advantages, has a larger share of clean energy and a faster energy transition and upgrading. These energy transitions and upgrades have not only exerted environmental effects locally but have also had a positive impact on neighboring regions. In addition, the eastern region has a better foundation for a green economy, which creates a good synergy effect with the upstream and downstream industries in the neighboring regions. This synergistic effect not only promotes the development of local GED but also positively affects the development of GED in the neighboring regions. However, they are less than the regression coefficient values of national ECS optimization. Because the eastern region holds a strong industrial base, perfect technological facilities, faster economic development, and a higher level of GED, while the energy endowment is relatively scarce compared to the other regions, GED improvement mainly relies on perfect infrastructure and economic conditions, so the positive impact of optimizing ECS on the GED is relatively small. From the perspective of the central regions, the coefficients are 0.635, 1.030, and 1.565. As for the western regions, the coefficients are 0.406,1.286 and 1.692. The central and western regions are close to the regression coefficient value at the national level. It demonstrates that the positive effect of optimizing ECS on GED is higher in the central and western regions because the central region’s economic foundation, social innovation, and other capabilities are weaker. The driving effect is smaller, but the central and western regions are rich in resources, with a wide range of energy sources and superior geographic conditions, so the positive impact of optimizing ECS on the GED is stronger.
5.5.2 Impact mechanism analysis
To prevent the issues of multicollinearity and endogeneity, this study adopts a two-step method to analyze the mechanism. From the results of the baseline analysis (1) and (2) columns (Table 12), it can be seen that the coefficients are 1.205 and 1.120, and they are all significant. The ECS coefficients in columns (3) and (4) are 1.104 and 1.176, showing that the ECS improves the GED by optimizing the industrial structure. The upgrading of the ECS will lead to the optimization of the industrial structure, the optimization of the industrial structure reduce the share of polluting industries, and promote the development of emerging industries, which in turn become the driver of the coordinated economies and environments, then promote the level of GED. The study results show that optimizing ECS can improve GED through optimizing industrial structure. Therefore, H3 is verified.
5.5.3 Moderating effect analysis
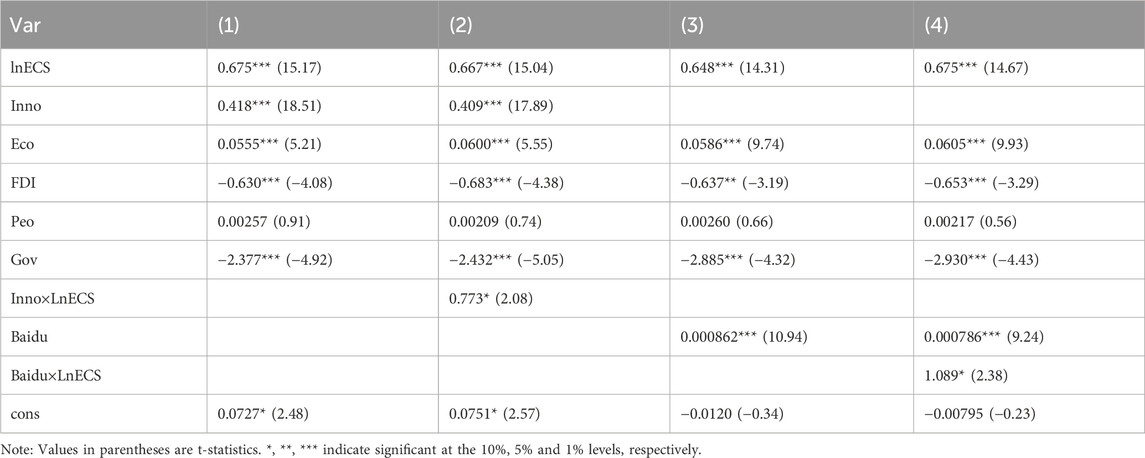
Through the above analysis, it is found that there is a significant positive correlation between ECS and GED. To further explore the relationship between the two, technological innovation and public concern are substituted into the model (5), and the interaction terms of ECS and moderating variables are added separately to observe whether there is a moderating effect.
The coefficient of the interaction term of technological innovation and ECS is 0.773 in column (2) of Table 13, and it is significant at the 5% level. Upgrading energy structures requires higher technical support, which drives technological innovation. Technological innovation improves production efficiency while reducing environmental pollution and accelerating the realization of greening, so technological innovation plays a positive moderating role in ECS promoting GED. The moderating effect of public attention on the effect of ECS on GED was 1.089 and significant at the 5% level. The public’s high demand for the living environment enables them to pay more attention to the environmental field. The public can monitor energy use and pollution emissions by businesses. They can pressure these businesses through public opinion and encourage the adoption of clean energy. Furthermore, the public can advocate for environmental improvements by presenting proposals to the government to enhance environmental policies and strengthen the impact of environmental corporate social responsibility on global economic development.
Compared with previous studies (Liu J. et al., 2023; Zhao X. et al., 2022) in exploring the relationship between energy and the green economy, this study constructs a comprehensive indicator system for green economic development, which includes three significant aspects: economic, social and environmental. In addition, it uses spatial econometric models to analyze the link between energy consumption structure and green economic development among regions, overcoming the limitations of existing literature (Khan Syed., et al., 2021; Lin B. et al.). At the same time, this study further analyzes the mechanism variables and regulating variables, which enriches the research content. Considering the resource endowment between regions and the spatial agglomeration type presented by GED, the spatial effects are decomposed from the east, middle and west of China.
6 Conclusions and recommendations
6.1 Analysis of findings
By analyzing how the ECS affects the GED, this paper draws several conclusions.
(1) The overall development of China’s GED shows a fluctuating upward trend. However, there is a regional development imbalance, and the development level of the eastern region is significantly higher than that of the central and western regions.
(2) The optimization of ECS contributes significantly to the improvement of GED, and this finding is still valid after robustness tests. Moreover, this positive effect is enhanced by innovation and public attention. The effect of optimizing ECS on GED has an apparent spatial spillover effect. The optimization of ECS in neighboring regions also promotes the increase of GED in the region, and this feature is more obvious in the central and western regions.
(3) Heterogeneity analysis shows that the direct effect of ECS optimization on GED is more pronounced in regions with a higher share of coal. The spatial effect of ECS optimization on GED is shown as Central Region > Western Region > Eastern Region. The total effect of the upgrading of the energy consumption structure and its impact on surrounding areas is shown in the following regions: Western region > Central region > Eastern region.
(4) The analysis of the mechanism effect shows that upgrading industrial structure is the main mechanism for optimizing ECS on GED.
6.2 Policy implications
(1) First, optimizing ECS is an essential factor in promoting GED. Therefore, it will be an inevitable choice to promote the development of ECS vigorously. The proportion of clean energy in production should be continuously increased. Local governments should strengthen the research and development and application of new energy technologies to improve energy utilization efficiency and reduce pollution emissions. Through financial and human resource support and cooperation with universities and research institutes, the innovation capacity of green technology can be improved. Through innovation, the role of clean energy in GED can be enhanced. In addition, publicity and education will lead the public to increase their supervision of environmental pollution, raise their concern for the green economy, and force enterprises to upgrade their energy structure.
(2) Coordinated the development of GED based on spatial relevance. When energy restructuring is done in different locations, the spatial relevance of the optimization of ESC needs to be considered. It should be possible for clean energy to move from the west to the east and for technology to move from the east to the west. Areas with higher GED levels should bring the driving effect into full play and take advantage of the economic foundation and sufficient environmental protection experience to build an inter-regional experience-sharing and synergistic green development model and realize the linked regional green economic development. Moreover, removing the administrative barriers between regions and encouraging coordinated regional GED is critical.
(3) Further optimize the joint energy consumption structure upgrade policy. The spillover effect of optimizing ECS shows that separate energy upgrading policies cannot fundamentally solve the problem, and regions should establish the concept of cooperative operation and strengthen policy communication and coordination. As a matter of fact, there are differences between regions in terms of economic degree and energy consumption. When implementing joint prevention and control policies, the main responsibility of green economy development should be taken into account. In particular, regions with a higher share of coal consumption and the central and western regions should not only take the main responsibility in pollution prevention and control but also be more obvious in the ECS effect on GED. The energy consumption structure transformation program should be implemented according to the local situation, and the higher level government should preside over the development of a common program for regional green economy development and continuously utilize the advantages of the system to promote the improvement of the GED level.
(4) Comprehensively understand the mechanism role of industrial structure optimization. Enterprises are responsible for adapting to environmental changes, eliminating polluting industries, changing their development mode, and protecting GED development. The government ought to consider enterprises’ unique circumstances, support the optimization and transformation of conventional industries, promote the fusion of industry and renewable energy, and accelerate the formation of new low-carbon environmental protection industries.
Although this study has effectively explored the effect of ECS on GED, there are some drawbacks. First, we take the whole country as the research object and lack research on specific regions. Therefore, future scholars can further broaden the relevance of the sample. Second, this study primarily focuses on the ECS mechanism on GED from the standpoint of optimizing industrial structure. There might be additional ways that ECS influences GED. Third, due to data limitations, we only conducted a macro-level study. In the future, scholars can use new research methods to conduct more analysis at the micro level.
Data availability statement
The original contributions presented in the study are included in the article/supplementary material, further inquiries can be directed to the corresponding author.
Author contributions
SZ: Investigation, Project administration, Supervision, Visualization, Writing–review and editing. JW: Conceptualization, Data curation, Formal Analysis, Methodology, Writing–original draft. JG: Methodology, Software, Writing–review and editing.
Funding
The authors declare financial support was received for the research, authorship, and/or publication of this article. This research was funded by the Shandong Province Undergraduate Teaching Reform Project (Z20220004), Jinan City-School Integration Project (JNSX2023036), National Natural Science Foundation of China (42201308), and Natural Science Foundation of Shandong Province, China (ZR2021QD127, ZR2021ME203).
Conflict of interest
The authors declare that the research was conducted in the absence of any commercial or financial relationships that could be construed as a potential conflict of interest.
Publisher’s note
All claims expressed in this article are solely those of the authors and do not necessarily represent those of their affiliated organizations, or those of the publisher, the editors and the reviewers. Any product that may be evaluated in this article, or claim that may be made by its manufacturer, is not guaranteed or endorsed by the publisher.
References
Ament, J. M., Freeman, R., Carbone, C., Vassall, A., and Watts, C. (2020). An empirical analysis of synergies and tradeoffs between sustainable development goals. Sustainability 12 (20), 8424. doi:10.3390/su12208424
Castrejon-Campos, O. (2022). Evolution of clean energy technologies in Mexico: a multi-perspective analysis. Energy Sustain. Dev. 67, 29–53. doi:10.1016/J.ESD.2022.01.003
Chang, L., Taghizadeh-Hesary, F., and Mohsin, M. (2023). Role of artificial intelligence on green economic development: joint determinates of natural resources and green total factor productivity. Resour. Policy 82, 103508. doi:10.1016/j.resourpol.2023.103508
Chen, L., Li, K., Chen, S., Wang, X., and Tang, L. (2021). Industrial activity, energy structure, and environmental pollution in China. Energy Econ. 104, 105633. doi:10.1016/j.eneco.2021.105633
D’Amato, D., Droste, N., Allen, B., Kettunen, M., Lähtinen, K., Korhonen, J., et al. (2017). Green, circular, bio-economy: a comparative analysis of sustainability avenues. J. Clean. Prod. 168, 716–734. doi:10.1016/j.jclepro.2017.09.053
Ding, J., Liu, B., and Shao, X. (2022). Spatial effects of industrial synergistic agglomeration and regional green development efficiency: evidence from China. Energy Econ. 112, 106156. doi:10.1016/j.eneco.2022.106156
Dong, C., and Yang, Y. (2022). Construction of the evaluation index system of China’s green economy development level-based on the dual model of entropy value method and coefficient of variation method. Int. J. New Dev. Eng. Soc. 64. doi:10.25236/IJNDES.2022.060406
Dong, F., Li, Y., Qin, C., and Sun, J. (2021). How industrial convergence affects regional green development efficiency: a spatial conditional process analysis. J. Environ. Manag. 300, 113738. doi:10.1016/j.jenvman.2021.113738
Dong, F., Zhang, Y., Zhang, X., Hu, M., Gao, Y., and Zhu, J. (2021). Exploring ecological civilization performance and its determinants in emerging industrialized countries: a new evaluation system in the case of China. J. Clean. Prod. 315, 128051. doi:10.1016/j.jclepro.2021.128051
Dzwigol, H., Kwilinski, A., Lyulyov, O., and Pimonenko, T. (2023). The role of environmental regulations, renewable energy, and energy efficiency in finding the path to green economic growth. Energies 167, 3090. doi:10.3390/en16073090
Fang, W., Liu, Z., and Putra, A. R. S. (2022). Role of research and development in green economic growth through renewable energy development: empirical evidence from South Asia. Renew. Energy 194, 1142–1152. doi:10.1016/j.renene.2022.04.125
Feng, Y., Yu, X., Chiu, Y. H., and Chang, T. H. (2019). Dynamic linkages among economic development, energy consumption, environment, and health sustainable in EU and Non-EU Countries. Healthcare 7 (4), 138. doi:10.3390/healthcare7040138
Gao, P., Wang, Y., Zou, Y., Su, X., Che, X., and Yang, X. (2022). Green technology innovation and carbon emissions nexus in China: does industrial structure upgrading matter. Frontiers in Psychology 13, 951172. doi:10.3389/fpsyg.2022.951172
Guo, S., and Diao, Y. (2022). Spatial-temporal evolution and driving factors of coupling between urban spatial functional division and green economic development: evidence from the Yangtze River Economic Belt. Frontiers in Environmental Science 10, 2312. doi:10.3389/fenvs.2022.1071909
Guo, X., Shen, Y., Chen, D., Zhao, L., and Tian, X. (2021). Quantification of reduced disease burden resulting from air quality improvement by clean energy deployment in Hebei Province, China. Energy Policy 159, 112584. doi:10.1016/j.enpol.2021.112584
He, L., Zhang, L., Zhong, Z., Wang, D., and Wang, F. (2018). Green credit, renewable energy investment, and green economy development: empirical analysis based on 150 listed companies of China. Journal of Cleaner Production 208, 363–372. doi:10.1016/j.jclepro.2018.10.119
Hua, M., Li, Z., Zhang, Y., and Wei, X. (2024). Does green finance promote green transformation of the real economy? Research in International Business and Finance 67, 102090. doi:10.1016/j.ribaf.2023.102090
Ievdokymov, V., Oliinyk, O., Grytsyshen, D., Ksendzuk, V., and Nord, G. (2018). The new geological epoch, “anthropocene,” as a result of human economic activity. Sciendo 21, 131–149. doi:10.2478/CER-2018-0023
Jiang, T. (2022). Mediating effects and moderating effects in causal inference. China Ind. Econ 5, 100–120. doi:10.19581/j.cnki.ciejournal.2022.05.005
Kim, K. J., Lee, H., and Koo, Y. (2020). Research on local acceptance cost of renewable energy in South Korea: a case study of photovoltaic and wind power projects. Energy Policy 144, 111684. doi:10.1016/j.enpol.2020.111684
Kunanuntakij, K., Varabuntoonvit, V., Vorayos, N., Panjapornpon, C., and Mungcharoen, T. (2017). Thailand Green GDP assessment based on environmentally extended input-output model. Journal of Cleaner Production 167, 970–977. doi:10.1016/j.jclepro.2017.02.106
Lee, C. C., Zhang, J., and Hou, S. (2023). The impact of regional renewable energy development on environmental sustainability in China. Resources Policy 80, 103245. doi:10.1016/j.resourpol.2022.103245
Li, B. (2023). The role of financial markets in the energy transition: an analysis of investment trends and opportunities in renewable energy and clean technology. Environmental Science and Pollution Research 3043, 97948–97964. doi:10.1007/s11356-023-29014-6
Li, C., Lin, T., Chen, Y., Yan, Y., and Xu, Z. (2022). Nonlinear impacts of renewable energy consumption on economic growth and environmental pollution across China. Journal of Cleaner production 368, 133183. doi:10.1016/j.jclepro.2022.133183
Li, J., Chen, L., Chen, Y., and He, J. (2022). Digital economy, technological innovation, and green economic efficiency—empirical evidence from 277 cities in China. Managerial and Decision Economics 43 (3), 616–629. doi:10.1002/mde.3406
Li, L., Hong, X., and Wang, J. (2020). Evaluating the impact of clean energy consumption and factor allocation on China’s air pollution: a spatial econometric approach. Energy 195, 116842. doi:10.1016/j.energy.2019.116842
Liang, L., Huang, C., and Hu, Z. (2023). Industrial structure optimization, population agglomeration, and carbon emissions—empirical evidence from 30 provinces in China. Frontiers in Environmental Science 10, 1078319. doi:10.3389/fenvs.2022.1078319
Lin, B., and Xu, C. (2024). Reaping green dividend: the effect of China's urban new energy transition strategy on green economic performance. Energy 286, 129589. doi:10.1016/J.ENERGY.2023.129589
Lin, B., and Zhou, Y. (2022). Measuring the green economic growth in China: influencing factors and policy perspectives. Energy 241, 122518. doi:10.1016/j.energy.2021.122518
Liu, J., Feng, Q., Zhang, T., and Liu, H. (2023). Dynamics of green economic development in countries joining the belt and road initiative: is it driven by green investment transformation? Journal of environmental management118969-118969 347, 118969. doi:10.1016/J.JENVMAN.2023.118969
Liu, W., Liu, M., Li, Y., and Liu, T. (2024). How to promote China's green economic development? The combination effects of consumption tax and carbon tax policies. Energy and Environment 35 (3), 1374–1395. doi:10.1177/0958305X221140581
Liu, Y., and Dong, F. (2021). How technological innovation impacts urban green economy efficiency in emerging economies: a case study of 278 Chinese cities. Resources, Conservation and Recycling 169, 105534. doi:10.1016/j.resconrec.2021.105534
Meng, S., Sun, R., Guo, F., and Deng, Y. (2023). The mechanism of renewable energy consumption, technological innovation and carbon productivity—an empirical study of Chinese data. Environmental Science and Pollution Research 308, 20673–20687. doi:10.1007/s11356-022-23557-w
Mingxing, L., Ashraf, M. S., Zhiqiang, M., Ashraf, R. U., Usman, M., and Khan, I. (2023). Adaptation to globalization in renewable energy sources: environmental implications of financial development and human capital in China. Frontiers in Environmental Science 10, 1060559. doi:10.3389/fenvs.2022.1060559
Niu, F., and Jiang, Y. (2021). Economic sustainability of China’s growth from the perspective of its resource and environmental supply system: national scale modeling and policy analysis. Journal of Geographical Sciences 318, 1171–1186. doi:10.1007/s11442-021-1891-3
Nwozor, A., Oshewolo, S., Owoeye, G., and Okidu, O. (2021). Nigeria's quest for alternative clean energy development: a cobweb of opportunities, pitfalls and multiple dilemmas. Energy Policy 149, 112070. doi:10.1016/j.enpol.2020.112070
Pan, W., Pan, W., Hu, C., Tu, H., Zhao, C., Yu, D., et al. (2019). Assessing the green economy in China: an improved framework. Journal of cleaner production 209, 680–691. doi:10.1016/j.jclepro.2018.10.267
Pan, X., Li, M., Pu, C., and Xu, H. (2021). Study on the industrial structure optimization under constraint of energy intensity. Energy and Environment 321, 134–151. doi:10.1177/0958305X20921592
Patzold, M. (2020). Tackling global environmental challenges through ICT [mobile radio]. IEEE Vehicular Technology Magazine 15 (3), 9–15. doi:10.1109/MVT.2020.3002635
Qiu, Y., Wang, H., and Wu, J. (2023). Impact of industrial structure upgrading on green innovation: evidence from Chinese cities. Environmental Science and Pollution Research 302, 3887–3900. doi:10.1007/s11356-022-22162-1
Shi, Y., and Yang, Bo (2024). Study on the impact of green digital finance on low-carbon transition of energy consumption structure under multidimensional perspective-empirical evidence from China. Energy Strategy Reviews101445- 54, 101445. doi:10.1016/J.ESR.2024.101445
Su, X., Liu, G., Xu, Y., Ge, W., Shen, B., Ran, Q., et al. (2022). How multi-dimensional local government competition impacts green economic growth? A case study of 272 Chinese cities. Frontiers in Environmental Science 10, 911004. doi:10.3389/fenvs.2022.911004
Su, Y., and Fan, Q. M. (2022). Renewable energy technology innovation, industrial structure upgrading and green development from the perspective of China's provinces. Technological Forecasting and Social Change 180, 121727. doi:10.1016/j.techfore.2022.121727
Ul-Haq, Z., Mehmood, U., Tariq, S., and Mariam, A. (2023). Defining the role of renewable energy, economic growth, globalization, energy consumption, and population growth on PM2. 5 concentration: evidence from South Asian countries. Environmental Science and Pollution Research 3014, 40008–40017. doi:10.1007/s11356-022-25046-6
Wang, S., Wang, X., and Lu, B. (2020). Is resource abundance a curse for green economic growth? Evidence from developing countries. Resources Policy 75, 102533. doi:10.1016/j.resourpol.2021.102533
Wang, Y., and He, L. (2022). Can China's carbon emissions trading scheme promote balanced green development? A consideration of efficiency and fairness. Journal of Cleaner Production 367, 132916. doi:10.1016/j.jclepro.2022.132916
Wang, Y., and Wang, L. (2022). Study on the effect of industrial structure transformation on regional ecological efficiency in ecological economic zone under carbon peaking and carbon neutrality strategy. Frontiers in Environmental Science 10, 1078406. doi:10.3389/fenvs.2022.1078406
Wei, C., Ni, J., and Shen, M. (2009). Empirical analysis of provincial energy efficiency in China. China and World Economy 17 (5), 88–103. doi:10.1111/j.1749-124X.2009.01168.x
Wei, Y., Li, Y., Liu, X., and Wu, M. (2020). Sustainable development and green gross domestic product assessments in megacities based on the emergy analysis method—a case study of Wuhan. Sustainable Development 281, 294–307. doi:10.1002/sd.2003
Wu, L., Zhu, C., Cheng, M., Dai, W., and Wang, G. (2023). Should energy efficiency be improved? The impact of energy efficiency improvements on green economic growth-Evidence from China. Frontiers in Energy Research 11, 1249092. doi:10.3389/fenrg.2023.1249092
Wu, M., Liu, Y., Xu, Z., Yan, G., Ma, M., Zhou, S., et al. (2021). Spatio-temporal dynamics of China’s ecological civilization progress after implementing national conservation strategy. Journal of Cleaner Production 285, 124886. doi:10.1016/j.jclepro.2020.124886
Wu, M., Wu, J., and Zang, C. (2021). A comprehensive evaluation of the eco-carrying capacity and green economy in the Guangdong-Hong Kong-Macao Greater Bay Area, China. Journal of Cleaner Production 281, 124945. doi:10.1016/j.jclepro.2020.124945
Xiao, H., Ma, Z., Zhang, P., and Liu, M. (2019). Study of the impact of energy consumption structure on carbon emission intensity in China from the perspective of spatial effects. Natural Hazards 99, 1365–1380. doi:10.1007/s11069-018-3535-1
Xin, Z., Mandeep, M., Ma, X., Rao, A., and Shang, Y. (2022). Impacts of environmental regulations on green economic growth in China: new guidelines regarding renewable energy and energy efficiency. Renewable Energy728-742 187, 728–742. doi:10.1016/J.RENENE.2022.01.076
Xu, G., Schwarz, P., and Yang, H. (2020). Adjusting energy consumption structure to achieve China's CO2 emissions peak. Renewable and Sustainable Energy Reviews 122, 109737. doi:10.1016/j.rser.2020.109737
Yang, L., Ma, Z., Yin, J., Li, Y., and Lv, H. (2023). The evolution and determinants of Chinese inter-provincial green development efficiency: an MCSE-DEA-Tobit-based perspective. Environmental Science and Pollution Research 3018, 53904–53919. doi:10.1007/s11356-023-25894-w
Yang, W., Chen, Q., Guo, Q., and Huang, X. (2022). Towards sustainable development: how digitalization, technological innovation, and green economic development interact with each other. International Journal of Environmental Research and Public Health 1919, 12273. doi:10.3390/ijerph191912273
Yang, X., Wang, S., Zhang, W., Li, J., and Zou, Y. (2016). Impacts of energy consumption, energy structure, and treatment technology on SO2 emissions: a multi-scale LMDI decomposition analysis in China. Applied energy 184, 714–726. doi:10.1016/j.apenergy.2016.11.013
Yang, Y. (2023). Measurement and analysis of China's green economic development level—evidence from provincial panel data. Academic Journal of Business and Management 18. doi:10.25236/AJBM.2023.051822
Zerong, Li, Li, L., and Hui, Mo (2024). Fostering green economic growth through sustainable management of natural resources. Resources Policy104867- 91, 104867. doi:10.1016/J.RESOURPOL.2024.104867
Zhang, M., and Li, B. (2022). How do R&D inputs affect green economic development? Evidence from China. Technology Analysis and Strategic Management 3412, 1353–1368. doi:10.1080/09537325.2021.1959030
Zhang, T., Chiu, Y. H., Li, Y., and Lin, T. Y. (2018). Air pollutant and health-efficiency evaluation based on a dynamic network data envelopment analysis. International journal of environmental research and public health 15 (9), 2046. doi:10.3390/ijerph15092046
Zhang, X., Hu, H., Zhang, R., and Deng, S. (2014). Interactions between China׳ s economy, energy and the air emissions and their policy implications. Renewable and Sustainable Energy Reviews 38, 624–638. doi:10.1016/j.rser.2014.07.002
Zhang, Y., Zhou, R., and Chen, N. (2023). An empirical study on coordinated development of energy consumption structure and green total factor productivity under spatial interaction. Economic research–Ekonomska istraživanja 36 (1), 1226–1246. doi:10.1080/1331677X.2022.2084436
Zhao, X., Ma, X., Shang, Y., Yang, Z., and Shahzad, U. (2022). Green economic growth and its inherent driving factors in Chinese cities: based on the Metafrontier-global-SBM super-efficiency DEA model. Gondwana Research 106, 315–328. doi:10.1016/j.gr.2022.01.013
Zioło, M., Bąk, I., Spoz, A., Oesterreich, M., and Niedzielski, P. R. K. (2023). Relationship between sustainable development and financial development from the perspective of the European green economy. Fuzzy approach. Frontiers in Environmental Science 11. doi:10.3389/fenvs.2023.1244119
Keywords: China, energy consumption structure, green economic development, spatial durbin model, mechanism analysis
Citation: Zhang S, Wang J and Guan J (2024) How does the energy consumption structure affect the green economic development? A spatial impact analysis. Front. Environ. Sci. 12:1412612. doi: 10.3389/fenvs.2024.1412612
Received: 05 April 2024; Accepted: 14 August 2024;
Published: 26 September 2024.
Edited by:
Jiaoyue Wang, Chinese Academy of Sciences (CAS), ChinaReviewed by:
Anlu Zhang, Huazhong Agricultural University, ChinaBingnan Guo, Jiangsu University of Science and Technology, China
Hong-Dian Jiang, China University of Geosciences, China
Copyright © 2024 Zhang, Wang and Guan. This is an open-access article distributed under the terms of the Creative Commons Attribution License (CC BY). The use, distribution or reproduction in other forums is permitted, provided the original author(s) and the copyright owner(s) are credited and that the original publication in this journal is cited, in accordance with accepted academic practice. No use, distribution or reproduction is permitted which does not comply with these terms.
*Correspondence: Shumin Zhang, emhhbmdzbUBzZHVmZS5lZHUuY24=
 Shumin Zhang
 Jing Wang
 Jiawei Guan