 Youcai Kang
 Kai Zhang2
 Lianchun Zhao
- 1Key Laboratory of Eco-Function Polymer Materials of Ministry of Education, Key Laboratory of Polymer Materials of Gansu Province, College of Chemistry and Chemical Engineering, Northwest Normal University, Lanzhou, China
- 2Ministry of Education Key Laboratory for Biodiversity Science and Ecological Engineering, Institute of Biodiversity Science, School of Life Sciences, Fudan University, Shanghai, China
- 3Department of Tourism Management, Xinzhou Teachers University, Xinzhou, China
Semiarid regions play a pivotal role in global ecosystem and environmental governance. Changing environment (climate and land use variation) has led to the disruption of hydrology in semi-arid regions and ecological degradation in some area. Understanding their hydrological response to changing environments is crucial for ecological rehabilitation and optimal water resource allocation. This research, conducted in a Chinese semiarid watershed, integrates multi-field models about hydrology, meteorology and geography to investigate hydrological processes in typical hydrological years. The results indicate that the climate in this region is drying, and the likelihood of extreme weather events is increasing with global warming. Projecting changes from 2010 to 2060, 9.21% of grassland converting to 5.63% of forest and 3.58% of gully built-up land. As a result, the flood peak increases by 22.99% in typical drought years, while it decreases by 36.77% in normal years. Based on our analysis of the rainfall-runoff process in typical drought and normal years, we identify two distinct effects: the “local rainfall-runoff effect” and the “global rainfall-runoff effect”, respectively. However, in typical wet years, the streamflow state is primarily controlled by intense and concentrated precipitation. This research provides insights into the effect of ecological restoration and typical climate variations on hydrological cycle in semiarid regions, thus contributing to more informed decision-making in environmental management and water resource planning.
1 Introduction
The semiarid regions, as transition zones between wet and dry, are vital regions for ecological management (Zeng et al., 1999; Rotenberg and Yakir, 2010), covering 15% of the world’s territory (Li et al., 2015). These regions are particularly sensitive to climate shift and land-use variation due to the infertile soils and fragile ecosystems (Li et al., 2016; Zhou et al., 2016; Huang et al., 2017). Field observations and model simulations alike indicate that semiarid regions respond more significantly to global warming (Huang et al., 2016). For instance, during the boreal cold season from 1901 to 2009, the warming observed in global semiarid regions exceeded the global average 1.13°C, reaching 1.53°C (Huang et al., 2012). With the projected increase in precipitation and potential evapotranspiration in drylands, these regions face significant challenges (Bates et al., 2008; Scheff and Frierson, 2014; Zhao et al., 2014; Zhao and Dai, 2017). Additionally, their vulnerability to human activities is compounded by water scarcity and sparse vegetation. The rapid population growth and intensifying human activities further strain the ecosystems of semiarid regions, making them a critical focus for ecological management and restoration efforts (Nyamadzawo et al., 2012; Hoover et al., 2015).
The Loess Plateau (LP), renowned for severe soil erosion, occupies a significant portion of China’s north-central region. The arid, semiarid, and semi-humid zones constitute 15%, 53%, and 32% of the LP, respectively, based on the aridity index. Historically, the LP was a lush plain, boasting abundant water resources, lush grasslands, dense forests, and fertile soil (Zhao et al., 2013). However, by the late 20th century, soil erosion and intense human activities had transformed over 70% of the region into hilly-gully landscapes, with natural vegetation coverage dwindling to just 31.6% (Shi and Shao, 2000; Tsunekawa et al., 2014). Alarmingly, the erodible loess soil contributes ∼90% of the sediment in the Yellow River (Yu et al., 2020), posing a great threat to the lives and property of downstream communities. To address these challenges, the Chinese government has embarked on a series of environmental rehabilitation initiatives since 1999. These include the “Grain for Green Program” (GFGP) (DELANG and Yuan, 2015), the “Gully Land Consolidation Project” (Kang et al., 2021), and land evaluation and replanning efforts (Chen et al., 2003). These measures have obviously altered the land use patterns in the LP. Specifically, agricultural land has shrunk by 28.3%, while grassland and forestland have expanded by 12.4% and 5.0%, respectively. Additionally, urban development areas have grown by 10.8% (Yu et al., 2020). These rehabilitation efforts have effectively mitigated soil erosion and restored some ecological functions in the LP. However, the increased vegetation cover has also altered the hydrological cycle of the region. The expanded vegetation has resulted in increasing rainfall interception and infiltration, reducing surface runoff (McVicar et al., 2007; Zhao et al., 2017). Coupled with global warming, changes in rainfall patterns and temperature have further influenced evapotranspiration, water yield, and soil moisture in the LP. These interconnected processes pose complex challenges for sustainable water resource management and ecological rehabilitation in the semiarid regions of the LP (Zhao et al., 2018; Ge et al., 2020).
Extreme weather and climatic events were relatively rare, but they have become increasingly frequent and devastating in the context of climate variation and population growth (IPCC, 2023). Numerous studies analyzing extreme indices have revealed a global trend towards a rise in the occurrence of extremely wet days, along with notable increases in rainfall intensity, particularly in semiarid regions (Barry et al., 2018; Di Capua and Rahmstorf, 2023; Otto, 2023). Intermittent flooding or prolonged drought events have profound impacts on sustainable socio-economic development and efforts towards regional vegetation restoration (Mokrech et al., 2008; Adhikari et al., 2010; Zhao et al., 2011; Hao et al., 2012). On the LP, even in areas with seemingly successful ecological restoration, extreme precipitation has triggered severe soil erosion. For instance, the prolonged and intense rainfall during July 2013 in the Yanhe watershed (study area in this research) caused flooding hazards, resulting in 6,645 injuries and property damage worth 27 million. Additionally, water scarcity poses a significant obstacle to environmental restoration efforts in the LP. The formation of a soil dried layer is a negative consequence of the GFGP (Jia et al., 2019). In some man-made mature forest, trees growing to only 20% of their regular height due to water scarcity (Chen et al., 2015). The imbalance between water surplus and deficit also significantly impacts streamflow patterns, influenced by climate shifts and land-use variations.
To investigate the hydrological effect of climate variation and land-use modification in semiarid regions, this study focused on the Yanhe watershed, a representative semiarid area within the LP, as the study area. Firstly, we analyzed the temperature, precipitation and streamflow in the last 50 years by Mann-Kendall trend test. Besides, the standard precipitation evapotranspiration index (SPEI) was utilized to categorize the hydrologic years. And then, the Cellular Automata Markov chain (CA-Markov) was employed to forecast the spatial distribution of landscapes in 2060 (China’s carbon-neutral target year). By leveraging the classified representative hydrological years and the predicted land-use layout for 2060, the Soil and Water Assessment Tool (SWAT) was engaged to evaluate the influence of vegetation restoration and urban sprawl on streamflow patterns across a range of hydrological conditions. This comprehensive approach provides a profound insight into the hydrological characteristics under varying climatic and land-use conditions, serving as a crucial reference for environmentally sustainable and economically viable development strategies in semi-arid regions.
2 Materials and methods
2.1 Study area in a semiarid region
The Yanhe watershed, situated in the western reaches of China’s LP, serves as a representative semiarid region (Figure 1). Spanning an area of 7,634 km2, it exhibits a remarkable altitudinal range, varying from 495 to 1,793 m. Within this vast territory, approximately 45% of the landmass comprises gentle slopes ranging from 0 to 25°, while the remaining 55% features steeper slopes exceeding 25°. Over the period of 1970–2019, the Yanhe watershed received an average annual precipitation of 477 mm, with a significant concentration of 60% of this rainfall occurring during the flood season, which spans from July to September. The region’s land-use pattern is diverse, encompassing farmland, grassland, forest, urban areas, and waterbodies. Notably, the Ganguyi gauging station, positioned downstream, oversees a significant portion of the watershed, encompassing approximately 77% of its total area. Drawing from extensive long-term observation data, it is recorded that the mean annual streamflow at the Ganguyi station has been 1.83 × 10⁸ m3 over the past 50 years.
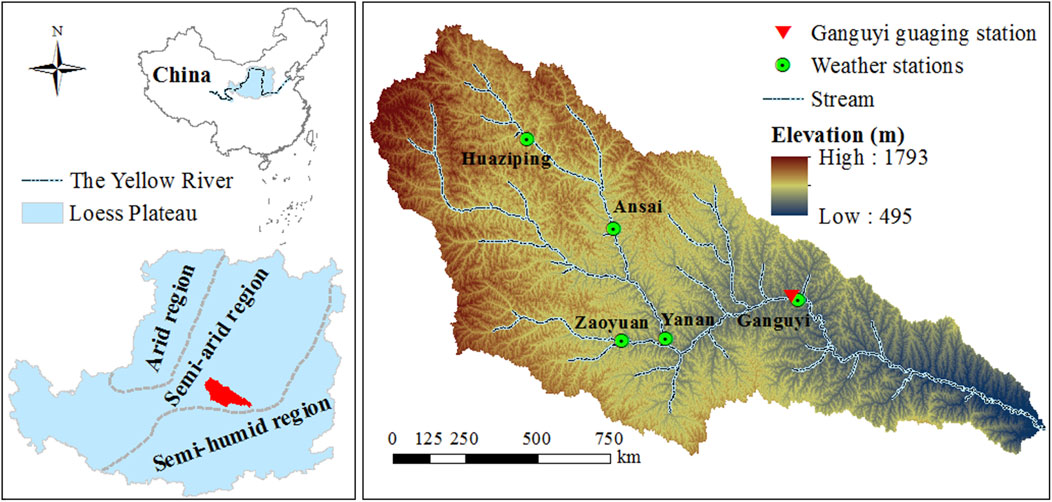
Figure 1. Site of the Yanhe watershed and its hydrometeorological stations.
2.2 Data sources and processing
The daily meteorological data during 1970–2019 were collected from five weather stations situated within the Yanhe watershed. This data contained precipitation, temperature, solar radiation, humidity, and wind speed. The climate data can reflect the characteristics of climate change during the study period and drive the hydrological model. Additionally, the observed monthly streamflow data from the Ganguyi gauging station, crucial for trend analysis and SWAT model calibration and validation, were accessed from the National Earth System Science Data Center (http://www.geodata.cn) and the Geographic Data Platform of Peking University (https://geodata.pku.edu.cn). Furthermore, to predict land-use patterns and power the SWAT model in the Yanhe watershed, a digital elevation model (DEM) with a high resolution of 30 m × 30 m was procured from the Geospatial Data Cloud (http://www.gscloud.cn). Land-use raster data, also at a resolution of 30 m × 30 m, for the years 1990, 2000, and 2010, were provided by the National Cryosphere Desert Data Center (http://www.ncdc.ac.cn). Additionally, soil properties data with a resolution of 1,000 m × 1,000 m were sourced from the Harmonized World Soil Database (HWSD). This database offers an extensive investigation of global soil attributes at a depth of 1.0 m, including soil texture, organic carbon content, bulk density and others, and the soil properties data can provide a foundation for the localized SWAT model. Utilizing these comprehensive datasets, the hydrological processes in representative hydrologic years within the Yanhe watershed were researched, leveraging territorial data and multi-field coupling models (Figure 2).
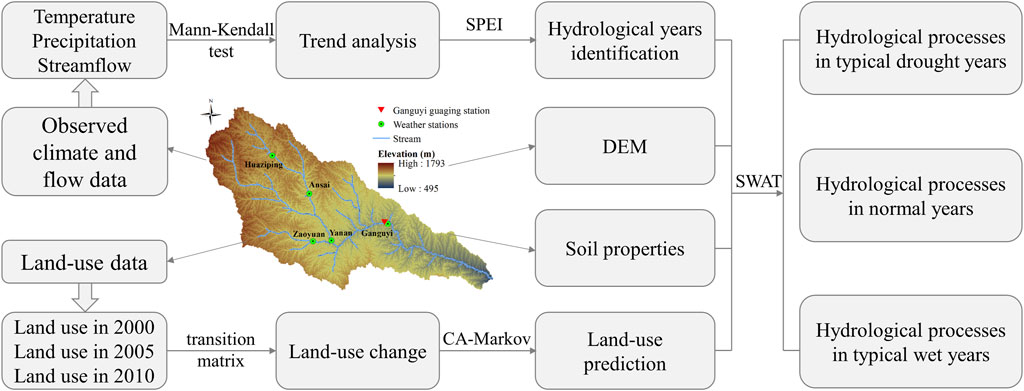
Figure 2. Data analysis and model building processes in the Yanhe watershed.
2.3 Research methods
2.3.1 Mann-Kendall test
The Mann-Kendall test is a widely utilized and globally recommended non-parametric approach by the World Meteorological Organization for trend analysis in hydrology and meteorology. Its popularity stems from the fact that it does not assume any specific distribution of samples and is insensitive to seasonality (Van Belle and Hughes, 1984; Nalley et al., 2013). In conducting this test, the null hypothesis (H0) assumes that the test variables exhibit no trend during the specified period. Conversely, the alternative hypothesis (H1) rejects H0 in the presence of a monotonic trend within the test period. The statistical procedures involved in the Mann-Kendall test are outlined as follows (Mann, 1945; Da Silva et al., 2015):
where the target statistics S is to assess trends in a time series, n denotes the total number of data points in the series, ranging from 1 to n; Xj and Xi represent the respective values at positions j and i within the time series (i < j); sgn (Xj−Xi) indicates the difference between Xi and Xj:
The solution to the series data variance is:
where Var(S) represents the normalized measure of the variance of S; p means the total group of nodes; ti is the time range at the i node. When the number of samples are over 30 (n > 30), the standard normal statistical variable ZS is:
In the bilateral trend test, if |ZS| is greater than Z1−α/2 within a given confidence level of α, it indicates the sample data have a significant trend in the testing period, which rejects the null hypothesis. If ZS > 0, it means that the sample data have a significant growth trend in testing period, while if ZS < 0, the sample data exhibit a significant downward trend during the testing time. When the |ZS| is greater than 1.64 and 2.32, which means the variable is significant monotonicity at the 95% and 99% levels, respectively.
2.3.2 Standard precipitation evapotranspiration index
The SPEI, as a widely employed method for assessing drought conditions, relies on the trade-off between precipitation and potential evapotranspiration (Vicente-Serrano et al., 2010). Consequently, it effectively mirrors the consequences of global warming on drought patterns (Vicente-Serrano et al., 2010). Furthermore, the SPEI exhibits flexibility in adapting to the diverse time scales characteristic of drought events. (Bohn and Piccolo, 2018).
The SPEI possesses a mean value of 0 and a standard deviation of 1, serving as a reliable metric for analyzing drought characteristics. Based on factors such as intensity, magnitude, duration, and frequency, water surplus and deficit are categorized into seven distinct groups (Tan et al., 2015; Bohn and Piccolo, 2018). For the purpose of studying hydrological processes across various hydrologic years, these seven categories are further consolidated into three representative types (Table 1).
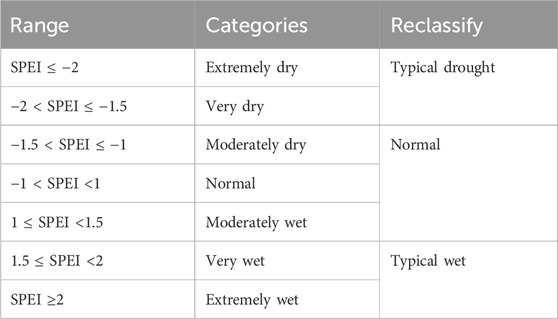
Table 1. Standard precipitation evapotranspiration index (SPEI) classification.
2.3.3 Cellular Automata Markov chain
The CA-Markov model integrates the Cellular Automata (CA) and Markov Chain (MC) models, both being discrete dynamic models that operate in terms of time and state. The Markov Chain, as a stochastic model, characterizes the transition probabilities of a sequence of random variables across discrete time intervals (Sang et al., 2011; Du et al., 2012). On the other hand, CA performs spatial operations where each cell’s state at time t + 1 is influenced by its neighboring cells at time t (Ye and Bai, 1969; Mohamed and Worku, 2020). In landscapes encompassing multiple land-use categories, land-use changes exhibit the Markov property. Therefore, a land-use transition matrix is constructed to capture the probabilities of each land-use type transforming into any other type. This matrix serves as a valuable tool in predicting future land-use changes.
However, the Markov chain model ignores the significant influence of geomorphology on land use and lacks the ability to effectively capture the dynamics of land-use alternation. In contrast, the CA-Markov model leverages the spatial operation capabilities of CA and the transition probability analysis of the Markov chain, enabling it to forecast spatially explicit land-use variation over a specified period. This combined approach provides a more comprehensive and accurate understanding of land-use dynamics, considering both the spatial context and the probabilistic nature of land-use transitions (Mondal and Southworth, 2010).
The hybrid CA-Markov model was implemented using the IDRISI software platform (Eastman, 1999). Prior to predicting the land use in the Yanhe watershed for the year 2060, the model’s accuracy was rigorously tested by comparing real and simulated land-use layouts for the year 2010. Initially, a Markov transition matrix was constructed using land-use maps from 1990 to 2000. This matrix captured the probability of each land-use type transitioning to any other type. Additionally, ancillary images depicting highways, motorways, railways, waterbodies, slopes, and altitudes were employed as part of a multi-criteria decision-making process to generate a transition suitability image collection. This collection provided a spatial representation of the suitability of each land-use type. Subsequently, leveraging the real land-use layout of 2000, the CA-Markov model was utilized to generate a simulated land-use map.
2.3.4 Soil and water assessment tool
SWAT is a semi-distributed, basin-scale hydrological model that incorporates various data sources to simulate the hydrological processes within a research watershed (Gassman et al., 2007; Kang et al., 2021). It relies on daily meteorological data, along with land-use maps and soil attribute data. The model divides the entire watershed into multiple subbasins and further subdivides them into hydrological response units, which share similar land-use categories, management practices, and soil properties (Neitsch et al., 2011). This localized SWAT model is capable of simulating hydrological conditions over extended periods, providing valuable insights into the watershed’s water balance and dynamics.
where SWt represents the ultimate soil moisture content, indicating the final state of soil water after considering various inputs and outputs over a defined period; SW0 denotes the initial soil moisture content, serving as the starting point for the model’s calculations; t signifies the time phase, specifically measured in days, and encompasses the duration of the simulation; Rday, Qsurf and Ea are key components that represent daily rainfall, surface runoff, and evapotranspiration, respectively; Wseep represents the cumulative amount of water that percolates from the topsoil into the aeration zone on a specific day, marking the downward movement of water within the soil profile; Qgw stands for return flow, referring to the water that recirculates from deeper soil layers or groundwater back to the soil surface.
3 Results and discussion
3.1 Climate and streamflow alterations in recent 50 years
3.1.1 Temperature change
Temperature serves as the most prominent indicator of climate change. Utilizing the mean annual temperature data from five weather stations, we conducted a Mann-Kendall test to analyze the temperature trend (Figure 3). The results revealed that the temperature Zs statistic stood at 5.24 for the period 1970–2019, exceeding the Z statistic threshold of 2.32 for a 99% confidence interval. Consequently, it is evident that the Yanhe watershed experienced a significant increase in temperature over the past 50 years (p < 0.01). Furthermore, the rate of increase was 0.37°C per decade, and a notable abrupt change occurring in 1996. Specifically, the average annual temperature was 10.56°C during 1970–1996, whereas it rose to 11.80°C from 1997 to 2019. Notably, the peak temperature was recorded in 1998.
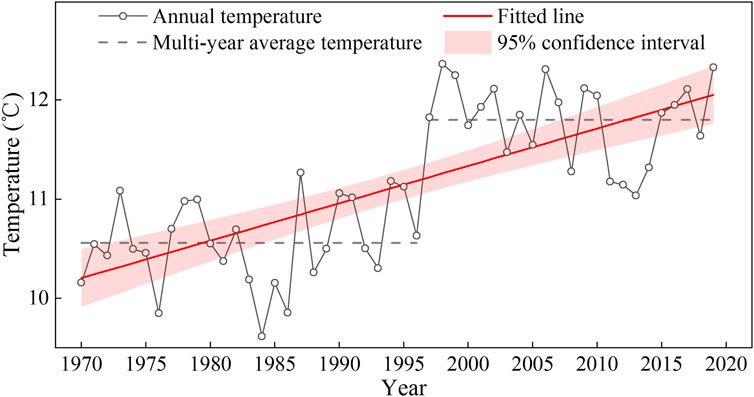
Figure 3. Inter-annual temperature variation in the Yanhe watershed from 1970 to 2019.
Over the past century (1905–2005), China experienced two distinct warm periods: the 1940s–1950s and the 1980s–1990s. Notably, 1998 marked the warmest year recorded in China since the inception of meteorological records (Tang and Ren, 2005). Consequently, the Yanhe watershed, influenced by global warming, exhibited similar warming trends and temperature fluctuations.
3.1.2 Precipitation and streamflow variation
The Mann-Kendall test was utilized to ascertain the trends in precipitation and streamflow within the semiarid Yanhe watershed during 1970–2019 (Figure 4). The Zs statistic for average precipitation in five stations stood at 0.73, falling within the range of zero to 1.64 (the threshold for a 95% confidence interval). Consequently, we observed a slight increased rate of 1.16 mm/yr inter-annual precipitation. Conversely, the Zs statistic for streamflow was −3.09, indicating a negative trend. Its absolute value exceeded the Z statistic threshold of 2.32 for a 99% confidence interval. Therefore, it is evident that the streamflow has decreased significantly with a rate of 1.60 million m3/yr over the past 50 years.
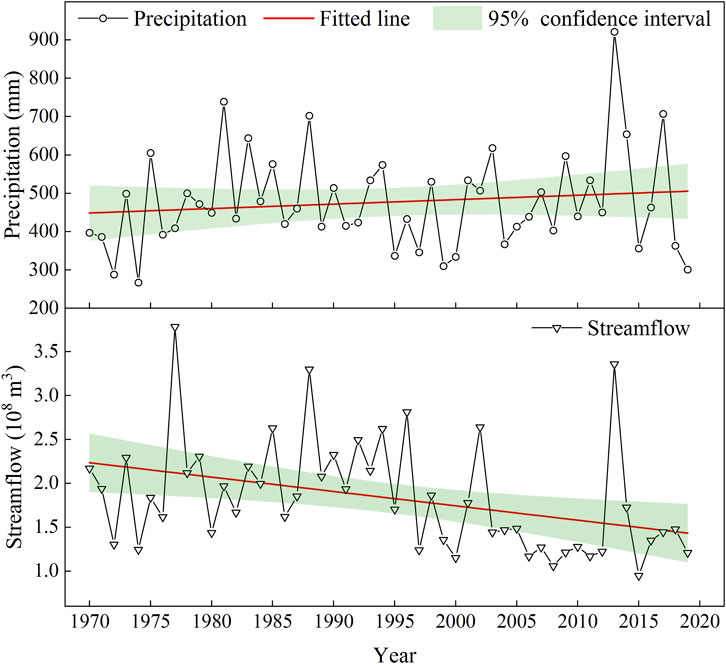
Figure 4. Inter-annual precipitation and streamflow variations in the Yanhe watershed during 1970–2019.
Besides, the average streamflow in the period of 2005–2012 was only half of that with the similar precipitation during 1989–1994. It can be ascribed to ecological restoration, because runoff is the synthesis of precipitation and land surface condition. The restored vegetation from GFGP reduced the rainfall-runoff conversion and increases the infiltration of surface runoff during confluence processes. Moreover, the runoff reduction increased with the age of trees planted (Huang et al., 2003). Our findings reveal that ecological restoration lasting between 4 and 7 years can lead to a reduction of half the streamflow in the Yanhe watershed, except for extreme rainfall conditions.
3.2 Hydrologic year classification
SPEI index was utilized at five stations to identify the typical hydrologic years within the Yanhe watershed during 1970–2019. The findings revealed that drought, normal, and wet years comprised 6%, 88%, and 6% of the total, respectively (Figure 5). Notably, a significant climatic shift occurred in the Yanhe watershed in 1996 (Kang et al., 2020). Consequently, we divided the study period into two distinct phases of 1970–1996 and 1997–2019. During the first phase (1970–1996), typical drought, normal, and wet years accounted for 1%, 93%, and 6%, respectively. However, in the second phase (1997–2019), the frequency of typical drought years increased significantly, accounting for 11% of the period, while normal and wet years constituted 83% and 6%, respectively. This increase in drought frequency during the later period underscores the changing climatic patterns in the Yanhe watershed.
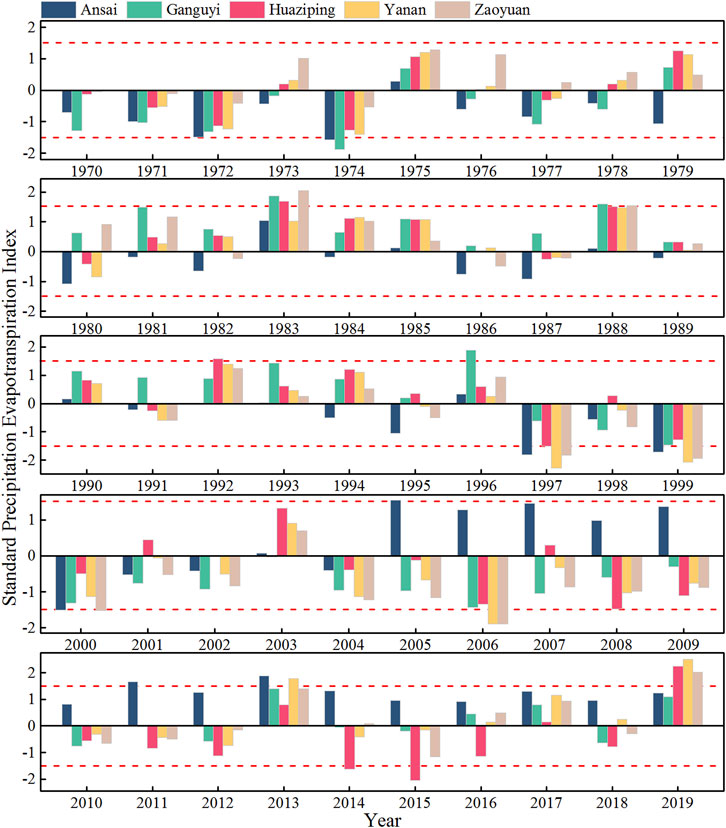
Figure 5. Hydrologic years classification by standard precipitation evapotranspiration index; The negative dotted line is the demarcation from normal years to typical drought years and the positive dotted line is the boundary from normal years to typical wet years.
The preceding analysis clearly indicates that the frequency of drought years has escalated in recent decades. According to the former studies, the arid area will be drier and the humid area will be wetter influenced by global warming (Durack et al., 2012; Scott et al., 2016). Therefore, the climate in the Yanhe watershed, situated in a semiarid region, tends to dry, and the extreme weather is most likely to increase.
3.3 Model calibration and validation
3.3.1 CA-Markov
To evaluate the precision of the hybrid CA-Markov, the Kappa spatial correlation—a highly regarded metric for accuracy assessment in IDRISI—was employed to contrast the actual and predicted land-use maps for 2010 (Figure 6). The analysis revealed a Kappa spatial correlation of 0.91 between the real and simulated maps, indicating a strong agreement. Drawing from the research conducted by Yang et al. (2021), a Kappa value exceeding 0.75 signifies a high degree of consistency and minimal discernible differences between the two land-use maps. Furthermore, Li and Zhou (2015) used the same method to simulate and predict the land use distribution patterns in the Yanhe watershed for 2010 and 2020, reaching similar conclusions as in this study. Consequently, the hybrid CA-Markov model, with its optimized parameters, exhibits excellent performance in predicting land-use patterns.
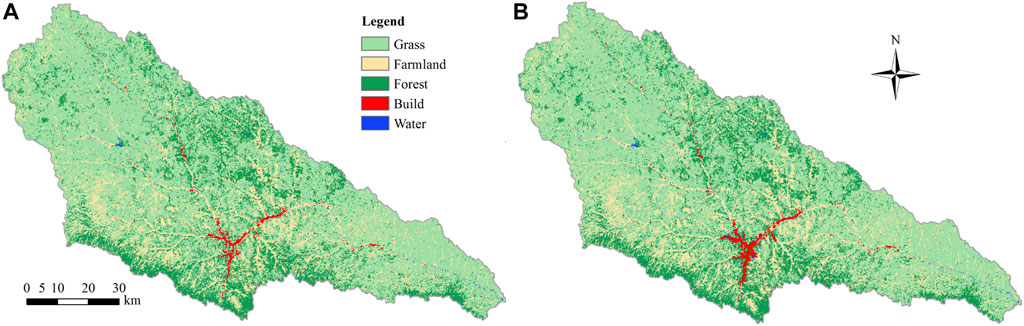
Figure 6. Comparison of actual and simulated land use in 2010. (A) Represents the actual land-use state in 2010; (B) depicts the simulated land-use state in 2010.
3.3.2 SWAT
There are 27 parameters that influence runoff in the SWAT model (Ahn and Merwade, 2016). To localize the general SWAT, we utilized the SWAT-CUP calibration uncertainty program to identify six runoff-sensitive parameters in the Yanhe watershed. Subsequently, the optimal values for these sensitive parameters were determined through Latin hypercube sampling, ensuring a precise and customized model for the watershed (Table 2). Besides, statistical metrics including R2, Nash-Sutcliffe coefficient (NSE), and percent bias (PBIAS) were employed to assess the accuracy of the SWAT (Gassman et al., 2007; Arnold et al., 2012). The results revealed that during the calibration period (1973–1997), the R2, NSE, and PBIAS values were 0.73, 0.60, and 18%, respectively (Figure 7). Similarly, in the validation period (2000–2019), these metrics were 0.71, 0.51, and 24%, respectively (Figure 8). According to SWAT accuracy evaluation research, a model is considered acceptable when NES exceeds 0.50 and PBIAS is less than 25% for streamflow predictions (Moriasi et al., 2007). Even though the localized SWAT could satisfy the model accuracy, there exists a discrepancy between the simulated and the observed streamflow. The one possible reason of this discrepancy is that the SWAT model’s simulation of snow and ice melt is simple based temperature (Devia et al., 2015), overlooking the impacts of the land use, slope aspect and gradient. The other possible is that the precipitation in the Yanhe River Basin, located in a semi-arid region, exhibits significant interannual variability, and the study period spans a relatively long duration, which leads to the basis between the simulated and observed streamflow. This research focuses on the impacts of land-use change on hydrological processes during the flooding seasons, and selects consecutive typical hydrological years to drive the localized SWAT model. Therefore, the calibrated model is able to reflect the characteristics of the impact of land-use variation on hydrology during typical hydrological years.
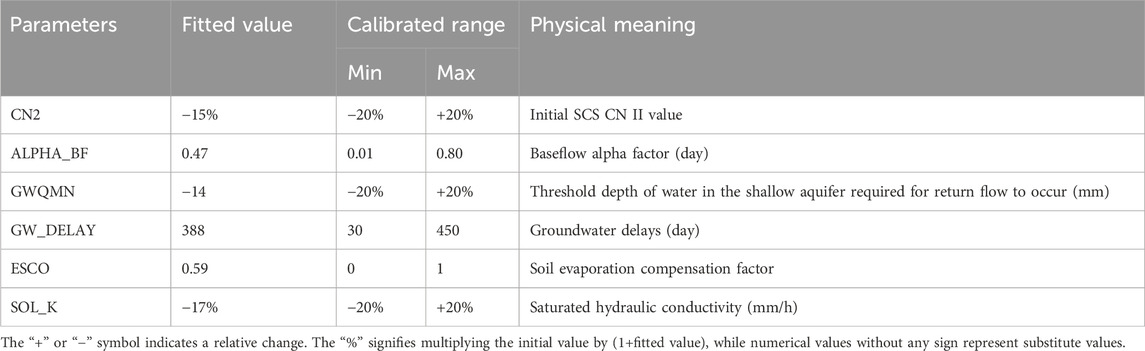
Table 2. Sensitive parameters on runoff in the Yanhe watershed.
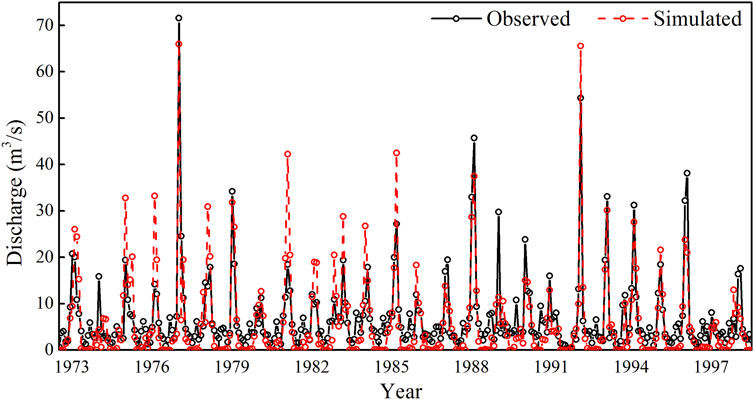
Figure 7. SWAT calibration in the Yanhe watershed during 1973–1999.
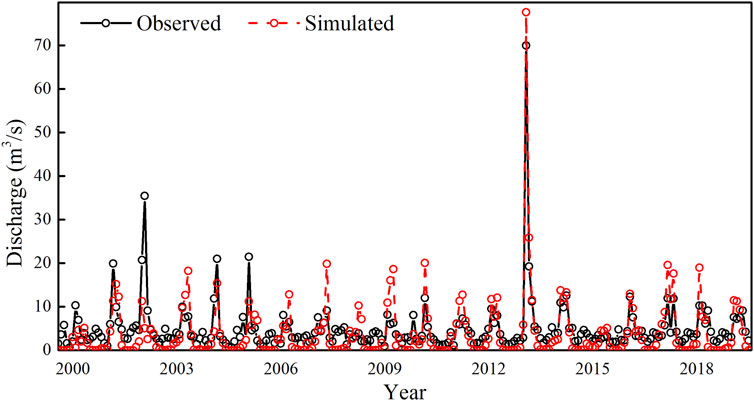
Figure 8. SWAT validation in the Yanhe watershed during 2000–2019.
3.4 Land-use variation and prediction
3.4.1 Land-use variation
According to the SWAT land-use classification system, the Yanhe watershed’s land use was reclassified into grassland, farmland, forest, urban/built-up land, and water body. An analysis of land-use changes from 1990 to 2010 revealed several notable trends (Table 3). Specifically, the areas of grassland, forest, and built-up land increased by 9.38%, 1.54%, and 0.40%, respectively, while farmland and water areas decreased by 11.17% and 0.16%, respectively. When comparing the land-use changes between 1990 and 2010 in greater detail, it was observed that from 1990 to 2000, the areas of grassland, forest, built-up land, and water body increased by 0.70%, 0.13%, 0.18%, and 0.01%, respectively, while farmland decreased by 1.03%. However, from 2000 to 2010, the changes were more significant, with grassland, forest, and built-up land continuing to expand, while farmland continued to decline. Overall, the most prominent land-use changes in the Yanhe watershed from 1990 to 2010 were the increasing trend in grassland, forest, and built-up land areas and the decreasing trend in farmland.
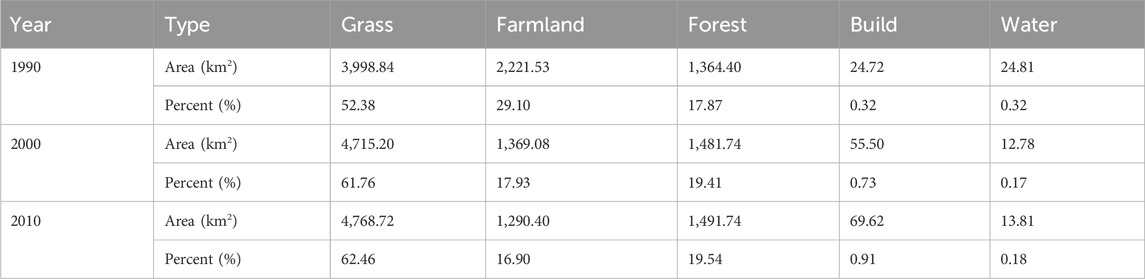
Table 3. Changes in land use within the Yanhe watershed from 1990 to 2010.
3.4.2 Land-use prediction
Using the calibrated IDRISI model with a land-use transition matrix derived from data between 2000 and 2010, predictions were made regarding the land-use layout anticipated for 2060 (Figure 9). When comparing the predicted land-use state of 2060 with the actual state of 2010, it is evident that the most significant change would involve the transformation of 9.21% of grassland. This grassland would primarily be converted into 5.63% of forest and 3.58% of built-up land. Notably, the expansion of forestland is expected to occur primarily in the midstream and downstream regions of the basin. Conversely, the growth of built-up areas is predicted to be concentrated in gullies with flatter terrain and more favorable urban habitat environments.
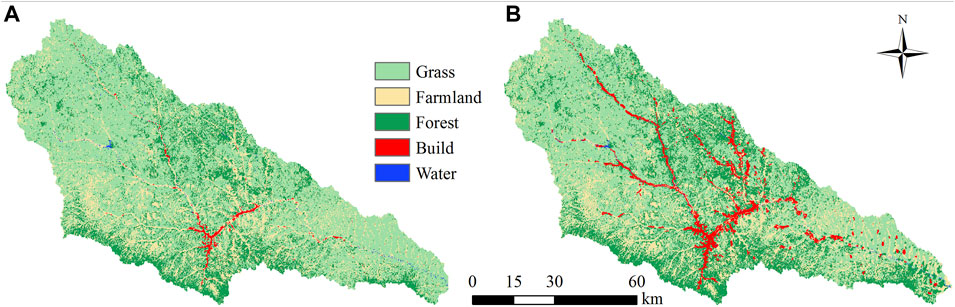
Figure 9. Land-use prediction and comparison in the Yanhe watershed. (A) Shows the actual land-use state in 2010, and (B) depicts the predicted land-use state in 2060.
3.5 Hydrological fluctuations in different hydrological years
3.5.1 Streamflow variation in typical drought years
SWAT models were constructed utilizing five consecutive, representative drought years (comprising two warm-up years and five simulation years) alongside land-use maps from 2010 to 2060 within the Yanhe watershed. The findings revealed that the impact of arid climatic conditions on streamflow was primarily concentrated during flooding periods. Specifically, the mean discharge rates during these periods were 5.05 m3/s and 6.69 m3/s for the 2010 and 2060 scenarios, respectively. Furthermore, the average flood peak in the 2060 landscape scenario exhibited a notable increase of 32.49% compared to that of 2010 (Figure 10A). Overall, during these typical drought years, the Yanhe watershed exhibited low discharge levels and rapid fluctuations in flood peaks.
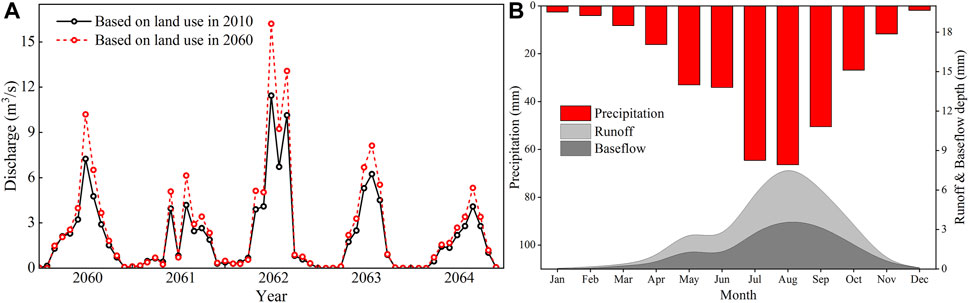
Figure 10. Hydrological fluctuations with land-use variation in drought years. (A) Is the interannual variation of streamflow, and (B) is the innerannual distribution of precipitation, runoff and baseflow.
The significant land-use alteration from 2010 to 2060 is the grassland converted to the forest and built-up land. The transformed forest is primarily located on hilly slopes, situated far from the Yanhe River. Conversely, the converted built-up land is situated in proximity to the river, occupying a broad and flat area. Consequently, the surface runoff generated by limited precipitation on the built-up land drains into the river, leading to a rapid response of low streamflow to rainfall during typical drought years. We refer to this phenomenon, where low streamflow promptly reacts to limited precipitation in close proximity to the land surface, as the “local rainfall-runoff effect".
Utilizing the 2060 landscape as a basis, we conducted a thorough analysis of the intra-annual characteristics of precipitation, runoff, and baseflow to further elucidate the “local rainfall-runoff effect” during typical drought years (Figure 10B). Our findings revealed that rainfall was the primary determinant of surface runoff in these drought-prone years, especially during flooding periods. Specifically, total precipitation amounted to 319.75 mm, with 56.74% of this precipitation occurring exclusively during flooding periods. Notably, 64.66% of this precipitation was converted into surface runoff, serving as the principal mechanism for the rapid increase in streamflow during flooding periods. On the other hand, baseflow contributed 50.72% to streamflow, becoming the primary source of recharge for the river during non-flooding periods.
The aforementioned analysis clearly illustrates the “local rainfall-runoff effect”. This effect refers to the phenomenon where a significant portion of limited precipitation generates surface runoff on impermeable or weakly permeable surfaces. This runoff subsequently recharges nearby streams and rivers, resulting in a rapid increase in discharge. Therefore, the local landscape characteristics play a pivotal role in influencing the streamflow patterns during typical drought years.
3.5.2 Streamflow variation in normal years
According to the classification of SPEI, we selected five consecutive normal years (consisting of two warm-up years and five simulation years) to forecast hydrological variations within the Yanhe watershed. Our findings revealed that the influence of a normal climate on surface runoff was primarily concentrated from June to October. When comparing the average discharge based on the landscapes of 2010 and 2060, we observed a decrease from 19.42 m3/s and 12.40 m3/s. Notably, during these normal years, the flood peak with the 2060 land use scenario decreased by 36.15% compared to that with the 2010 land use (Figure 11A). Nevertheless, it is worth mentioning that the flooding discharge in normal years is approximately twice as high as that observed during typical drought years.
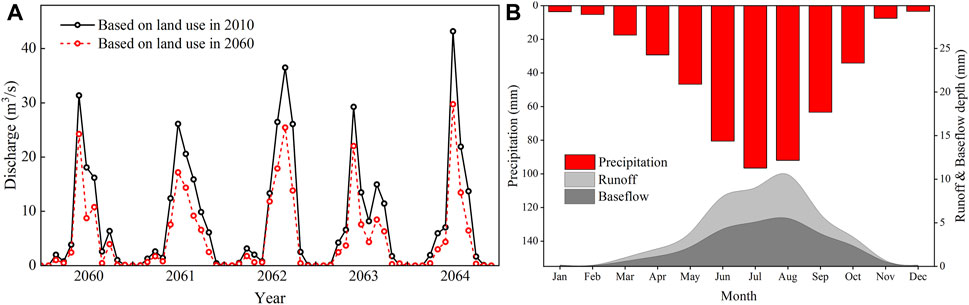
Figure 11. Hydrological fluctuations with land-use variation in normal years. (A) Is the interannual variation of streamflow, and (B) is the innerannual distribution of precipitation, runoff and baseflow.
When comparing the land-use state in 2010 with that of 2060, we observe that the prolonged restoration of forests and grasslands in 2060 effectively limits upstream and local surface runoff generated by relatively abundant precipitation during normal years. This, in turn, reduces the runoff flows into the river. Although the expansion of built-up land (accounting for 4.49% of the entire watershed) converts a significant amount of rainfall into surface runoff, the peak flow in 2060 remains lower than that in 2010. This is attributed to the fact that the surface runoff restricted by restored vegetation outweighs the runoff generated by the built-up land. Furthermore, given the high discharge rates during normal years, the limited surface runoff generated on the relatively small percentage of built-up land has minimal impact on streamflow. Consequently, when compared to the landscape of 2010, the peak flow in 2060 is lower. We refer to this phenomenon as the “global rainfall-runoff effect".
Utilizing the land-use map of 2060, we conducted a thorough analysis of the intra-annual distribution of precipitation, runoff, and baseflow during normal years to elucidate the “global rainfall-runoff effect” (Figure 11B). Our findings revealed that precipitation, streamflow, and baseflow exhibited smooth transitions throughout the normal years, with the timing of peak flow lagging behind the period of maximum precipitation. Notably, the peak volume of precipitation occurred in July, whereas the peak discharge was delayed until early August. On average, the total precipitation amounted to 479.66 mm, with only 3.99% of this precipitation converting into surface runoff and subsequently entering the stream during these normal years.
There are two primary reasons for the observed lag between the flood peak and the maximum precipitation time. Firstly, the smooth fluctuations in rainfall distribution throughout the year maintain the discharge within a consistently high range, rendering it less susceptible to the “local rainfall-runoff effect”. Secondly, the well restored vegetation on the slope effectively intercepts surface runoff, and the homogeneous loess soil has high infiltration capacity in the normal hydrological years (Jin et al., 2020). Consequently, when rainfall is relatively abundant and the river maintains a stable discharge, the rainfall-runoff process is primarily influenced by the spatial distribution of major land-use types across the entire basin, giving rise to the “global rainfall-runoff effect”.
3.5.3 Streamflow variation in typical wet years
For a comparative analysis with typical drought years and normal years, the SWAT models were driven using data from five consecutive typical wet years. These models were based on the land-use layouts of 2010 and 2060 in the Yanhe watershed. The results indicated that climate was the primary determinant of streamflow in flooding periods of wet years. Specifically, the flood peaks were virtually identical for both the 2010 and 2060 land-use scenarios. During the typical wet years, the discharge was high, and the peak flow was predominantly concentrated in July (Figure 12A).
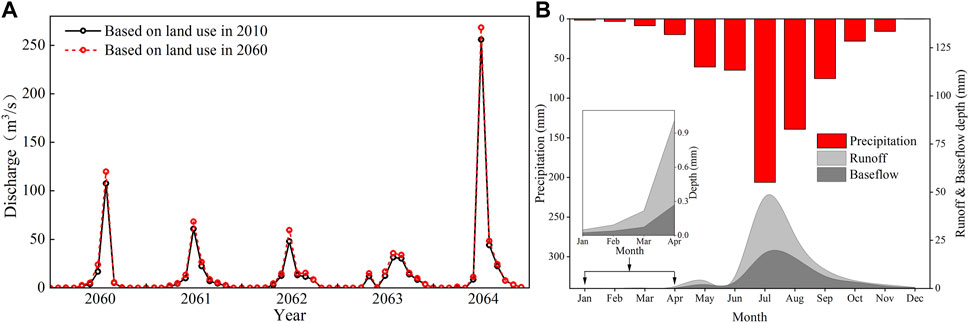
Figure 12. Hydrological fluctuations with land-use variation in wet years. (A) Is the interannual variation of streamflow, and (B) is the innerannual distribution of precipitation, runoff and baseflow.
Previous studies indicated that vegetation (forest and grass) has a good function of soil and water conservation (Jin et al., 2020; Lyu et al., 2023). The area of vegetation in the Yanhe watershed accounts for 82.00% and 78.43% of the entire watershed in 2010 and 2060, respectively. However, it has limited capacity to restrict surface runoff during intense rainstorms or prolonged rainfall. The aggressive surface runoff resulting from extreme rainfall is scarcely intercepted and infiltrated by the forest and grassland. This was evident during the “7.26” rainstorm event in the Wudinghe River basin of the LP on 26 July 2017. Despite decades of ecological restoration efforts, where the area of grassland and forest has exceeded 50% of the watershed, the rainstorm still generated significant flood peaks and caused severe soil erosion (Tang et al., 2020; Wang et al., 2020). Consequently, in typical wet years, the aggressive surface runoff rapidly flows into the river, significantly increasing the peak discharge.
To gain a deeper understanding of the hydrological processes during typical wet years, we analyzed the intra-annual distribution of rainfall, runoff, and baseflow (Figure 12B). The results indicated that the average precipitation in these wet years was 624.01 mm, with significant variations within the year. Notably, approximately 55.38% of the total precipitation occurred primarily in July and August. Concurrently, the surface runoff showed a marked increase during the concentrated rainstorms in July, accounting for a substantial 79.11% of the total surface runoff. During this period, the flood discharge was particularly high and declined rapidly following the intense rainfall. As approximately 90% of the Yanhe watershed comprises hilly-gully regions (Wang et al., 2016), the occurrence of rainstorms frequently triggers infiltration-excess overland flow (Jin et al., 2020), and the resulting stormflow responds promptly to precipitation.
4 Conclusion
Ecological restoration (afforestation and grass planting) can effectively reduce streamflow during the drought and normal years in the semiarid regions. The hydrological processes exhibit distinct response patterns in different hydrologic years. In typical drought years, the streamflow regime primarily follows the “local rainfall-runoff effect”, where the landscape in proximity to streams and rivers plays a pivotal role in determining streamflow patterns. Conversely, in normal years, the streamflow is influenced by the “global rainfall-runoff effect”, meaning that the major land-use types across the entire basin contribute significantly to the overall flow. However, in typical wet years, the streamflow is primarily controlled by climatic factors. Even under conditions of significant vegetation restoration, land use has a limited impact on surface runoff. This underscores the need for a balanced approach in managing land use and ecological restoration efforts to mitigate the effects of climate change on streamflow patterns in semiarid regions.
Data availability statement
The original contributions presented in the study are included in the article/Supplementary Material, further inquiries can be directed to the corresponding author.
Author contributions
YK: Conceptualization, Formal Analysis, Methodology, Software, Visualization, Writing–original draft. KZ: Data curation, Writing–review and editing. YZ: Formal Analysis, Software, Validation, Visualization, Writing–original draft. LZ: Data curation, Formal Analysis, Writing–review and editing.
Funding
The author(s) declare that financial support was received for the research, authorship, and/or publication of this article. This study was funded by the Natural Science Foundation of Gansu Province (No. 23JRRA702); the Innovation project for Young Science and Technology of Lanzhou (No. 2023-QN-55), and the Gansu Province Higher Education Industry Support Project (2022CYZC-15).
Conflict of interest
The authors declare that the research was conducted in the absence of any commercial or financial relationships that could be construed as a potential conflict of interest.
Publisher’s note
All claims expressed in this article are solely those of the authors and do not necessarily represent those of their affiliated organizations, or those of the publisher, the editors and the reviewers. Any product that may be evaluated in this article, or claim that may be made by its manufacturer, is not guaranteed or endorsed by the publisher.
References
Adhikari, P., Hong, Y., Douglas, K. R., Kirschbaum, D. B., Gourley, J., Adler, R., et al. (2010). A digitized global flood inventory (1998–2008): compilation and preliminary results. Nat. Hazards 55 (2), 405–422. doi:10.1007/s11069-010-9537-2
Ahn, K.-H., and Merwade, V. (2016). The effect of land cover change on duration and severity of high and low flows. Hydrol. Process. 31 (1), 133–149. doi:10.1002/hyp.10981
Arnold, J. G., Moriasi, D. N., Gassman, P. W., Abbaspour, K. C., White, M. J., Srinivasan, R., et al. (2012). SWAT: model use, calibration, and validation. Trans. ASABE 55, 1491–1508. doi:10.13031/2013.42256
Barry, A. A., Caesar, J., Tank, A., Aguilar, E., Mcsweeney, C., Cyrille, A. M., et al. (2018). West Africa climate extremes and climate change indices. Int. J. Climatol. 38, E921–E938. doi:10.1002/joc.5420
Bates, B., Kundzewicz, Z. W., Wu, S., and Palutikof, J. (2008) Climate change and water: technical paper VI. Geneva, Switzerland: University of North Texas Libraries, UNT Digital Library.
Bohn, V., and Piccolo, M. (2018). Standardized precipitation evapotranspiration index (SPEI) as a tool to determine the hydrological dynamic of plain regions (Argentina). Geociencias 37, 627–637. doi:10.5016/geociencias.v37i3.12236
Chen, L.-D., Messing, I., Zhang, S., Fu, B.-J., and Ledin, S. (2003). Land use evaluation and scenario analysis towards sustainable planning on the Loess Plateau in China—case study in a small catchment. Catena 54, 303–316. doi:10.1016/s0341-8162(03)00071-7
Chen, Y., Wang, K., Lin, Y., Shi, W., Song, Y., and He, X. (2015). Balancing green and grain trade. Nat. Geosci. 8 (10), 739–741. doi:10.1038/ngeo2544
Da Silva, R. M., Santos, C. a. G., Moreira, M., Corte-Real, J., Silva, V. C. L., and Medeiros, I. C. (2015). Rainfall and river flow trends using Mann–Kendall and Sen’s slope estimator statistical tests in the Cobres River basin. Nat. Hazards 77 (2), 1205–1221. doi:10.1007/s11069-015-1644-7
Delang, C. O., and Yuan, Z. (2015) China’s grain for green program: a review of the largest ecological restoration and rural development program in the World. Switzerland: Springer International Publishing.
Devia, G. K., Ganasri, B. P., and Dwarakish, G. S. (2015). A review on hydrological models. Aquat. Procedia 4 (2015), 1001–1007. doi:10.1016/j.aqpro.2015.02.126
Di Capua, G., and Rahmstorf, S. (2023). Extreme weather in a changing climate. Environ. Res. Lett. 18 (10), 102001. doi:10.1088/1748-9326/acfb23
Du, J., Qian, L., Rui, H., Zuo, T., Zheng, D., Xu, Y., et al. (2012). Assessing the effects of urbanization on annual runoff and flood events using an integrated hydrological modeling system for Qinhuai River Basin, China. J. Hydrol. 465, 127–139. doi:10.1016/j.jhydrol.2012.06.057.549
Durack, P. J., Wijffels, S. E., and Matear, R. J. (2012). Ocean salinities reveal strong global water cycle intensification during 1950 to 2000. Science 336 (6080), 455–458. doi:10.1126/science.1212222
Eastman, R. J. (1999) Guide to GIS and image processing volume 1. Worcester, United States: Clark University: Idrisi Prouduction.
Gassman, P. W., Reyes, M. R., Green, C. H. M., and Arnold, J. G. (2007). The soil and water assessment tool: historical development, applications, and future research directions. Trans. ASABE 50 (4), 1211–1250. doi:10.13031/2013.23637
Ge, J., Pitman, A. J., Guo, W. D., Zan, B. L., and Fu, C. B. (2020). Impact of revegetation of the Loess Plateau of China on the regional growing season water balance. Hydrology Earth Syst. Sci. 24 (2), 515–533. doi:10.5194/hess-24-515-2020
Hao, L., Zhang, X., and Liu, S. (2012). Risk assessment to China’s agricultural drought disaster in county unit. Nat. Hazards 61 (2), 785–801. doi:10.1007/s11069-011-0066-4
Hoover, D. L., Duniway, M. C., and Belnap, J. (2015). Pulse-drought atop press-drought: unexpected plant responses and implications for dryland ecosystems. Oecologia 179 (4), 1211–1221. doi:10.1007/s00442-015-3414-3
Huang, J., Guan, X., and Ji, F. (2012). Enhanced cold-season warming in semi-arid regions. Atmos. Chem. Phys. 12 (12), 5391–5398. doi:10.5194/acp-12-5391-2012
Huang, J., Ji, M., Xie, Y., Wang, S., He, Y., and Ran, J. (2016). Global semi-arid climate change over last 60 years. Clim. Dyn. 46 (3), 1131–1150. doi:10.1007/s00382-015-2636-8
Huang, J., Li, Y., Fu, C., Chen, F., Fu, Q., Dai, A., et al. (2017). Dryland climate change: recent progress and challenges. Rev. Geophys. 55 (3), 719–778. doi:10.1002/2016rg000550
Huang, M., Zhang, L., and Gallichand, J. (2003). Runoff responses to afforestation in a watershed of the Loess Plateau, China. Hydrol. Process. 17 (13), 2599–2609. doi:10.1002/hyp.1281
Ipcc (2023) Climate change 2023: synthesis report (full volume) contribution of working groups I, II and III to the sixth assessment report of the intergovernmental panel on climate change. Swizerland: IPCC.
Jia, Y., Li, T., Shao, M. A., Hao, J., Wang, Y., Jia, X., et al. (2019). Disentangling the formation and evolvement mechanism of plants-induced dried soil layers on China's Loess Plateau. Agric. For. Meteorology 269, 57–70. doi:10.1016/j.agrformet.2019.02.011
Jin, Z., Guo, L., Yu, Y. L., Luo, D., Fan, B. H., and Chu, G. C. (2020). Storm runoff generation in headwater catchments on the Chinese Loess Plateau after long-term vegetation rehabilitation. Sci. Total Environ. 748 (15), 141375. doi:10.1016/j.scitotenv.2020.141375
Kang, Y., Gao, J., Shao, H., and Zhang, Y. (2020). Quantitative analysis of hydrological responses to climate variability and land-use change in the hilly-gully region of the Loess Plateau, China. Water 12 (1), 1–18. doi:10.3390/w12010082
Kang, Y., Gao, J. E., Shao, H., Zhang, Y., Li, J., and Gao, Z. (2021). Evaluating the flow and sediment effects of gully land consolidation on the Loess Plateau, China. J. Hydrology 600 (2021), 126535. doi:10.1016/j.jhydrol.2021.126535
Li, J., Liu, Z., He, C., Tu, W., and Sun, Z. (2016). Are the drylands in northern China sustainable? A perspective from ecological footprint dynamics from 1990 to 2010. Sci. Total Environ. 553, 223–231. doi:10.1016/j.scitotenv.2016.02.088
Li, J., and Zhou, Z. X. (2015). Coupled analysis on landscape pattern and hydrological processes in Yanhe Watershed of China. Sci. Total Environ. 505 (2015), 927–938. doi:10.1016/j.scitotenv.2014.10.068
Li, Y., Huang, J., Ji, M., and Ran, J. (2015). Dryland expansion in northern China from 1948 to 2008. Adv. Atmos. Sci. 32 (6), 870–876. doi:10.1007/s00376-014-4106-3
Lyu, L., Yang, Y., Zheng, D. F., and Li, Q. (2023). Effects of vegetation distribution and landscape pattern on water conservation in the Dongjiang River basin. Ecol. Indictors 155 (2023), 111017. doi:10.1016/j.ecolind.2023.111017
Mann, H. B. (1945). Nonparametric tests against trend. Econometrica 13 (3), 245–259. doi:10.2307/1907187
Mcvicar, T. R., Li, L., Van Niel, T. G., Zhang, L., Li, R., Yang, Q., et al. (2007). Developing a decision support tool for China's re-vegetation program: simulating regional impacts of afforestation on average annual streamflow in the Loess Plateau. For. Ecol. Manag. 251 (1), 65–81. doi:10.1016/j.foreco.2007.06.025
Mohamed, A., and Worku, H. (2020). Simulating urban land use and cover dynamics using cellular automata and Markov chain approach in Addis Ababa and the surrounding. Urban Clim. 31, 100545. doi:10.1016/j.uclim.2019.100545
Mokrech, M., Nicholls, R. J., Richards, J. A., Henriques, C., Holman, I. P., and Shackley, S. (2008). Regional impact assessment of flooding under future climate and socio-economic scenarios for East Anglia and North West England. Clim. Change 90 (1), 31–55. doi:10.1007/s10584-008-9449-2
Mondal, P., and Southworth, J. (2010). Evaluation of conservation interventions using a cellular automata-Markov model. For. Ecol. Manag. 260 (10), 1716–1725. doi:10.1016/j.foreco.2010.08.017
Moriasi, D. N., Arnold, J. G., Van Liew, M. W., Bingner, R. L., Harmel, R. D., and Veith, T. L. (2007). Model evaluation guidelines for systematic quantification of accuracy in watershed simulations. Trans. ASABE 50 (3), 885–900. doi:10.13031/2013.23153
Nalley, D., Adamowski, J., Khalil, B., and Ozga-Zielinski, B. (2013). Trend detection in surface air temperature in Ontario and Quebec, Canada during 1967–2006 using the discrete wavelet transform. Atmos. Res. 132-133, 375–398. doi:10.1016/j.atmosres.2013.06.011
Neitsch, S. L., Arnold, J. G., Kiniry, J. R., and Williams, J. R. (2011) Soil and water assessment tool theoretical documentation version 2009. Texas: Texas Water Resources Institute.
Nyamadzawo, G., Chirinda, N., Mapanda, F., Nyamangara, J., Wuta, M., Nyamugafata, P., et al. (2012). Land-use and land-use change effects on nitrous oxide emissions in the seasonally dry ecosystems of Zimbabwe: a review. Actas Urológicas Espaolas 33 (3), 249–257.
Otto, F. E. L. (2023). Attribution of extreme events to climate change. Annu. Rev. Environ. Resour. 48, 813–828. doi:10.1146/annurev-environ-112621-083538
Rotenberg, E., and Yakir, D. (2010). Contribution of semi-arid forests to the climate system. Science 327 (5964), 451–454. doi:10.1126/science.1179998
Sang, L., Zhang, C., Yang, J., Zhu, D., Yun, W., et al. (2011). Simulation of land use spatial pattern of towns and villages based on CA–Markov model. Math. Comput. Model. 54 (3–4), 938–943. doi:10.1016/j.mcm.2010.11.019
Scheff, J., and Frierson, D. M. W. (2014). Scaling potential evapotranspiration with greenhouse warming. J. Clim. 27 (4), 1539–1558. doi:10.1175/jcli-d-13-00233.1
Scott, D., Hall, C. M., and Gössling, S. (2016). A review of the IPCC Fifth Assessment and implications for tourism sector climate resilience and decarbonization. J. Sustain. Tour. 24 (1), 8–30.
Shi, H., and Shao, M. (2000). Soil and water loss from the Loess Plateau in China. J. Arid Environ. 45 (1), 9–20. doi:10.1006/jare.1999.0618
Tan, C., Yang, J., and Li, M. (2015). Temporal-spatial variation of drought indicated by SPI and SPEI in ningxia hui autonomous region, China. Atmosphere 6 (10), 1399–1421. doi:10.3390/atmos6101399
Tang, B., Jiao, J., Zhang, Y., Chen, Y., Wang, N., and Bai, L. (2020). The magnitude of soil erosion on hillslopes with different land use patterns under an extreme rainstorm on the Northern Loess Plateau, China. Soil Tillage Res. 204, 104716. doi:10.1016/j.still.2020.104716
Tang, G., and Ren, G. (2005). Reanalysis of surface air temperature change of the last 100 Years over China. Clim. Environ. Res. 10 (4), 791–798.
Tsunekawa, A., Liu, G., Yamanaka, N., and Du, S. (2014) Restoration and development of the degraded Loess Plateau. China. Tokyo: Springer Japan.
Van Belle, G., and Hughes, J. P. (1984). Nonparametric tests for trend in water quality. Water Resour. Res. 20 (1), 127–136. doi:10.1029/wr020i001p00127
Vicente-Serrano, S. M., Beguería, S., and López-Moreno, J. I. (2010). A multiscalar drought index sensitive to global warming: the standardized precipitation evapotranspiration index. J. Clim. 23 (7), 1696–1718. doi:10.1175/2009jcli2909.1
Wang, N., Jiao, J., Bai, L., Zhang, Y., Chen, Y., Tang, B., et al. (2020). Magnitude of soil erosion in small catchments with different land use patterns under an extreme rainstorm event over the Northern Loess Plateau, China. Catena 195, 104780. doi:10.1016/j.catena.2020.104780
Wang, Z. J., Jiao, J. Y., Rayburg, S., Wang, Q. L., and Su, Y. (2016). Soil erosion resistance of “Grain for Green” vegetation types under extreme rainfall conditions on the Loess Plateau, China. Catena 141 (2016), 109–116. doi:10.1016/j.catena.2016.02.025
Yang, X., Bai, Y., Che, L., Qiao, F., and Xie, L. (2021). Incorporating ecological constraints into urban growth boundaries: a case study of ecologically fragile areas in the Upper Yellow River. Ecol. Indic. 124, 107436. doi:10.1016/j.ecolind.2021.107436
Ye, B., and Bai, Z. (1969) Simulating land use/cover changes of Nenjiang County based on CA-Markov model. Boston: Springer, 321–319.
Yu, Y., Zhao, W. W., Martinez-Murillo, J. F., and Pereira, P. (2020). Loess Plateau: from degradation to restoration. Sci. Total Environ. 738, 140206. doi:10.1016/j.scitotenv.2020.140206
Zeng, N., Neelin, J. D., Lau, K.-M., and Tucker, C. J. (1999). Enhancement of interdecadal climate variability in the sahel by vegetation interaction. Science 286 (5444), 1537–1540. doi:10.1126/science.286.5444.1537
Zhao, G. J., Mu, X. M., Jiao, J. Y., An, Z. F., Klik, A., Wang, F., et al. (2017). Evidence and causes of spatiotemporal changes in runoff and sediment yield on the Chinese Loess Plateau. Land Degrad. Dev. 28 (2), 579–590. doi:10.1002/ldr.2534
Zhao, G. J., Mu, X. M., Wen, Z. M., Wang, F., and Gao, P. (2013). Soil erosion, conservation, and eco-environment changes in the Loess Plateau of China. Land Degrad. Dev. 24 (5), 499–510. doi:10.1002/ldr.2246
Zhao, H., Gao, G., Yan, X., Zhang, Q., Hou, M., Zhu, Y., et al. (2011). Risk assessment of agricultural drought using the CERES-Wheat model: a case study of Henan Plain, China. Clim. Res. 50, 247–256. doi:10.3354/cr01060
Zhao, T., Chen, L., and Ma, Z. (2014). Simulation of historical and projected climate change in arid and semiarid areas by CMIP5 models. Chin. Sci. Bull. 59 (4), 412–429. doi:10.1007/s11434-013-0003-x
Zhao, T. B., and Dai, A. G. (2017). Uncertainties in historical changes and future projections of drought. Part II: model-simulated historical and future drought changes. Clim. Change 144 (3), 535–548. doi:10.1007/s10584-016-1742-x
Zhao, W. W., Liu, Y., Daryanto, S., Fu, B. J., Wang, S., and Liu, Y. X. (2018). Metacoupling supply and demand for soil conservation service. Curr. Opin. Environ. Sustain. 33, 136–141. doi:10.1016/j.cosust.2018.05.011
Keywords: hydrological processes, land use variation, climate change, SWAT model, the Loess Plateau
Citation: Kang Y, Zhang K, Zhang Y and Zhao L (2024) Hydrological response to vegetation restoration and urban sprawl in typical hydrologic years within a semiarid river basin in China. Front. Environ. Sci. 12:1410918. doi: 10.3389/fenvs.2024.1410918
Received: 03 April 2024; Accepted: 28 May 2024;
Published: 14 June 2024.
Edited by:
Narsimha Adimalla, East China University of Technology, ChinaCopyright © 2024 Kang, Zhang, Zhang and Zhao. This is an open-access article distributed under the terms of the Creative Commons Attribution License (CC BY). The use, distribution or reproduction in other forums is permitted, provided the original author(s) and the copyright owner(s) are credited and that the original publication in this journal is cited, in accordance with accepted academic practice. No use, distribution or reproduction is permitted which does not comply with these terms.
*Correspondence: Youcai Kang, a2FuZ3ljQG53bnUuZWR1LmNu