 Tianxiao Gao
 Yong Gao
 Luxi Huang
- College of Desert Control Science and Engineering, Inner Mongolia Agricultural University, Hohhot, China
This study investigated airflow changes and sediment transport in the blowouts of the sandy grassland in Xilingol, Inner Mongolia. The results show that the wind direction inside the blowout is influenced by the direction of the incoming wind. Specifically, when the angle between the incoming wind direction and the long axis of the blowout is less than 15°, both sides of the wall tend to generate a wind flow towards the east exit. Meanwhile, the main airflow along the central axis airflow deflects towards the north side wall. However, when the angle is greater than 15°, the airflow on the north wall first disperses and then converges towards the wellbore. Conversely, the airflow on the south wall blows out in a southeast direction, and the axial airflow deflects towards the south wall. The rate of wind speed acceleration on both sides of the wall increases with height within the blowout but decreases along the central axis section. Higher wind speeds correlate with greater cumulative sand transport heights. Sand transport heights on both sides of the deflation basin are smaller than those along the central axis section, with the opposite observed in the depositional lobe. The rate of sand transport is primarily influenced by wind direction and wind speed, followed by, topography, vegetation coverage, slope, and aspect. These variations in airflow, combined with sediment transport, lead to the blowout taking on a develop deeper, longer, and wider shape.
1 Introduction
Blowouts, as defined, are concave or depressed formations resulting from wind erosion (Hesp, 2002; Wang et al., 2007). They commonly manifest as wind erosion craters on sandy coasts, lakeshores, sandy grasslands, and inland sandy lands within semi-arid and partly semi-humid regions (Dominguez and Barbosa, 2004; Hugenholtz and Wolfe, 2006; Mir-Gual et al., 2013; Hesp et al., 2017). Typically, a blowout comprises two distinct components: an erosion blowout and a depositional lobe behind the blowout. Based on its terrain shape, blowouts can be categorized into dish-shaped, bowl-shaped, groove-shaped, and other variations (Hesp and Walker, 2012; Smyth et al., 2013; Jewell et al., 2014; Yu et al., 2015; Guo et al., 2023). In China, blowouts predominantly occur in sandy grasslands and sandy lands (Yan et al., 2009), notably in regions such as Hunshandake, Hulunbeier, Mu Us, Horbin sandy land, and their adjacent sandy grasslands (Zhuang and Hasi, 2005; Wang and Hasi, 2009; Li et al., 2012; Smith et al., 2017; Zhou et al., 2023). Blowouts serve as precursors to land degradation and desertification. Their formation not only leads to the depletion of surface vegetation but also contributes to the expansion of desertified grasslands, exerting significant impacts on land resources and human livelihoods (Abhar et al., 2015; Zhang et al., 2007). Wind erosion stands as the primary mechanism driving blowout formation. Hence, comprehensive studies on the formation and dynamic mechanisms of blowouts are crucial. Such endeavors not only enhance our understanding of blowouts but also provide a theoretical foundation for implementing technical measures to prevent their occurrence.
Initially, researchers focused on studying the morphological changes and development processes of blowouts (Jungerius et al., 1981). With advancements in scientific research technology, the evolution, distribution, and morphology of blowouts have been gradually classified over the years (Gares and Nordstrom, 1995; Hesp, 1996; Arens et al., 2002), but primarily focused on coastal blowouts. Subsequently, research on the dynamics of blowout blowouts became a hot topic (Pease and Gares, 2013; Catto et al., 2002). In measurements of coastal blowout dynamics (Gutiérrez-Elorza et al., 2005; Hansen et al., 2009), it has been observed that when airflow enters through the mouth of an erosion blowout, it ascends, leading to a rapid increase in wind speed at the front and sides of the blowout while decreasing at the bottom of the wider erosion blowout. Subsequently, the airflow accelerates along the erosion walls on both sides until it reaches the depositional lobe behind the blowout. Studies on sediment transport in coastal blowouts have revealed that the sand transport rate is highest in the most stable area of airflow within the blowout (Hugenholtz and Wolfe, 2009; Smyth et al., 2012; Jackson et al., 2013; Smyth et al., 2014). However, further exploration is needed to determine whether the inland blowout is consistent with coastal blowout research. In recent years, research on blowouts in semi-arid inland areas has expanded. Detailed studies on the airflow, morphology, and evolution of blowouts have been conducted in the Hulun Buir Sandy Land, Hunshandake Sandy Land, and Gonghe Basin in Xinjiang, China. Additionally, the interaction between morphology and airflow has been analyzed (Sun et al., 2016; Luo et al., 2018; Hurina et al., 2019; Luo et al., 2019). However, research on the relationship between airflow and sediment transport remains relatively limited, and comprehensive studies on different sandy typical grasslands in semi-arid areas are still lacking.
Therefore, the purpose of this study is to explore the dynamic mechanism of blowouts on typical sandy grasslands in Xilinguole, Inner Mongolia, China. Specifically, we aim to investigate the relationship between airflow changes and sand transport within blowouts. This study will provide a clearer understanding of the impact of changes in airflow and sediment transport on blowout. Furthermore, it will provide a theoretical basis and understanding for subsequent studies on blowouts, their fixation-prevention, and the restoration of grassland ecology in inland typical sandy grasslands.
2 Study site
Xilingol sandy grassland constitutes a significant portion of Inner Mongolia’s grasslands and serves as an essential ecological security barrier in northern Xinjiang. The sand sourced from grassland degradation is a primary contributor to wind-sand disasters in the Beijing-Tianjin-Hebei region. Xilinguole grassland experiences a temperate semi-arid continental climate characterized by cold, windy conditions with minimal rainfall. The average annual preciblowoutation stands at 260 mm, with approximately 80% concentrated between June and September. Temperatures average between 0°C and 3°C annually, with an average evaporation rate of about 2,100 mm. High wind speeds are a predominant feature of the region, with March to May being the prevailing wind period. Northwest winds dominate throughout the year, with an annual average wind speed ranging between 3.5 and 4 m s-1. The terrain in the region primarily consists of high plains, hills, and shallow mountains, with an average altitude exceeding 1,000 m. Calcareous soil prevails in the sandy grassland area, while wind-sand areas are predominantly comprised of wind-sand soil. Xilingol grassland is among the primary natural grasslands in the northern grassland area. Dominant plant communities within the study area include Stipa grandis, Agropyron cristatum, Leymus chinensis, and A. frigida, most of which are xerophytic weeds.
The observed blowout in this study is situated in the northeast of Duolun County, Xilin Gol League, at coordinates 116°50′5″E and 42°14′26″N. It assumes an oval shape, measuring 40.8 m in length, 27.6 m in width, and attaining a depth of 2.72 m (Figure 1). Its orientation runs from west to east. Soil collapses flank both the north and south walls of the blowout, with the northern wall exhibiting a steeper incline compared to the southern wall. Both walls present concave slopes, featuring steep upper sections and gentler lower sections. The slopes measure between 11 and 15° on the south wall and between 19 and 30° on the north wall. The darkened areas flanking the blowout’s perimeter signify the original soil layer, protruding approximately 20–30 cm due to intense wind erosion. The western edge of the erosion vent appears narrow, serving as the inlet section for airflow, with a relatively gradual slope. To the east of the blowout lies a sand accumulation region resulting from wind-driven sand deposition. This depositional lobe spans a length of 26.4 m, a width of 23.9 m, and the apex of the dune rises 1.3 m above ground level. The wind separation inside the blowout is strong, substantial, resulting in a concentrated distribution of sand particles. The surface soil predominantly consists of fine and medium sand particles, comprising approximately 92.67% of the content. The proportion of extremely fine sand and powdery particles is relatively low, with an average particle size of 0.25–0.38 mm.The blowout exhibits noticeable sand activity, with only sparse vegetation covering the blowout floor.
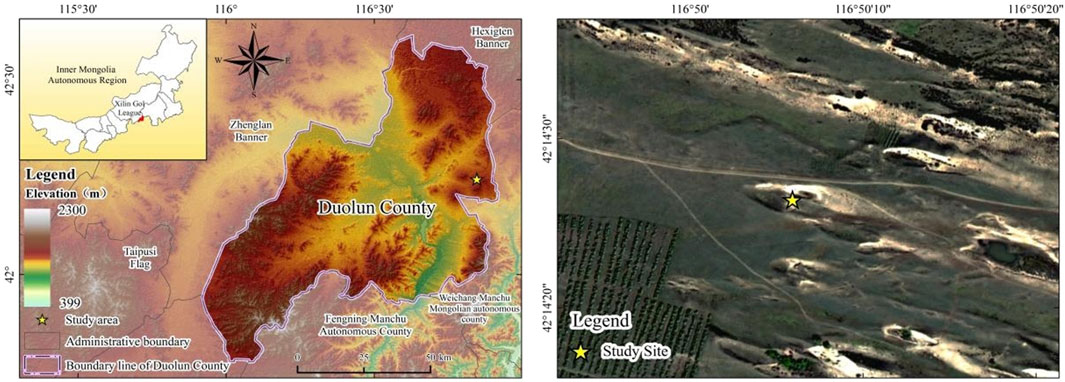
Figure 1. Location map of the study area and satellite images of the study area.
3 Methods
3.1 Airflow observation
From 25 April 2022 to 30 April 2023, observations were conducted on wind direction, wind speed, and sand transport in the blowout of Xilinguole grassland. And an automatic weather station (TZXBF01102W, United States) was established in the blowout observation area. These stations are capable of simultaneously observing conventional meteorological factors such as temperature, wind direction, wind speed, solar radiation, ground temperature, and evaporation. The scanning frequency of the automatic weather station was 2 min, and the recorded data was the average value of the data within 30 min. The monitoring data were obtained from the website (http://cloud.usr.cn/). The observation periods panned 12 months, from 2022 to 2023.
The objective of this study was to examine changes in wind speed and airflow patterns, the structure of wind-blown sand flow, and variations in sand transport rates in the depositional lobes outside the blowout, on the slope of the blowout, and in different deflation basins within the blowout. The aim was to elucidate the dynamics of wind-blown sand in the blowout. To monitor wind direction and speed variations within the blowout, 23 observation points were established at various locations. These points were monitored at heights of 0.1 m, 0.3 m, 0.5 m, 1.0 m, and 2.0 m, with five different wind cup heights installed at each point for wind speed measurements. Additionally, 12 wind direction indicators were positioned at a height of 0.3 m within the blowout and at 0.3 m and 2 m in the reference tower to track wind direction changes. These observation points included positions such as the front of the blowout, the air inlet, the slopes on both sides, the bottom of the blowout, the air outlet, and the depositional lobe behind the blowout (Figure 2). The observation setup mirrored that of the reference tower, positioned 5 m from the blowout inlet. Observations were conducted using three cup anemometer of HOBO S-WSB-M003 model and wind vanes of the HOBO S-WDA-M003 model. All observation instruments were connected using the data collector of the HOBO H21 model, and all instruments were calibrated before the experiment. The wind direction and wind speed observation data are recorded at a 5-s interval, with continuous observations conducted every 30 min. For analysis purposes, the average value of each set of observation data is used. The rate of wind speed acceleration serves as an indicator of wind speed changes at each position within the blowout and is crucial for assessing airflow alterations. In this study, the wind speed acceleration rate was calculated using the formula defined by (Jackson and Hunt (1975):
where, Represents the wind speed acceleration rate, denotes the measured wind speed at height z (m·s⁻1), and represents the measured wind speed (m·s⁻1) at the same height of the reference station.
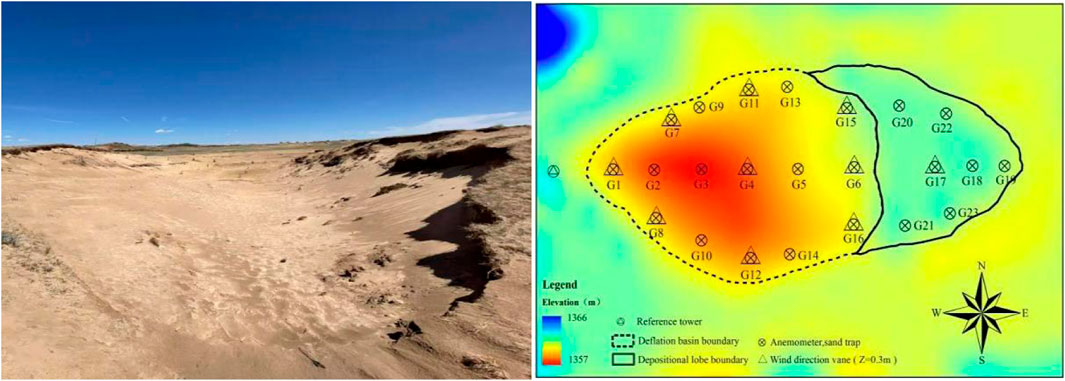
Figure 2. The overall shape of the blowout and the layout of the observation points. The actual map of the blowout is taken for the sand accumulation area of the blowout. The elevation map is the point of observation of wind speed and sand transport.
3.2 Sand transport observation
The research utilized a self-made sand accumulation instrument to monitor sand transport at various locations within the blowout. Positioned effectively at 30 cm above ground level, the instrument featured collection tubes measuring 2 cm × 2 cm in cross-section. The collection pipes of each layer of the sand accumulation instrument are kept parallel to the blowout sand surface, and the pipe mouth of the sand accumulation instrument is aligned with the incoming wind direction. Aligned with wind speed points, the sand accumulation observation point corresponded, and the instrument automatically adjusted its orientation to accumulate sand in accordance with wind direction (Figure 2). Observational data were collected based on wind direction and speed stability, along with ground sand conditions. Sand accumulation was conducted three times, spaced 30 min apart. Sand samples were collected, air-dried, and then weighed with a precision of 0.001 g using a balance.
4 Results
4.1 Wind direction change of blowout
At a height of 2 m above ground level, wind speed and direction changes were monitored at the reference tower (Figure 3). Throughout the observation period, wind conditions remained stable, with speeds predominantly exceeding 6 m·s−1, concentrated mainly between 7 and 9 m·s−1. Wind direction varied between W-NW (270.9°–313.2°), with the prevailing direction originating from WNW (279.1°–300.3°).
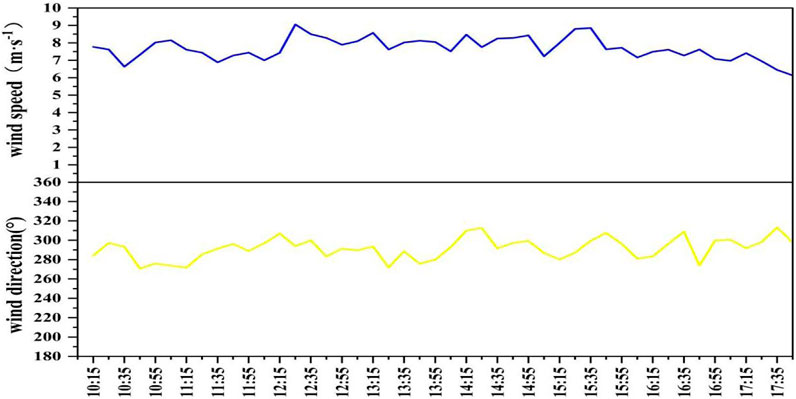
Figure 3. Wind speed and direction at 2 m from the reference tower during observation period.
Figure 4 shows the composite wind direction at a reference station located 2 m above the ground and the corresponding wind direction changes at different observation points along the blowout, positioned at a height of 0.3 m above the ground. In Figure 4A, it is evident that when the synthesized wind direction of the blowout inflow is basically parallel to the long axis (270.9°≤θ < 281.4°), the measuring point G7 at the west inlet deviates towards the north wall, and the airflow direction at G1 and G8 aligns closely with the long axis of the blowout and moves towards the east outlet direction. When the airflow enters the bottom of the blowout, G11 and G12 erode along the wind direction of the walls on both sides, G4 continues to erode towards the east exit direction, and deviates towards the southeast direction at the position of G6 at the east exit. The composite wind direction at G15, G6, and G16 is W-WNW, while the composite wind direction at observation point G17 in the depositional lobe is WNW. These findings indicate that the airflow undergoes a significant change in wind direction after the blowout. When there is an angle between the synthesized wind direction of the incoming flow and the long axis direction of the blowout (281.4°≤θ < 293.6°), a significant change in airflow direction is observed at the west inlet of the blowout (G7, G1, G8) compared to Figure 4A. Specifically, G7 and G1 are eroded towards the north side wall, while G8 is deflected towards the south side wall. When the airflow reaches the bottom of the blowout, the airflow direction on the north wall G11 contracts inward, while the bottom measuring point G4 continues to deflect towards the north wall. As a result, the airflow blows out parallel to the long axis of the blowout at the east outlet G15, while G6 blows out in a southeast direction. These findings emphasize the influence of the deviation in inflow direction on the wind direction observed at each measuring point within the blowout.
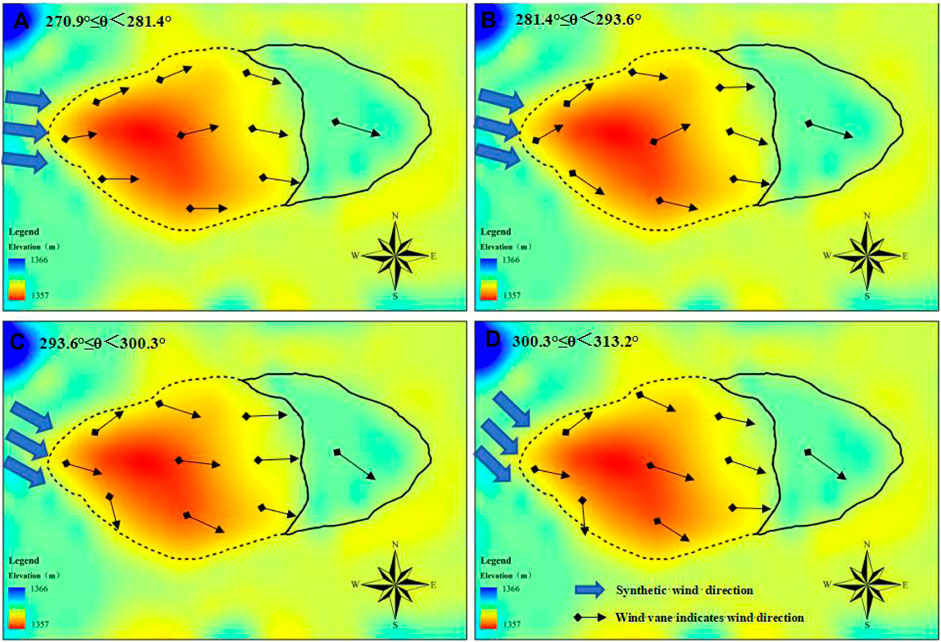
Figure 4. Wind direction variation of the airflow inside the blowout. The blue arrow represents the composite wind direction (z = 2 m) at the top of the reference tower. The black arrow represents the wind direction at the measuring point inside the blowout (z = 0.3 m).
Figure 4C shows the variation inside the blowout in the composite wind direction of the incoming flow (293.6°≤θ < 300.3°). When compared with Figure 4B, it is observed that the wind direction alters in the west inlet G1 and G8. Specifically, the wind direction at G1 changes from WSW to WNW, while at G8 it blows towards the south wall. The wind direction from G7 to G11 extends from the north wall to the inside of the blowout, and at observation points G4 and G6, the airflow direction is parallel to the major axis and blows out from the east outlet. When the angle between the synthesized wind direction of the incoming flow and the major axis is at its maximum, the direction of the airflow inside the blowout changes significantly. Particularly, the angle between the wind direction at the observation point G8, situated at the west inlet, and the south wall is at its maximum, resulting in airflow blowing out from the south wall. The airflow direction at G1-G4-G6 is WNW, while G11 and G12 experience airflow towards the southeast wall. During variations in the incoming wind direction (270.9°≤θ < 313.2°), the composite airflow direction at the depositional lobe (G17) is W-WNW and consistent with the trend of the incoming wind direction.
4.2 Wind speed change of blowout
Figure 5 illustrates the change in wind speed acceleration rate at each measuring point along the longitudinal section of the blowout. Concurrently, the wind direction and speed at control observation points outside the blowout are synchronously observed. At the control observation points located at 0.1 m, 0.3 m, 0.5 m, 1 m, and 2 m, the wind speeds are measured at 2.59 m s⁻1, 4.80 m s⁻1, 4.85 m s⁻1, 6.44 m s⁻1, and 7.50 m s⁻1, respectively. The synthetic wind direction of the wind flow into the blowout is 294.7°. On the vertical section of the blowout, Figures 5A–C) depict the changes in wind speed on the north wall, the central axis section, and the south wall of the blowout, respectively. On the central axis section (Figure 5B), the wind speed increases rapidly by 27%–54% at each height when the airflow enters from the west entrance (G1) of the blowout. As the airflow enters the front bottom section (G2) of the blowout, the wind speed at heights of 0.1 m and 0.3 m near the surface increases by 11% and 5% respectively, while the wind speed at other heights gradually decreases. When the airflow enters the bottom of the blowout (G3, G4), the wind speed gradually decreases, with the maximum wind speed at 2 m decreasing by 29%. Until the airflow reaches the eastern outlet of the rear section of the blowout (G5, G6), the wind speed gradually increases. In the depositional lobe, the wind speed increases rapidly from the edge of the blowout to the top of the depositional lobe (G17). The wind speed at 0.1 m near the surface increases by 58%, and the wind speed decreases rapidly at the upper section of the leeward slope (G18) in the depositional lobe, before increasing again after the leeward slope. From measuring point G1 in the deflation basin of the blowout to measuring point G19 in the depositional lobe of the blowout, the airflow exhibits a pattern of initially increasing, then decreasing, and then increasing again. Across the deflation basin to the depositional lobe, the changes in height at each observation point indicate that the closer the measuring point is to the surface wind speed, the more pronounced the change, with the lowest wind speed acceleration rate occurring at the bottom of the blowout (G3, G4).
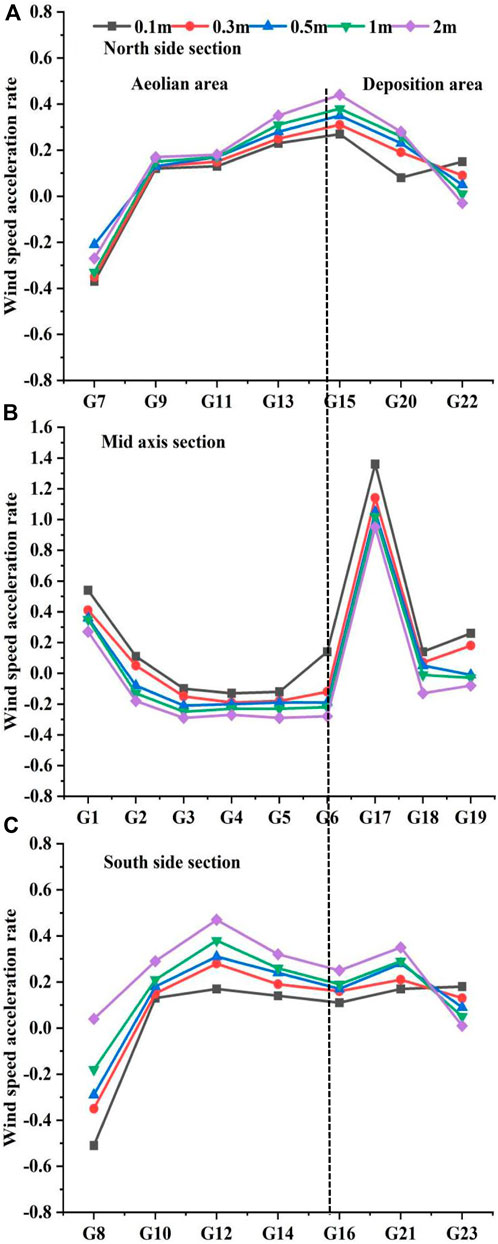
Figure 5. Variation of wind speed at different observation points at different heights.
The airflow along the north and south walls in the longitudinal section of the blowout (Figures 5A, C) was directed from west to east. Wind speed acceleration in the deflation basin of the north wall gradually increased, reaching its peak at the eastern exit of the blowout (G15). Conversely, in the deflation basin of the south wall, wind speed acceleration initially increased, then decreased, with the highest rate occurring in the middle of the blowout (G12). In the depositional lobe, the height of each measuring point on the north wall exhibited a pattern of initial decrease followed by an increase. Conversely, the variation in height for each measuring point on the south wall was opposite to that of the north wall. Apart from the measuring points on the leeward slope (G22 and G23) in the depositional lobe of the blowout, there was a noticeable correlation between the observation height of the north and south walls and the magnitude of wind speed change.
4.3 Structure characteristics of wind-sand flow in blowout
To better comprehend the relationship between sand concentration and height at various locations of blowouts, a histogram was constructed depicting the relationship between cumulative sediment transport rate and height. Analysis of Figure 6 reveals that sand flow migration primarily occurs near the surface across different positions of the blowout. Across varied wind directions and speeds, over 90% of sediment transport takes place within the 0–25 cm height range. Noticeable disparities exist in the vertical sand flow structure at distinct observation points of the blowout. Figures 6A–C illustrates the sand transport height at the north (G7), middle (G2), and south (G8) observation points on the cross-section at the western entrance of the blowout. Across the three wind directions and speeds, more than 50% of sediment transport occurs within the 0–5 cm height range, while over 75% of sediment transport at G7 and G8 transpires within the 0–10 cm height range. Additionally, more than 90% of sediment transport falls within the 0–15 cm height range, and over 95% within the 0–20 cm height range. Notably, over 75% of sand transport height at G2 lies within the 0–15 cm range, with over 90% and 95% of sand transport height occurring within the 0–25 cm and 0–30 cm ranges respectively. As wind speed increases, sand transport height also rises, with the total sand transport height at G2 surpassing that of G7 and G8. At the three observation points of the eastern outlet of the blowout (G15, G6, G16), more than 50% of sand transport height at the southern section (G16) falls within the 0–5 cm range, while over 75%, 90%, and 95% fall within the 0–10 cm, 0–15 cm, and 0–25 cm ranges respectively. The total sand transport range of G16 is lower than that of G15, and G15 is lower than G6.
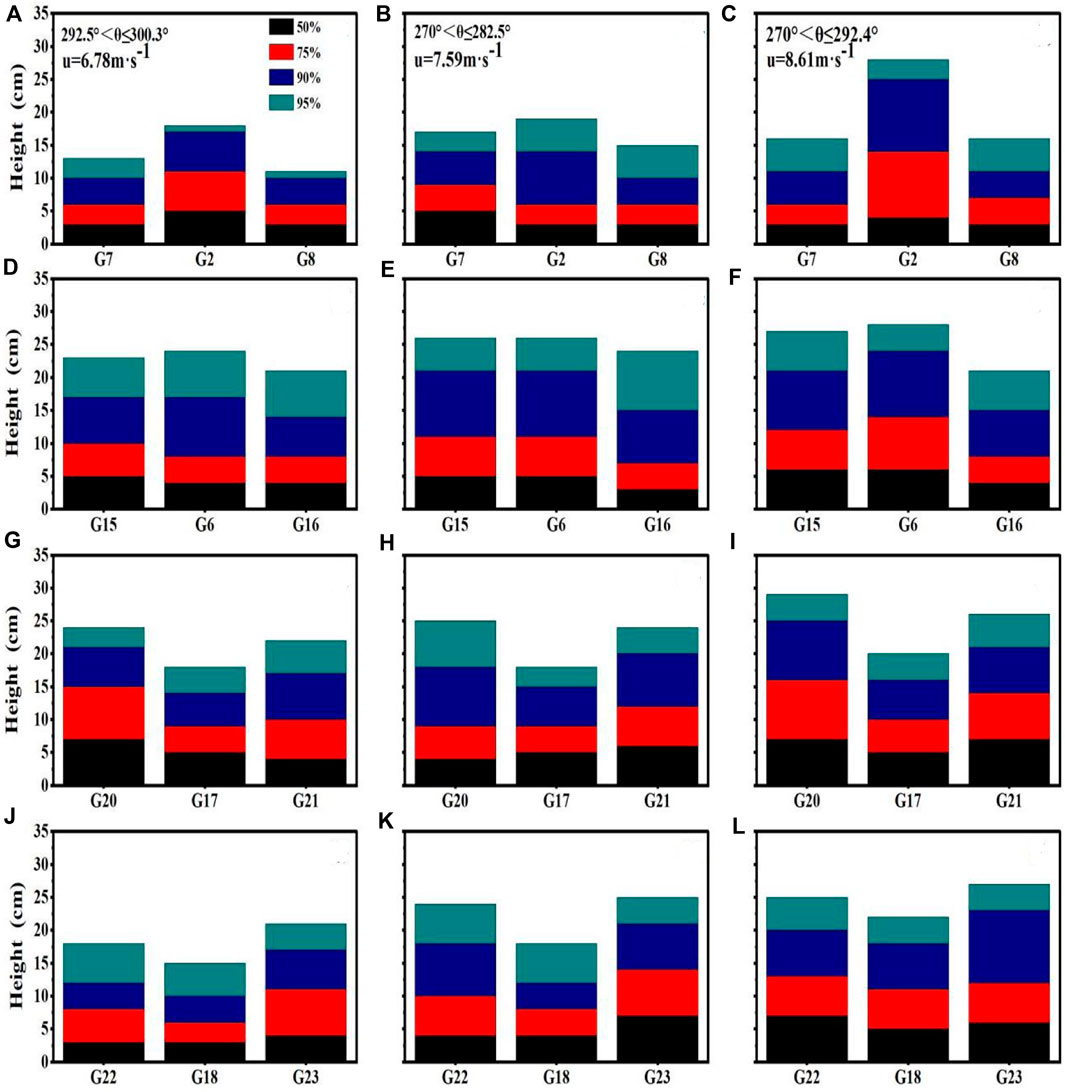
Figure 6. Accumulated sediment transport height of observation points at different positions of blowout.
At observation point G17, situated on the central axis section atop the blowout (Figures 6G–I), more than 75% of sand transport occurs within the height range of 0–10 cm, with over 95% within 0–20 cm. The total sediment transport height at the north and south sections (G20, G21) exceeds that at the central axis point (G17). Similarly, on the leeward slope of the depositional lobe (G22, G18, G23), the total sediment transport height at the central axis point is lower than that at the north and south points, with the north section slightly lower than the south. In summary, the total sediment transport height at the north and south sections of the west entrance (G7, G2, G8) and the east exit (G15, G6, G16) of the blowout is lower than at the central axis section. Conversely, the total sediment transport height at the north and south sections atop the depositional lobe (G20, G17, G21) and on its leeward slope (G22, G18, G23) surpasses that of the central axis section. Additionally, sediment transport height at different measuring points increases with wind speed.
4.4 The sand transport rate per unit width within 0.3 m near the surface of the blowout
The sediment transport rate per unit width refers to the amount of sediment transported per unit width perpendicular to the wind direction within a specific time frame. Figures 7D–F depict the sediment transport rate alongside the corresponding wind speed along the longitudinal axis of the blowout, specifically within 0.3 m of height near the surface. Figures 7A–C illustrate the changes in wind direction at the control measuring point during three observation periods. Throughout these observation periods, in Observation 1 (Figure 7A), the primary wind direction is WNW with wind speeds ranging from 4 to 10 m s⁻1, with over 45% of the winds clocking in at 6–8 m s⁻1. In Observation 2 (Figure 7B), the prevailing wind direction shifts slightly to W-WNW, with wind speeds ranging from 4 to 8 m s⁻1, and nearly 30% of the time, the wind speed falls within the range of 4–6 m s⁻1. During Observation 3, the dominant wind direction is W, with wind speeds concentrated between 2 and 6 m s⁻1. Across these observations, the trend in wind speed and sediment transport rate fluctuates, initially decreasing, then increasing, and finally decreasing again from the west entrance to the east exit of the blowout. The peak values for wind speed and sediment transport rate occur in Observation 1, as depicted in Figure 7D, whereas the trough values are observed in Observation 3, illustrated in Figure 7F. In both Observation one and Observation 2, the lowest sediment transport rate is observed at the bottom of the blowout (G4) within the deflation basin, while the highest rate occurs at the top of the dune (G17) in the sand accumulation zone, aligning with changes in wind speed. However, in Observation 3, although the lowest sediment transport rate still appears at the bottom of the blowout (G4) within the wind deflation basin, the lowest wind speed occurs at point (G3). Furthermore, across the three observations, the greater the wind speed at the west entrance (G1) of the blowout deflation basin, the larger the disparity in sand transport rate between the east exit of the deflation basin (G6) and the top of the depositional lobe (G17).
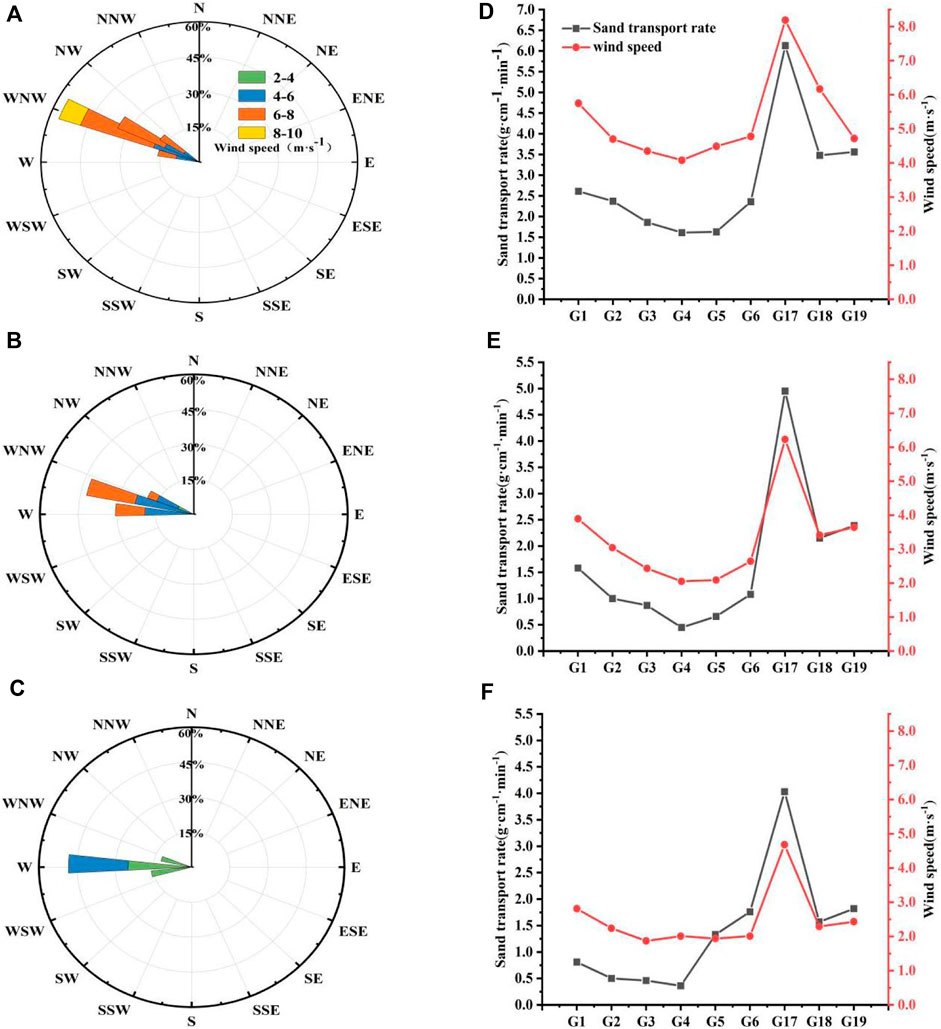
Figure 7. The wind rose at the top of the observation point and the average wind speed and sediment transport rate simultaneously observed on the longitudinal axis of the blowout.
Figure 8 illustrates the variations in wind speed and sand transport rate across two selected cross sections within the blowout deflation basin and the depositional lobe. In the deflation basin (Figures 8A–F), the lowest sand transport rates are observed at positions G2 and G6. Along the cross section, the sand transport rate is higher on the north and south walls compared to the central axis section. At measurement points G7, G2, and G8, the sand transport rate correlates closely with wind speed. However, at measurement points G15, G6, and G16, the sand transport rate on the north wall significantly exceeds that on the south wall, desblowoute insignificant changes in wind speed. In the depositional lobe (Figures 8G–1), the pattern of sediment transport rate variation is opposite to that observed in the deflation basin. The highest sediment transport rate occurs in the central axis section (G17), while the sediment transport rates on the north and south sides of the dune top (G20, G21) are notably lower than those in the central axis section (G17). On the cross section of the leeward slope of the dune, apart from observation 1 (Figure 8J) at G18, where the sediment transport rate is significantly higher than at G22 and G23, the variations in sediment transport rate are similar across the other two observations.
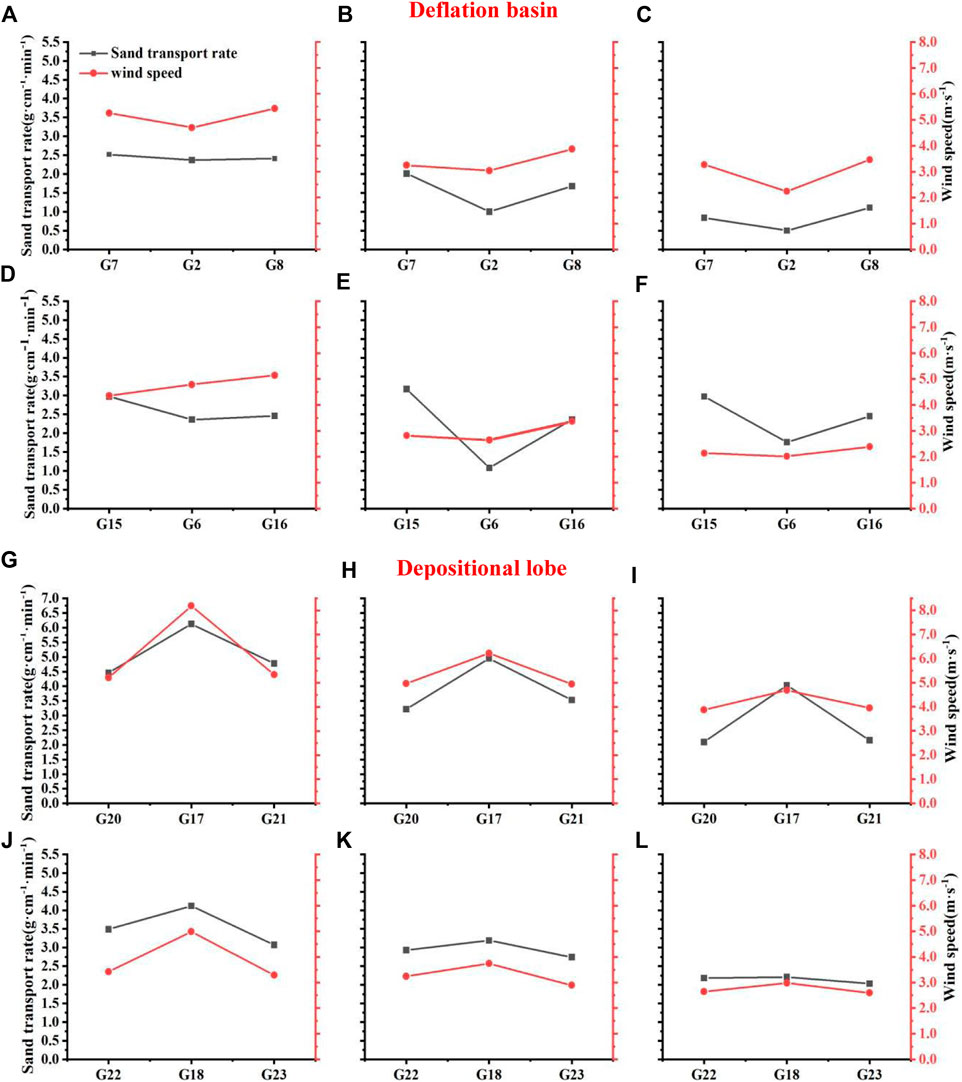
Figure 8. Average wind speed and sediment transport rate simultaneously observed on the transverse axis of the blowout.
Based on the results depicted in Fig.7and8, the variation in sediment transport rate and wind speed is evident in both longitudinal and cross-sectional analyses. It is observed that the change in sediment transport rate aligns closely with fluctuations in wind speed, particularly from the blowout deflation basin to the sand accumulation zone. The airflow gradually intensifies from the western to the eastern directions along both the southern and northern walls, reaching its peak at the hill’s summit before diminishing. This pattern mirrors the observed changes in the horizontal airflow field as outlined in the longitudinal section analysis. Furthermore, the sediment transport rate is notably higher on the north and south peripheries of the deflation basin compared to the central axis section. Conversely, in the depositional lobe, the sediment transport rate is lower on the north and south sides than on the central axis section.
5 Discussion
5.1 Airflow structure
The airflow observation results reveal that the interaction between wind from various directions and the terrain induces substantial alterations in the airflow structure within the blowout, consequently impacting the distribution of wind speed within it. In the entire blowout airflow study (Figure 4), we observed that the clearest rotation of wind direction occurred at point G1 on the central axis when the airflow entered from the west entrance of the blowout. This can be attributed to the topographical characteristics of the area. The slope, on the windward side, which does not enter the blowout, is relatively gentle, while the slope at the west entrance is leeward and the entrance itself is narrow. The airflow is affected by the terrain and slope, with the northwest wall having a higher terrain. Therefore, when the incoming airflow aligns closely with the west wind, the deviation in wind direction at point G1 is minimal. Conversely, when the incoming airflow aligns with the northwest wind, the deviation in airflow direction is more pronounced. Notably, the direction of airflow is also greatly influenced by the direction of incoming flow, especially the angle between the incoming flow direction and the long axis of the blowout. This angle directly affects the airflow direction inside the blowout, causing significant changes in the direction of observation points on the north and south walls. When the angle between the incoming wind direction and the major axis is close to parallel (Figure 4A), the airflow on both sides of the walls cascades in parallel and diffuses towards the east exit. However, when the angle between the incoming wind direction and the major axis is less than 15° (Figure 4B), the airflow direction of the west inlet on the north and south walls first blows along the slopes on both sides, and then the airflow direction on the north wall deflects inward. The north wall is influenced not only by the incoming flow direction but also by its leeward slope. The most significant expansion of the blowout terrain occurs at measurement point G11 on the north wall. Moreover, when the angle between the incoming flow direction and the major axis is greater than 15° (Figures 4C, D), the G8 point on the south wall deviates from its typical direction along the slope towards the south wall, and the terrain on the south wall is lower than that on the north wall. The airflow blows out at the G8 point.
Along the longitudinal axis of the blowout, the near-surface wind speed change curve exhibits consistency with the terrain alteration trend, as depicted in Figure 5. As the airflow approaches the western edge of the erosion blowout, it undergoes acceleration, followed by rapid expansion and deceleration upon entering the blowout’s bottom. Subsequently, the airflow accelerates towards the east along the bottom and the north and south walls of the erosion blowout, as shown in Figure 5A, C, in agreement with the findings of Hugenholtz and Wolfe (Hugenholtz and Wolfe, 2006). Upon ascending from the rear section of the erosion blowout to the windward surface of the dune within the depositional lobe, the airflow experiences compression and acceleration due to the abrupt elevation change in terrain, resulting in maximum wind speed atop the dune. Upon traversing the dune’s summit, the airflow disperses and decelerates along the leeward slope, influenced by terrain and vegetation. This cyclic process perpetuates, leading to varying degrees of wind erosion expansion on both sides of the erosion blowout. The rear section of the erosion blowout extends continuously eastward, and the dunes within the depositional lobe migrate in the same direction. Consequently, the grassland on the plateau becomes buried beneath the advancing dunes. On both the north and south sides of the wall (Figures 5A, C), the wind speed acceleration rate at the same measuring point in the erosion blowout and depositional lobe increases with the observation height, while the wind speed acceleration rate in the two areas on the central axis section of the blowout decreases with observation height. This discrepancy arises due to the differing topographies of the central axis section compared to the north and south side walls. The airflow undergoes acceleration, deceleration, reacceleration, redeceleration, and recovery as it enters from the blowout entrance. Closer to the surface, the influence of wind speed acceleration rate becomes more pronounced.
5.2 Changes in sediment transport
The interaction between airflow and terrain is the main factor affecting the structure of wind-driven sand flow observed in blowout areas. Observation 1 (Figure 6A)exhibits the lowest wind speed, while observation 3 (Figure 6C) registers the highest. It is evident that higher wind speeds correspond to greater cumulative sediment transport heights. The total sediment transport height on the north and south sides of the western entrance (G7, G2, G8) and the eastern exit (G15, G6, G16) of the blowout is lower than that of the central axis section. This phenomenon can be attributed to the significant slope of the terrain, particularly at the central axis position of the west inlet and east outlet. The fast uplift of the airflow further contributes to the substantial amplitude of sand particle lift and the resulting high sediment transport height. Conversely, the total sediment transport height on the north and south sides of the top of the depositional lobe (G20, G17, G21) and the leeward slope of the depositional lobe (G22, G18, G23) surpasses that of the central axis section, contrary to the sediment transport rate of the blowout cross section. Due to greater sediment transport within 0–10 cm near the surface on both sides of the erosion blowout compared to the central axis, when the total sediment transport in the central axis reaches 95%, its total sediment transport height consistently exceeds that on both sides of the blowout. In the depositional lobe, 75% of sediment transport at the top of the dune (G17) occurs within a height of 10 cm, while the sediment transport height of G20 and G21 falls within the range of 0–15 cm, which is also related to the topography of depositional lobe shaped sand dunes.
During the observation of sediment transport rate, it is crucial to consider the accumulation of sediment in the depositional lobe, which primarily originates from the deflation basin. The variations in sediment transport rate are influenced by factors such as airflow direction, wind speed, vegetation coverage, and terrain. The wind speed in observation one is the highest with a wide range, while the wind speed in observation two is the second highest, and the wind speed in observation three is the smallest but more concentrated (Figures 7A–C). At each observation point in the deflation basin of the blowout and the depositional lobe behind the blowout, the variation trend of the sand transport rate and wind speed observed simultaneously is roughly the same. This indicates that when the incoming wind direction is W-WNW, wind speed becomes the primary factor affecting sediment transport in the blowout. Across the three observations, it is noticeable that the highest values of sand transport rate and wind speed occur at the top of the dune in the depositional lobe behind the blowout (G17). The wind speed at the dune’s apex is the fastest and most stable, consistent with the findings of Smyth et al. (2014). The more stable the wind speed at the blowout, the greater the sand transport rate. After a blowout event, the sand material on the top of the depositional lobe becomes highly mobile and devoid of vegetation coverage. However, on the leeward slope of the depositional lobe, the sand transport rate of G18 and G19 is lower than that of G17. In addition to airflow reasons, the sand material in the depositional lobe is covered by vegetation. At the measuring points G18 and G19, the sand dune thickness is lower and vegetation coverage is higher. Vegetation intercepts the sand material, resulting in a decrease in the sand transport rate. In the longitudinal section of the blowout (Figures 7D–F), the sediment transport rate aligns with the synchronous change in wind speed observed. In both the depositional lobe (Figures 8G–1) and deflation basin (Figures 8A–C) of the blowout’s cross-section, the sediment transport rate mirrors the trend in wind speed during the same time period. However, at the measuring point position of the cross-section in the deflation basin (Figures 8D–F), the sediment transport rate of the three observations does not consistently correspond with the change in wind speed. This disparity is attributed to factors beyond airflow influencing sediment transport rate. The sediment transport rate is not only affected by air flow and vegetation coverage, but also by terrain. Especially, in the deflation basin, the different heights and slopes of the two walls, as well as the differences in terrain between the two walls and the bottom, play a significant role. In previous studies of coastal blowouts (Hart et al., 2012; Halls and Bennett, 2012; Hernández-Cordero et al., 2015), the maximum sediment transport rate is typically found at the base of dunes and erosion blowouts in the depositional lobe. However, in this study, the sediment transport rate at the bottom of the erosion blowout is lower than that on the north and south sides, while the sediment transport rate at the top of the sand dune in the depositional lobe is higher than on the leeward side of the dune. This difference arises from the location of the blowout in a sandy grassland area, distinct from the coastal blowout’s geographical environment. Eddy currents form on both sides of the blowout as a result of the slope and vegetation cover. In the deflation basin, the sediment transport rate on the north side wall is basically higher than that on the south side wall. This discrepancy can be attributed to the steeper slope and higher elevation of the north-facing wall, resulting in a larger supply of sand material from this side. Additionally, the north-facing wall experiences higher wind speeds, further contributing to the variance in sediment transport rates between the two walls. Consequently, the sediment transport rate on both sides of the wall exceeds that at the bottom of the blowout. Moreover, the grassland on the leeward side of the depositional lobe remains uneroded with high vegetation coverage, creating turbulence to disperse and decelerate airflow. Hence, the sand transport rate on the leeward side of the depositional lobe is lower than at the dune’s peak.
5.3 The influence of airflow and sediment transport on the morphology of blowout
Throughout the entire blowout process, the simultaneous occurrence and interplay of airflow and sediment transport are evident. This interaction between airflow and sediment transport plays a significant role in shaping the blowout When the airflow enters from the west end of the blowout, it accelerates and spreads towards three parts: the north and south walls, and the bottom of the central axis. Then, the wind speed weakens at the bottom of the blowout, and gradually increases. The wind speed accelerates and rushes out at the east exit of the transition between the deflation basin and the depositional lobe, reaching its maximum at the top of the depositional lobe. In a deflation basin, the wind speed and sediment transport on both sides of the wall are greater than those on the central axis section, while the wind speed and sediment transport on the north wall are greater than those on the south wall. Under continuous wind erosion, the bottom of the blowout continues to deepen, resulting in uneven development of the north and south walls. The composite wind direction at the eastern exit of the deflation basin is predominantly W-WNW, which drives the depositional lobe to develop toward southeast. The rapid increase in airflow at the eastern exit also contributes to the eastward extension of the sand dunes within the depositional lobe. Within the depositional lobe, airflow tends to veer towards the southeast, and the sediment transport rate is higher on the south side near the sand dune than on the north side. Consequently, this disparity in sediment transport rates leads to differences in the width of the sand dunes between the north and south sections of the depositional lobe.
6 Conclusion
(1) Changes in wind direction can result in varying airflow patterns inside a blowout. When the angle between the incoming wind direction and the long axis direction of the blowout is less than 15°, airflow on the north and south walls is directed towards the east outlet on both sides, with the axial airflow deflecting towards the north wall. When the angle is greater than 15°, the airflow on the north wall first erodes along the slope and then contracts towards the wellbore. Simultaneously, the airflow on the south wall blows out in a southeast direction, accompanied by a deflection of axial airflow towards the southern wall.
(2) Within the blowout, The wind speed acceleration rate at the same measuring point increases with height on both sides of the wall, while it decreases along the central axis section. Moreover, variations in wind speed acceleration rates differ at different observation heights, yet generally adhere to the same pattern. Notably, closer proximity to the central axis section’s surface amplifies the impact on wind speed acceleration rates, a consequence of the blowout’s intricate terrain.
(3) The changes in the structure of wind sand flow inside the blowout have a certain regularity. The higher the wind speed, the higher the cumulative sediment transport height. The sediment transport height on both sides of the deflation basin is smaller than the axial section, while the sediment transport height of the depositional lobe varies in the opposite direction. The cumulative sediment transport height variation of the deflation basin and depositional lobe is opposite to the sediment transport rate variation of the sediment cross-section.
(4) Except for the leeward slope of depositional lobe, erosion occurred to varying degrees at other measuring points within the blowout. Terrain, vegetation, slope, and aspect can also affect changes in sediment transport rate. The longitudinal airflow will continuously intensify the depth inside the blowout, while the transverse airflow brought by different wind directions will cause the sand material on both sides of the walls inside the blowout to move, causing the blowout to develop deeper and longer.
Data availability statement
The original contributions presented in the study are included in the article/Supplementary material, further inquiries can be directed to the corresponding author.
Author contributions
TG: Conceptualization, Data curation, Methodology, Project administration, Resources, Software, Writing–original draft, Writing–review and editing, Investigation, Supervision, Validation. YG: Methodology, Project administration, Supervision, Writing–review and editing, Resources. LH: Investigation, Writing–review and editing. JY: Investigation, Validation, Writing–review and editing. WY: Investigation, Writing–review and editing. XG: Investigation, Writing–review and editing.
Funding
The author(s) declare financial support was received for the research, authorship, and/or publication of this article. This study is funded by the Inner Mongolia Autonomous Region Science and Technology Plan Project (Project No.: 2022YFDZ0027).
Acknowledgments
Thank you to my supervisor Yong Gao for his guidance and assistance.
Conflict of interest
The authors declare that the research was conducted in the absence of any commercial or financial relationships that could be construed as a potential conflict of interest.
Publisher’s note
All claims expressed in this article are solely those of the authors and do not necessarily represent those of their affiliated organizations, or those of the publisher, the editors and the reviewers. Any product that may be evaluated in this article, or claim that may be made by its manufacturer, is not guaranteed or endorsed by the publisher.
References
Abhar, K. C., Walker, I. J., Hesp, P. A., and Gares, P. A. (2015). Spatial-temporalevolution ofaeolianblowout dunes at cape cod. Geomorphology 236, 148–162. doi:10.1016/j.geomorph.2015.02.015
Arens, S. M., Van Boxel, J. H., and Abuodha, J. O. Z. (2002). Changes in grain size of sand in trans-port over a foredune. Earth Surf. Process. Landf. 27 (11), 1163–1175. doi:10.1002/esp.418
Catto, N., Macquarrie, K., and Hermann, M. (2002). Geomorphic response to late holoceneclimate variation and anthropogenic pressure, northeastern prince edward island, Canada. Quat. Int. 87 (1), 101–117. doi:10.1016/s1040-6182(01)00065-9
Dominguez, J. M. L., and Barbosa, L. M. (2004). Coastal dune fields at the São Francisco River strandplain, northeastern Brazil: morphology and environmental controls. Earth Surf. Proc. Land 29 (4), 443–456. doi:10.1002/esp.1040
Gares, P. A., and Nordstrom, K. F. (1995). A cyclic model of foredune blowoutevolution for a leeward coast: island Beach, New Jersey. Ann. Assoc. Am. Geogr. 85 (1), 1–20. doi:10.1111/j.1467-8306.1995.tb01792.x
Guo, Z., Jiang, H., and Chunxing, H. (2023). Research progress on the morphology-dynamic process of blowout in sandy grassland J. South. Agric. Mach. 54 (21), 1–5.
Gutiérrez-Elorza, M., Desir, G., Gutiérrez-Santolalla, F., and Marín, C. (2005). Origin and evolu-tion of playas and blowouts in the semiarid zone of Tierra de Pinares (Duero Basin,Spain). Geomorphology 72 (1–4), 177–192. doi:10.1016/j.geomorph.2005.05.009
Halls, J. R., and Bennett, J. (2012). Wind and sediment movement in coastal dune areas. Coast. Eng. Proc., 1565–1575. doi:10.9753/icce.v17.93
Hansen, E., DeVries-Zimmerman, S., Dijk, D. v., and Yurk, B. (2009). Patterns of wind flow and aeolian deposition on a parabolic dune on the southeastern shore of Lake Michigan. Geomorphology 105 (s1-2), 147–157. doi:10.1016/j.geomorph.2007.12.012
Hart, A. T., Hilton, M. J., Wakes, S. J., and Dickinson, K. J. (2012). The impact ofAmmophila arenaria foredune development on downwind aerodynamics and parabolic dune develop-ment. J. Coast. Res. 28 (1), 112–122. doi:10.2112/jcoastres-d-10-00058.1
Hernández-Cordero, A. I., Pérez-Chacón Espino, E., and Hernández-Calvento, L. (2015). Vegetal-tion, distance to the coast, and aeolian geomorphic processes and landforms in a transgressive arid coastal dune system. Phys. Geogr. 36 (1), 60–83. doi:10.1080/02723646.2014.979097
Hesp, P. (2002). Foredunes and blowouts: initiation, geomorphology and dynamics. Geomorphology 48, 245–268. doi:10.1016/s0169-555x(02)00184-8
Hesp, P. A. (1996). Flow dynamics in a trough blowout. Bound.-Layer Meteorol. 77 (3–4), 305–330. doi:10.1007/bf00123530
Hesp, P. A., Hilton, M., and Konlecher, T. (2017). Flow and sediment transport dynamics in a slot and cauldron blowout and over a foredune, Mason Bay, Stewart Island (Rakiura), NZ. Geomorphology 295, 598–610. doi:10.1016/j.geomorph.2017.08.024
Hesp, P. A., and Walker, I. J. (2012). Three-dimensional æolian dynamics withina bowl blowout during offshore winds: greenwich Dunes, Prince Edward Island,Canada. Aeolian Res. 3 (4), 389–399. doi:10.1016/j.aeolia.2011.09.002
Hurina, , Eerdun, H., and Haobisi, H. (2019). Dynamic changes of blowouts on fixed sand dunes in the Southeastern fringe of otindag sandy land[J]. J. Desert Res. 39, 34–43. doi:10.7522/J.ISSN.1000-694X.2019.00008
Hugenholtz, C. H., and Wolfe, S. A. (2006). Morphodynamics and climate controls of two aeolian blowouts on the northern Great Plains, Canada. Earth Surf. Process. Landforms 31 (12), 1540–1557. doi:10.1002/esp.1367
Hugenholtz, C. H., and Wolfe, S. A. (2009). Form-flow interactions of an aeolian saucer blowout. Earth Surf. Proc. Land. 34, 919–928. doi:10.1002/esp.1776
Jackson, D. W. T., Beyers, M., Delgado-Fernandez, I., Baas, A. C. W., Cooper, A. J., and Lynch, K. (2013). Airflow reversal and alternating corkscrew vortices in foredune wake zones during perpendicular and oblique offshore winds. Geomorphology 187, 86–93. doi:10.1016/j.geomorph.2012.12.037
Jackson, P. S., and Hunt, J. C. R. (1975). Turbulent wind flow over a low hill. Q. J. R. Meteorological Soc. 101, 929–955. doi:10.1256/smsqj.43014
Jewell, M., Houser, C., and Trimble, S. (2014). Initiation and evolution of blowouts withinPadre island national seashore, Texas. Ocean. Coast Manage 95, 156–164. doi:10.1016/j.ocecoaman.2014.04.019
Jungerius, P. D., Verheggen, A. J. T., and Wiggers, A. J. (1981). The development of blowouts in ‘de blink’, a coastal dune area near Noordwijkerhout, The Netherlands. Earth Surf. Process Landf. 6, 375–396. doi:10.1002/esp.3290060316
Li, S. Q., Zhang, P., Eerdun, H., Du, H. S., Wu, X., and Yang, Y. (2012). Interaction between airflow and shape of saucer blowout in Sandy Grassland. J. Desert Res. 32 (5), 1201–1209. doi:10.1007/s11783-011-0280-z
Luo, W., Wang, Z., Lu, J., Yang, L., Qian, G., Dong, Z., et al. (2018). Mega-blowouts in qinghai-tibet plateau: morphology, distribution and initiation. Earth Surf. Process Landf. 44, 449–458. doi:10.1002/esp.4507
Luo, W., Wang, Z., Shao, M., Lu, J., Qian, G., Dong, Z., et al. (2019). Historical evolution and controls on mega-blowouts innortheastern Qinghai-Tibetan Plateau, China. Geomorphology 329, 17–31. doi:10.1016/j.geomorph.2018.12.033
Mir-Gual, M., Pons, G. X., Martín-Prieto, J. Á., Roig-Munar, F. X., and Rodríguez-Perea, A. (2013). Geomorphological and ecological features of blowouts in a western Mediterranean coastal dune complex: A case study of the Es Comú de Muro beach-dune system on the island of Mallorca, Spain. Geo-Mar Lett. 33, 129–141. doi:10.1007/s00367-012-0298-7
Pease, P., and Gares, P. (2013). The influence of topography and approach angles on local deflections of airflow within a coastal blowout. Earth Surf. Process. Landf. 38 (10), 1160–1169. doi:10.1002/esp.3407
Smith, A., Gares, P. A., Wasklewicz, T., Hesp, P. A., and Walker, I. J. (2017). Three years of morphologic changes at a bowl blowout, Cape Cod, USA. Geomorphology 295, 452–466. doi:10.1016/j.geomorph.2017.07.012
Smyth, T. A. G., Jackson, D., and Cooper, A. (2014). Airflow and aeolian sediment transport patterns within a coastal trough blowout during lateral wind conditions. Earth Surf. Proc. Land. 39 (14), 1847–1854. doi:10.1002/esp.3572
Smyth, T. A. G., Jackson, D. W. T., and Cooper, J. A. G. (2012). High resolution measured and modelled three-dimensional airflow over a coastal bowl blowout. Geomor phology 177–178, 62–73. doi:10.1016/j.geomorph.2012.07.014
Smyth, T. A. G., Jackson, D. W. T., and Cooper, J. A. G. (2013). Three dimensional airflow patterns within a coastal trough–bowl blowout during fresh breeze to hurricane force winds. Aeolian Res. 9, 111–123. doi:10.1016/j.aeolia.2013.03.002
Sun, Y., Hasi, E., Liu, M., Du, H., Guan, C., and Tao, B. (2016). Airflow and sediment movement within an inland blowout in Hulun Buir sandy grassland, Inner Mongolia, China. Aeolian Res. 22, 13–22. doi:10.1016/j.aeolia.2016.05.002
Wang, S., and Hasi, E. (2009). Air flow dynamics of the blowout trough in the Hulun Buir sandy grassland. Sci. Soil Water Conserv. 7 (2), 80–85. doi:10.16843/j.sswc.2009.02.014
Wang, S., Hasi, E., Zhang, J., and Zhang, P. (2007). Geomorphological significance of air flow over saucer blowout of the Hulun Buir sandy grassland. J. Desert Res. 27 (5), 745–749. doi:10.1631/jzus.2007.B0900
Yan, X., Zhang, D. P., Xia, X. D., and Hasi, E. (2009). Morphology and developmental mode of blowouts in Hulun bur sandy grassland, China. J. Desert Res. 2 (2), 212–218.
Yu, S, Hui-Shi, D. U., Mei-Ping, L, et al. (2015). A Review on Morphodynamic Processes of Blowouts[J]. Scientia Geographica Sinica 30 (12):1564–1569. doi:10.1007/s11629-011-2067-x
Zhang, D. P., Sun, H. W., Wang, X. K., and Feng, Z. W. (2007). HulunBuir sandy grasslandblowouts (II): process of development and landscape evolution. J. Desert Res. 27 (1), 20–24. doi:10.3321/j.issn:1000-694X.2007.01.010
Zhou, Y., Wang, Z., Muni, Q., Hu, R., Yin, J., Wu, Z., et al. (2023). Morphological changes and dynamic mechanism of blowouts on fixed dunes in the Otingdag sandy land, China. Sci. Bull. 68 (11), 1298–1311. doi:10.1360/tb-2022-0204
Keywords: grassland blowout, deflation basin, depositional lobe, flow dynamics, aeolian sedimentation
Citation: Gao T, Gao Y, Huang L, Yang J, Yang W and Guo X (2024) Study on wind-sand dynamics observation of blowout in Xilingol sandy grassland. Front. Environ. Sci. 12:1410235. doi: 10.3389/fenvs.2024.1410235
Received: 31 March 2024; Accepted: 27 June 2024;
Published: 22 July 2024.
Edited by:
Zhiwei Xu, Nanjing University, ChinaReviewed by:
Kai Zhang, Northwest Institute of Eco-Environment and Resources (CAS), ChinaJianhua Xiao, Northwest Institute of Eco-Environment and Resources (CAS), China
Yanguang Zhou, Zhejiang Normal University, China
Copyright © 2024 Gao, Gao, Huang, Yang, Yang and Guo. This is an open-access article distributed under the terms of the Creative Commons Attribution License (CC BY). The use, distribution or reproduction in other forums is permitted, provided the original author(s) and the copyright owner(s) are credited and that the original publication in this journal is cited, in accordance with accepted academic practice. No use, distribution or reproduction is permitted which does not comply with these terms.
*Correspondence: Yong Gao, MTM5NDg4MTU3MDlAMTYzLmNvbQ==