 Zhaowei Yin1
 Xiaoping Zhang
- 1School of Architecture, Tianjin University, Tianjin, China
- 2School of Architecture and Urban Planning, Shandong Jianzhu University, Jinan, China
- 3School of Architectural Engineering, Tongling University, Tongling, China
The global climate crisis is escalating, and urban living Space (ULS) is a significant contributor to carbon emissions. How to improve the carbon suitability of ULS while promoting social and economic development is a global issue. This study aims to develop an evaluation system for comparing and analyzing carbon suitability inequality and spatial differences in different areas. To achieve this goal, an urban living space carbon suitability index (ULS-CSI) based on spatial organizational index (SOI) has been proposed. The ULS-CSI was calculated at the area scale in Tianjin using information from the Tianjin Land Use Database in 2021. The carbon emissions coefficient method was used to calculate the urban living space carbon emissions (ULSCE). Moran’I and LISA analysis were used to quantify the spatial differences of ULS-CSI. The results showed that the residential living area (RLA) carbon emissions was the highest at the area scale, with carbon emissions of 1.14 × 10¹¹ kg, accounting for 33.74%. The green space leisure area (GLA) carbon absorption was the highest at the area scale, with carbon absorption of 5.76 × 10⁵ kg, accounting for 32.33%. SOI in different areas have spatial heterogeneity as the SOI such as building area, road network density and land use characteristics are significantly different in different areas. Areas with superior CSI were primarily situated in Heping, Hexi, Nankai, and Beichen, accounting for 83.90%. Conversely, areas under the basic CSI threshold included Xiqing, Jinnan, and Dongli, accounting for 16.10%. Spatial characteristics of ULS-CSI in Tianjin portrayed a significant spatial positive correlation, indicating the highest autocorrelation degree of CSI at 500 m, with a Moran ’I value of 0.1733. Although these findings reflect the spatial characteristics of ULS-CSI and the SOI affecting the ULS-CSI at area scale, more perfect data are needed to reflect the complexity of structural factors affecting ULS-CSI at area scale. This study is helpful for urban planning to develop differentiated carbon reduction strategies and promote low-carbon and healthy urban development.
1 Introduction
Urban living space (ULS) is not only the spatial carrier of our daily clothing, food, housing and transportation, but also a substantial source of carbon emissions (Zheng et al., 2023). Carbon emissions instigated by human endeavors are principally disseminated in diverse categories of ULS including residence, leisure, and employment (Luo et al., 2024). As per the Intergovernmental Panel on Climate Change (IPCC), ULS consumes approximately 67% of the global total energy (Xepapadeas, 2024). The findings of the International Energy Agency (IEA) suggest that ULS will hold sway over 73% of global carbon emissions by 2030 (Zhang et al., 2021). The urban living space carbon emissions (ULSCE) constitute one of the key contributors to global temperature surges, greenhouse effect, and human health risks (Chen et al., 2023; Xian et al., 2024). Studies demonstrate that 8% of healthcare expenditure in developed nations result from ULSCE (Bi and Hansen, 2018). Consequently, with the escalation of ULSCE, the health peril of inhabitants will escalate by 12.06% (Gu et al., 2020). Therefore, reducing ULSCE is of immense significance in mitigating global climate change and promoting public health.
Investigating the relationship between ULSCE and spatial organization index (SOI) represents a pivotal issue in executing comprehensive urban carbon suitability assessments and mitigating ULS. Some scholars have qualitatively analyzed the influence mechanism of SOI on ULSCE through induction and summary method (Leng et al., 2020). Alternatively, the influence of SOI on ULSCE was quantitatively analyzed by establishing relevant measurement models and selecting indicators from dimensions such as scale, density and intensity (Lu et al., 2023; Li Z. et al., 2024). For instance, Li et al. revealed that compact, dense and diverse land use models mitigate ULSCE and airborne pollutants, whereas industrial land expansion is unfavorable for climate change (Peskett et al., 2023). Poggi et al. proposed that urban form, density, and usage spatially shape ULSCE, with a Portuguese city serving as their empirical case study. Results indicate distinct variations in ULSCE among various form patterns, road system configurations, population densities, as well as building features incidences. Notably, differences in ULSCE among urban, suburban, peri-urban, rural locations are significant (Jin and Xu, 2024). Some scholars use field investigation, remote sensing data or statistical data to explore the influencing factors of ULSCE by combining qualitative and quantitative methods. For example, Vaccari discovered 29.1 km2 of urban green space in 102.3 km2 of Florence offset 6.2% of the ULSCE and suggested a suitable carbon model for the suburban green ring (Yan et al., 2023). Wang et al. analyzed the correlation between carbon emissions and SOI of 6,754 ULS in Eindhoven, and found that the combination of mid-high-rise buildings and low-rise buildings had higher carbon emissions (Zhai et al., 2024). Eugenio et al. contended that the presence of built geometric features may influence sky visibility factors, with an enhanced sky visibility factor potentially mitigating the ULSCE and urban heat island effect (Han et al., 2023).
Existing studies have evaluated the relationship between ULSCE and SOI at macro and micro scales (Jiang et al., 2022). However, there are few studies focusing on the characteristics of ULSCE and the impact of SOI at the area scale, and the quantitative model is mainly based on the evaluation framework built for a specific area, which lacks representativeness. Additionally, there are differences in the number and location of different types of ULS, as well as the types of internal use, building area, and building density. Therefore, the empirical evidence on the mechanism and difference of SOI affecting ULSCE is still mixed and inconsistent. Area plays a central role in carbon suitability planning (Gan et al., 2022). It simultaneously operates as a significant macro-scale strategy, serving both as transmission and foundation for micro-block carbon planning, while guiding urban development and construction (Peskett et al., 2023). As an urban physical environment unit and a social function unit, the area is the most important place of daily life for urban residents. The process of urbanization and industrialization has caused the rapid differentiation of residential space, thus shaping different types of areas (Yang et al., 2023; Jin and Xu, 2024). For example, as a type of green space leisure area (GLA) highly dependent on daily life, it is generally believed that GLA may improve the level of recreational physical activity of residents because it provides suitable sites and functions nearby. Within the area, the morphology and mechanism of ULS have certain similarities (Peskett et al., 2023; Zhao et al., 2024).
With the expansion of research fields and the improvement of theoretical methods, the carbon suitability of ULS has become a research perspective and analysis tool for both economic and sustainable development of ULS. Studies have shown that ULS, as a complex system, has characteristics of both self-organization and other tissues (Yan et al., 2023). The self-organizing characteristics can be understood as the inherent toughness of ULS, which has a certain independent absorption capacity for carbon emissions. The other-organization relies on human activities to optimize the spatial organization, prevent the occurrence of high-carbon emissions scenarios in ULS, and develop in the direction of adapting to carbon emissions. Among them, the traditional space organizations mitigate carbon emissions through refined human production and lifestyle adjustments, as well as systematic inventory control of human and material resources (Zhai et al., 2024). By means of environmental transformation and engineering investment, the purpose of reducing carbon emissions is realized, emphasizing the transformation of space organization to reduce carbon emissions (Han et al., 2023). However, carbon suitability emphasizes the process of actively adapting to periodic or sudden drastic changes in ULSCE without relying on external forces, or maintaining excess carbon emissions independently by keeping human activities consistent with the adaptation and adjustment of SOI, and then returning to a low-carbon state (Wu et al., 2023).
Among them, the carbon suitability index (CSI), as an evaluation index for the low-carbon development level of ULS, refers to the ability to respond to changes in carbon emissions and adapt to low-carbon development scenarios by optimizing different types of SOI at the area scale. Therefore, the spatial distribution of CSI has been widely discussed. It is found that the urban living space carbon suitability index (ULS-CSI) has spatial differences among different countries (Eugenio Pappalardo et al., 2023), provinces (Zhao et al., 2023), cities (López-Guerrero et al., 2022), counties (Leng et al., 2020) and regions (Xie et al., 2023; Zhu et al., 2023), which is due to the significant spatial differences in urbanization, spatial organization, and carbon emissions. Most studies analyze differences at regional and national scales and do not reflect spatial variability within cities. The internal spatial differentiation can reflect the distribution, spatial change, and mechanism of ULS-CSI in a specific region.
In a word, to fill existing knowledge gaps, this study proposes a conceptual framework to assess the level of low-carbon development and spatial differences of ULS using the CSI. Using land use data from Tianjin, entropy method and spatial autocorrelation model were used to verify the framework. Specifically, three key questions will be answered (Zheng et al., 2023): Where are the areas with the highest carbon emissions and carbon absorption at the area scale (Luo et al., 2024)? Where is the area with the highest carbon suitability at the area scale? What are the spatial differences within each area? (Xepapadeas, 2024) Where are the areas with carbon emissions and carbon absorption conflict with carbon suitability at the area scale? This paper, the first empirical study of ULS in Tianjin with carbon suitability as the center, which will contribute to the research of urban low-carbon development.
2 Materials and methods
2.1 Study area
Tianjin (38° 34′-40° 15′ N, 116°43′-118°04′ E) is located in North China. By the end of 2023, the total area of Tianjin is 11,917 km2, with 16 administrative districts under its jurisdiction. The study area covers the central urban area of Tianjin, including the core six administrative districts and the surrounding four administrative districts. The core six administrative districts are Heping, Hexi, Nankai, Hebei, Hongqiao and Hedong. The four surrounding districts are Beichen, Xiqing, Jinnan and Dongli. Additionally, according to the Master Plan of Tianjin Territorial Space, the 10 administrative districts within the study area are divided into 1,683 areas, including nine types of areas: industrial development area (IDA), residential and living area (RLA), commercial and business area (CBA), comprehensive service area (CSA), storage and logistics area (SLA), ecological control area (ECA), farmland protection area (FPA), green space leisure area (GLA), and transportation area (TA) (Figure 1).
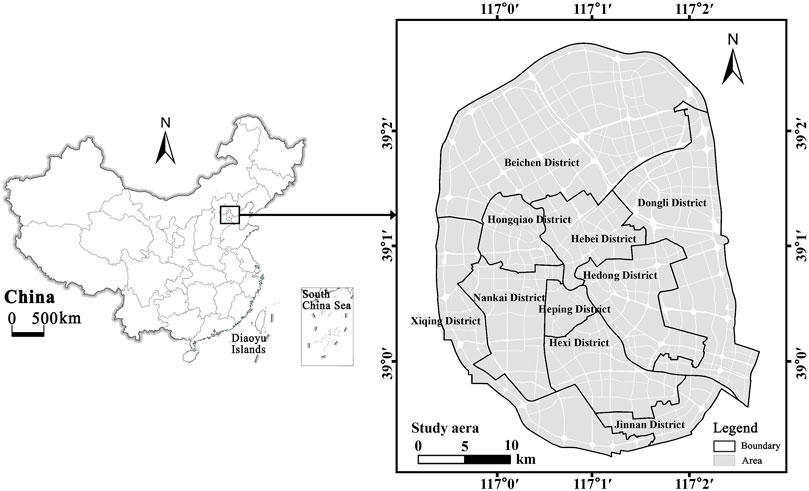
Figure 1. Location of the study area.
Tianjin’s “high carbon” footprint is evident, necessitating immediate low-carbon transformation. Firstly, the urbanization rate of Tianjin in 2021 is 84.88%, an increase of 2.58%. With the increase of urban population, people’s demands for housing, employment, travel, and recreation also increases further, which make the RLA, CBA, GLA, and IDA grow rapidly. Secondly, Tianjin is a typical industrial city, and the secondary industry has always occupied a high proportion. In recent years, the implementation of major projects such as aerospace, petrochemical, equipment manufacturing, electronic information, and biomedicine has played a great role in driving the related upstream and downstream industries, and promoted the upgrading of industrial structure. However, the connotation and potential of the construction land determined by the industrial city will still be parallel with the extension expansion, and will continue at a certain stage.
Additionally, Tianjin has recently achieved remarkable results in transforming its economic development mode and accelerating the construction of low-carbon cities. On one hand, urban development pays attention to the transformation of land use mode and begins to pay attention to the intensive use of land. According to the data of the third national land survey, the total amount of construction land in Tianjin in 2020 will decrease by 268.03 km2 compared with 2014 due to the caliber of the third national land survey and other reasons, and the scale of urban industrial and mining land will increase by 407.99 km2 compared with 2014. On other hand, the output value of construction land per unit area has grown steadily, and the GDP output value per unit area will reach 470 million yuan/km2 in 2021, with an average annual growth rate of 6.94%. Therefore, in order to better support the low-carbon transformation development of Tianjin, Tianjin is chosen as the research object.
2.2 Research data
Data were collated from three sources. Firstly, the 2021 Tianjin Statistical Yearbook furnishes electricity consumption information, serving as a foundation for carbon emiss-ions calculate in 1,683 areas. Secondly, SOI data on 1,683 areas were collected from the Master Plan of Tianjin Territorial Space Database. The data were categorized into four types: land use, buildings, road systems, and agricultural planting. Thirdly, the data of 35 IDA are drawn from the industrial point of interest (POI) data of Baidu map.
2.3 Methods
The 2021 Tianjin statistical yearbook presents data on energy consumption. Firstly, carbon emissions are calculated using the coefficient method. Secondly, different types of SOI are calculated. Thirdly, the ULS-CSI is calculated. Finally, the Pearson correlation coefficient method and spatial autocorrelation model are used to analyze the spatial distribution characteristics of ULS-CSI (Figure 2).
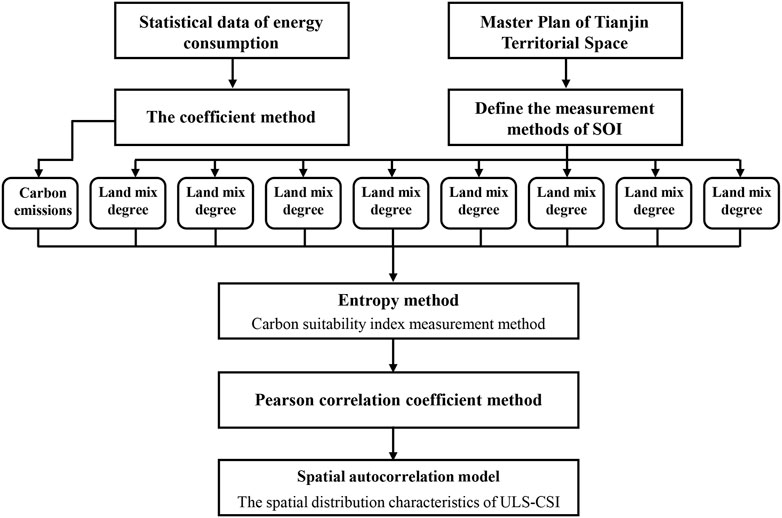
Figure 2. The methodological framework chart.
2.3.1 Carbon emissions measurement methods
According to different carbon emissions measurement methods, carbon emissions are divided into three categories: industrial, road traffic, and other forms of carbon emissions (agricultural, residential, and commercial carbon emissions, etc.) (Chuai and Feng, 2019). Among them, the measurement methods of agricultural carbon emissions, residential carbon emissions and commercial carbon emissions are consistent (Liu et al., 2020; Jiang H-D. et al., 2023). This study takes the measurement methods of agricultural carbon emissions and residential carbon emissions as an example to illustrate. Carbon absorption mainly refers to ecological carbon absorption.
2.3.2 Spatial organizational indexes
According to the control requirements of Master Plan of Tianjin Territorial Space, combined with relevant literature research and expert interviews, this study proposes 8 SOIs, including land mix degree (LMD), road network density (RND), residential land ratio (RLR), commercial land ratio (CLR), industrial land ratio (ILR), bus station density (BSD), open space ratio (OSR) and public service land ratio (PLR). The measurement method for 8 SOIs could be found in (Fattah et al., 2021; Khajavi and Rastgoo, 2023; Zhang et al., 2023).
2.3.3 Carbon suitability index measurement method
In this study, entropy method is used to calculate the ULS-CSI (Zhang C. et al., 2024; He et al., 2024). The principle of entropy method can be presented by the formula as follows (Equations 1–9): there are
(1) Create the matrix
(2) Standardize the indicators. For reverse indicators, the treatment is as follows:
For positive indicators, the processing method is as follows:
As for the moderate property, it is first transformed into a positive index and then transformed by the formula
When
Let
(3) Normalized processing.
(4) Calculate the entropy, where
(5) Calculate the differentiation coefficient, where
(6) After the weight of the indicator is obtained,
2.3.4 Pearson correlation coefficient method
Pearson correlation coefficient method is a statistical analysis method to measure the direction and degree of correlation between two or more variables. The larger the absolute value of the correlation coefficient, the closer it is to 1 or −1, the stronger the correlation is. The smaller the absolute value of the correlation coefficient is, the closer it is to 0, indicating that the correlation is weaker. The formula of Pearson correlation coefficient is shown in Equation 10.
where, r is Pearson correlation coefficient;
2.3.5 Spatial autocorrelation of carbon emissions
Spatial autocorrelation analysis is a method to judge the degree of correlation between two or more variables through the analysis of correlation, which is divided into Global Moran’s I and Local Moran’s I (Tian et al., 2024). In this study, local Moran’s I was selected for correlation analysis (Zhou Y. et al., 2023). Firstly, the local Moran’s I can identify the correlation between typical and atypical regions such as "hot spots” and "cold spots” by analyzing the correlation between the observed values and the values of neighboring points in the test space (Freitas et al., 2022). Secondly, using LISA clustering in the spatial econometric software Geoda and drawing on the theory of life circles, three spatial weight matrices were constructed for distances of 500 m, 1,000 m, and 1,500 m, respectively. Based on the spatial weight matrix of three distances, the Moran'I was calculated by selecting the CSI as the sample, and the clustering characteristics of the CSI were analyzed, and it was divided into four types: “High-High” cluster, “High-Low” cluster, “Low-Low” cluster and “Low-High” cluster. Then the spatial distribution law is analyzed (Mtshawu et al., 2023).
The value of Moran’s I is distributed between [−1, 1]. Moran’s I greater than 0 indicates a positive correlation (Gedamu et al., 2024). The closer the value is to 1, the stronger the agglomeration degree is. Moran’s I less than 0 indicates a negative correlation. The closer it is to −1, the greater the difference (Gedamu et al., 2024). The formula of Moran’s I is shown in Equation 11.
Where n represents the total number of land patches within the study area,
3 Results
3.1 Characteristics of ULSCE and SOI
3.1.1 Urban living space carbon emissions/absorption
According to the Master Plan of Tianjin Territorial Space, the study area is divided into 1,683 areas. Among them, the RLA has the highest carbon emissions, with carbon emissions of 1.14 × 10¹¹ kg, accounting for 33.74%, which is significantly higher than other types of areas, followed by the IDA, with carbon emissions of 7.46 × 10¹⁰ kg, accounting for 22.12%. The carbon emissions are ranked from high to low in RLA, IDA, CBA, GLA, TA, CSA, ECA, FPA, and SLA. The result supports previous findings that RLA carbon emissions are one of the major sources of carbon emissions. Li X. et al. (2024) believes that RLA carbon emissions account for 33% of ULSCE. IDA ranks second in carbon emissions, which further indicates that Tianjin is a typical industrial city with a high proportion of secondary industry. In recent years, Tianjin relies on the implementation of major projects such as aerospace, petrochemical, equipment manufacturing, electronic information, biomedicine, etc., which has played a great driving role in related upstream and downstream industries and promoted the upgrading of industrial structure. However, the level of conservation and intensive land use in Tianjin still needs to be continuously improved. At the same time, the industrial city determines that the connotation and potential of construction land will still be parallel with the extension expansion, and will continue in a certain stage. Other types of areas, such as CBA and CSA, have great differences in energy consumption and carbon emissions due to different building functions. Cho et al. (2024) combined with the empirical study of South Korea found that the carbon emission intensity of CBA was significantly higher than that of area such as RLA, while the carbon emissions of CSA was more complex.For carbon absorption shows the total carbon absorption in central urban areas. Among them, the carbon absorption of GLA was the highest, which was 5.76 × 10⁵ kg, accounting for 32.33%, higher than other types of areas. RLA have the second highest carbon absorption, with a carbon absorption of 5.62 × 10⁵ kg, accounting for 31.51%. ECA have the third highest carbon absorption, with a carbon absorption of 5.08 × 10⁵ kg, accounting for 28.52%. The carbon absorption is ranked from high to low in GLA, RLA, ECA, IDA, CBA, CSA, FPA, TA, and SLA. The result supports the findings of previous studies that GLA has an obvious absorption effect on carbon emissions, the layout optimization of GLA can increase the carbon absorption in the area to a certain extent (Zhao et al., 2023; Moon et al., 2024). The result supports the findings of previous studies. Zhou et al. found that green space leisure area can affect the urban heat island effect in many ways, and the temperature rise caused by the urban heat island effect will further affect the energy consumption of buildings and the carbon emissions of urban energy supply (Zhou W. et al., 2023). For example, high-density urban construction encroachment on green space leisure area leads to the reduction of open space, resulting in the increase of impervious surface, enhancing the urban heat island effect, and significantly increasing urban carbon emissions. Although the carbon absorption effect of green space leisure area has been widely recognized by scholars, the carbon absorption effect of different types of green space leisure area is different, and the specific carbon reduction benefits need to be further analyzed.
3.1.2 Spatial organization indexes
In this study, 8 SOIs were calculated and visually analyzed in the ArcGIS10.2 system, including LMD, RND, RLR, CLR, ILR, PLR, BSD, and OSR in the central urban area. As shown in the Figure 3, different types of SOI have significant spatial heterogeneity due to the differences in building area, building density, and land use types in different areas. For example, LMD exhibits a certain spatial dispersion layout pattern, while RND exhibits a central agglomeration layout pattern. The results supported Zhang et al. (Zhang and Zhang, 2023) and Wangs’ (Wang, 2024) conclusions that as a quantitative representation of the evenness of different types of land distribution, LMD represents the land use diversity in the area. With the increase of LMD in the area, the travel carbon emissions of residents in the area will decrease to a certain extent. Meanwhile, with the increase of mixed building types within a certain range, the RLA carbon emissions will change accordingly. Liu et al. took Changxing County, Zhejiang Province as an example. Based on the annual energy consumption data of different types of buildings in the area and combined with spatial vector data such as land use, they quantitatively analyzed the correlation between land use mixing degree and carbon emission. The results showed that there was a significant negative correlation between land use mixing degree and carbon emission of urban living space. It is believed that with the improvement of land use mixing degree in the area, it is conducive to promoting residents’ travel willingness, thereby reducing building carbon emission, and thus reducing the overall carbon emission level (Liu et al., 2022). The RND substantially influences traffic patterns. A dense RND down-town can quickly cause traffic congestion, as a higher RND boosts motor travel. The results supported Ellena’ conclusions that the RND and traffic travel carbon emissions in Montreal, Canada, and found that every 10% increase in RND would reduce carbon emissions by 5.8% (Ellena et al., 2023). Chang et al. used multi-source data to establish a relationship model among spatial organization, social economy, and transportation carbon emissions, and the results showed that RND was positively correlated with carbon emissions. Therefore, it is suggested that the RND should be determined in a reasonable way to provide planning guidance for low-carbon city construction (Chang et al., 2020).
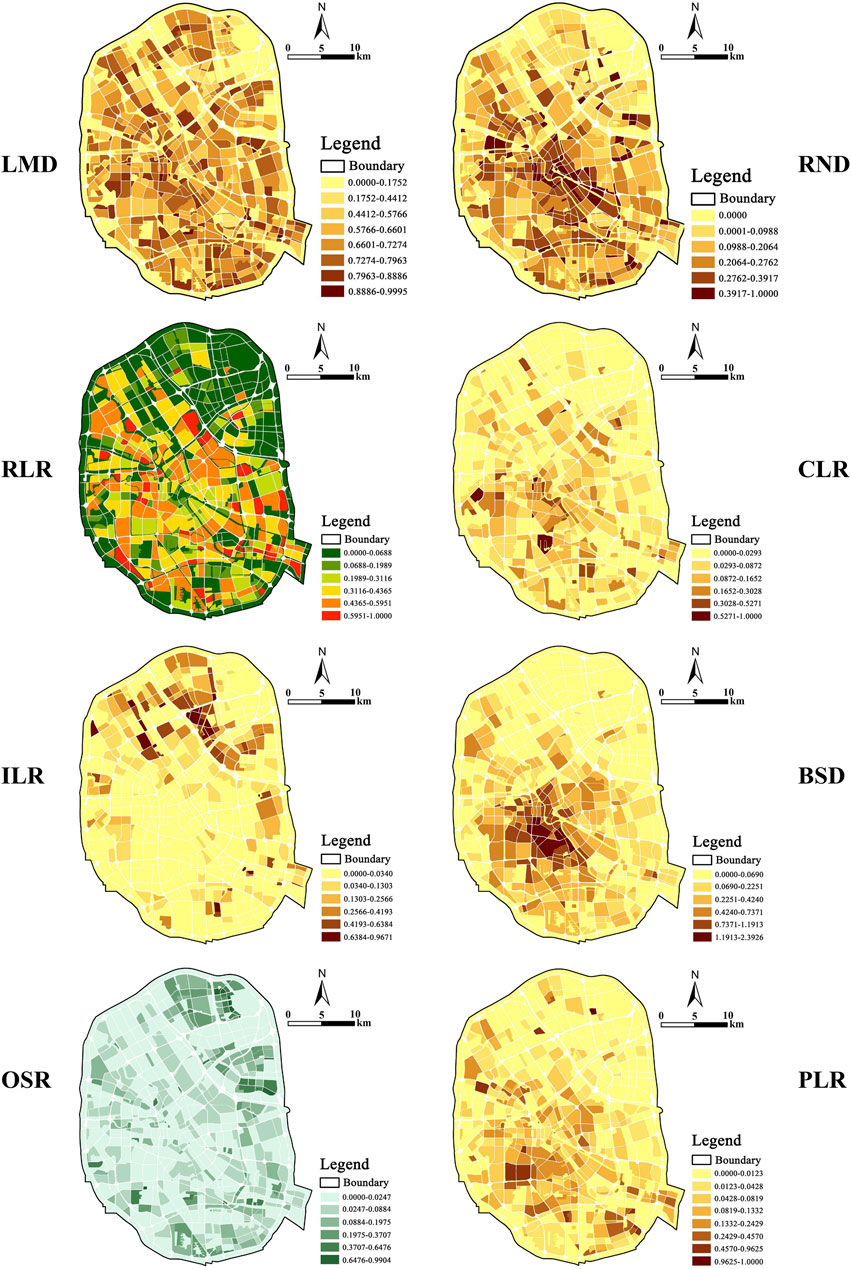
Figure 3. Spatial Characteristics of different SOI.
3.2 Spatial characteristics of ULS-CSI
3.2.1 Spatial distribution characteristics of ULS-CSI
The areas wherein ULS attain fundamental carbon suitability or beyond under the supervision of carbon suitability objectives are primarily concentrated in the southern sector of the urban center, whilst the Beichen on the northeastern side also possesses a considerable quantity of areas with proficient carbon suitability levels, exhibiting a radiant distribution (Figure 4). Overall, the areas with commendable CSI are predominantly located in Heping, Hexi, Nankai, and Beichen. The areas where ULS have not achieved the basic carbon suitability level or below encompass Xiqing, Jinnan, Dongli, etc. The findings reflect that vast majority of the ULS at the area scale are in a basic carbon suitable state, accounting for 83.90%, however, some areas are lesser than the fundamental carbon suitable state, accounting for 16.10%,featuring a “high carbon” phenomenon and substantial room for amelioration. Furthermore, through comparing the CSI of various types of areas, the CBA has the highest CSI, which is 0.0804, followed by the RLA, which is 0.0712, and other areas possess comparable CSI, indicating a considerable room for enhancement in carbon suitability.
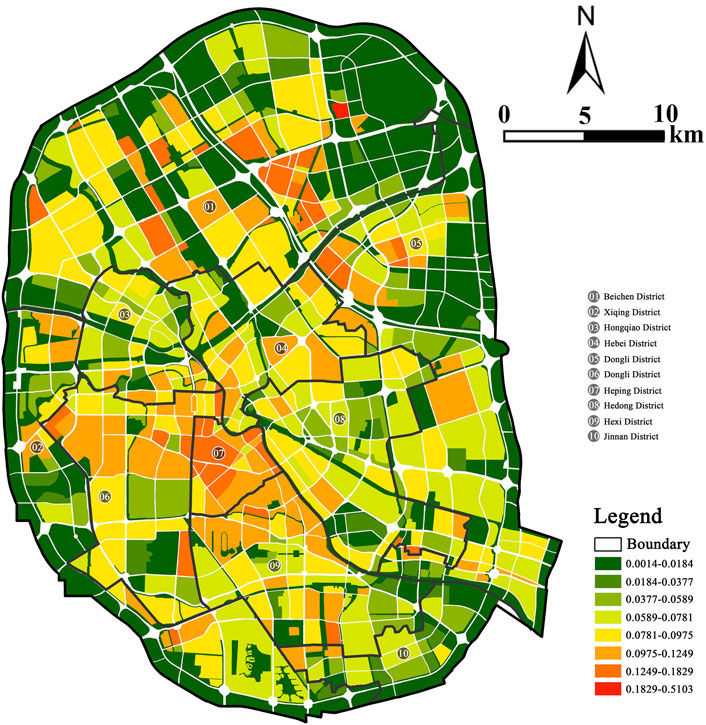
Figure 4. Distribution of ULS-CSI at the area scale of Tianjin.
3.2.2 Spatial autocorrelation of ULS-CSI
3.2.2.1 Correlation between ULSCE and SOI
Based on the data of ULSCE and SOI at the area scale of 1,683, Pearson correlation coefficient was selected to represent the strength of the correlation between ULSCE and SOI, and then determined that SOI were significantly correlated with different types of ULSCE. The correlation coefficient between RND and ULSCE is −0.313, and the significance level is 0.000, indicating that RND is significantly negatively correlated with ULSCE. The correlation coefficients of RLR, CLR, ILR, BSD, PLR and ULSCE were 0.415, 0.216, 0.424, 0.167 and 0.228, respectively. The correlation coefficient between OSR and ULSCE is −0.091, and the significance level is 0.013, indicating that OSR and ULSCE are significantly negatively correlated. The correlation coefficient between LMD and ULSCE is −0.049, which does not pass the significance level test of 0.05, indicating that although LMD is negatively correlated with ULSCE, the significance is not strong. In terms of correlation degree, the ILR has the strongest correlation degree with the ULSCE, followed by the RLR, RND, PLR, CLR, BSD, OSR, and LMD. In other words, at the area scale, the ILR has a greater impact on the ULSCE.
3.2.2.2 Local spatial autocorrelation of CSI
Global spatial autocorrelation can only explain the spatial correlation of attribute variables in the global geographic space, but cannot explain the local spatial correlation features. Local spatial autocorrelation can determine whether a certain attribute of a specific local region has aggregation in spatial distribution. Local spatial autocorrelation is represented by Moran’s I. When Moran’s I > 0, it means that there is a spatial positive correlation between local spatial units and adjacent units, which is represented by “High-High” and “Low-Low” clustering. Conversely, when Moran’s I < 0, it indicates that there is a spatial negative correlation between local spatial units and adjacent units, which is manifested as "High-Low” and "Low-High” clustering.
In this study, three spatial weight matrices with distances of 500 m, 1,000 m and 1,500 m were constructed with reference to the life circle theory, and the Moran’I of the CSI under different spatial distances were compared. According to, when the distance is 500 m, the Moran’I of the CSI is the largest, which is 0.1733, and the standard error is 0.0185. The P < 0.01 indicated that they had passed the significance test at the 1% level, and the Z value > 1.96 indicated that they had passed the Z test. The results show that the ULS-CSI in Tianjin presents a significant spatial positive correlation. Additionally, with the gradual increase of distance, the Moran’I presents a decreasing trend, which means that with the increase of distance between the two areas, the degree of correlation between them gradually decreases. Finally, with the further increase of distance between the two areas, they are no longer related to each other, showing the characteristics of random distribution.
Taking the spatial weight matrix at a distance of 1,000 m as an example, it can be seen from Figure 5 that CSI is not evenly distributed in the four quadrants in Tianjin, excluding Not Significant and Neighborless types. Among them, the number of “High-High” areas is 227, accounting for 13.49% of all areas in Tianjin. The number of “Low-High” areas is 111, accounting for 6.60%. The number of “Low-Low” areas is 177, accounting for 10.52%. The number of “High-Low” areas is 39, accounting for 2.32%.
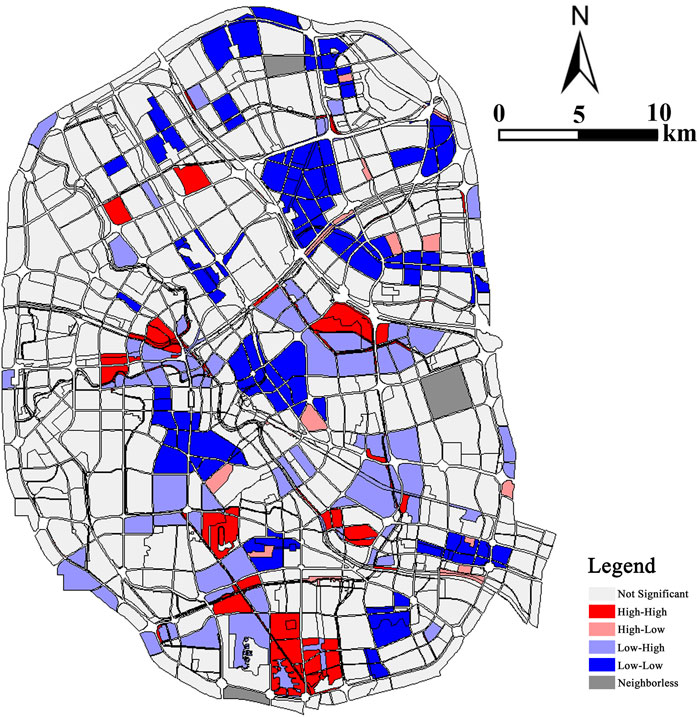
Figure 5. Spatial clustering of ULS-CSI at the area scale of Tianjin.
3.3 Optimization of ULS-CSI
Based on the SOI measurement method, this study proposes to establish reference values of different SOI as the basis for the optimization (Lu et al., 2024). Firstly, international or domestic authoritative standards are used for reference and assigned values, such as “LEED-ND Evaluation System” and “Green and low-carbon Key Small Town Indicators” (Zuniga-Teran et al., 2016). If different standards have different reference values for the same indicator, a more stringent reference value is selected. Secondly, the research reports of authoritative academic groups in the field were used for reference, such as the “2016 Report on China’s Sustainable Development Strategy” and the “2018 Report on China’s Urban Transportation”. Finally, the index values of mature low-carbon eco-cities are used for reference, such as Shenzhen low-carbon eco-city index system and Tianjin Sino-Singapore eco-city index system. The newly proposed index is based on the overall development conditions of ULS, and the reference value of the index is determined by the method of existing literature or expert rating. After the above three steps, this study established a reference value for the evaluation system of carbon suitable level of ULS to guide the optimization of SOI.
According to the calculated value and reference value of the SOI, the carbon-suitable optimization direction and optimization interval of different SOI are obtained through comparison. The specific optimization results are shown in. The results can not only obtain the appropriate range of SOI at the area scale, but also determine relatively advantageous indicators, such as the index values of LMD and RND are higher than the reference value, while other index values need to be further improved. For example, the BSD in the area scale is only 9.04%, compared with the reference value of 10.3%, there is still a certain margin of improvement.
4 Discussion
4.1 Applications
4.1.1 Spatial conflict of carbon emissions/absorption and CSI
The spatial conflict areas between carbon emissions/absorption and CSI can be obtained, which further proves the study of Zhang Y et al. (2024). Firstly, areas with carbon emissions above 5.07 × 10⁵t were extracted. Secondly, areas with CSI above 0.0972 were extracted. Thirdly, the selected areas were superimposed in GIS to further obtain the areas with spatial conflicts with high carbon emissions and poor CSI (Figure 6). Based on the identification results, it is found that the spatial conflict between carbon emissions/absorption and CSI are mainly distributed in the periphery of urban center (Wang et al., 2022). On one hand, the peripheral areas are mainly areas where industrial enterprises are concentrated, and the leading function of the area is mainly industry, with high carbon emissions (Jiang W. et al., 2023). On the other hand, many areas in the periphery are limited by the distance from the city center, public service facilities such as bus stations and road network are insufficient, and the production process of industrial enterprises is backward, so the carbon level is poor, which makes the low carbon development level poor. At the same time, the management of these areas lags behind the social and economic development, making it difficult to improve the conflict areas in a short time (Cai et al., 2024; Liu et al., 2024). Additionally, by identifying the spatial distribution of the conflict areas, the spatial organization, the coupling characteristics of carbon emissions/absorption and carbon suitability systems, the spatial correlation characteristics and the characteristics of main impact indicators can be further judged, so as to guide the subsequent SOI optimization and serve the construction of low-carbon cities (Feng et al., 2024). For example, Zhang et al. believe that the distribution of industrial enterprises mainly depends on the distribution of resources, which makes them far away from urban residential centers, resulting in a large number of long-distance commuter traffic. By rationally distributing employment and residential land, promoting the balance between employment and housing, and optimizing the urban industrial layout, carbon emissions can be significantly reduced and carbon suitability can be improved (Zhang and Zhang, 2023). Wei et al. proposed that carbon-suitable planning should adjust the urban industrial structure, extend the industrial chain, and develop various types of low-carbon industries based on the development direction and regional functions of the city. At the same time, carbon emissions can be further reduced by reasonably determining the scale of industrial development, optimizing the industrial layout, establishing multiple industrial spaces, and carrying out brownfield remediation and reuse (Li et al., 2023).
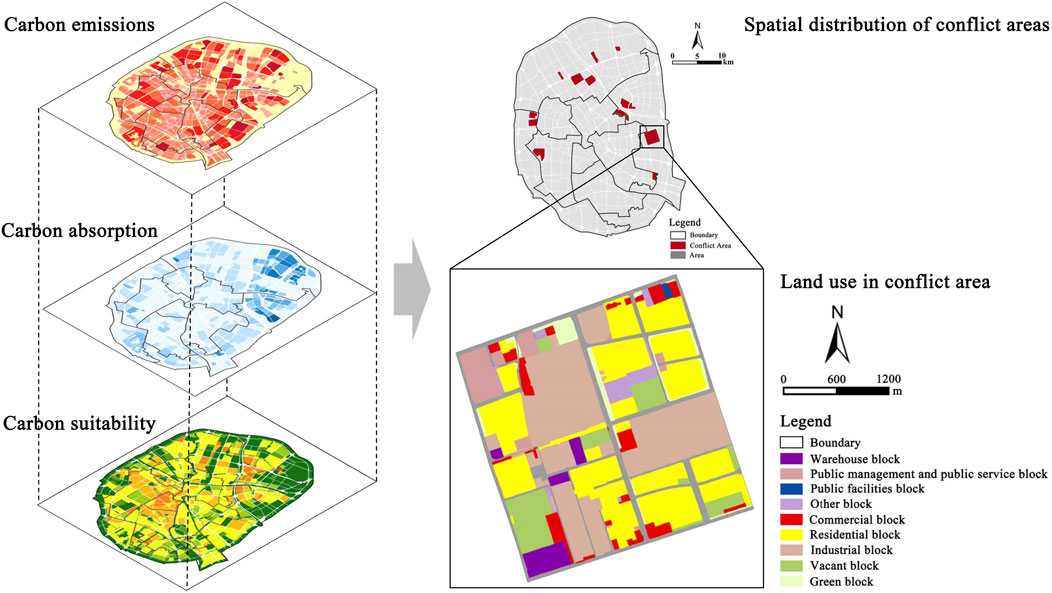
Figure 6. Spatial distribution and land use of conflict areas.
4.1.2 Optimization of SOI
The ULSCE at the area scale possess close ties with the 8 SOIs envisaged in this study. Owing to constraints of space, this study primarily utilizes LMD as a case study to illuminate and propose the carbon suitable optimization strategies for ULS at the area scale. As the progressive extension of ULS in Tianjin continues, a growing disparity between urban industrial space and residential space is emerging (Liu et al., 2021). In 2021, the proportion of commute of more than 60 min in Tianjin is 17%, and the average one-way commute takes 39 min, ranking the fourth from the bottom of super-large and megacities, only better than Beijing, Shanghai and Chongqing, and the irrational land use structure in the central urban area is obvious (Ma et al., 2024). Additionally, the employment and housing index of each district reveals the attributes of the key six central city districts and the adjoining four districts. Even though the demolition cost of industrial land in the central zone yields it a prime area for urban redevelopment, the focus primarily lies on residential and commercial development, and symptom of decentralization has emerged (Song et al., 2019).
Studies indicate optimal LMD range of 1.8–2.0. This study proposes specific carbon suitable strategies for diverse ULS. For instance, due to low blend of land functions within the commercial district, an emphasis should be placed on near vicinity layouts richly integrated with residential, office, leisure, and additional amenities to elevate multi-functionality. Given the disparity between employment and residential spaces in residential districts and living precincts, strategic deployment of suitable job accommodations and ancillary services at residential hubs and public transport terminals can bolster resident’s low-carbon commuting while diminishing the proportion of lengthy “pendulum” transportation journeys, thereby reducing carbon emissions (Figure 7).
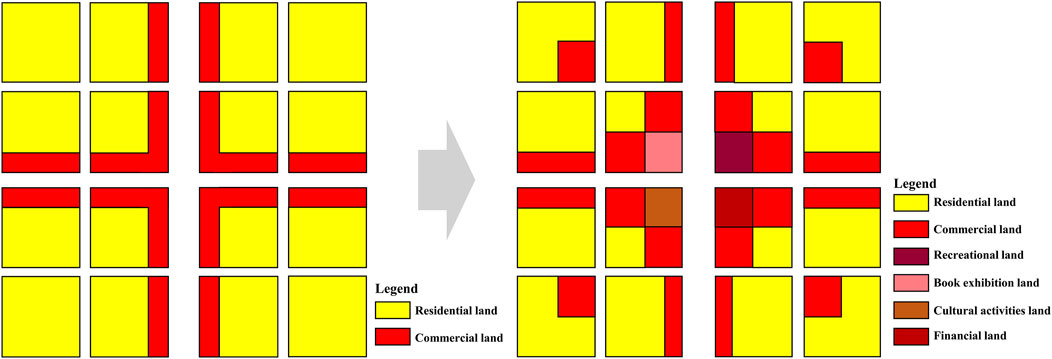
Figure 7. Schematic diagram of changes before and after optimization of LMD.
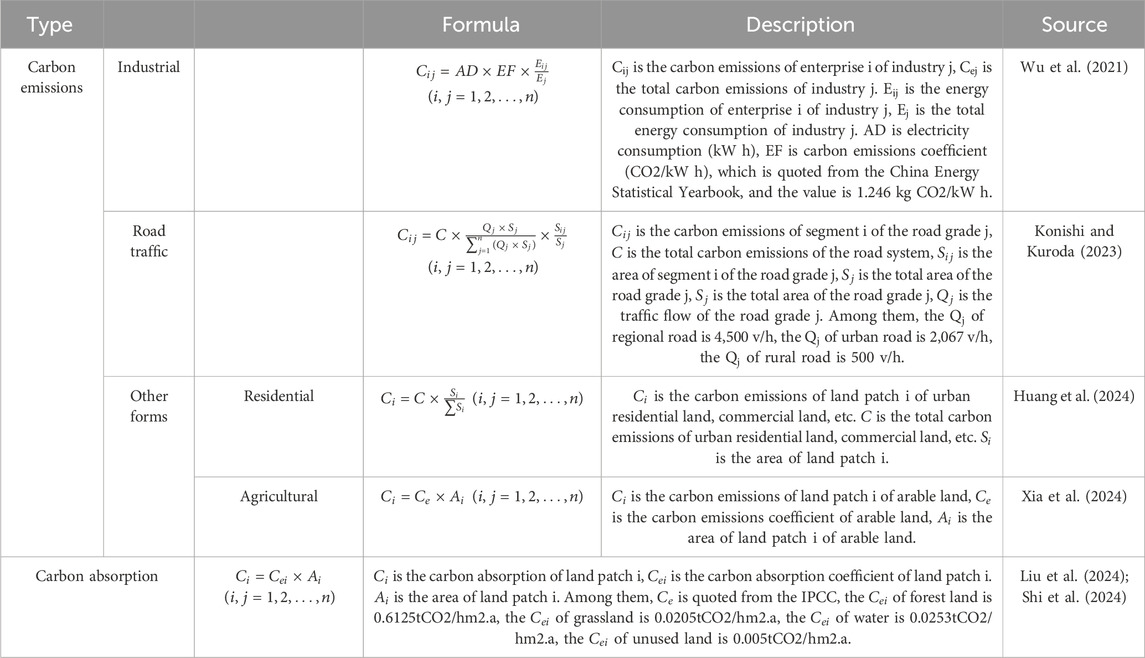
Table 1. Measurement methods of ULS.
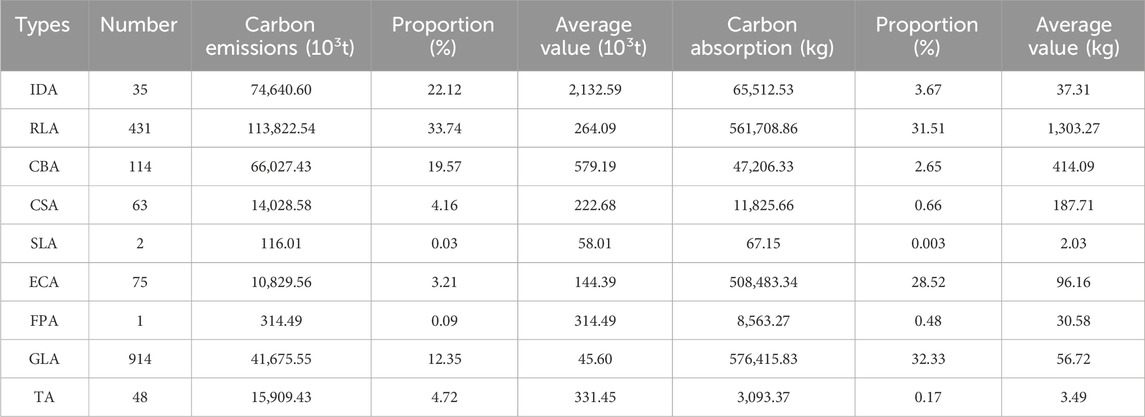
Table 2. Carbon emissions and absorption proportion of ULS in Tianjin in 2021.
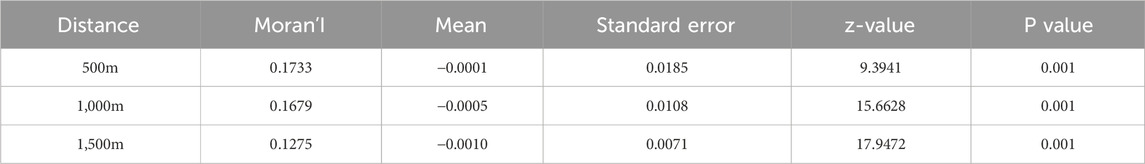
Table 3. The Moran’ I of CSI.
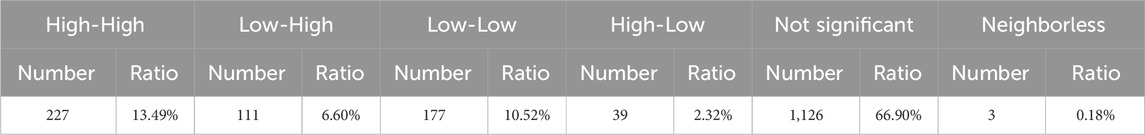
Table 4. Quadrants distribution statistics of land patch carbon emissions in Tianjin.
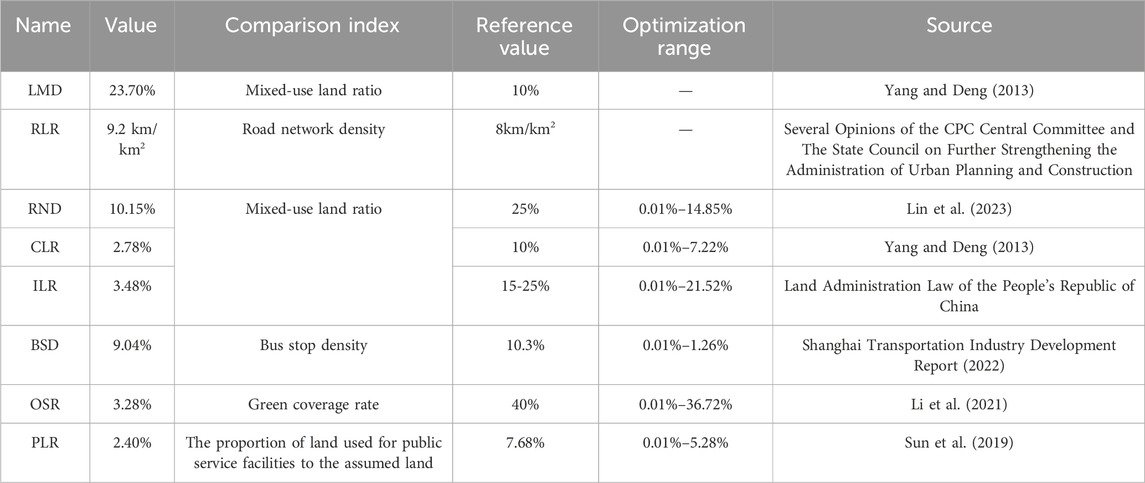
Table 5. The reference value and optimization of SOI.
To summarize, the optimized land configuration seamlessly blends various synergistic city roles based on retail and commercial land, such as incorporating facilities like finance and insurance, entertainment, book exhibitions, and cultural endeavors, thereby furnishing diverse travel contemplate choices for the residents in the vicinity, and augmenting the appeal of low-carbon travel. After optimization, the distribution of diverse ULS within the core six districts of the central urban area is more equitable, achieving an employment-to-residence ratio in the vicinity of 50%. The average journey distance of the central urban area is 5.7 km, with a travel component attributed over 70% to the core six districts, maintaining a travel distance under 5 km, ideal for the proliferation of slow traffic within a practical service radius of slow traffic. Furthermore, from the vantage point of traffic travel volume, LMD can satisfy the demands of travelers to execute multiple objectives in a single journey, thereby reducing the aggregate travel volume.
4.1.3 Policy implications
The empirical evidence from this study has several implications for planning and urbanization policies, with particular relevance to the climate change. Firstly, in 2015, the United Nations Sustainable Development Summit was held in New York, which identified 17 sustainable development Goals for 2030. Among them, in order to cope with global climate change, the policies of building high-density population cities have been proposed to achieve efficiency improvement and technological innovation, and reduce resource and energy consumption. Secondly, in the stage of China’s new urbanization, policies such as optimizing the form, density, functional layout, and construction mode of RLA are proposed, which will have a fundamental and important impact on carbon emissions. By carrying out the construction of green and low-carbon communities, promoting mixed areas with composite functions, and advocating the mixed layout of residential, commercial and pollution-free industries. In accordance with the “Standards for the Construction of Complete Residential Communities”, basic public service facilities, commercial service facilities for the convenience of the people, municipal supporting infrastructure and public activity Spaces will be built, and the coverage rate of complete residential communities in cities at prefecture level and above will increase to more than 60 percent by 2030. Through a walking and cycling network, several residential communities are connected to create a 15-min life circle. Explore the construction of zero-carbon community to meet the basic living needs of owners within walking distance. Encourage the use of new-energy vehicles, and promote the construction of community charging and replacing facilities. Thirdly, an action system for energy conservation and emission reduction in industrial enterprises should be established. Through strict and reasonable control of coal consumption, improve the absorption capacity of renewable energy, control the production capacity and emission standards of key industries, to reduce carbon emissions in industrial and domestic sectors.
Additionally, a low-carbon transformation development system for ULS should be established. With low-carbon development as the goal, establish and improve the urban physical examination evaluation system of “1 year one physical examination, 5 years one assessment”. Building information modeling (BIM) technology and city information modeling (CIM) platform are used to promote the construction of digital buildings and digital twin cities, and accelerate the digital transformation of urban and rural low-carbon construction.
4.2 Limitations and further improvements
This study encounters some limitations. Firstly, this study compared the differences in carbon emissions characteristics among different types of ULS at the area scale, and did not systematically explore the carbon emissions characteristics of different types of ULS at different scales, as well as the differences within the same type of ULS, such as the carbon emissions differences between RLA with different floor area ratios and different building densities. Secondly, this study mainly considers 8 SOIs that affect ULSCE, but it needs to further consider the influence of multiple scales and different types of SOIs, such as SOIs at city and block scales, and non-SOIs such as social economy and human behavior. Additionally, although different types of ULS change dynamically, they are relatively stable in a certain period of time, and the corresponding carbon emissions and CSI are also relatively stable. Therefore, the 2021 Tianjin Statistical Yearbook is used in this study. However, in order to more accurately explore the interdependence between CSI and SOI, as well as the spatial autocorrelation characteristics of CSI and its changes in future studies. The dynamic change characteristics of different types of ULS, as well as the corresponding dynamic change characteristics of carbon emissions and CSI should be fully considered. Therefore, the collection of panel data and spatio-temporal data over successive years will be indispensable. In essence, in contrast to previous studies, the study delves into the spatial attributes of the CSI at the area level as well as the concurrent SOI bearing substantial effects. Nevertheless, the precision requires further refinement, possibly necessitating further comparative studies and empirical data collection. Future studies could also consider refreshing the fundamental big data and ascertainment procedures pertaining to the geographical distribution of the CSI.
5 Conclusion
Using Tianjin land use data this study has developed the ULS-CSI based on SOI for comparing and analyzing carbon suitability inequality and spatial differences in different areas in Tianjin in 2021. The empirical study’s primary findings and contributions can be threefold as summarized as follows.
Firstly, different types of ULS have obvious differences in carbon emissions. Because the number of different types of ULS is different in Tianjin, for example, the number of RLA in Tianjin is 431, accounting for the highest proportion, and the carbon emissions is also the highest. Additionally, different types of ULS host different building functions, so the corresponding energy consumption and carbon emissions are also very different. The RLA is mainly the carbon emissions of residential electricity, including lighting, refrigeration, other equipment, etc., while the CBA is mainly the operation of large equipment, lighting, refrigeration, etc., and the use law and intensity of building are obviously different from the RLA. In contrast, the composition of CSA is more complex, including different types of buildings such as administrative offices, museums, and cultural centers, and the use behavior of these building types is more complex and diverse. Studies show that due to the wide variety of public buildings, the energy consumption requirements of public buildings with different functions are different. When the energy consumption of different functional buildings is converted into the ULSCE, the ULSCE of different types show obvious difference. The increase of GLA could increase the area carbon absorption, affect the urban heat island effect, and reduce the ULSCE.
Secondly, the SOI of different areas have significant spatial heterogeneity due to the differences in building area, building density, and land use types in different areas. For the RND and BSD, the closer the distance to the city center, the higher the value. The areas with a high RLA and CBA are mainly distributed in the outer areas of the city center. The areas with a high proportion of ILA and OSA are mainly distributed in the northeast of the city center, which is related to the distribution of industrial enterprises and ecological forest land in Tianjin. The area with a high proportion of CSA is mainly distributed in the southwest of the city center, including Tianjin University and Nankai University. The area with high LMD showed the characteristics of random distribution, and no obvious spatial distribution law was formed.
Thirdly, the distribution of ULS-CSI in Tianjin presents fan-shaped clustering characteristics. At the area scale, the areas where ULS reached basic carbon adaptation or above were mainly distributed in the south of the urban core area and the north of Beichen,accounting for 83.90%. The areas with better carbon suitability are mainly distributed in Heping, Hexi, Nankai and Beichen,accounting for 69.28%. The results reflect that most of the ULS at the area scale are in a basic carbon suitable state. The areas that do not reach or lower than the basic carbon suitability level include Xiqing, Jinnan and Dongli, accounting for 16.10%.
Furthermore, the spatial distribution of ULS-CSI in Tianjin showed a significant spatial positive correlation. By comparing the Moran’I under the space weight matrix of 500 m, 1,000 m and 1,500 m, when the weight matrix of the space distance is 500 m, the Moran’I is the largest, and shows a gradually decreasing trend with the gradual increase of distance, that is, with the increase of distance between two regions, the degree of spatial autocorrelation gradually decreased, which is the difference of 0.1733, 0.1679, and 0.1275.
This study provides valuable guidance for the strategy of carbon suitable planning. Civic leaders can employ the CSI to evaluate the carbon suitable level of each area unit, paving the way for innovative carbon emissions reduction strategies. Conversely, urban planners can apply these outcomes to establish a foundation for the carbon optimization of spatial organization, striving towards sustainable, low-carbon and healthy urban evolution.
Data availability statement
The raw data supporting the conclusions of this article will be made available by the authors, without undue reservation.
Author contributions
ZY: Conceptualization, Formal Analysis, Investigation, Methodology, Project administration, Software, Supervision, Validation, Writing–original draft. XZ: Conceptualization, Formal Analysis, Investigation, Project administration, Supervision, Visualization, Writing–review and editing. PC: Conceptualization, Formal Analysis, Project administration, Supervision, Validation, Visualization, Writing–review and editing. QL: Conceptualization, Investigation, Project administration, Supervision, Validation, Writing–original draft, Writing–review and editing.
Funding
The author(s) declare that financial support was received for the research, authorship, and/or publication of this article. This research was funded by the Humanities and Social Sciences Research Youth Fund Project of the Ministry of Education, grant no. 23YJCZH306, the Youth fund of Shandong Natural Science Foundation, grant no. ZR2022QE151, and the Jinan Philosophy Social Science Project, grant no. JNSK23C54.
Acknowledgments
The authors would like to acknowledge all colleagues and friends who have voluntarily reviewed the translation of the survey and the manuscript of this study.
Conflict of interest
The authors declare that the research was conducted in the absence of any commercial or financial relationships that could be construed as a potential conflict of interest.
Publisher’s note
All claims expressed in this article are solely those of the authors and do not necessarily represent those of their affiliated organizations, or those of the publisher, the editors and the reviewers. Any product that may be evaluated in this article, or claim that may be made by its manufacturer, is not guaranteed or endorsed by the publisher.
References
Bi, P., and Hansen, A. (2018). Carbon emissions and public health: an inverse association? Lancet Planet. Health 2 (1), e8–e9. doi:10.1016/S2542-5196(17)30177-8
Cai, Y., Su, S., Zhang, P., Chen, M., Wang, Y., Xie, Y., et al. (2024). Quantifying high-resolution carbon emissions driven by land use change in the Guangdong-Hong Kong-Macao Greater Bay Area. Urban Clim. 55, 101943. doi:10.1016/j.uclim.2024.101943
Chang, N.-B., Hossain, U., Valencia, A., Qiu, J., and Kapucu, N. (2020). The role of food-energy-water nexus analyses in urban growth models for urban sustainability: a review of synergistic framework. Sustain. Cities Soc. 63, 102486. doi:10.1016/j.scs.2020.102486
Chen, X., Di, Q., Jia, W., and Hou, Z. (2023). Spatial correlation network of pollution and carbon emission reductions coupled with high-quality economic development in three Chinese urban agglomerations. Sustain. Cities Soc. 94, 104552. doi:10.1016/j.scs.2023.104552
Cho, S., Jeong, Y.-S., and Huh, J.-H. (2024). Is South Korea's 2050 Carbon-Neutral scenario sufficient for meeting greenhouse gas emissions reduction goal? Energy Sustain. Dev. 80, 101447. doi:10.1016/j.esd.2024.101447
Chuai, X., and Feng, J. (2019). High resolution carbon emissions simulation and spatial heterogeneity analysis based on big data in Nanjing City, China. Sci. Total Environ. 686, 828–837. doi:10.1016/j.scitotenv.2019.05.138
Ellena, M., Melis, G., Zengarini, N., Di Gangi, E., Ricciardi, G., Mercogliano, P., et al. (2023). Micro-scale UHI risk assessment on the heat-health nexus within cities by looking at socio-economic factors and built environment characteristics: the Turin case study (Italy). Urban Clim. 49, 101514. doi:10.1016/j.uclim.2023.101514
Eugenio Pappalardo, S., Zanetti, C., and Todeschi, V. (2023). Mapping urban heat islands and heat-related risk during heat waves from a climate justice perspective: a case study in the municipality of Padua (Italy) for inclusive adaptation policies. Landsc. Urban Plan. 238, 104831. doi:10.1016/j.landurbplan.2023.104831
Fattah, M. A., Morshed, S. R., and Morshed, S. Y. (2021). Impacts of land use-based carbon emission pattern on surface temperature dynamics: experience from the urban and suburban areas of Khulna, Bangladesh. Remote Sens. Appl. Soc. Environ. 22, 100508. doi:10.1016/j.rsase.2021.100508
Feng, T., Liu, B., Wei, Y., Xu, Y., Zheng, H., Ni, Z., et al. (2024). Research on the low-carbon path of regional industrial structure optimization. Energy Strategy Rev. 54, 101485. doi:10.1016/j.esr.2024.101485
Freitas, W. W. L., De Souza, RMCR, Amaral, G. J. A., and De Bastiani, F. (2022). Exploratory spatial analysis for interval data: a new autocorrelation index with COVID-19 and rent price applications. Expert Syst. Appl. 195, 116561. doi:10.1016/j.eswa.2022.116561
Gan, W., Yan, M., Wen, J., Yao, W., and Zhang, J. (2022). A low-carbon planning method for joint regional-district multi-energy systems: from the perspective of privacy protection. Appl. Energy 311, 118595. doi:10.1016/j.apenergy.2022.118595
Gedamu, W. T., Plank-Wiedenbeck, U., and Wodajo, B. T. (2024). A spatial autocorrelation analysis of road traffic crash by severity using Moran’s I spatial statistics: a comparative study of Addis Ababa and Berlin cities. Accid. Analysis & Prev. 200, 107535. doi:10.1016/j.aap.2024.107535
Gu, Y., Zhang, W., Yang, Y., Wang, C., Streets, D. G., and Yim, S. H. L. (2020). Assessing outdoor air quality and public health impact attributable to residential black carbon emissions in rural China. Resour. Conservation Recycl. 159, 104812. doi:10.1016/j.resconrec.2020.104812
Han, Z., Jia, X., Song, X., An, P., Fu, L., Yue, J., et al. (2023). Engineering thermochemistry to cope with challenges in carbon neutrality. J. Clean. Prod. 416, 137943. doi:10.1016/j.jclepro.2023.137943
He, W., Li, G., Zeng, Y., Wang, Y., and Zhong, C. (2024). An adaptive data-driven subspace polynomial dimensional decomposition for high-dimensional uncertainty quantification based on maximum entropy method and sparse Bayesian learning. Struct. Saf. 108, 102450. doi:10.1016/j.strusafe.2024.102450
Huang, R., Zhang, X., and Liu, K. (2024). Assessment of operational carbon emissions for residential buildings comparing different machine learning approaches: a study of 34 cities in China. Build. Environ. 250, 111176. doi:10.1016/j.buildenv.2024.111176
Jamin, A., and Humeau-Heurtier, A. (2020). (Multiscale) cross-entropy methods: a review. ENTROPY. 22 (1), 45. doi:10.3390/e22010045
Jiang, H.-D., Purohit, P., Liang, Q.-M., Dong, K., and Liu, L.-J. (2022). The cost-benefit comparisons of China's and India's NDCs based on carbon marginal abatement cost curves. Energy Econ. 109, 105946. doi:10.1016/j.eneco.2022.105946
Jiang, H.-D., Purohit, P., Liang, Q.-M., Liu, L.-J., and Zhang, Y.-F. (2023a). Improving the regional deployment of carbon mitigation efforts by incorporating air-quality co-benefits: a multi-provincial analysis of China. Ecol. Econ. 204, 107675. doi:10.1016/j.ecolecon.2022.107675
Jiang, W., Zhang, Z., Wen, J., Yin, L., and Song, B. (2023b). Spatio-temporal variation and influencing factors of industrial carbon emission effect in China based on water-land-energy-carbon nexus. Ecol. Indic. 152, 110307. doi:10.1016/j.ecolind.2023.110307
Jin, Y., and Xu, Y. (2024). Carbon reduction of urban form strategies: regional heterogeneity in Yangtze River Delta, China. Land Use Policy 141, 107154. doi:10.1016/j.landusepol.2024.107154
Khajavi, H., and Rastgoo, A. (2023). Predicting the carbon dioxide emission caused by road transport using a Random Forest (RF) model combined by Meta-Heuristic Algorithms. Sustain. Cities Soc. 93, 104503. doi:10.1016/j.scs.2023.104503
Konishi, Y., and Kuroda, S. (2023). Why is Japan’s carbon emissions from road transportation declining? Jpn. World Econ. 66, 101194. doi:10.1016/j.japwor.2023.101194
Leng, H., Chen, X., Ma, Y., Wong, N. H., and Ming, T. (2020). Urban morphology and building heating energy consumption: evidence from Harbin, a severe cold region city. Energy Build. 224, 110143. doi:10.1016/j.enbuild.2020.110143
Li, J., Sun, W., Song, H., Li, R., and Hao, J. (2021). Toward the construction of a circular economy eco-city: an emergy-based sustainability evaluation of Rizhao city in China. Sustain. Cities Soc. 71, 102956. doi:10.1016/j.scs.2021.102956
Li, W., Chen, Z., Li, M., Zhang, H., Li, M., Qiu, X., et al. (2023). Carbon emission and economic development trade-offs for optimizing land-use allocation in the Yangtze River Delta, China. Ecol. Indic. 147, 109950. doi:10.1016/j.ecolind.2023.109950
Li, X., Lin, C., Lin, M., and Jim, C. Y. (2024b). Drivers and spatial patterns of carbon emissions from residential buildings: an empirical analysis of Fuzhou city (China). Build. Environ. 257, 111534. doi:10.1016/j.buildenv.2024.111534
Li, Z., Ma, J., Jiang, F., Zhang, S., and Tan, Y. (2024a). Assessing the impacts of urban morphological factors on urban building energy modeling based on spatial proximity analysis and explainable machine learning. J. Build. Eng. 85, 108675. doi:10.1016/j.jobe.2024.108675
Lin, G., Jiang, D., Yin, Y., and Fu, J. (2023). A carbon-neutral scenario simulation of an urban land–energy–water coupling system: a case study of Shenzhen, China. J. Clean. Prod. 383, 135534. doi:10.1016/j.jclepro.2022.135534
Liu, G., Cui, F., and Wang, Y. (2024). Spatial effects of urbanization, ecological construction and their interaction on land use carbon emissions/absorption: evidence from China. Ecol. Indic. 160, 111817. doi:10.1016/j.ecolind.2024.111817
Liu, H., Yan, F., and Tian, H. (2022). Towards low-carbon cities: patch-based multi-objective optimization of land use allocation using an improved non-dominated sorting genetic algorithm-II. Ecol. Indic. 134, 108455. doi:10.1016/j.ecolind.2021.108455
Liu, H. J., Yan, F. Y., and Tian, H. (2020). A vector map of carbon emission based on point-line-area carbon emission classified allocation method. SUSTAINABILITY 12 (23), 10058. doi:10.3390/su122310058
Liu, Y., Yu, S., and Sun, T. (2021). Heterogeneous housing choice and residential mobility under housing reform in China: evidence from Tianjin. Appl. Geogr. 129, 102417. doi:10.1016/j.apgeog.2021.102417
López-Guerrero, R. E., Verichev, K., Moncada-Morales, G. A., and Carpio, M. (2022). How do urban heat islands affect the thermo-energy performance of buildings? J. Clean. Prod. 373, 133713. doi:10.1016/j.jclepro.2022.133713
Lu, G., Shan, Z., and Wei, Z. (2024). Research on the construction and measurement of the indicator system for green low-carbon circular developing economic system in Southwest China. Ecol. Indic. 160, 111833. doi:10.1016/j.ecolind.2024.111833
Lu, Y., Chen, Q., Yu, M., Wu, Z., Huang, C., Fu, J., et al. (2023). Exploring spatial and environmental heterogeneity affecting energy consumption in commercial buildings using machine learning. Sustain. Cities Soc. 95, 104586. doi:10.1016/j.scs.2023.104586
Luo, H., Wang, C., Li, C., Meng, X., Yang, X., and Tan, Q. (2024). Multi-scale carbon emission characterization and prediction based on land use and interpretable machine learning model: a case study of the Yangtze River Delta Region, China. Appl. Energy 360, 122819. doi:10.1016/j.apenergy.2024.122819
Ma, X., Sun, S., Li, L., He, M., and Cui, H. (2024). How temporary disruption of metro service influence metro commuters’ mode shifts during the COVID-19 pandemic? Evidence from Tianjin, China. Travel Behav. Soc. 36, 100773. doi:10.1016/j.tbs.2024.100773
Moon, T., Kim, M., and Chon, J. (2024). Adaptive green space management strategies for sustainable carbon sink parks. Urban For. & Urban Green. 94, 128236. doi:10.1016/j.ufug.2024.128236
Mtshawu, B., Bezuidenhout, J., and Kilel, K. K. (2023). Spatial autocorrelation and hotspot analysis of natural radionuclides to study sediment transport. J. Environ. Radioact. 264, 107207. doi:10.1016/j.jenvrad.2023.107207
Peskett, L., Metzger, M. J., and Blackstock, K. (2023). Regional scale integrated land use planning to meet multiple objectives: good in theory but challenging in practice. Environ. Sci. & Policy 147, 292–304. doi:10.1016/j.envsci.2023.06.022
Shi, N., Yu, Y., Liang, S., Ren, Y., and Liu, M. (2024). Effects of urban green spaces landscape pattern on carbon sink among urban ecological function areas at the appropriate scale: a case study in Xi’an. Ecol. Indic. 158, 111427. doi:10.1016/j.ecolind.2023.111427
Song, S., Sun, Q., Wang, Z., and Zou, X. (2019). Commuting subsidy and burden: evidence from Tianjin, China. Case Stud. Transp. Policy 7 (3), 574–582. doi:10.1016/j.cstp.2019.05.002
Sun, B. Q., Ma, X., De Jong, M., and Bao, X. (2019). Assessment on island ecological vulnerability to urbanization: a tale of chongming island, China. SUSTAINABILITY 11 (9), 2536. doi:10.3390/su11092536
Tian, D., Zhang, J., Li, B., Xia, C., Zhu, Y., Zhou, C., et al. (2024). Spatial analysis of commuting carbon emissions in main urban area of Beijing: A GPS trajectory-based approach. Ecol. Indic. 159, 111610. doi:10.1016/j.ecolind.2024.111610
Wang, L. (2024). Assessment of land use change and carbon emission: a Log Mean Divisa (LMDI) approach. Heliyon 10 (3), e25669. doi:10.1016/j.heliyon.2024.e25669
Wang, X., Cai, Y., Liu, G., Zhang, M., Bai, Y., and Zhang, F. (2022). Carbon emission accounting and spatial distribution of industrial entities in Beijing—combining nighttime light data and urban functional areas. Ecol. Inf. 70, 101759. doi:10.1016/j.ecoinf.2022.101759
Wu, F., Yao, X., Gong, J., Hu, Y., Wang, T., and Zhao, N. (2024). A novel hybrid method for the stationary non-Gaussian wind pressures simulation based on maximum entropy method and moment-based translation function. Mech. Syst. Signal Process. 210, 111167. doi:10.1016/j.ymssp.2024.111167
Wu, S., Hu, S., and Frazier, A. E. (2021). Spatiotemporal variation and driving factors of carbon emissions in three industrial land spaces in China from 1997 to 2016. Technol. Forecast. Soc. Change 169, 120837. doi:10.1016/j.techfore.2021.120837
Wu, X., Xi, H., Qiu, R., and Lee, K. Y. (2023). Low carbon optimal planning of the steel mill gas utilization system. Appl. Energy 343, 121154. doi:10.1016/j.apenergy.2023.121154
Xepapadeas, A. (2024). Uncertainty and climate change: the IPCC approach vs decision theory. J. Behav. Exp. Econ. 109, 102188. doi:10.1016/j.socec.2024.102188
Xia, Y., Guo, H., Xu, S., and Pan, C. (2024). Environmental regulations and agricultural carbon emissions efficiency: evidence from rural China. Heliyon 10 (4), e25677. doi:10.1016/j.heliyon.2024.e25677
Xian, B., Xu, Y., Chen, W., Wang, Y., and Qiu, L. (2024). Co-benefits of policies to reduce air pollution and carbon emissions in China. Environ. Impact Assess. Rev. 104, 107301. doi:10.1016/j.eiar.2023.107301
Xie, M., Wang, M., Zhong, H., Li, X., Li, B., Mendis, T., et al. (2023). The impact of urban morphology on the building energy consumption and solar energy generation potential of university dormitory blocks. Sustain. Cities Soc. 96, 104644. doi:10.1016/j.scs.2023.104644
Yan, S., Wang, W., Li, X., Lv, H., Fan, T., and Aikepaer, S. (2023). Stochastic optimal scheduling strategy of cross-regional carbon emissions trading and green certificate trading market based on Stackelberg game. Renew. Energy 219, 119268. doi:10.1016/j.renene.2023.119268
Yang, B., Ge, S., Liu, H., Zhang, X., Xu, Z., Wang, S., et al. (2023). Regional integrated energy system reliability and low carbon joint planning considering multiple uncertainties. Sustain. Energy, Grids Netw. 35, 101123. doi:10.1016/j.segan.2023.101123
Yang, W., and Deng, W. (2013). Building related KPIs in Sino-Singapore Tianjin eco-city. APCBEE Procedia 5, 112–115. doi:10.1016/j.apcbee.2013.05.020
Zhai, Y., Zhai, G., Chen, Y., and Liu, J. (2024). Research on regional terrestrial carbon storage based on the pattern-process-function. Ecol. Inf. 80, 102523. doi:10.1016/j.ecoinf.2024.102523
Zhang, C., Li, Q., Ma, Z., Wang, Z., and Yu, T. (2024a). Study on optimization of energy consumption and surface quality of ultrasonic vibration-assisted polishing process based on entropy weight method. J. Clean. Prod. 442, 140975. doi:10.1016/j.jclepro.2024.140975
Zhang, X., Yan, F., Liu, H., and Qiao, Z. (2021). Towards low carbon cities: a machine learning method for predicting urban blocks carbon emissions (UBCE) based on built environment factors (BEF) in Changxing City, China. Sustain. Cities Soc. 69, 102875. doi:10.1016/j.scs.2021.102875
Zhang, X., and Zhang, D. (2023). Urban carbon emission scenario prediction and multi-objective land use optimization strategy under carbon emission constraints. J. Clean. Prod. 430, 139684. doi:10.1016/j.jclepro.2023.139684
Zhang, X. P., Liao, Q. H., Yin, X. X., Yin, Z. W., and Cao, Q. Q. (2023). Spatial characteristics and influencing factors of multi-scale urban living space (ULS) carbon emissions in Tianjin, China. BUILDINGS 13 (9), 2393. doi:10.3390/buildings13092393
Zhang, Y., Lin, W., Ren, E., and Yu, Y. (2024b). Evaluation of spatial distribution of carbon emissions from land use and environmental parameters: a case study in the Yangtze River Delta demonstration zone. Ecol. Indic. 158, 111496. doi:10.1016/j.ecolind.2023.111496
Zhao, D., Cai, J., Xu, Y., Liu, Y., and Yao, M. (2023). Carbon sinks in urban public green spaces under carbon neutrality: a bibliometric analysis and systematic literature review. Urban For. & Urban Green. 86, 128037. doi:10.1016/j.ufug.2023.128037
Zhao, G., Jiang, P., Zhang, H., Li, L., Ji, T., Mu, L., et al. (2024). Mapping out the regional low-carbon and economic biomass supply chain by aligning geographic information systems and life cycle assessment models. Appl. Energy 369, 123599. doi:10.1016/j.apenergy.2024.123599
Zheng, Y., Cheng, L., Wang, Y., and Wang, J. (2023). Exploring the impact of explicit and implicit urban form on carbon emissions: evidence from Beijing, China. Ecol. Indic. 154, 110558. doi:10.1016/j.ecolind.2023.110558
Zhou, W., Yu, W., Zhang, Z., Cao, W., and Wu, T. (2023b). How can urban green spaces be planned to mitigate urban heat island effect under different climatic backgrounds? A threshold-based perspective. Sci. Total Environ. 890, 164422. doi:10.1016/j.scitotenv.2023.164422
Zhou, Y., Hu, D., Wang, T., Tian, H., and Gan, L. (2023a). Decoupling effect and spatial-temporal characteristics of carbon emissions from construction industry in China. J. Clean. Prod. 419, 138243. doi:10.1016/j.jclepro.2023.138243
Zhu, Z., Shen, Y., Fu, W., Zheng, D., Huang, P., Li, J., et al. (2023). How does 2D and 3D of urban morphology affect the seasonal land surface temperature in Island City? A block-scale perspective. Ecol. Indic. 150, 110221. doi:10.1016/j.ecolind.2023.110221
Zuniga-Teran, A. A., Orr, B. J., Gimblett, R. H., Chalfoun, N. V., Going, S. B., Guertin, D. P., et al. (2016). Designing healthy communities: a walkability analysis of LEED-ND. Front. Archit. Res. 5 (4), 433–452. doi:10.1016/j.foar.2016.09.004
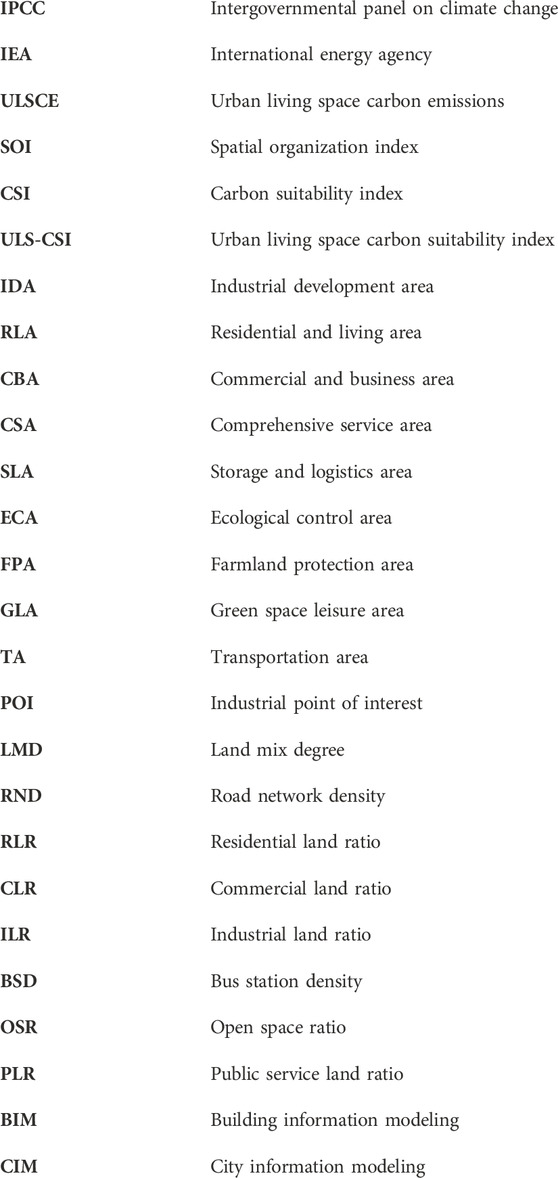
Nomenclature
Keywords: spatial characteristics, optimization, carbon emissions, urban living space, carbon suitability index, Tianjin
Citation: Yin Z, Zhang X, Chen P and Liao Q (2024) Spatial characteristics and optimization of urban living space carbon suitability index (ULS-CSI) in Tianjin, China. Front. Environ. Sci. 12:1409624. doi: 10.3389/fenvs.2024.1409624
Received: 30 March 2024; Accepted: 05 August 2024;
Published: 26 August 2024.
Edited by:
Bushra Khalid, Chinese Academy of Sciences (CAS), ChinaReviewed by:
Hong-Dian Jiang, China University of Geosciences, ChinaJunxue Zhang, Jiangsu University of Science and Technology, China
Copyright © 2024 Yin, Zhang, Chen and Liao. This is an open-access article distributed under the terms of the Creative Commons Attribution License (CC BY). The use, distribution or reproduction in other forums is permitted, provided the original author(s) and the copyright owner(s) are credited and that the original publication in this journal is cited, in accordance with accepted academic practice. No use, distribution or reproduction is permitted which does not comply with these terms.
*Correspondence: Xiaoping Zhang, cmx5ODkyMUAxNjMuY29t