 Wenwen Xiao1
 Xianshun Fu
 Wenhao Song
 Lili Wang
95% of researchers rate our articles as excellent or good
Learn more about the work of our research integrity team to safeguard the quality of each article we publish.
Find out more
ORIGINAL RESEARCH article
Front. Environ. Sci. , 18 July 2024
Sec. Environmental Economics and Management
Volume 12 - 2024 | https://doi.org/10.3389/fenvs.2024.1409539
The construction industry is an important material production sector of the national economy, and trade in goods and services between different industrial sectors in different regions may result in the transfer of embodied carbon emissions from the construction industry. A systematic identification of the relationships and structural characteristics of the embodied carbon transfer in the construction industry is crucial for rationally defining the responsibility for emission reduction and scientifically formulating emission reduction policies to promote the effective promotion of China’s carbon emission reduction actions. Based on the calculation of input-output theory, this study constructs a multi-regional input-output (MRIO) model of 31 provinces in China containing 28 industries to estimate the carbon emissions of the construction industry in 2017, it also combines the complex network theory to construct the industrial and regional embodied carbon transfer network of China’s construction industry, and calculates the network structure indexes to deeply explore the spatial transfer network structure characteristics of the embodied carbon transfer between regions of China’s construction industry in 2017. The results show that the construction, energy and building materials manufacturing sectors are at the core of the sectoral carbon transfer network structure, with strong network control. The embodied carbon transfer network between regions in the construction industry has a small-world character, more than 40% of all relevant regions have carbon transfer relationships with other regions, significant carbon emissions are transferred from the resource-rich, industrially well-endowed central-western and north-eastern provinces to the economically developed south-eastern coastal provinces. According to the results of the study, differentiated carbon emission reduction plans are formulated, and policy suggestions for optimizing the carbon emission reduction plan of the construction industry are put forward.
In 2023, the Sixth Assessment Report of the United Nations Intergovernmental Panel on Climate Change (IPCC) that the construction industry accounts for 31% of global energy consumption and 21% of carbon emissions Quan et al. (2022), making it a significant source of carbon emissions globally. The construction industry involves the design, construction, maintenance and demolition of buildings, as well as the production, transportation and use of related materials and energy, and is closely related to the metallurgical, building materials, petrochemical, electromechanical and light industries Zhu et al. (2022). While driving the development of other industries and improving the living conditions of residents, the construction industry is also an important carbon emitting industry. The construction industry is a typical “apparent low carbon, embodied high carbon” industry, which usually has low direct carbon emissions during the operation phase, but high direct and indirect carbon emissions during the production of materials, transportation, construction and maintenance of old buildings Fanwen et al. (2019). At the same time, the construction industry will also provide products and services for other industries, and the complex inter-industry linkages, changes in the final demand of each industry sector through the inter-industry linkages directly or indirectly affect their own carbon emissions and those of other industries. Embodied carbon emissions often span multiple regions, leading to inter-regional carbon transfers and increasing the difficulty of tracking and managing carbon emissions. It is unclear which industries have significant carbon transfer relationships with the construction industry, and the spatial linkages of the carbon transfer relationships in the construction industry are not clear; furthermore, the government has not yet introduced policies related to the management of carbon transfer in the construction industry to reduce emissions. Therefore, in order to study the multi-region embodied carbon transfer problem in the construction industry, clarify the responsibilities of each participant in the industry chain to formulate fair emission reduction policies Xiao and Peng (2023) and realize the low-carbon development of the construction industry, the research objectives of this paper are as follows:
1) Using input-output theory and data to systematically measure the quantitative relationship of carbon transfer between the construction industry and other industries and the amount of carbon transfer between the construction industry in different regions.
2) Complex network theory was utilized to construct industrial and regional carbon transfer networks, and network indicators were calculated to identify key industrial nodes and key regional nodes.
3) Relevant policy recommendations are made based on the analysis of the results.
In the context of globalization, cross-regional trade facilitates material exchanges while promoting resource and environmental interactions so that carbon emissions are no longer restricted to specific regions Wen and Zhang (2020), the formation of global value chains has facilitated the formation of inter-regional carbon transfer relationships Liu et al. (2021a). Embodied carbon in the construction industry includes building design, material production, construction, the use phase, as well as demolition and waste disposal, with 98% of the responsibility for reducing emissions stemming from upstream and downstream related industries such as energy consumption, material transportation and waste management Shenjun et al. (2016).
The construction and demolition of buildings generates a large amount of waste, which, if not properly disposed of, has a direct impact on the sustainable development of the construction industry Liu et al. (2021b). A number of studies have been carried out by scholars on the reduction of emissions from building construction and demolition waste. In order to figure out how the reduction of construction and demolition waste (C&DW) affects economic growth, Wang et al. (2023) used standard deviation ellipse modeling, environmental Kuznets curves (EKCs), and geographic detector to investigate regional differences and heterogeneity in C&DW and economic growth, taking Chinese provinces as the subject of the study. Liu et al. (2023) constructed an (SD) model of C&DW carbon emission management under different sorting modes to explore the relationship between the factors affecting carbon emissions in the management process of C&DW and to explore the carbon emission reduction effects of different policies. Wang et al. (2021b) estimated the generation of construction and demolition waste in various provinces of China, and utilized gravity modeling and social network analysis (SNA) methods to investigate the characteristics and impacts of spatially relevant structural networks of construction and demolition waste generation.
Carbon measurement at the international level is usually based on a country’s indigenous carbon emissions Spaiser et al. (2018). Some developed countries have shifted their share of carbon emissions to developing countries (or regions) such as China through trade, with a quarter of the growth in greenhouse gas emissions in developing countries coming from increased trade in goods and services from developed countries Xiao et al. (2020). By tracking the critical path of global cross-sectoral embodied carbon transfers, one study found that transfers to the United States ended mainly in the services sector, while transfers to China ended mainly in the construction industry Xu et al. (2022). The economies of China’s provinces are closely linked, and carbon emissions in one province affect other provinces. Some scholars have analyzed the regional differences in carbon emissions from buildings in China, where trade has led to a transference of responsibility for carbon emissions and emission reductions in the process of regional integration Sanmang et al. (2018). As a result, a number of scholars have analyzed the liability for carbon emissions from a number of perspectives, most commonly discussing basic liability accounting principles that differentiate on the basis of identified emitting entities, including liability principles based on production, income and consumption. Each principle has strengths and inherent blind spots, and in order to propose fair and effective climate policies, carbon emissions need to be accurately accounted for using reasonable methodologies. It was not until the IPCC proposed a greenhouse gas emissions inventory and algorithm that a new era of greenhouse gas emissions accounting systems began. Academics mainly use three methods to account for carbon emissions: the actual measurement method, the mass balance method and the carbon emission factor method Petrokofsky et al. (2012), of which the carbon emission factor method is the widely adopted method to estimate carbon emissions by constructing data on energy activities and emission factors, and multiplying the product of emission factors and consumption Wang et al. (2023a). For example, the carbon footprint of residential consumption between provinces is calculated by using the carbon emission coefficients of nine energy sources Wang et al. (2018), as well as applying this method to analyze the carbon dioxide emissions during the operation phase of green buildings Zhang et al. (2023).
Scholars have used Life Cycle Assessment (LCA) Chau et al. (2015) and Input-output Analysis Pan et al. (2018) to study carbon transfer between industries and regions based on different research purposes. The LCA methodology assesses the environmental impact of an industry sector throughout the process from inputs of means of production to product outputs, which is more suitable for tracking carbon transfers of micro-products, Dalgaard et al. (2014) on the carbon footprint of milk, and Beeftink et al. (2021) explained the contribution of water softening methods to the reduction of carbon footprints through the LCA. Input-output methods are based on input-output data and the compilation of environmental input-output tables, which can analyze the carbon emission intensity of industries between regions, such as Qi and Xia (2022) use the multi-region input-output model to estimate the carbon emissions of the construction industry, and Wen and Zhang (2020) use the input-output tables in conjunction with other analytical methods to analyze the carbon emission transfer paths between industries, Chen and Meng (2020) constructed a carbon transfer network in China based on a multi-regional input-output (MRIO) model and complex network analysis, revealing the transfer pattern between provinces. Although the input-output method can accurately calculate carbon transfers, it is difficult to measure the structure of carbon transfers. The multi-regional embodied carbon transfer in the construction industry expands the structure of industry linkage from economic space to geographic space. From the network perspective, the embodied carbon transfer system of the construction industry consists of the embodied carbon transfer network of the construction industry, as well as the regional embodied carbon transfer network of the construction industry formed on the basis of this network.
Complex network theory helps to analyze the structure and function of material and energy flows in economic systems. Some scholars apply the complex network analysis method to the analysis of inter industrial carbon transfer. Jiang et al. (2019) established a global carbon emissions transfer network to identify the impact of the structural role of sectors on carbon emissions. Wang et al. (2021a) calculated the inter-provincial sectoral linkages of embodied
The relevant literature on carbon transfer contains a wealth of unique and innovative ideas that provide a rich research base and theoretical support for this paper, revealing two theoretical underpinnings that support this study:
1) Input-output theory is used to systematically measure the quantitative relationship of carbon transfer between the construction industry and other industries, as well as the amount of carbon transferred by the construction industry between different regions. Input-output data between regions are combined with industrial energy statistics to calculate the carbon dioxide emission intensity of each industry sector.
2) Complex network theory is another key theoretical foundation that provides a systematic approach to analysing the multi-regional embodied carbon transfer in the construction industry. Complex network theory can effectively describe and analyse the complex structure of material and energy flows in economic systems, and is particularly suitable for exploring the influencing factors and transfer pathways of carbon emissions.
In view of the fact that there are fewer studies on the structure of carbon emission transfer in the construction industry, most of them focus on the current status of carbon emission and its influencing factors in a particular region or country, and lack systematic analyses of inter-regional carbon emission transfer and interactions, and very few of them combine the input-output method and the complex network method to study the problem of carbon transfer. This paper examines the structure of carbon emissions from China’s construction industry to complement existing research. First, using inter-regional input-output data and industrial energy statistics, the inter-regional embodied carbon transfer matrix for the construction industry is calculated, and weakly transferring relationships and related industries are screened out to construct a strongly correlation-based embodied carbon transfer network for the construction industry. Secondly, based on the strong linkage of embodied carbon between regions of the construction industry, a regional embodied carbon transfer network for the construction industry is constructed. Finally, the network structure indicators are calculated to analyze the network structure of the regional embodied carbon transfer network in the construction industry, clarify the position of each industry and region in the network, and identify the core provinces of the embodied carbon transfer, so as to provide references for the construction industry to formulate fair carbon emission reduction policies in each region, and to realize the low-carbon development of the construction industry. Given that there are fewer studies on the structure of carbon emissions transfer in the construction industry, this paper aims to explore the structure of carbon emissions from China’s construction industry and to complement existing studies. First, using inter-regional input-output data and industrial energy statistics, the inter-regional embodied carbon transfer matrix for the construction industry is calculated, and weakly transferring relationships and related industries are screened out to construct a strongly correlation-based embodied carbon transfer network for the construction industry. Secondly, based on the strong linkage of embodied carbon between regions of the construction industry, a regional embodied carbon transfer network for the construction industry is constructed. Finally, the network structure indicators are calculated to analyze the network structure of the regional embodied carbon transfer network in the construction industry, clarify the position of each industry and region in the network, and identify the core provinces of the embodied carbon transfer, so as to provide references for the construction industry to formulate fair carbon emission reduction policies in each region, and to realize the low-carbon development of the construction industry.
The production of an industry requires a variety of inputs, of which intermediate inputs are an important part, and these intermediate inputs release
From the perspective of inputs, the production of an industry i requires intermediate inputs from several industries, and these inputs emit
The larger the carbon transfer coefficient, the higher the intensity of carbon transfer between industries. Obviously, when the direct consumption of industry j to industry i increases, the industry carbon transfer coefficient
With respect to
Step 1, Calculate the total amount of
Where
Step 2, Based on the total output
Taking C to denote the matrix of carbon transfer coefficients, A to denote the matrix of direct consumption coefficients, and E to denote the diagonal matrix generated from
Carbon linkage is formed between two industries due to industrial association, and the industrial carbon transfer coefficient describes the strength of association between industries caused by carbon transfer. The industrial carbon transfer network is constructed as a directed graph with the industry as the vertex and the carbon linkage between industries as the edge Ma et al. (2023). Finding significant correlations from multiple industry carbon linkages is the key to constructing a carbon transfer network. Generally speaking, the edges with larger carbon transfer coefficients play a more critical role in the network, while some edges with smaller coefficients play a negligible role in the network, which leads to the fact that not all nodes and edges in the complete carbon transfer network are worth focusing on. Thus, in order to deeply explore the structural characteristics of the network, it is necessary to find the critical value to screen out the edges with important roles.
In determining critical values, many models use subjective empirical values such as 0.2, 0.5, or the mean. Although these methods can identify significant associations, they are subjective. Therefore, this paper uses the Weaver-Thomas index (W-T index) to determine critical values in an endogenous manner Hu et al. (2019). The W-T index is an effective tool for determining significance indicators by comparing the observed distribution with the hypothetical distribution to establish a closest approximation to identify the critical elements of the numerical series. Because inter-industry carbon emissions are characterized by an inhomogeneous array, this paper adopts the W-T index to determine the critical value, which can effectively reduce the influence of subjective judgment in identifying strong correlations.
The carbon transfer coefficients calculated from the input-output tables are
Step 1, arrange the samples under each index of the carbon transfer coefficient matrix C, that is,
Step 2, compute the W-T index matrix w(i,j) corresponding to matrix F(i,j):
The minimum values of each column of the computed W-T index matrix w(i,j) are formed into a row vector
Step 3, construct the 0–1 matrix B based on the position vector
Step 4, readjust the position of the elements of the 0–1 matrix B. The position of the 0–1 matrix is restored according to the positional relationship matrix
The desired inter-industry carbon transfer network can be plotted according to the obtained 0–1 matrix
This paper focuses on the carbon transfer triggered by the geographical separation of product production and consumption due to provincial product inflows and outflows between the construction industry in each region and various industries in other regions. Within the framework of the MRIO model, the following equilibrium relationships exist:
Where X is total output and F is final demand. A is the matrix of direct consumption coefficients,
The direct carbon emission coefficient matrix C has been established above, and the elements of the matrix are the direct carbon emission coefficients of each industry. Since this paper only considers the carbon emission transfer relationship between the construction industry and other industries, the direct carbon emission coefficients among other industries except the construction industry are set to 0 to get
Where P is the specific carbon emissions from inter-regional final demand, and
Based on the inter-regional carbon transfer matrix P calculated above, the emissions and strength of association of carbon transfer between different industries are depicted. Taking provinces as network nodes and inter-regional carbon transfer coefficients as connecting edges, an inter-regional carbon transfer network can be constructed. Through the W-T index above, the connecting edges with important roles are screened out to construct the inter-regional carbon transfer network needed for the study.
Small-world characteristics make complex networks have good connectivity, the control effect of a key node may quickly affect other nodes in the whole network, even if some nodes are removed, the network can still remain connected and the efficiency of information dissemination will not be significantly reduced. The small-world characteristics refer to the characteristics of the average short path lengths and clustering coefficients between nodes in the network.
The average path length is the average value of the distance between any two nodes in the network, and the smaller its value, the more efficient the information transfer between the network nodes. The calculation method is as follows:
Where N is the number of nodes in the network;
The clustering coefficient is used to quantitatively describe the probability that any two nodes adjacent to a node in the network are also adjacent to each other, and the clustering coefficient C is calculated as:
Where
The K-shell decomposition method is a graphical analysis method based on network topology, which reveals the internal structure and characteristics of the network by decomposing the nodes in the network according to the shell hierarchy. In the K-shell decomposition method, a shell is a set of nodes with the same K-kernel value. This is done by removing all nodes with degree value 1 and their connected edges, repeating this operation until no more points with degree value 1 appear in the network, and then continuing to peel off points with degree value 2. And so on until every node in the network is divided into the corresponding k-shell, the k-shell decomposition of the network is obtained. Each node in the network corresponds to a unique k-shell metric
Node degree is an important index to portray the direction of carbon transfer and its strength of individual nodes in the carbon transfer network. In the carbon transfer network, the number of edges of node i that directly point to other nodes is called the out-degree of node i, denoted as
Betweenness centrality reflects the ability of a node to act as a medium to control other nodes through the number of shortest paths through that node. Assuming that the number of shortest paths for material and information transfer between any two nodes s and t is
Closeness centrality considers the proximity of a particular node to other nodes in the network using the distance method. The proximity centrality of node i is:
Where N is the total number of nodes in the network and
Eigenvector centrality is a metric that reflects the importance of a node by the degree of importance of its neighboring nodes.
Written in the form of a matrix can be expressed as
This paper uses the 2017 China Multi-Regional Input-Output Tables from CEADs (China Emission Accountsand Datasets); the industries in the input-output tables and the Energy Statistics Yearbook are merged and harmonized through the 2017 update of the National Economic Industry Classification (GB/T 4754–2017), and the industry codes are shown in Table 1; the data on the various energy consumptions for calculating the carbon emissions of the industries are taken from the current year of the China Energy Statistics Yearbook; the carbon content per unit calorific value and carbon oxidation factor of each energy type are from the Guidelines for the Preparation of Provincial Greenhouse Gas Inventories.
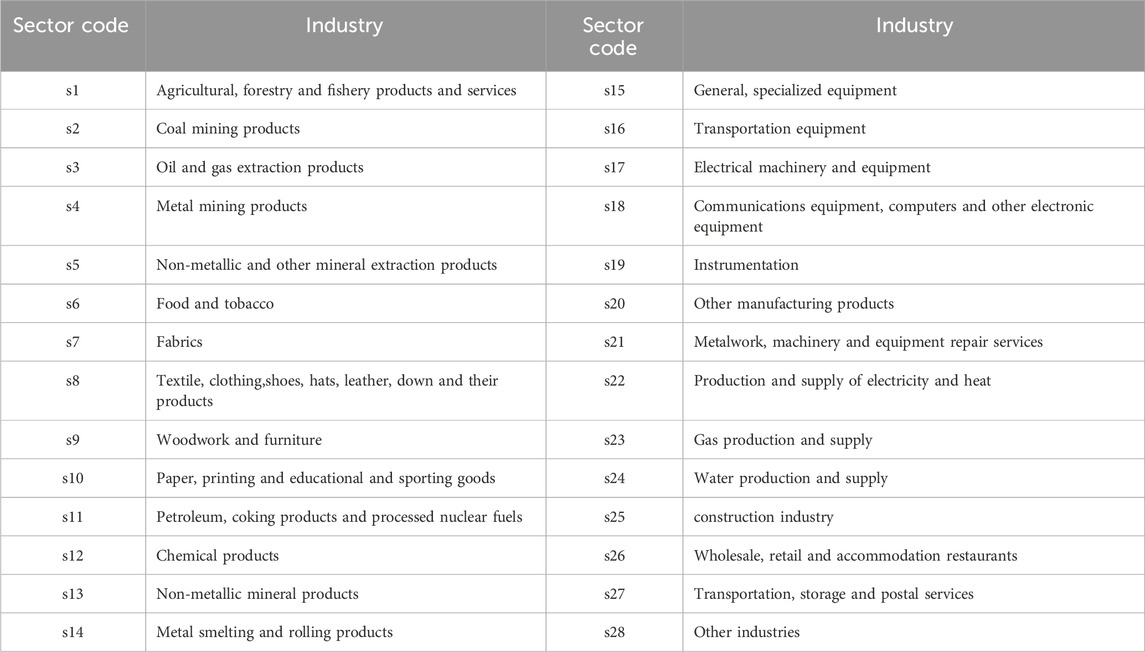
Table 1. Industry sector code.
The study population of this paper includes 31 provincial areas except Hong Kong, Macau and Taiwan. The abbreviated forms of the provinces are shown in Table 2.
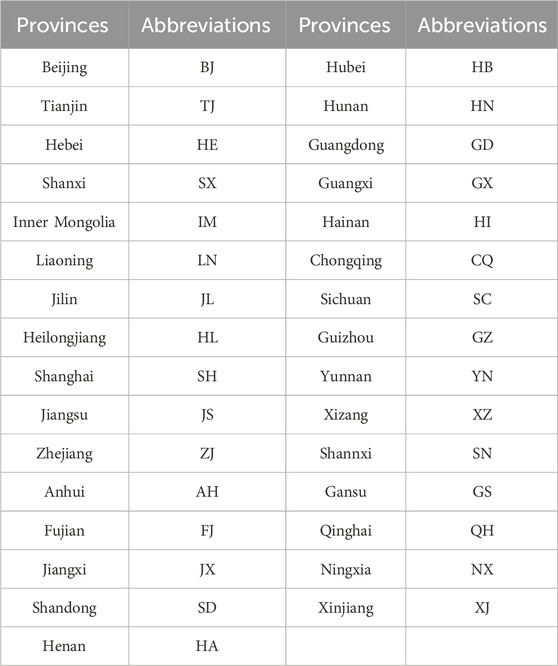
Table 2. Abbreviations of provinces.
The production process of the construction industry involves a number of stages, such as the production of building materials, building construction, use and disposal, and these stages are also where carbon emissions are most concentrated. As can be seen from Figure 1, among the top-ranked industries, metal smelting (s14), electricity and heat production and supply (s22), non-metallic products (s13), coal mining (s2), the chemical industry (s12), and other industries (s28) are among the industries with high transfer volumes. The production process of construction materials consumes large amounts of energy and generates large carbon emissions. For example, the production of cement and iron and steel is one of the high carbon emitting industries, and the construction industry absorbs a large amount of intermediate products from these industries, receiving carbon transfers from the s12 and s14 industries. The mechanical equipment and means of transportation used during building construction also consume energy and generate carbon emissions. For example, the combustion of equipment such as excavators, cranes and trucks emits exhaust gases, which contain greenhouse gases. During the use phase of a building, energy consumption comes mainly from heating, cooling, lighting and electricity. The use of fossil fuels such as coal, oil and natural gas has led to corresponding carbon emissions, and the increase in electricity consumption in the construction industry, influenced by the electrification of buildings, has received a significant carbon transfer from the power sector. According to statistics, building energy consumption accounts for around 30% of China’s total energy consumption, directly contributing to the increase in carbon emissions.
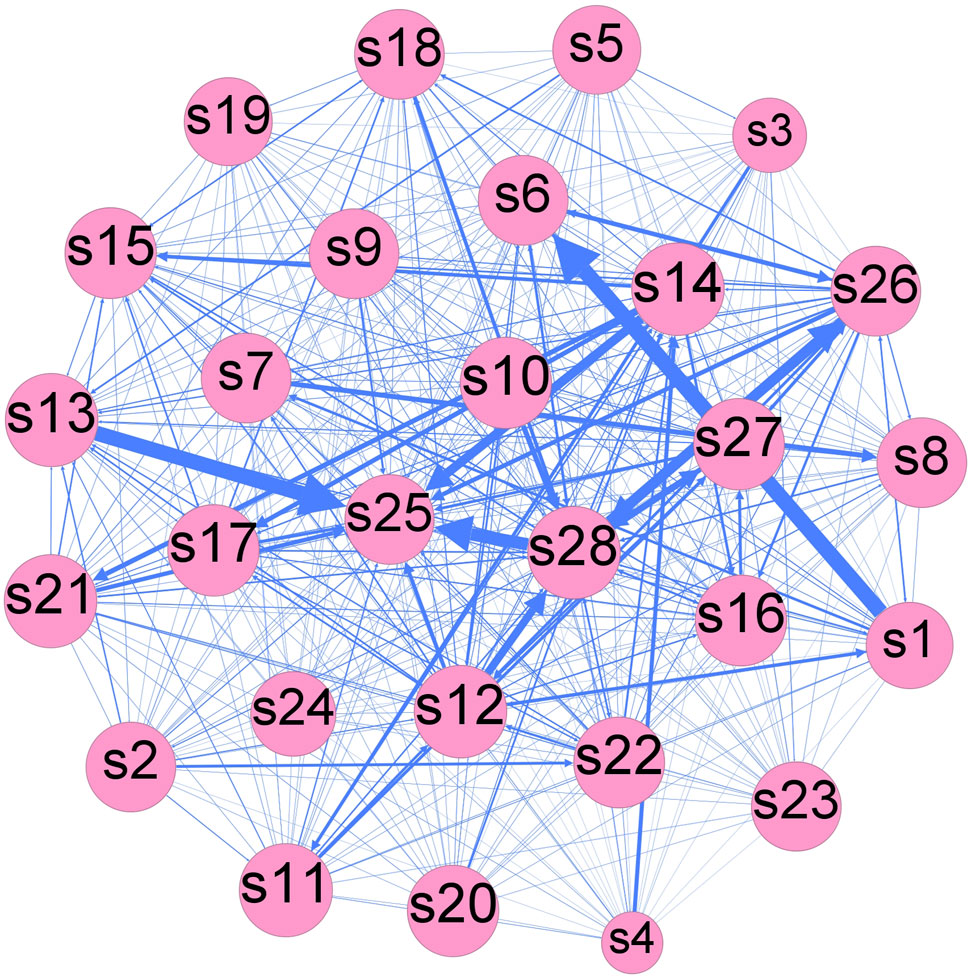
Figure 1. Industry embodied carbon transfer network in China.
Trade relations between China’s provincial regions allow
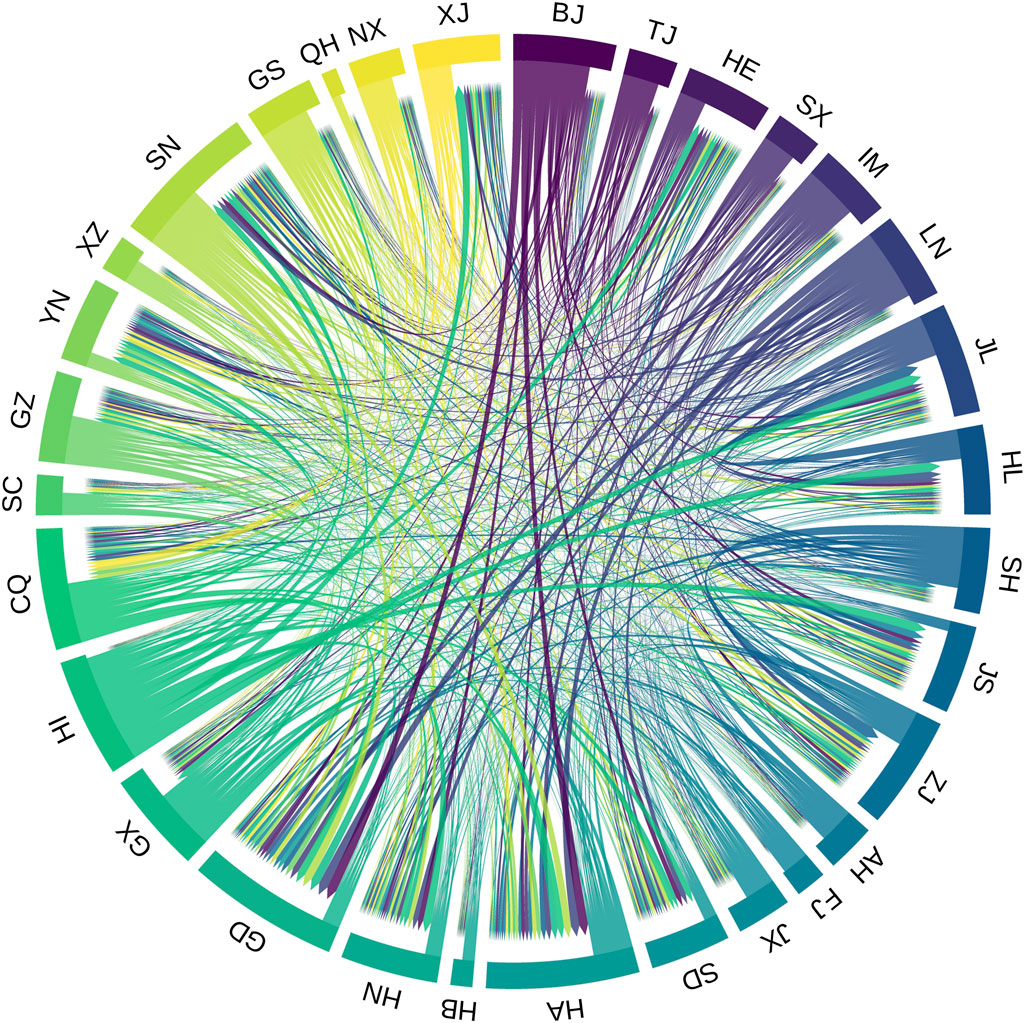
Figure 2. Inter-regional embodied carbon transfers in China’s construction industry.
Geographic visualization of the relationship between the embodied carbon transfer in the construction industry in each province, as shown in Figure 3, China’s construction industry embodied carbon emissions in the central and eastern regions show a large-scale transfer trend. Centered on Henan, Zhejiang and Guangdong, the surrounding provinces and cities form a region with a large scale of embodied carbon emissions and transfers from the construction industry. Transfers within the Beijing-Tianjin-Hebei region are more frequent, with the exception of a few provinces in the west, all of which receive a large amount of embodied carbon emissions from the middle reaches of the Yellow River (e.g., Shaanxi and Henan), especially in the eastern coastal region, which not only receives a large amount of embodied carbon transferred from the middle reaches of the Yellow River, but also receives transfers of embodied carbon from the northeastern and southwestern regions. Such inter-regional carbon transfer paths are often closely related to inter-provincial trade, and economic cooperation between neighboring provinces is particularly significant, thus creating a more pronounced geographic proximity effect within economic zones.

Figure 3. Geographic proximity of carbon transfer in China’s construction industry.
During the study period, the embodied carbon transfer in the northwest region, where Ningxia and Qinghai are located, has been inactive, mainly due to the following reasons: firstly, compared with other provinces, the level of economic development is low, and the scale of the construction industry is relatively small. Secondly, affected by land resource constraints, the two places are located in the western region with more complex geographic conditions and relatively scarce land resources, which also limits the development of the construction industry. Finally, despite the abundance of resources, the two regions have paid more attention to ecological environmental protection and sustainable development under the influence of environmental protection policies and energy transformation, and have taken measures to reduce carbon emissions, thus lowering the amount of carbon transferred from the construction industry. In addition, the energy and metal industries in the Xinjiang region directly provide raw materials for Hainan’s construction industry, thus transferring a significant amount of carbon emissions from Xinjiang to Hainan.
The network model was analyzed for edge weights according to the method of An et al. (2014). Using the number of edges as vertical coordinates and the cumulative probability of edge weights as horizontal coordinates, the cumulative distribution of edge weights is constructed as in Figure 4. According to the graph of cumulative distribution of edge weights, it can be seen that in the regional embodied carbon transfer network of the construction industry, 75% of the edges can cover 90% of the edge weight values. Based on the above, the W-T index filters out the poorly connected connecting relationships in the carbon transfer network, better characterizing the inter-regional carbon transfer network in the construction industry without making the network redundant and obscuring the key features.
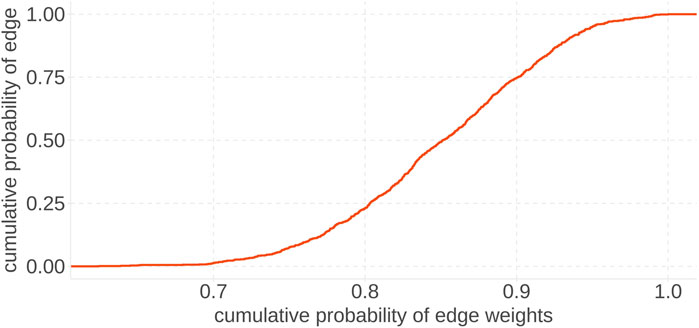
Figure 4. Cumulative distribution of side weights.
A total of 961 carbon transfer coefficients between regions were obtained based on the methodology in Part II. Excluding the coefficients of industry self-association, a total of 77 strong inter-regional associations were screened using the W-T index. A network of inter-regional embodied carbon transfers in China’s construction industry in 2017 is constructed using provincial-level regions as nodes and strong associations as the connecting edge criterion. As shown in Figure 5.
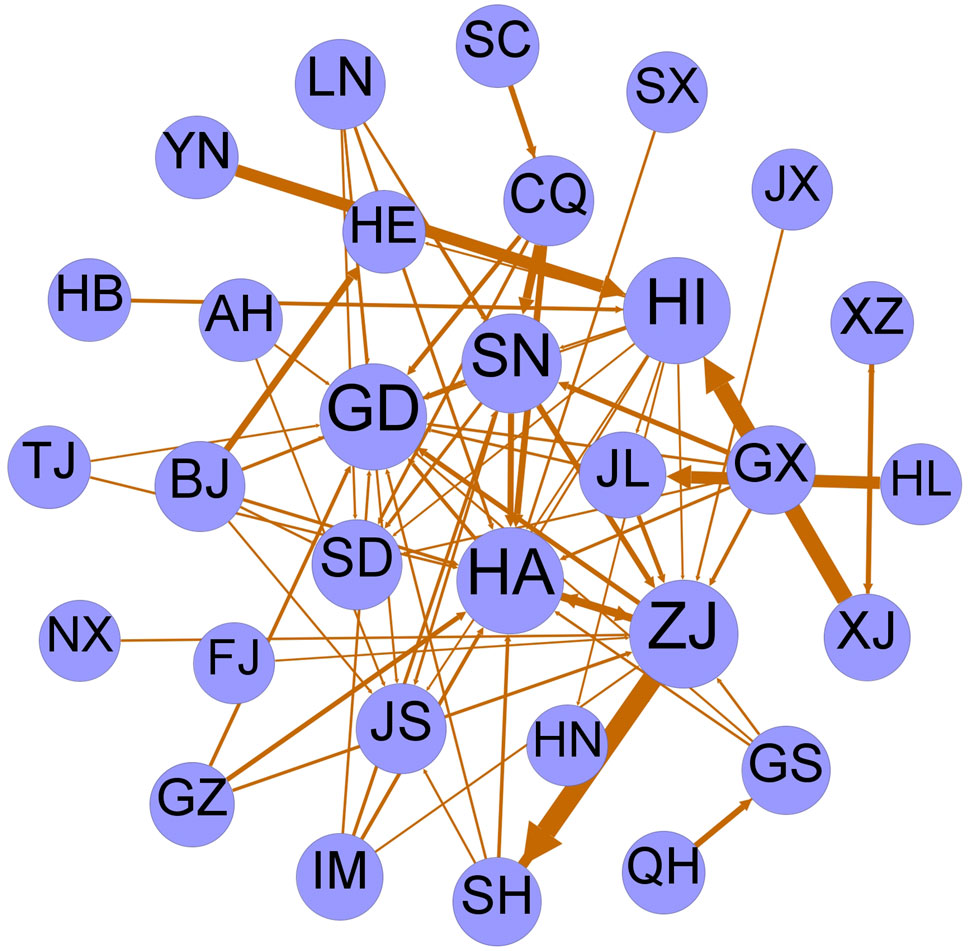
Figure 5. Regional embodied carbon transfer network in China’s construction industry.
The key indicators of the small-world characteristics of the inter-regional embodied carbon transfer network in China’s construction industry are shown in Table 3, where the average clustering coefficient of the nodes in the network is 0.422, which suggests that more than 40% of a province’s trading partners may be those of other regions, and that the whole network exhibits a strong state of aggregation.
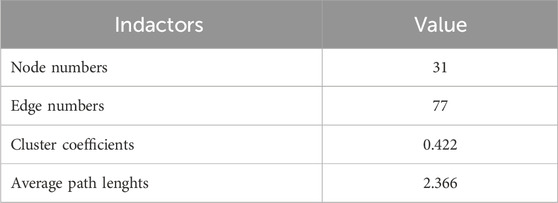
Table 3. Small-world characteristics.
The average path length has a range of values greater than 1, with smaller values indicating tighter connections between nodes in the network. The network has an average path length of 2.366, which is midway between 2.3 and 2.4, indicating that any two provinces in the network can, on average, realize the transfer of embodied carbon from the construction industry through 2.3 to 2.4 provinces.
China’s inter-provincial construction industry embodied carbon transfer network has a large aggregation coefficient and a short average path length. The network as a whole is characterized by a small world. As a result, any impacts on the key provinces will quickly spread to other provinces and may have a significant impact on the entire economic system.
The k-shell decomposition of the regional carbon transfer network for the construction industry leads to a simple network with five layers of shells, as shown in Figure 6. The red nodes are located in the outermost layer,
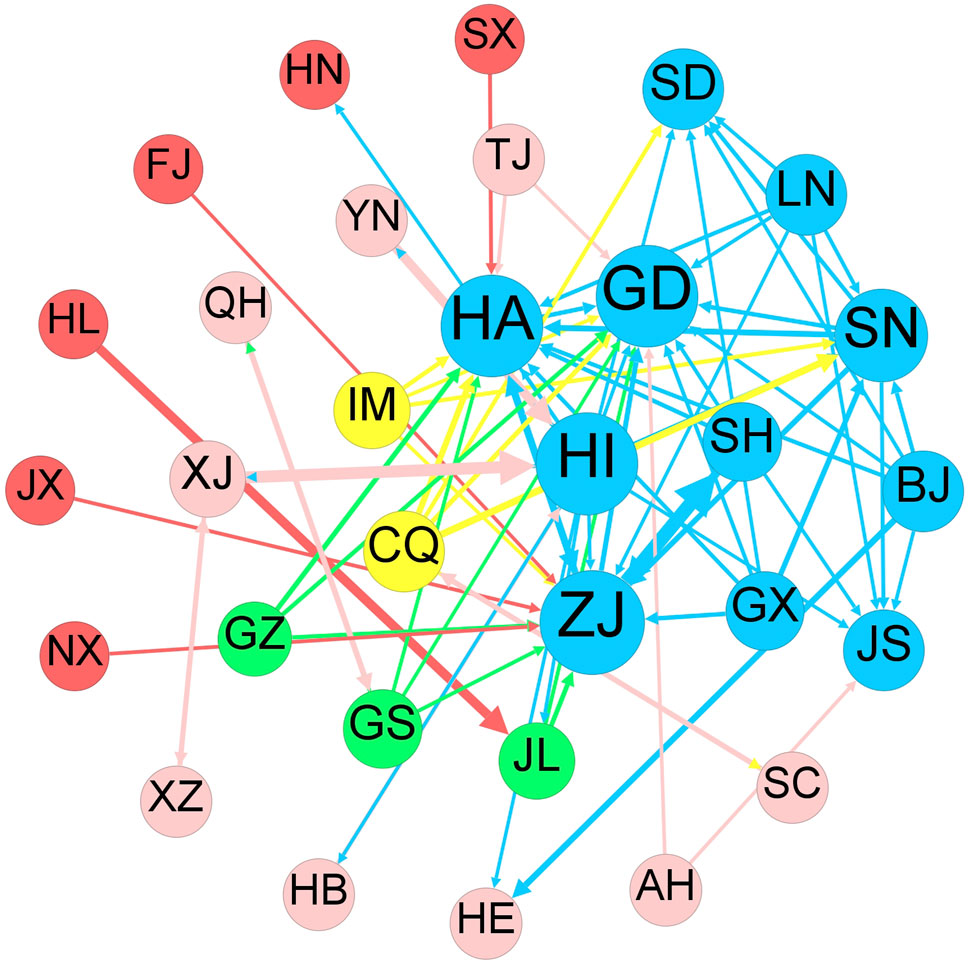
Figure 6. 5-layer network after k-shell decomposition.
Due to differences in resource conditions, economic levels and policy structures, provinces play different roles in the network. Using the centrality theory of complex networks, the role of provinces in the network is analyzed.
Out-degree and in-degree are important indicators of the relationship between nodes and directly reflect the relationship between carbon inflows and outflows between regions. When a region exports carbon to other regions, the greater the number of regions to which the carbon flows, the greater the degree of outflow, and similarly, the greater the number of other regions that export carbon to a region, the greater the degree of inflow. Out-degree and in-degree reflect the breadth of the range of carbon outflows and inflows of a node in the network, and are a direct indication of the number of regions with which carbon transfers are taking place. Carbon reduction measures taken in regions with large outward and inward degrees will have an impact that radiates to neighboring regions, resulting in a wider range of carbon reduction effects.
The inter-regional carbon transfer network of China’s construction industry involves 31 provinces and regions, and there are no isolated nodes in the network, and the out-degree and in-degree of each node are shown in Figure 7. In terms of the out-degree, Hebei, Jiangsu, Shandong, Hunan and Guangdong have a smaller out-degree, representing a lesser relationship between carbon outflow from the construction industry in these regions. Hainan, Beijing, Liaoning, Guangxi, Chongqing, and Shaanxi have relatively large out-degree of 12, 6, 6, 5, 5, and 5, respectively, suggesting that the construction industry in these provinces is developing more rapidly, while the out-degree of the remaining 25 provinces are all between 0 and 5. Hainan Province has the largest out-degree because it is the most critical carbon outflow province as China’s free trade port and international tourism and consumption center, and during the period of this paper’s research data release, Hainan has introduced policy documents to promote the sustained and healthy development of the construction industry, and the development of the construction industry is in high momentum, thus generating a higher carbon outflow relationship with other provinces. In terms of in-degree, the province with the highest in-degree is Guangdong, with a credits of 15, followed by Zhejiang and Henan, both with in-degree of 13. This means that Guangdong is a key carbon inflow province due to the booming construction R&D and design industry and technological innovation for emission reduction in Guangdong Province, which has a very active market and provides full support to construction projects in many other provinces. In terms of the degree of each province, which is the sum of the outgoing and incoming degrees, the province with the highest degree is Zhejiang, with a degree of 16, followed by Henan, Guangdong, and Hainan, which suggests that these regions are located in the middle of the carbon transfer network, and are not only transferring a large amount of carbon to other regions, but also receiving a large amount of carbon transfers from other regions. These regions play a key role in the construction trading market, indicating that these regions not only have a large volume of construction, but are also regions with a large manufacturing industry.
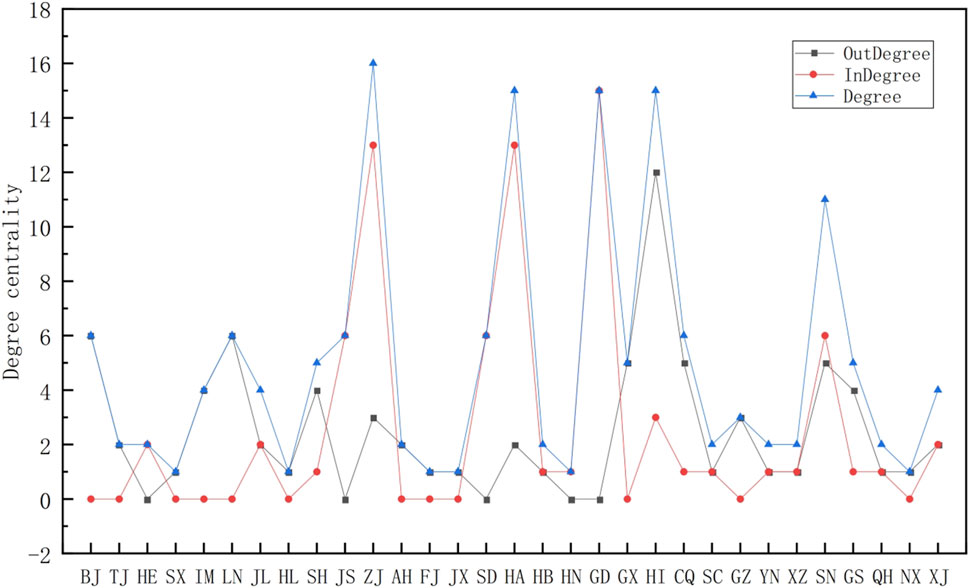
Figure 7. Degree centrality.
Betweenness centrality reflects whether a node is in a key position in the flow process, with higher values indicating that the node has a stronger control ability and plays the role of a “bridge” or “intermediary” in the transfer process. Regions with greater betweenness centrality have more carbon transfer paths passing through them and are in a key position for inter-regional carbon transfers, controlling carbon transfers between regions on both sides of the node, which usually leads to larger carbon transfers for the node itself.
As shown in Figure 8, the betweenness centrality values of provinces vary greatly, and only a few regions play an important intermediary role. Hainan, Xinjiang, Henan, Zhejiang, and Shanghai have higher betweenness centrality, which is greater than 10, significantly higher than that of other regions, and have the strongest control over carbon flow, which is the most critical “intermediary” region in the network. On the one hand, Xinjiang and Henan bear the task of supplying cement, bricks and tiles, concrete and other building materials to the whole country, and on the other hand, Shanghai, Zhejiang, Hainan and other economically powerful regions are more active in the production of the construction industry, with a high demand for building materials and construction equipment. As a result, these regions play a bridging role in the network and have stronger control over the transfer of embodied carbon emissions from other regions.
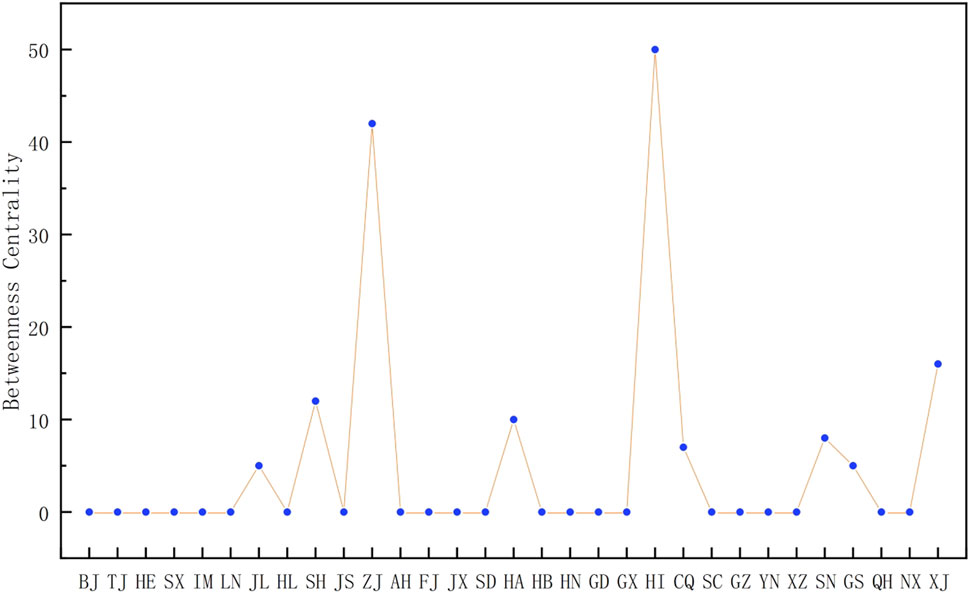
Figure 8. Betweenness centrality.
Provinces with higher closeness centrality in the network have the shortest total distance and closest connections to other provinces, and have a positional advantage in the construction industry’s embodied carbon transfer process.
As shown in Figure 9, Guangdong, Zhejiang, Henan, Hainan, Shaanxi, Jilin, Liaoning, Guangxi, Beijing and Inner Mongolia have higher closeness centrality and rank in the top ten, indicating that these regions are at the core of the network and are more likely to transfer carbon emissions with other regions, with a higher efficiency of carbon emission transfer. These regions are located in the hinterland of northern, central, and eastern China. Most of them are rich in coal resources and trade closely with the construction industry in other regions by virtue of their carbon resource endowment and geographical location. If these nodes are further controlled in the formulation of energy-saving and emission reduction policies, better carbon emission reduction can be realized.
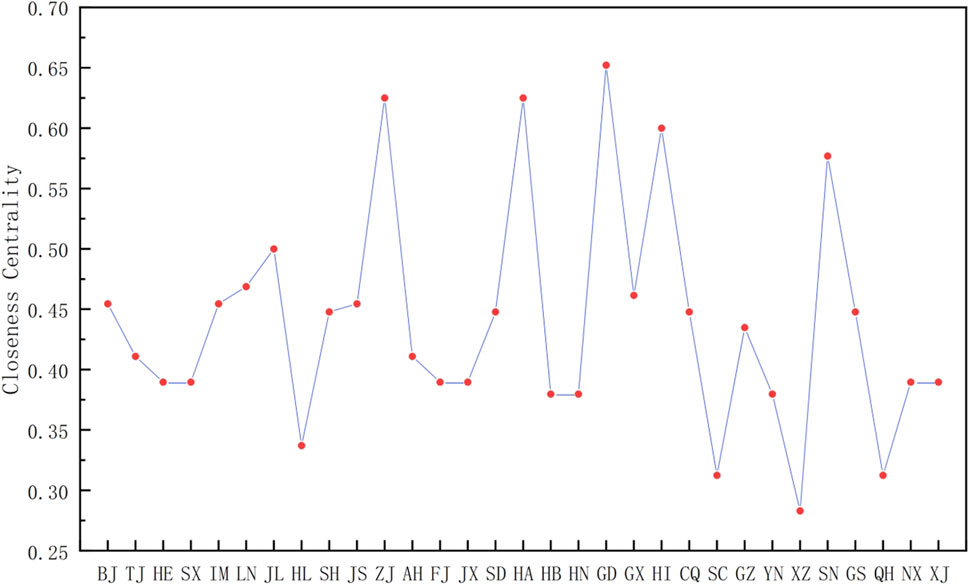
Figure 9. Closeness centrality.
Eigenvector centrality puts more emphasis on the surroundings of a network node and is used to describe the indirect influence of a node. A node is also considered to be an important node if it has a high number of associated nodes and the nodes connected to it are in an important position. In the regional carbon transfer network of the construction industry, the more a region has a large number of carbon transfer associations with other regions, and the more the region with which it is associated is in the center of the network, then the feature vector centrality of the province is also stronger. Regions with high eigenvector centrality are often key regions requiring carbon emission reduction, and while taking measures to reduce their own carbon emissions, the effect can also be further radiated to their neighboring key provinces, which is important for the overall carbon emission reduction of the network.
As shown in Figure 10, Guangdong, Henan, Zhejiang, and Shaanxi have higher eigenvector centrality during the study period, and in addition, Hainan, Liaoning, Guangxi, Beijing, Inner Mongolia, and Shandong are also ranked in the top ten, indicating that these regions have a strong correlation with the key regions in the network, and that their indirect influence is stronger. Guangdong and Zhejiang are economically developed regions in China with well-developed manufacturing and service industries, attracting a large amount of talent and resource inputs, thus having a high eigenvector centrality in the network. As the political and cultural center of China, Beijing, Henan, Shandong and other places are in the economic center of China, and their geographical location makes them play an important role in the network. Shaanxi, as a province rich in energy resources, Liaoning and Shandong are important industrial bases, and their industrial layout and resource advantages also support their eigenvector centrality in the network.
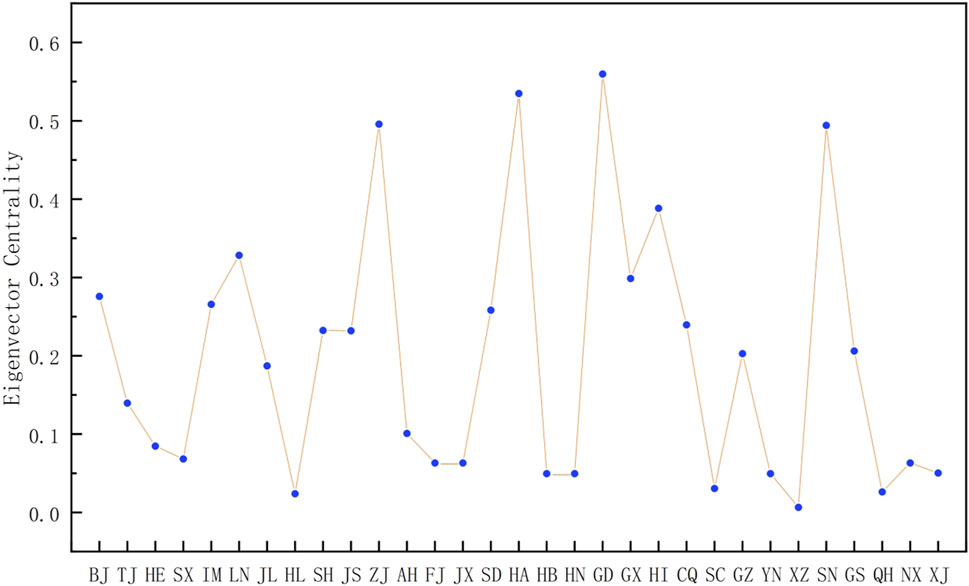
Figure 10. Eigenvector centrality.
In this study, input-output theory can analyze the flow of products and services between economic sectors, and complex network theory reveals the nodes and structural characteristics of the carbon emission transfer network, identifying the key nodes and major carbon emission pathways. The research findings were also verified through analyses in terms of industrial structure, local resource endowment, and current policies in the industry and region, which also verified the applicability of the input-output theory in revealing the relationship of carbon emissions among economic sectors and the validity of the complex network theory in analyzing the relationship of carbon emissions among industries and regions.
The building materials production sector and the building construction sector are major contributors to carbon emissions. In particular, the building materials production sector, such as the iron and steel and cement industries, has significantly higher carbon emissions than other sectors. This finding underscores the importance of focusing on these high-carbon emitting sectors and promoting the application of cleaner production technologies and the optimization of the industrial structure in the process of promoting a low-carbon transition in the construction industry.
The transfer of carbon emissions between regions is characterized by significant pathways and patterns. The southeastern coastal provinces have transferred significant amounts of embodied carbon from the midwestern and northeastern provinces through the procurement of construction materials. This model reflects the regional characteristics of China’s construction supply chain and the complexity of carbon transfer. The impact of this embodied carbon transfer needs to be taken into account when formulating emission reduction strategies, so that effective control of overall carbon emissions can be achieved through interregional cooperation and coordination.
The theoretical significance of this study lies in the application of a combination of input-output theory and complex network theory to the study of carbon emissions in the construction industry, which complements the study of multiregional carbon emissions transfer. By constructing an embodied carbon transfer network, this study reveals the key nodes and major transfer paths of carbon emissions in the construction industry, providing a new perspective for understanding the interregional transfer of carbon emissions.
In terms of practical significance, the results of this study provide an important reference for the formulation of differentiated carbon reduction policies. By identifying the key sectors and regions of carbon emissions, it helps to correctly grasp the regulatory path for the realization of carbon emission reduction targets in regions and construction-related industries, and policymakers can take targeted measures.
The following conclusions can be drawn from the above spatial transfer characteristics and industrial transfer characteristics of embodied carbon emissions from the construction industry: it can be seen that the allocation of responsibility for carbon emission reduction in China’s construction industry involves many sectors and complex inter-regional allocation. The construction industry is one of the major carbon emission industries in China. The large-scale transfer of embodied carbon emissions from China’s construction industry occurs between provinces with high economic relevance, which is mainly reflected in the transfer of resource-rich western provinces to the more economically developed eastern provinces, centered on Jiangsu, Zhejiang, Guangdong, Hainan and other provinces, and other provinces with close trade relations to form a neighboring relationship with the largest embodied carbon emissions from the construction industry in the country, and the largest scale of the transfer. Among them, energy-intensive industries in resource-rich provinces are mostly carbon emitters, and construction industries in economically developed regions are mostly carbon receivers. Overall, the main direction of transfer has shifted from the west to the central and eastern regions. At present, the construction industry is dominated by carbon inflows, and it mainly considers changing its demand for products from upstream industries to realize emission reductions, showing obvious carbon outflows relative to other industries, and should focus on the carbon emissions of its own output.
In the above research, this paper puts forward the following policy recommendations:
1) Focus on the management of the core nodes of the network, metal smelting, electricity, heat production and supply industry, non-metallic manufacturing industry is the most critical industry in the carbon transfer network, but also an important driving force for the rapid development of China’s economy, it is necessary to appropriately raise the standard of carbon emissions, to encourage rationalization of the structure of its use of fossil fuels, and to optimize the energy structure of the parts and components, building materials and other industries.
2) Promoting the development of green buildings, supporting and promoting green building standards, starting with building design, material selection, construction, maintenance and use in order to reduce the energy consumption and environmental impact of buildings, promoting the recycling and reutilization of waste, wastewater and low-carbon building materials, upgrading building construction equipment and upgrading construction techniques, and realizing the organic fusion of whole-life carbon-reducing and long-term carbon-control to promote the process of green buildings.
3) Implementing the allocation of responsibility for carbon emission reduction. According to the characteristics of energy consumption and input and output of each industry, emphasize the differences in carbon emissions between industries and implement industry classification and management. For high-energy-consuming industries, supply-side reform should be promoted, new technologies and processes should be adopted to eliminate outdated production capacity, improve energy utilization efficiency, and at the same time find alternative energy sources to form a green energy system; for industries with a high demand for the supply of intermediary products, attention should be paid to the intermediate production process, accelerating vertical integration of the industrial chain, strengthening carbon verification of products, and selecting low-carbon emission intermediary products, so as to reduce the source of carbon emissions.
The original contributions presented in the study are included in the article/Supplementary Material, further inquiries can be directed to the corresponding author.
WX: Conceptualization, Data curation, Formal analysis, Software, Writing–original draft, Writing–review and editing. XF: Conceptualization, Data curation, Formal analysis, Software, Writing–original draft, Writing–review and editing. WS: Data curation, Methodology, Validation, Writing–review and editing. LW: Funding acquisition, Resources, Supervision, Validation, Writing–review and editing.
The author(s) declare that financial support was received for the research, authorship, and/or publication of this article. This work was supported by the National Natural Science Foundation of China (71973086), the humanities and Social Sciences Research Program of the Ministry of Education (20YJC630164), and Natural Science Foundation of Shandong Province (ZR2020QG030).
The authors declare that the research was conducted in the absence of any commercial or financial relationships that could be construed as a potential conflict of interest.
All claims expressed in this article are solely those of the authors and do not necessarily represent those of their affiliated organizations, or those of the publisher, the editors and the reviewers. Any product that may be evaluated in this article, or claim that may be made by its manufacturer, is not guaranteed or endorsed by the publisher.
The Supplementary Material for this article can be found online at: https://www.frontiersin.org/articles/10.3389/fenvs.2024.1409539/full#supplementary-material
An, Q., An, H., and Wang, L. (2014). Analysis of the embodied energy flow network between Chinese industries. J. Syst. Eng. 29, 754–762.
Beeftink, M., Hofs, B., Kramer, O., Odegard, I., and van Der Wal, A. (2021). Carbon footprint of drinking water softening as determined by life cycle assessment. J. Clean. Prod. 278, 123925. doi:10.1016/j.jclepro.2020.123925
Chau, C. K., Leung, T., and Ng, W. (2015). A review on life cycle assessment, life cycle energy assessment and life cycle carbon emissions assessment on buildings. Appl. energy 143, 395–413. doi:10.1016/j.apenergy.2015.01.023
Chen, W., and Meng, Y. (2020). Research on China’s embodied carbon transfer network in 2012 from the perspective of provinces and sectors. Environ. Sci. Pollut. Res. 27, 38701–38714. doi:10.1007/s11356-020-09528-z
Dalgaard, R., Schmidt, J., and Flysjö, A. (2014). Generic model for calculating carbon footprint of milk using four different life cycle assessment modelling approaches. J. Clean. Prod. 73, 146–153. doi:10.1016/j.jclepro.2014.01.025
Duan, C., Chen, B., Feng, K., Liu, Z., Hayat, T., Alsaedi, A., et al. (2018). Interregional carbon flows of China. Appl. Energy 227, 342–352. doi:10.1016/j.apenergy.2018.01.028
Fanwen, K., Lubo, L. I., Management, S. O., and University, S. J. (2019). Analysis on spatial distribution and driving factors of carbon emissions in provincial construction industry. Constr. Econ.
He, Y.-Y., Wei, Z.-X., Liu, G.-Q., and Zhou, P. (2020). Spatial network analysis of carbon emissions from the electricity sector in China. J. Clean. Prod. 262, 121193. doi:10.1016/j.jclepro.2020.121193
Hu, W., Hu, Y., Wang, C., and Chen, X. (2019). Construction and analysis of China’s industrial network of carbon correlation. Appl. Ecol. Environ. Res. 17. doi:10.15666/aeer/1706_1448714503
Jiang, M., Gao, X., Guan, Q., Hao, X., and An, F. (2019). The structural roles of sectors and their contributions to global carbon emissions: a complex network perspective. J. Clean. Prod. 208, 426–435. doi:10.1016/j.jclepro.2018.10.127
Li, X., and Zhu, C. (2020). Summary of research on account of carbon emission in building industry and analysis of its influential factors. J. Saf. Environ. 20, 317–327.
Liu, H., Lackner, K., and Fan, X. (2021a). Value-added involved in co2 emissions embodied in global demand-supply chains. J. Environ. Plan. Manag. 64, 76–100. doi:10.1080/09640568.2020.1750352
Liu, J., Li, Y., and Wang, Z. (2023). The potential for carbon reduction in construction waste sorting: a dynamic simulation. Energy 275, 127477. doi:10.1016/j.energy.2023.127477
Liu, J., Yi, Y., Li, C. Z., Zhao, Y., and Xiao, Y. (2021b). A model for analyzing compensation for the treatment costs of construction waste. Sustain. Energy Technol. Assessments 46, 101214. doi:10.1016/j.seta.2021.101214
Ma, X., Fan, F., and Liu, Q. (2023). Study on the characteristics of embodied carbon emission transfer in China’s power sector based on input-output networks. Front. Environ. Sci. 11, 1114156. doi:10.3389/fenvs.2023.1114156
Pan, W., Pan, W., Shi, Y., Liu, S., He, B., Hu, C., et al. (2018). China’s inter-regional carbon emissions: an input-output analysis under considering national economic strategy. J. Clean. Prod. 197, 794–803. doi:10.1016/j.jclepro.2018.06.207
Petrokofsky, G., Kanamaru, H., Achard, F., Goetz, S. J., Joosten, H., Holmgren, P., et al. (2012). Comparison of methods for measuring and assessing carbon stocks and carbon stock changes in terrestrial carbon pools. how do the accuracy and precision of current methods compare? a systematic review protocol. Environ. Evid. 1, 6–21. doi:10.1186/2047-2382-1-6
Qi, Y., and Xia, Y. (2022). Research on accounting and transfer pathways of embodied carbon emissions from construction industry in China. Sustainability 14, 15165. doi:10.3390/su142215165
Quan, B., Shan, H., and Li-Jing, G. (2022). Interpretation of ipecac ar6 on buildings. Clim. Change Res. 18, 10.
Sanmang, W., Yanrui, W., Yalin, L., Shantong, L., and Li, L. (2018). Chinese provinces’ co2 emissions embodied in imports and exports. Earths Future 6, 867–881. doi:10.1029/2018ef000913
Shenjun, Q. I., Sinv, T., Yunbo, Z., and Rikun, W. (2016). Tendency for embodied carbon emissions and its reduction responsibility among the related industry of construction industry on the basis of ras and i-o. Ecol. Econ.
Spaiser, V., Scott, K., Owen, A., and Holland, R. (2018). Consumption-based accounting of co2 emissions in the sustainable development goals agenda. Int. J. Sustain. Dev. World Ecol. 26, 282–289. doi:10.1080/13504509.2018.1559252
Wang, L., Zhou, X., Wei, L., and Xiao, W. (2023a). A network analysis of carbon emission flows among marine industries in China. Front. Energy Res. 11, 1107796. doi:10.3389/fenrg.2023.1107796
Wang, Y., Lei, Y., Fan, F., Li, L., Liu, L., and Wang, H. (2021a). Inter-provincial sectoral embodied co2 net-transfer analysis in China based on hypothetical extraction method and complex network analysis. Sci. Total Environ. 786, 147211. doi:10.1016/j.scitotenv.2021.147211
Wang, Z., Han, F., Xia, B., Liu, J., and Zhang, C. (2023b). Regional differences and heterogeneity of construction and demolition waste with economic growth: evidence from China. Constr. Manag. Econ. 41, 44–59. doi:10.1080/01446193.2022.2137882
Wang, Z., Yang, Y., and Wang, B. (2018). Carbon footprints and embodied co2 transfers among provinces in China. Renew. Sustain. Energy Rev. 82, 1068–1078. doi:10.1016/j.rser.2017.09.057
Wang, Z., Zhang, Z., and Jin, X. (2021b). A study on the spatial network characteristics and effects of cdw generation in China. Waste Manag. 128, 179–188. doi:10.1016/j.wasman.2021.03.022
Wang, Z., Zhou, Y., Zhao, N., Wang, T., and Zhang, Z. (2022). Spatial correlation network and driving effect of carbon emission intensity in China’s construction industry. Buildings 12, 201. doi:10.3390/buildings12020201
Wen, L., and Zhang, Y. (2020). A study on carbon transfer and carbon emission critical paths in China: I-o analysis with multidimensional analytical framework. Environ. Sci. Pollut. Res. 27, 9733–9747. doi:10.1007/s11356-019-07549-x
Xiao, H., Sun, K., Tu, X., Bi, H., and Wen, M. (2020). Diversified carbon intensity under global value chains: a measurement and decomposition analysis. J. Environ. Manag. 272, 111076. doi:10.1016/j.jenvman.2020.111076
Xiao, M., and Peng, X. (2023). Decomposition of carbon emission influencing factors and research on emission reduction performance of energy consumption in China. Front. Environ. Sci. 10, 1096650. doi:10.3389/fenvs.2022.1096650
Xu, D., Zhang, Y., Chen, B., Bai, J., Liu, G., and Zhang, B. (2022). Identifying the critical paths and sectors for carbon transfers driven by global consumption in 2015. Appl. Energy 306, 118137. doi:10.1016/j.apenergy.2021.118137
Zhang, J., Zhao, H., Li, Z., and Guo, Z. (2023). Evaluation of greenness of green buildings based on carbon emissions. Kybernetes 52, 4645–4667. doi:10.1108/k-03-2022-0378
Keywords: construction, embodied carbon transfer, interregional input-output, complex networks, China
Citation: Xiao W, Fu X, Song W and Wang L (2024) Complex network analysis of embodied carbon emission transfer in China’s construction industry. Front. Environ. Sci. 12:1409539. doi: 10.3389/fenvs.2024.1409539
Received: 30 March 2024; Accepted: 26 June 2024;
Published: 18 July 2024.
Edited by:
Zhen Wang, Huazhong Agricultural University, ChinaCopyright © 2024 Xiao, Fu, Song and Wang. This is an open-access article distributed under the terms of the Creative Commons Attribution License (CC BY). The use, distribution or reproduction in other forums is permitted, provided the original author(s) and the copyright owner(s) are credited and that the original publication in this journal is cited, in accordance with accepted academic practice. No use, distribution or reproduction is permitted which does not comply with these terms.
*Correspondence: Lili Wang, MTE1NjhAc2RqenUuZWR1LmNu
Disclaimer: All claims expressed in this article are solely those of the authors and do not necessarily represent those of their affiliated organizations, or those of the publisher, the editors and the reviewers. Any product that may be evaluated in this article or claim that may be made by its manufacturer is not guaranteed or endorsed by the publisher.
Research integrity at Frontiers
Learn more about the work of our research integrity team to safeguard the quality of each article we publish.