 Bo Tang
 Hao Ren
 Jin-an Qiu
 Cheng Miao
 Yinzhong Chen
94% of researchers rate our articles as excellent or good
Learn more about the work of our research integrity team to safeguard the quality of each article we publish.
Find out more
ORIGINAL RESEARCH article
Front. Environ. Sci., 27 June 2024
Sec. Environmental Informatics and Remote Sensing
Volume 12 - 2024 | https://doi.org/10.3389/fenvs.2024.1406386
This article is part of the Research TopicEmerging Trends and Advancements of Geoinformatics Applications in Earth and Environmental SystemsView all 6 articles
The implementation of the provincial geo-hazard risk survey in China holds significant guiding importance in assessing disaster risks on a large scale and across different regions. Taking the Pearl River Delta (PRD) in Guangdong Province as a case study, characterized by a highly developed economy and dense population yet facing challenges from geo-hazard, this study utilizes the risk assessment system for geo-hazard along with a substantial dataset on hidden dangers. The hazardousness levels, vulnerability, and overall risk are evaluated by applying the risk matrix method, Weighted Informativeness method, and grey correlation analysis method. The results indicate that: (1) The level of hazardousness posed by geo-hazards in the PRD is typically more pronounced in the central and eastern areas, while it is lower in the western regions. The severity of geo-hazards is primarily influenced by rainfall factors, while there is no direct correlation between slope factors and the occurrence of geo-hazards. The relationship between altitude and the likelihood of geo-hazards typically indicates that higher altitudes pose a greater risk. However, this pattern does not hold for the PRD; (2) The susceptibility to geo-hazard in the PRD is intricately linked to the level of regional economic advancement, with areas of medium to high vulnerability predominantly clustered around Guangzhou, Shenzhen, and Dongguan; (3) The likelihood of geo-hazard in the PRD, with a higher risk observed in the central part and lower risk in the surrounding areas, displaying a radial distribution pattern. Rainfall patterns and the level of economic development in the region significantly influence the assessment of geo-hazard risks in the PRD.
Amidst global climate change and accelerating urbanization, a pivotal concern has surfaced in alignment with the United Nations Sustainable Development Goals (UNSDGs): the need to bolster the disaster resilience and adaptive capacity of intertwined natural, social, and economic systems. This concern underscores the importance of examining Geological Hazard Prevention Efficiency (GHPE) and its influencing factors. Such an examination is vital for developing strategies that conform to SDGs, aiming to reduce the adverse effects of geo-hazard in the rapidly evolving global landscape (Fang and Wang, 2015; Yi et al., 2023). Utilizing scientific methodologies for the prediction and prevention of disasters has emerged as a critical research focus and a pressing necessity worldwide (Fang and Wang, 2015; Amirzadeh et al., 2022; Yik et al., 2023). Geohazards, characterized by their diversity, susceptibility, and dynamic randomness, have led to significant direct economic losses, casualties, and indirect economic impacts globally. Consequently, the evaluation and mitigation of geohazard have attracted increased scholarly attention (Huang et al., 2004; Khalid and Ali, 2019; Amirzadeh et al., 2022; Tang et al., 2023). Therefore, it is crucial to conduct a comprehensive analysis of the risks and susceptibility of geo-hazard to mitigate geo-hazards. Overseas research on geologic hazard risks commenced in the mid-20th century, yielding significant advancements in early warning systems, risk assessment zoning, and prevention and control management (Stevenson, 1997; Daniele et al., 2022). Corominas et al. proposed methodologies for the quantitative analysis of landslide hazards, vulnerability, and risk across different spatial scales. (Corominas et al., 2014). This framework is crucial for effective landslide hazard management, risk zoning, and land-use planning in urban areas (Fell et al., 2008). There studies underscore the significant theoretical and practical implications of geohazard research. The integration of practitioner insights and field surveys, as well as the utilization of Geographic Information Systems (GIS) technology and data modeling, have emerged as common approaches in geohazard evaluation, emphasizing the amalgamation of diverse methods (Dong et al., 2018; Felipe et al., 2022). Biswajeet et al. conducted a geohazard assessment by employing frequency ratio, logistic regression, and Artificial Neural Network (ANN) models integrated with GIS technology. They contributed to the advancement of contemporary geohazard risk assessment methodologies (Biswajeet and Saro, 2010). Segoni and Caleca proposed a novel set of environmental indicators for the rapid estimation of landslide risk. This approach allows for the evaluation of how effectively municipalities have implemented sustainable urban growth strategies to manage and mitigate the impact of landslide risks (Segoni and Caleca, 2021). In the advanced phase, geohazard assessment has progressed into a period of multi-platform integration and extensive utilization, incorporating satellite remote sensing and GIS technology (Zhong et al., 2024), ANN in conjunction with GIS technology (Gómez and Kavzoglu, 2004), and machine learning algorithms and InSAR techniques. (Novellino et al., 2021), Quantitative Risk Analysis (QRA) (Caleca et al., 2022), these new methods and technologies are crucial for risk management and planning of mitigation measures. Geo-hazard risk assessment involves a quantitative analysis and evaluation of the probability that a risk area will experience geological disasters of varying intensities, along with the potential losses that may result. This topic holds significant practical importance and represents a crucial research field. With the comprehensive exploration of natural resources and a strong focus on disaster prevention and mitigation, the geological hazard risk investigation in China is currently witnessing significant growth (Ma et al., 2004; Qi et al., 2012). China initiated its formal geohazard risk assessment in the 1990s. Scholars have extensively elucidated the conceptual understanding of risk, the theoretical foundations of geohazard risk, its components, indicator system, methodological models, and evaluation trajectories (Zhang and Zhang, 2000; Lu et al., 2003; Shi et al., 2012). Identifying geohazard risk involves calculating the expected loss through an analysis of the danger and vulnerability of geohazards (Xiang and Huang, 2000). In the 21st century, there has been a proliferation of research on disaster risk, influenced by advanced foreign theories and technologies (Ma and Mei, 2021; Zhao et al., 2023). Ruan et al. (Ruan and Huang, 2001) integrated the informativeness method and developed a geohazard risk assessment method centered on GIS. Li et al. (Li et al., 2004) conducted a comprehensive analysis of the major geohazards in China, including their scale, triggering factors, and distribution, which contributed to data accumulation and methodological guidance for future research. Fan et al. (Fan et al., 2012) introduced the weighted informativeness model into landslide susceptibility evaluation, combining the informativeness method with hierarchical analysis. Additionally, numerous studies adopted the technology and concept of digital earth, establishing an integrated “three investigations” system encompassing sky, space, and earth. Early identification of geological hazards is crucial, followed by professional monitoring that relies on understanding the laws and characteristics of dynamic geological hazard development. This enables real-time early warning and prediction of geo-hazard (Xu et al., 2019). A new phase in China’s geological hazard risk assessment commenced on 31 May 2020, with the issuance of Notice on First National Comprehensive Risk Census of Natural Disasters by General Office of State Council. This initiative proposed mapping the distribution of geological hazards to facilitate early detection and prevention. Ma et al. (Ma et al., 2021) utilized the technical approaches for conducting geological disaster risk assessment at the provincial level, using Zhejiang Province as a case study. The researchers conducted exploratory study aimed at developing a provincial geohazard risk evaluation model and selecting an appropriate index system. Within the context of territorial spatial planning, the assessment and mitigation of geological hazard risks on a large scale and across regions have emerged as the predominant focus of both theoretical inquiry and practical application.
Both domestic and international scholars have initiated research on the assessment of geological hazard risks at an earlier stage. They have made significant progress in establishing the theoretical framework, evaluation methodologies, and technical approaches. These advancements have laid a robust foundation for the assessment of geological hazard risks in the contemporary era. However, there is a scarcity of results in the assessment of geohazard risks on a large scale and across regions. These regions are particularly characterized by high levels of social and economic activities, complex geological settings, and significant geohazard risks. Therefore, conducting geohazard risk assessments on a broader scale holds significant research value. Commencing with the investigation of mature single-hazard risk research can serve as a basis for delving into the theoretical underpinnings and methodological approaches for future multi-hazard comprehensive risk assessments, thereby enhancing strategies for prevention and management of multi-hazard risks (Wang et al., 2023). To enhance the overall prevention and control capabilities of geo-hazard in Guangdong Province, mitigate the risks of geo-hazards, and support and ensure high-quality development, the General Office of Provincial Government has released the “Three-Year Action Program for Enhancing Comprehensive Prevention and Control Capacity of Geologic Disasters in Guangdong Province (2023–2025)." This program delineates the strategic focus for the prevention and control of geo-hazards in Guangdong Province and offers a foundational framework for guiding these efforts. The present research conducts a comprehensive assessment of danger, vulnerability, and risk by introducing a sophisticated geohazard risk assessment system. The system is developed based on extensive geohazard site data and socio-economic data, employing the risk matrix, weighted informativeness method, and gray correlation analysis method. It offers a theoretical foundation for the early detection of geo-hazard in the PRD and facilitates coordination for regional disaster relief efforts. It advocates for disaster prevention and control planning and the development of resilience in the PRD. Simultaneously, forecasting and mitigating geo-hazard on a regional scale hold significant practical importance for urban planning and development initiatives within the PRD. This is crucial for fostering the harmonious cohabitation of human populations and the environment amidst rapid urbanization.
The PRD is the center of Guangdong Province, mainly including Guangzhou, Foshan, Zhaoqing, Shenzhen, Dongguan, Huizhou, Zhuhai, Zhongshan, and Jiangmen, nine cities (Figure 1). As of 2022, the region has a resident population of 77,953,600, accounting for about 61.38% of the population of Guangdong Province; an area of 543,449.02 square kilometers, accounting for about 30.24% of the land area of Guangdong Province; and a gross domestic product (GDP) of 986,480,300 million yuan, accounting for about 76.41% of the GDP of Guangdong Province. The region has 1,430 slope-type geohazard potential sites (Figure 2), categorized into three main types: avalanches, landslides, and mudslides. There are 1,177 potential points of avalanches, accounting for 82.31%; 245 possible points of landslides, accounting for 17.13; and eight mudslides, accounting for 0.56%.
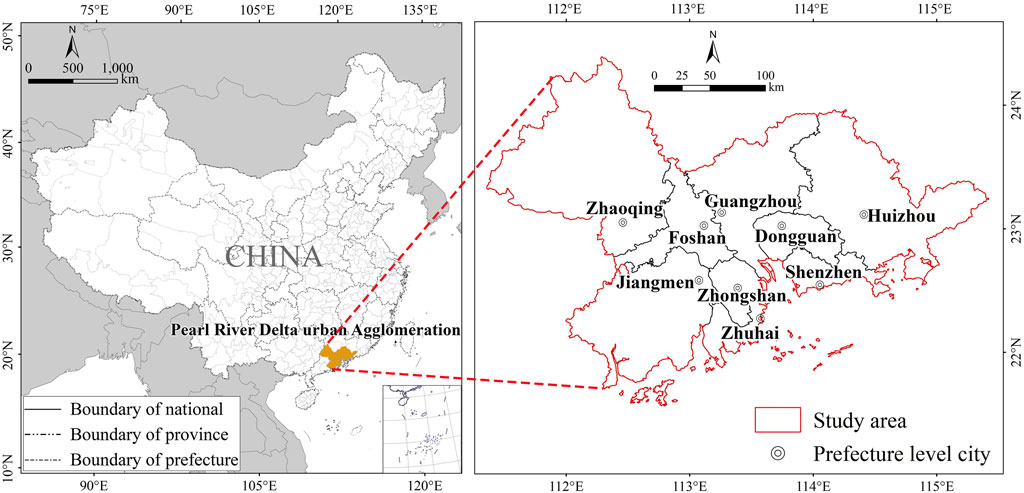
Figure 1. Study area.

Figure 2. Geological hazard sites in the PRD (slope type).
In the present research, the data of geologic disaster sites, engineering geology rock groups, geological structure lines, building outlines, and 29 meteorological stations in the past 20 years rainfall data are mainly from Guangdong Province Geologic Disaster Emergency and Risk Response Technology Center; the data of land use type are from Chinese Academy of Sciences Resource and Environmental Science Data Center (http://www.resdc.cn/); The administrative division data, vegetation cover data, and road data are from the National Catalogue service for Geographic Information (https://www.webmap.cn/main.do?method=index); The population and GDP data are from the statistical yearbooks of various cities (.A" title="http://stats.gd.gov.cn/gdtjnj/).A">http://stats.gd.gov.cn/gdtjnj/).A scale of 1:100000 is chosen for the hazardousness evaluation scale of geologic hazards, which is more favorable for studying geologic dangers in a large area. The size of the evaluation unit is 50 m × 50 m, i.e., the minimum area of the raster layer is a square of 2,500 square meters. As studied in the present research, vulnerability refers to the potential damage caused by slope-type geohazards to the PRD’s social, physical, and economic resources and environment. The evaluation units are at the county and district levels, and the PRD is divided into 50 evaluation units.
Figure 3 illustrates the methodological framework utilized in this study. By integrating the analysis of literature (Qi et al., 2012) and the geological characteristics of the PRD, and reference to the Technical requirement for geo-hazard survey (1:50 000), a geo-hazard risk assessment system is developed, focusing on both hazardousness and vulnerability aspects. Hazardousness mainly refers to the likelihood of occurrence of a particular scale and type of geologic hazard in a certain area at a certain period of time under the effect of certain triggering factors. Based on the accessibility, scientific validity and operationalization of the data, the hazardousness system incorporates eight key indicators, including slope gradient, slope direction, and rainfall, etc., (Ji et al., 2018). Vulnerability refers primarily to the extent to which hazard-bearing bodies within the geologic hazard impact area are likely to be damaged by geologic hazards (Cai and Tie, 2016). Four evaluation indicators, namely, population density, building density, road density, and GDP density, have been selected for the vulnerability index. The hazardousness evaluation employed the weighted informativeness method, while the vulnerability evaluation results were obtained using the gray correlation analysis method. Subsequently, the hazardousness and vulnerability evaluation results were integrated through raster superposition calculation to determine the risk characteristics and grade zoning of geologic hazards in the PRD.
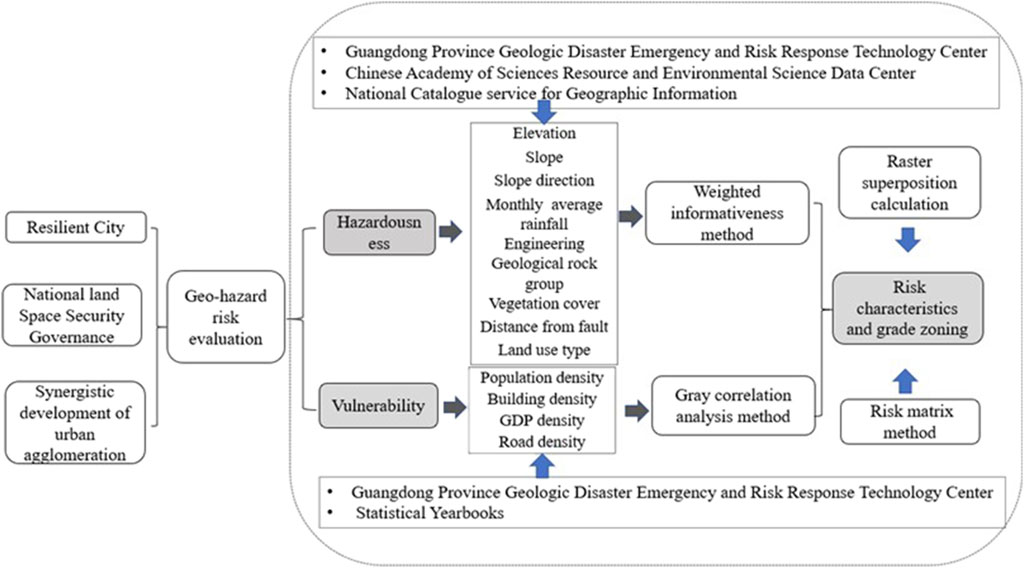
Figure 3. Methodological framework.
Referring to the " the Technical requirement for geo-hazard survey (1∶50 000)" and combining the characteristics of slope-type hazards in the PRD, eight evaluation indexes were selected (Table 1; Figures 4–11).
(1) Elevation is a common factor in evaluating the risk of geo-hazards. Theoretically, geo-hazards are not likely to occur if the elevation is too high or too low because the terrain is either too high or too low, resulting in sparse population density. Disasters that do not affect the safety of people’s property are not considered geological hazards, and most geological hazards occurring in areas with gentle terrain are not caused by the factor of elevation.
(2) The steepness of the slope significantly influences geological disasters, especially slope-related ones; the steeper the slope, the greater the potential energy of landslides or collapses, and the more likely they are to cause casualties.
(3) Differences in slope orientation lead to variations in the amount of solar radiation received, resulting in differences in slope stability.
(4) Rainfall is one of the most critical factors affecting the occurrence of geo-hazards. Long periods of rainfall can lead to changes in soil or rock adhesion, which can lead to the occurrence of disasters (Yu and Liu, 2012; Tian et al., 2017). Monthly average rainfall data from 29 meteorological stations in the PRD area for nearly 20 years from 2000 to 2021, was utilized.
(5) The rock mass characteristics, including softness, hardness, inter-layer structure, etc., not only directly determines the physical and mechanical strength of rock and soil, weathering resistance, stress distribution, and deformation damage characteristics but is also directly related to the slope stability and the difficulty of surface erosion, which is the main cause of slope failures, landslides, mudslides, and other disasters.
(6) Vegetation plays a role in slope protection and preventing soil erosion, and it has a particular influence on the evolution and stability of slopes.
(7) The distance from faults is highly conducive to the occurrence of geological hazards. Faults are the external representation of geological fracture zones, and the surrounding rock and soil’s supporting capacity has been destroyed, making it very susceptible to inducing geological hazards.
(8) Different land use types determine the degree of surface soil or rock exposure and the extent of human intervention, among which agricultural land or various artificial surfaces disturb the soil the most and are more prone to geo-hazards.
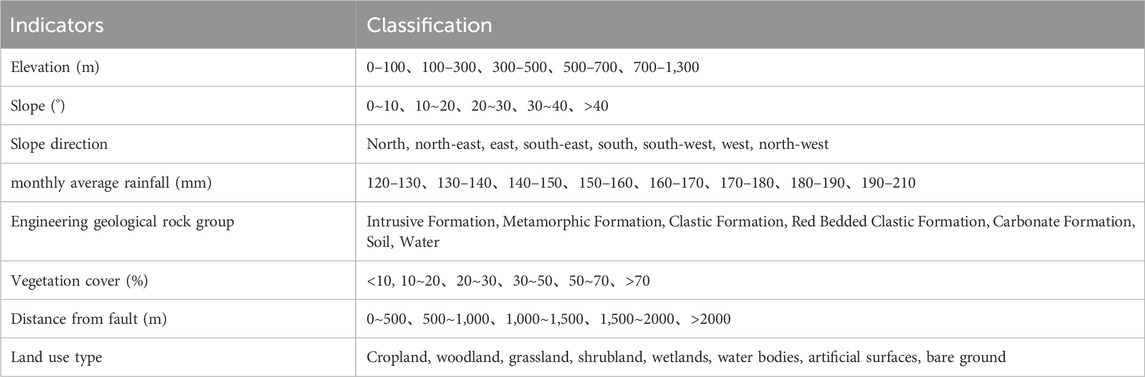
Table 1. Classification of indicators.
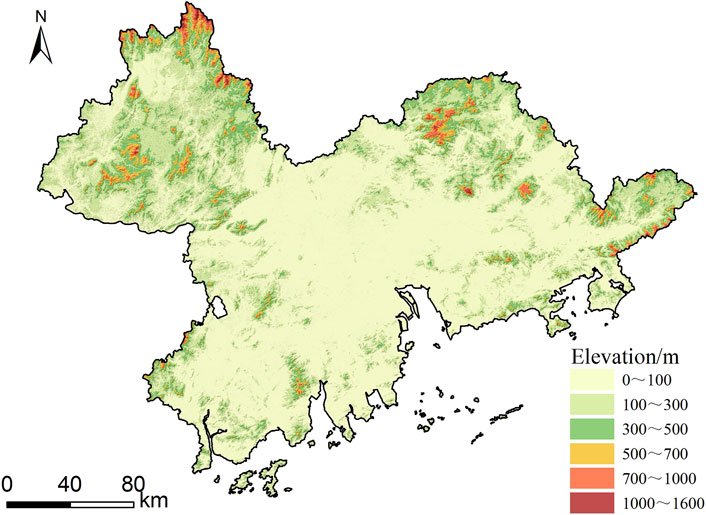
Figure 4. Elevation.
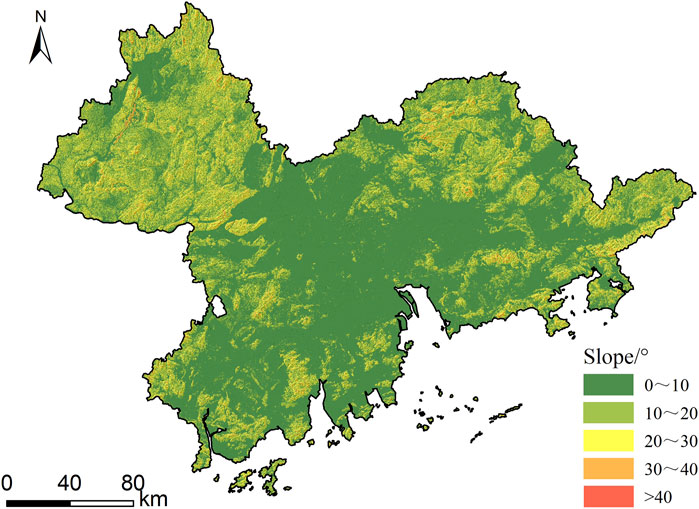
Figure 5. Slope.
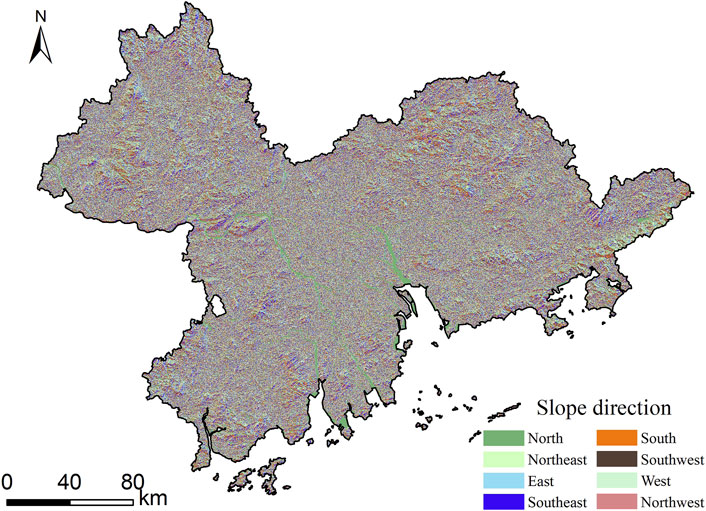
Figure 6. Slope direction.
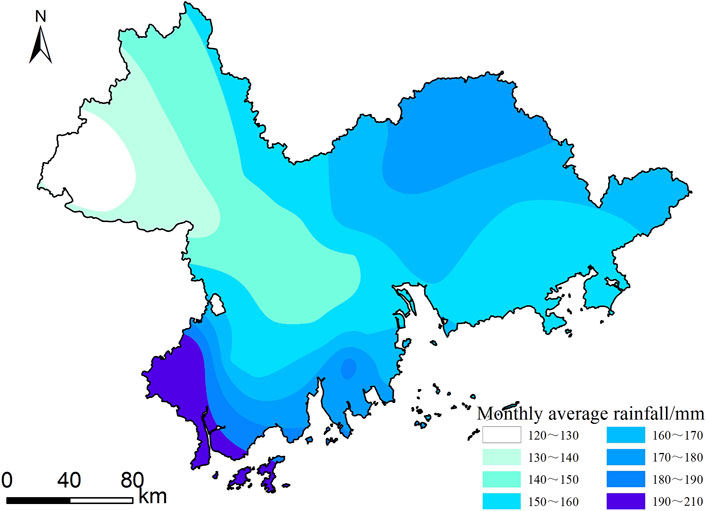
Figure 7. Monthly average rainfall.
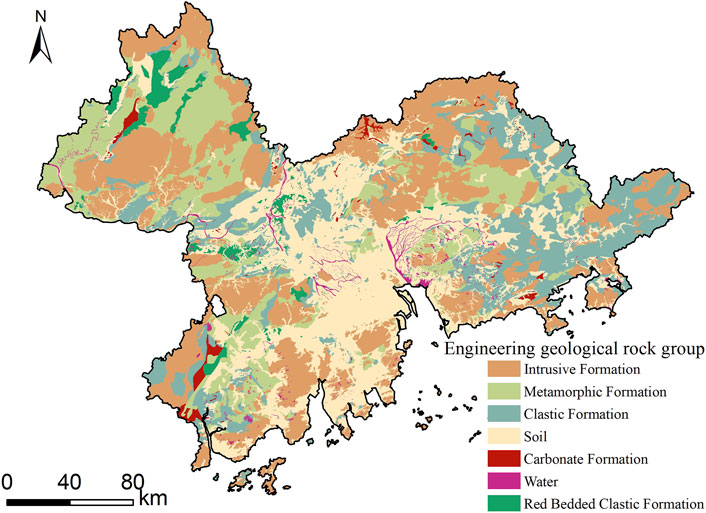
Figure 8. Engineering geological rock group.
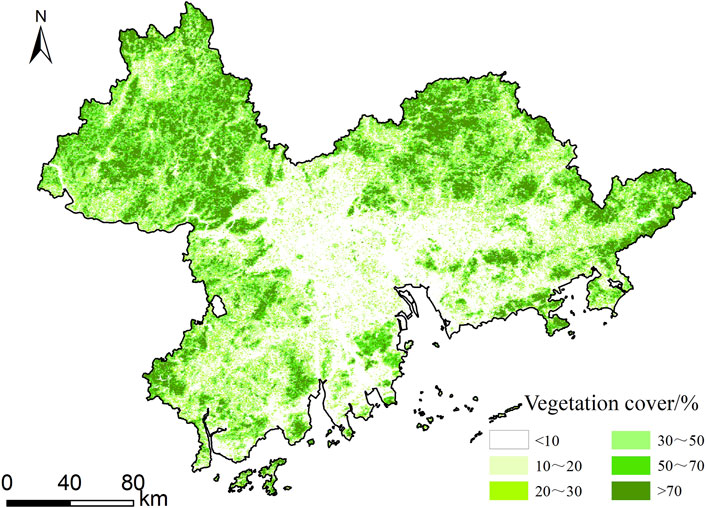
Figure 9. Vegetation cover.
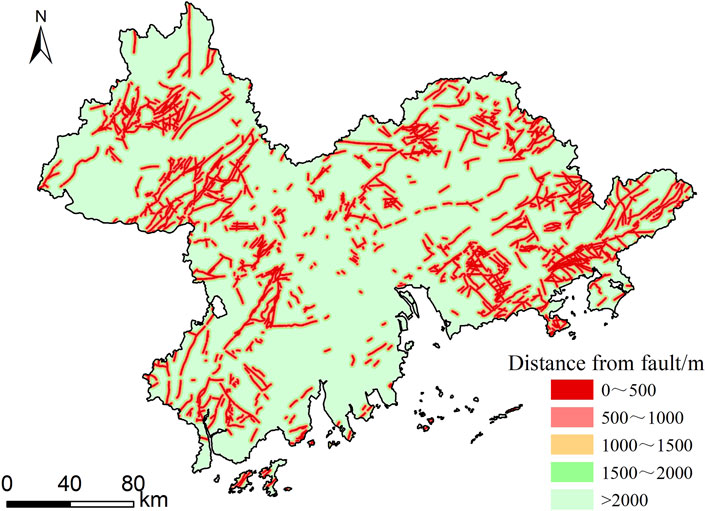
Figure 10. Distance from fault.
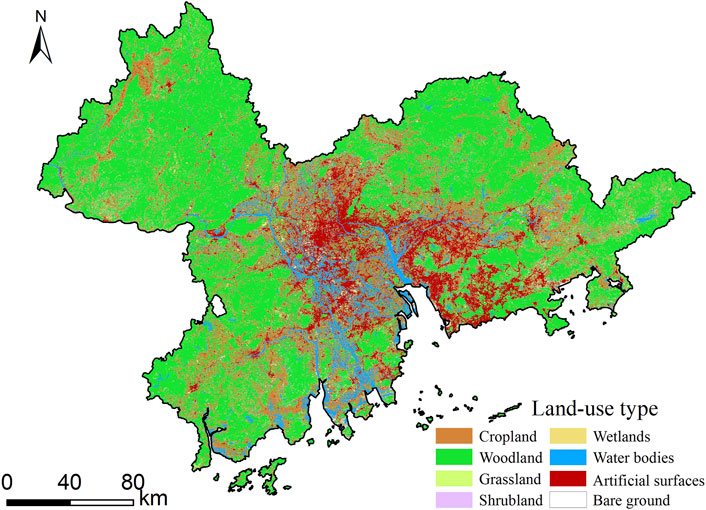
Figure 11. Land use type.
To obtain Table 4, the eight hazardousness evaluation indicators were categorized and processed. The more significant information contained in the assessment units reflects their greater hazardousness. The information capacity of each assessment unit in the study area was standardized to derive each assessment unit’s hazardousness indicators, and each assessment unit’s risk level was graded. Hazardousness classification was carried out in combination with the distribution density of disaster sites, and hazardousness zones of different grades were obtained by dividing them according to the principles of similarity and proximity.
According to relevant literature and Technical Requirements, four evaluation indicators, namely, population density, GDP density, building density, and road density, are utilized for vulnerability evaluation analysis (Tang et al., 2012; Jabareen, 2013) (Figures 12–15). Synthesizing the law of occurrence of geo-hazards, the degree of connection between each evaluation index and expert opinion, each evaluation index is graded, in which Ⅰ represents high vulnerability, Ⅱ represents medium vulnerability, and Ⅲ represents low vulnerability. The specific division is shown in Table 2.

Figure 12. Population density.
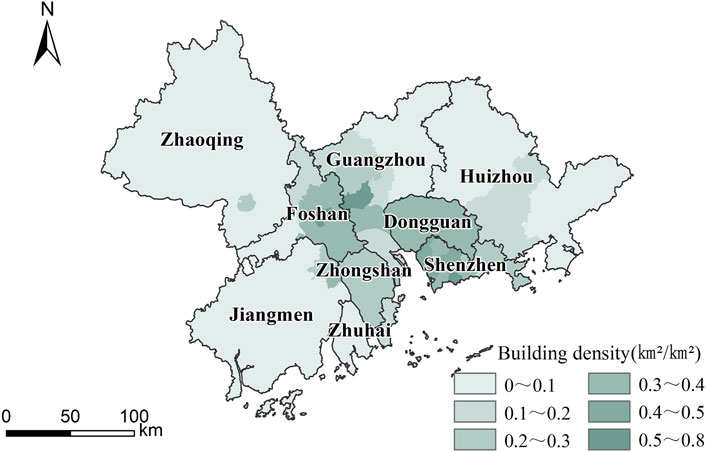
Figure 13. Building density.
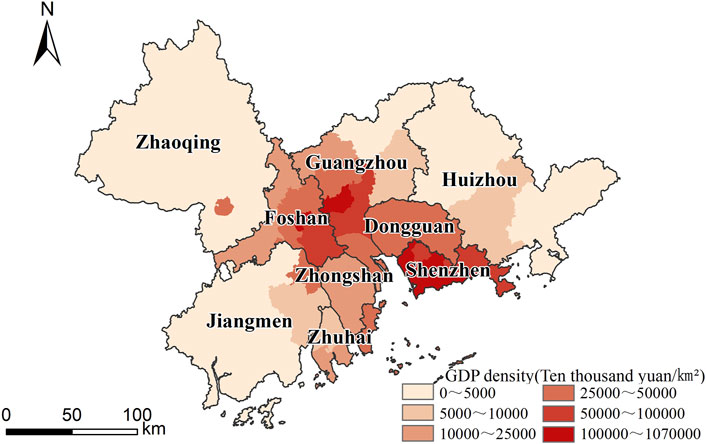
Figure 14. GDP density.
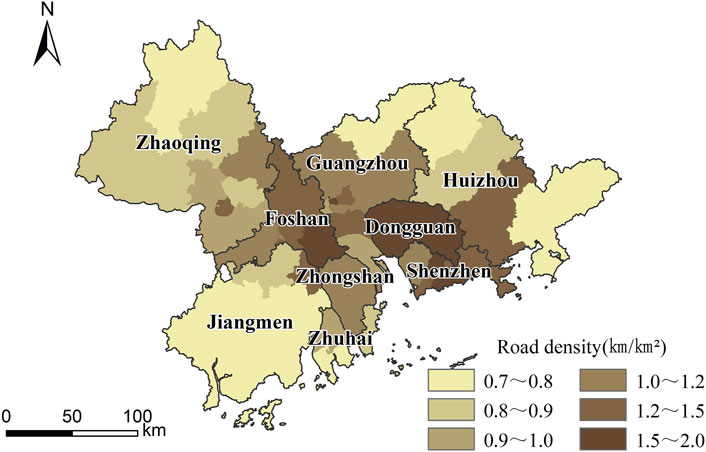
Figure 15. Road density.
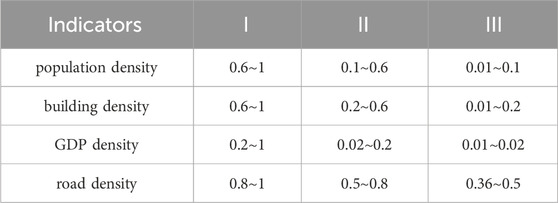
Table 2. Grading of vulnerability indicators.
Hierarchical analysis is a multifactor decision analysis method that favors qualitative analysis. It can effectively sort out multiple factors’ relationships and derive mathematical weights according to the model. It quantifies the decision maker’s empirical judgment and is more convenient to use when the structure of the target factors is complex and lacks the necessary data. Thus, it is widely used in practice (Chang and Jiang, 2007). Since the hierarchical analysis method is highly dependent on the experience of experts, there will inevitably be significant subjective errors, and the more objective informativeness method is introduced. The informativeness method is commonly used in the field of geohazard research. The basic idea is to fully use the powerful spatial graphics and attribute data management functions of GIS to realize the hierarchical management of geo-environmental data (Ruan and Huang, 2001; Li and Zhou, 2003). It grids the study area, and by simulating many samples, it discovers the latent laws and derives the importance of geo-hazard-causing factors to disasters. Specifically, the information value can be used to reflect the correlation between the influence factor and the relationship between geohazards by the size of the total information value (Wang et al., 2021). The present research mainly adopts the weighted informativeness method, i.e., combining the hierarchical and information methods to conduct the hazardousness analysis.
Grid cell size determination:
The amount of information for an indicator in a grid cell is determined:
The total amount of information on the occurrence of geohazards under the conditions of each combination of evaluation indicators is determined:
I is the total information of the evaluation unit, and n is the number of all evaluation indicators.
In calculating the amount of information in the assessment unit, the weighting model considers the weights of the assessment factors rather than a simple superposition of the amount of information of a single factor. The specific formula is as follows:
Gray correlation analysis is a method for quantitatively calculating the correlation between indices or between indices and the development trend of the system (Hu, 2022). The present research applies this method to evaluate the vulnerability of geohazards in the PRD. The analysis process is as follows:
Step 1: Classify each index into “gray categories”; each index corresponds to the “standard gray value” under each gray category. The sequence is composed of the p th indicator for the ith unit:
It is dimensionless, and the sequence obtained after processing is denoted as:
The reference sequence for the kth class (the standard value of the gray class) is:
Typically, the “reference sequence” consists of the median of the grayscale range. Obtained after dimensionless quantization:
In the second step, the correlation coefficients between each index in the i th cell and each gray criterion sequence are found. This is expressed as a correlation coefficient between the i th cell and the k th gray category:
Where ρ is the resolution factor, 0 ≤ ρ ≤ 1, and ρ = 0.5 was taken in this study.
The sequence of absolute deviations between each indicator in unit i and the k gray category is:
Step 3: Calculate the gray correlation of the ith unit with respect to the kth class of grays to get the gray correlation vector of the unit.
Step 4: Using the “principle of selecting the most important,” the “gray category” in which the unit under evaluation is located has been comprehensively categorized.
If
The present research adopts the risk matrix method for risk evaluation and risk zoning. Referring to the " Technical requirement for geo-hazard survey (1:50 000)"、 Technical specifications for the survey category of the National Comprehensive Natural Hazards Risk Census、 Description of the integrated risk assessment and zoning system, the risk equivalence judgment matrix is used to calculate the risk and vulnerability of geo-hazard by superimposing the risk and vulnerability by the “principle of the highest.” The risk of geohazards is shown in Table 3.
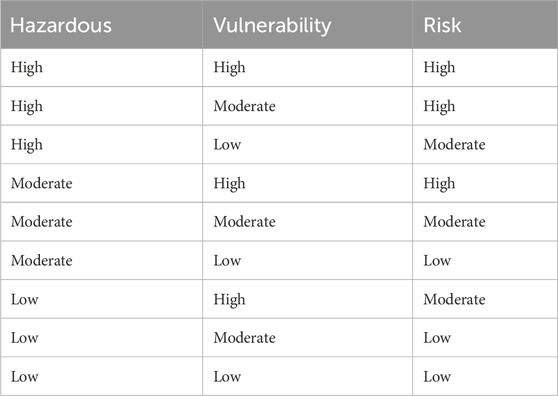
Table 3. Geo-hazard risk level judgment matrix.
The present research calculates the number of grids occupied by each subcategory of evaluation indicators, the number of hazardous points falling into them, and the total number of hazardous points using formulas (3) and (4), resulting in an information value table for each indicator subcategory (Table 4). Multiply the hierarchical analysis method indicators with the amount of information operation and get the weighted information value (Table 5) through the raster calculator for comprehensive analysis. This results in the distribution map of the hazardousness in the PRD under the weighted information model (Figure 16).
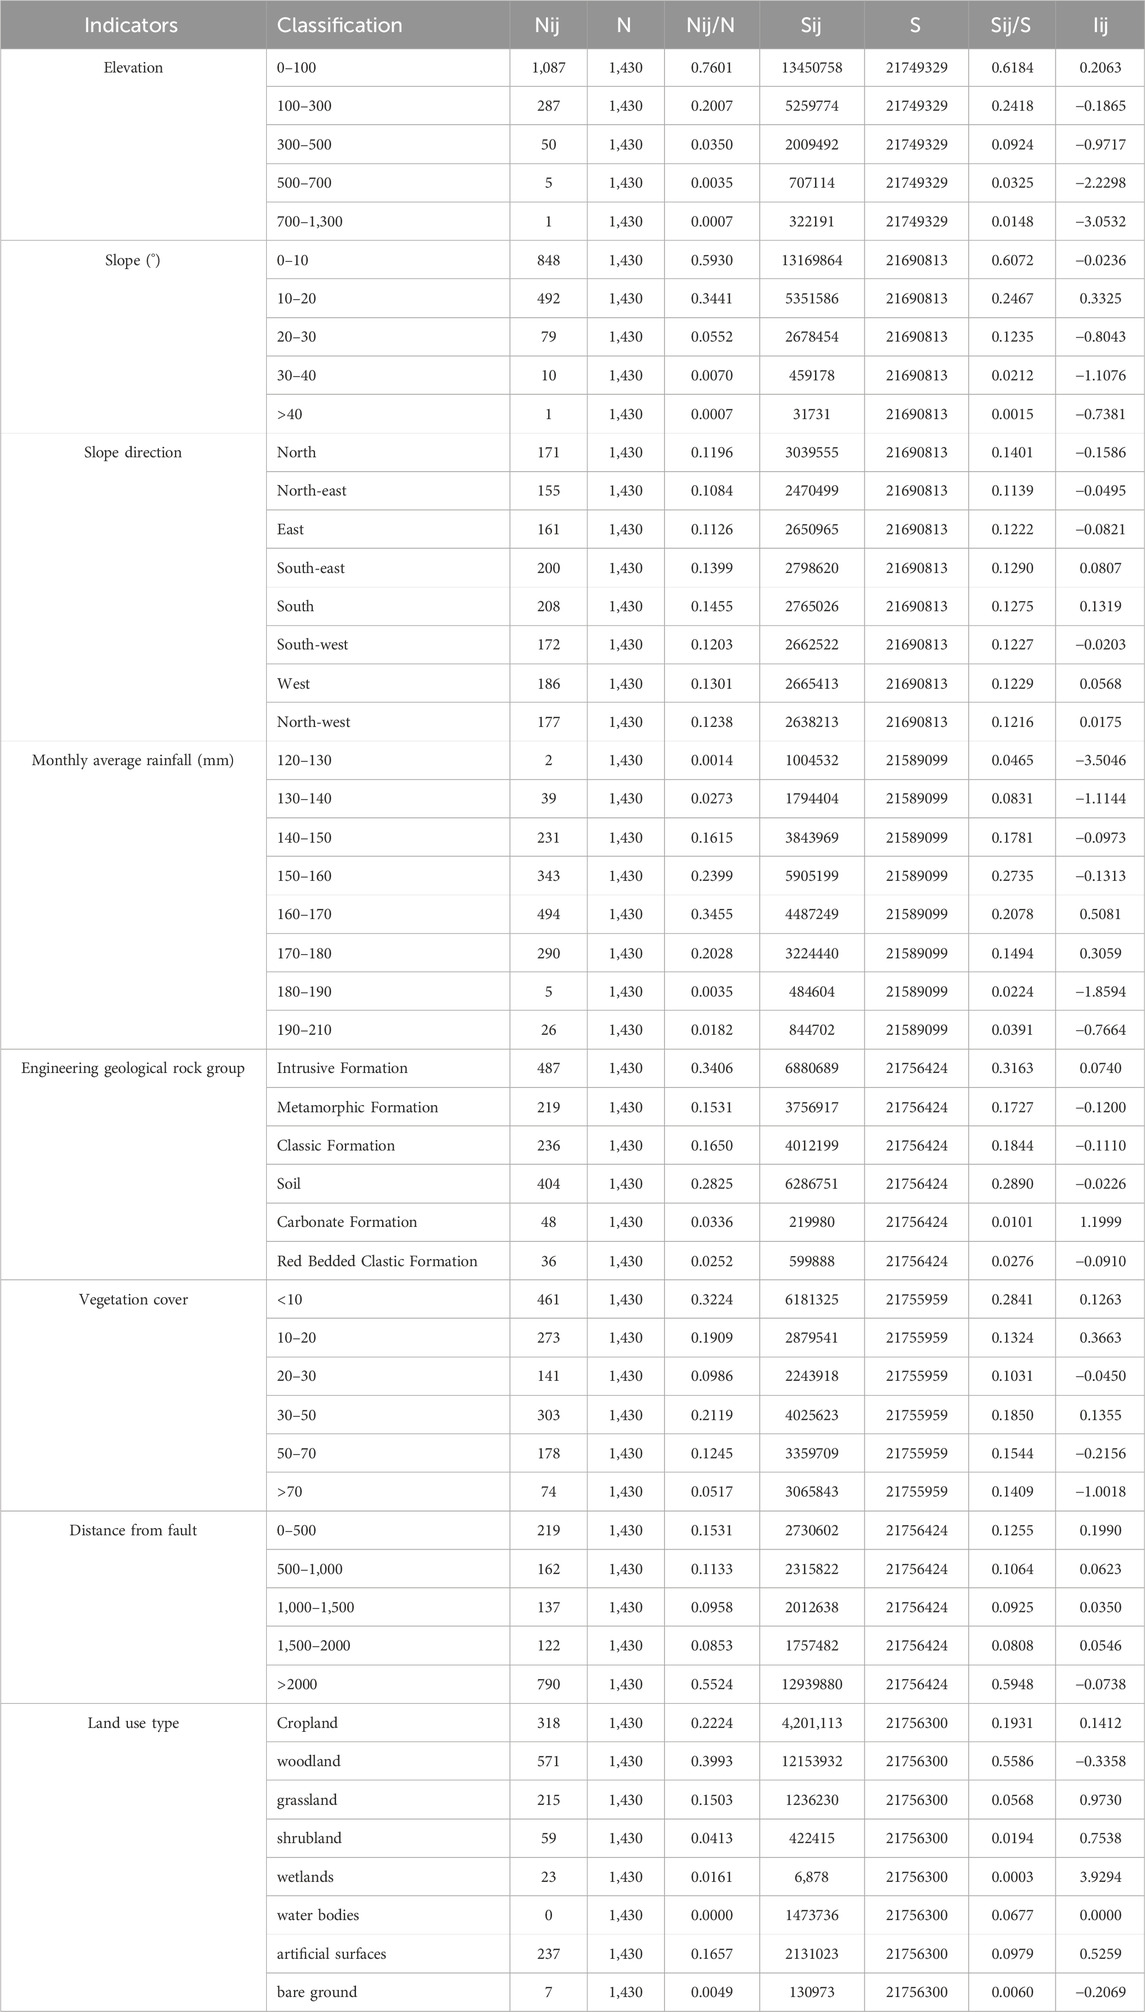
Table 4. Information value for each indicator subcategory.

Table 5. Scale of weighted informativeness.
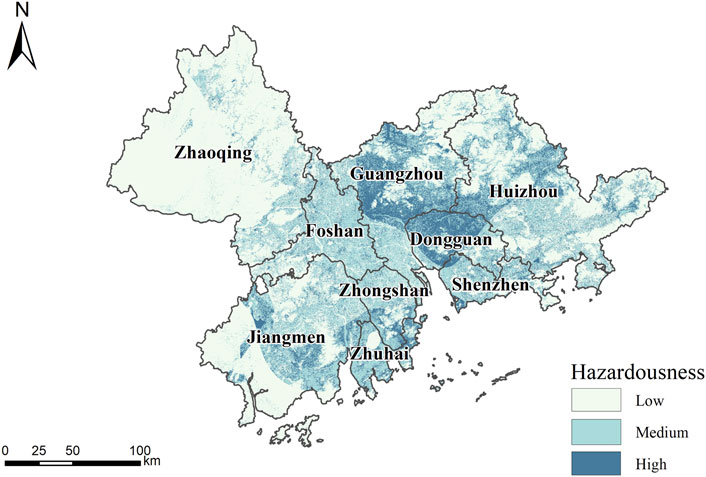
Figure 16. Hazardousness assessment of geo-hazard in the PRD.
As can be seen in Figure 16, the low-hazardousness zones of geological hazards in the PRD are mainly distributed in Zhaoqing City; the southwestern part of Enping City, the eastern part of Kaiping City, the southern and northern parts of Taishan City, Pengjiang District, Jianghai District, the northern part of Xinhui District in Jiangmen City; and the western part of Huicheng District and Huidong County, Huiyang District. The total area is about 28,579.79 km2, accounting for 52.92% of the total area of the region, and a total of 325 geological hazards have been identified, accounting for 22.73% of the total number of geological hazards in the region, among which there are 249 avalanches, 72 landslides, and four mudslides.
The medium-hazardousness areas are mainly located in Panyu District, northern Zengcheng District, and central Conghua District of Guangzhou City; most of Longmen County and northern Huicheng District in eastern Huidong County of Huizhou City; most of Shenzhen City; most of Foshan City; Doumen and Jinwan Districts of Zhuhai City; and central Taishan City of Jiangmen City. The total area is about 18,854.04 km2, accounting for 34.91% of the total area of the region, and a total of 689 slope-type geological hazards have been identified, accounting for 48.19% of the total number of geological hazards in the region, among which there are 570 avalanches, 116 landslides, and three mudslides.
The high-hazardousness areas are mainly located in Haizhu District, Tianhe District, Baiyun District, eastern Huadu District, western Conghua District, and southern Zengcheng District of Guangzhou City; most of Dongguan City; most of Boro County of Huizhou City; the southern part of Zhongshan City; Xiangzhou District of Zhuhai City; and the central part of Taishan City, the southern part of Xinhui City, and the western part of Kaiping City of Jiangmen City. The total area is about 6,572.26 km2, accounting for 12.17% of the total area of the region, and a total of 416 slope-type geological hazards have been identified, accounting for 29.09% of the total number of geological hazards in the region, among which there are 358 avalanches, 57 landslides, and one mudslide.
Geo-hazards are most significantly affected by rainfall factors. In the hazardousness assessment zones in the PRD region, the high-hazardousness areas tend to be rich in rainfall, and the boundaries of the zones of each risk level are also basically coincident with the trend of monthly rainfall. However, the slope orientation factor is not directly related to the occurrence of geo-hazards. After the study of geo-hazard risk in the PRD region by the information quantity method, the chances of occurrence of geo-hazards in each slope direction are the same, and the difference is not significant, ranging between 10% and 15%. Therefore, when conducting the subsequent evaluation work in the geology category, careful consideration should be given to whether the slope orientation factor should be included in the evaluation system. The notion that higher elevation corresponds to higher hazardousness of geo-hazards does not apply to the PRD region. Over 61.84% of the PRD region is less than 100 m above sea level, and most of the densely populated and economically developed areas are located in plains and hills. In contrast, most small, high-altitude regions are sparsely populated and have no impact on human beings.
Due to different measurement units and meanings of vulnerability evaluation indicators, it is necessary to normalize these data. Then, based on the midpoint positions of gray classes for each evaluation indicator, a reference sequence is constructed
Using the normalized results as a comparative sequence, the adjacency matrix (Table 6 and Annexure-1) is calculated by applying formula (12) to evaluate the relationship between evaluation indicators and reference sequences.
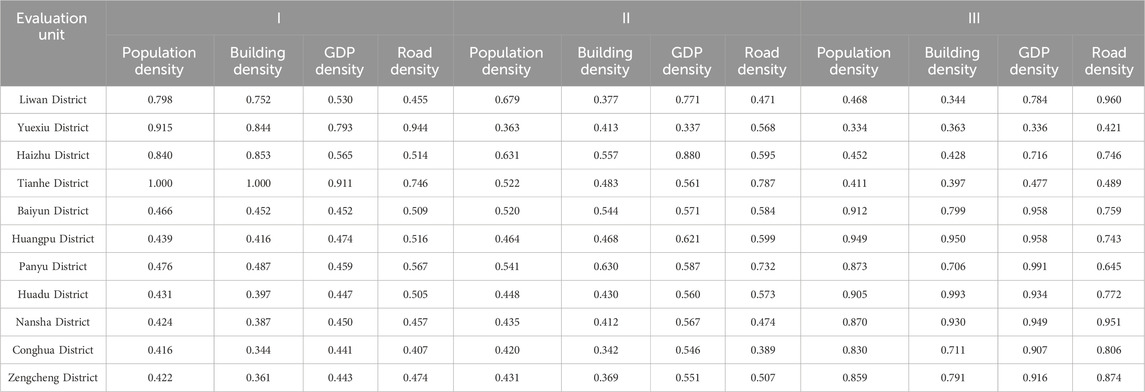
Table 6. Adjacency matrix (Main regions).
Then calculate the fit of this evaluation unit with the corresponding grade by correlation, choose the closest grade to be given (Table 2), and the evaluation grading results are shown in Table 7.
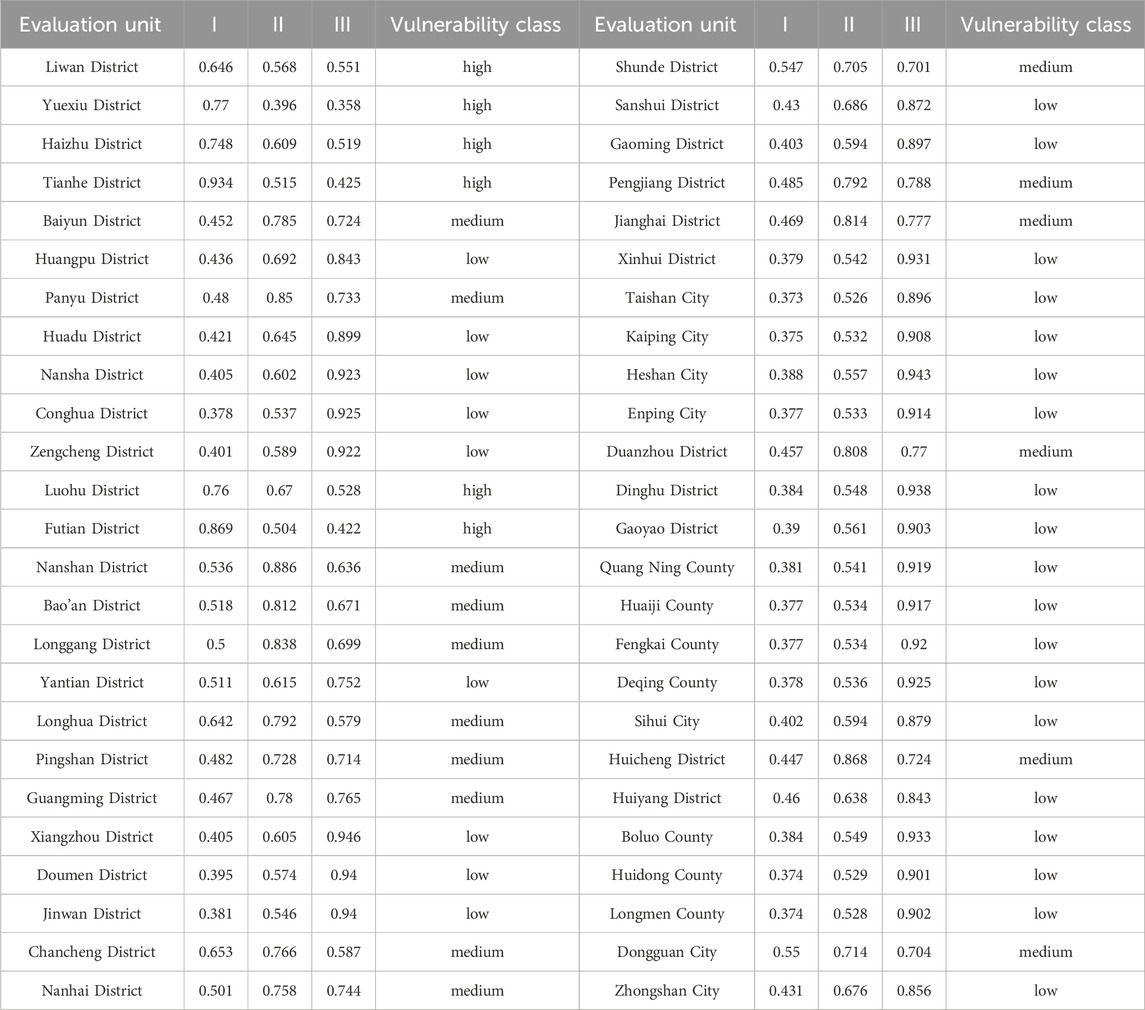
Table 7. Results of vulnerability evaluation grading.
Concerning the “Technical Requirements for 1:50,000 Geological Hazard Risk Survey and Evaluation”, the vulnerability of geo-hazard in the PRD was categorized into three grades, i.e., low, medium, and high. The vulnerability grades obtained from Table 6 were assigned to the evaluation units through GIS, and the PRD geohazard vulnerability evaluation was obtained after rasterization (Figure 17).
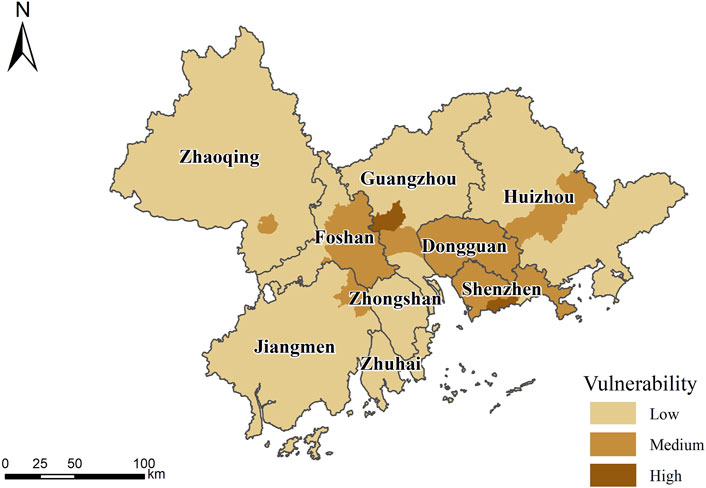
Figure 17. Vulnerability assessment of geo-hazard in the PRD.
As shown in Figure 17, the area of the low vulnerability zone is 45,106.24 km2, accounting for 82.93% of the total area. It contains 28 districts and counties, including Huangpu District, Huadu District, Nansha District, Conghua District, Zengcheng District, Yantian District, Xiangzhou District, Doumen District, and Jinwan District. The area of the middle vulnerable zone is 8,807.09 km2, accounting for 16.19% of the total area. It contains Baiyun District, Panyu District, Nanshan District, Bao’an District, Longgang District, Longhua District, Pingshan District, Guangming District, Chancheng District, Nanhai District, Shunde District, Pengjiang District, Jianghai District, Duanzhou District, Huicheng District, and Dongguan City. The highly vulnerable area is 477.7 km2, accounting for 0.88% of the total area. It contains six districts and counties, including Liwan District, Yuexiu District, Haizhu District, Tianhe District, Luohu District, and Futian District. These districts accounted for only 9.8% of the study area, but 21.44% of the GDP.
Overall, the vulnerability to geo-hazard in the PRD is closely related to the degree of economic development in the study area, with medium to high vulnerability mainly centered around Guangzhou, Shenzhen, and Dongguan, all economically developed areas in the PRD. Most of these areas are located at the entrance to the sea of the PRD, with flat terrain, a developed economy, and a large population. In contrast, the low-vulnerability areas lag far behind the medium-and high-vulnerability areas in terms of population density, GDP density, or infrastructure development. Nevertheless, the low-vulnerability regions account for the most significant proportion, reaching 82.93%, which is also caused by the area’s uneven development.
Finally, the risk assessment of geo-hazards in the PRD area was found by using the risk level judgment matrix to plot the hazardousness and vulnerability assessments (Figure 18).
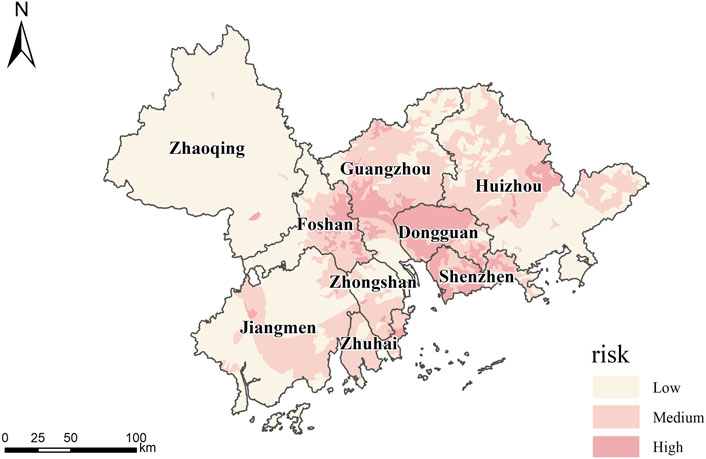
Figure 18. Geo-hazard risk zoning in the PRD.
The low-risk zone covers an area of 31,842.10 km2, accounting for 58.96% of the total area. It is mainly distributed in the northwestern part of the PRD, i.e., most of Zhaoqing City, Gaoming District and Sanshui District of Foshan City, Heshan City, Enping City, eastern Kaiping City, northern Xinhui City, southern and northern Taishan City of Jiangmen City, central Doumen District of Zhuhai City; northern Zhongshan City, Nansha District, western Huadu District, and northern Conghua District of Guangzhou City, and northwestern Longmen County, southwestern Huidong County and Huiyang District of Huizhou City. There are 427 hidden danger points, 323 avalanches, 100 landslides and four mudslides.
The area of the medium-risk zone is 16,871.65 km2, accounting for 31.24%. It is distributed in the eastern part of Panyu District, the northern part of Huangpu District, the northern part of Baiyun District, northern Huadu District, the southern part of Conghua City, and southern Zengcheng District in Guangzhou City; the eastern part of Dongguan City; the majority of Longmen County, most of Boro County, southern Huicheng District, and northern Huidong County in Huizhou City; the southern part of Zhongshan City; the majority of Zhuhai City; the central part of Taishan City, the western part of Kaiping City, Pengjiang District, and Jianghai District in Jiangmen City; the southern part of Shunde District in Foshan City; the southern part of Nanhai District and western Nanhai District in Foshan City. A total of 676 hazardous sites were identified, comprising 561 avalanches, 111 landslides, and four mudslides.
The high-risk area is 5,291.84 km2, accounting for only 9.8% of the study area. It is distributed in the western part of Dongguan City; the central part of Panyu District, Haiju District; Yuexiu District; Tianhe District; the southern part of Baiyun District; southern Huadu District and southern Huangpu District in Guangzhou City; most areas in Dongguan City; most regions in Shenzhen City; the northeastern part of Huicheng District in Huizhou City; and the central part of Xiangzhou District in Zhuhai City. There are 327 hazardous sites, 293 avalanches, 34 landslides, and no mudslides.
Combined with the geo-hazard risk zoning and the PRD geo-hazard environment, the following characteristics were identified:
(1) The northwestern part of the study area has a low risk for geological hazards.
The northwestern part of the study area, i.e., Zhaoqing City District, accounts for 27.40% of the total area, and the lithology is dominated by intrusive and metamorphic rocks mixed with a small amount of red-layered clastic rocks. The reasons for the low risk are high terrain, with the highest peak in the PRD, Qixingyan Peak, being more than 500 m above sea level; geo-hazards occur primarily in mountainous areas and will not affect normal human activities; and low population density, with an average of 4,638 people/km2 in the study area, while the northwestern part has only 613 people/km2. Hence, the low population density has little impact on the natural environment, resulting in a naturally small risk of geological disasters.
(2) The risk of geo-hazards in the PRD is high in the center and low in the surrounding areas, exhibiting a radial pattern.
The final risk zoning indicates high-risk areas in most parts of Guangzhou City, Dongguan City, and Shenzhen City, radiating outwards: Huizhou, Zhuhai, and Jiangmen have high-risk areas extending outwards from the central region, followed by Zhaoqing, Foshan, and other low-risk areas, aligning with this pattern. The causes are multi-faceted: the central terrain is low, while the surrounding terrain is high; flat areas are rich in water resources, facilitating population concentration; natural geo-hazards are more likely to affect human activities in these areas; and human activities destroy the original natural conditions, increasing the likelihood of disasters.
(3) The risk of geological disasters is directly related to the degree of economic development.
The risk of geo-hazards is determined by both hazardousness and vulnerability. Among the hazardousness study factors, vegetation cover and land use type are related to human activities. When natural disasters occur, the vulnerability survey examines the degree of human loss, and economically developed areas naturally concentrate the majority of the population, leading to a higher risk of geological disasters. However, more investment in disaster prevention and mitigation will be needed in economically developed areas. The high risk of geological disasters is based solely on the indicator factors in this study, excluding investment in disaster prevention and mitigation. Hence, economically developed areas seem to have a high disaster risk, but the actual risk will be lower with a robust early warning system and scientific investment in disaster prevention and mitigation.
Eventually, the present research added result verification to validate the rationality of this study, mainly by analyzing the number and density of hidden danger points in each risk zone. As shown in the Table 8, high-risk areas account for 9.80% of the total area, but they contain 22.87% of all hidden danger points, with a density of 0.06 per square kilometer; medium-risk areas account for 31.24% of the total area, but they contain 47.27% of all hidden danger points, with a density of 0.04 per square kilometer; low-risk areas account for 58.96% of the total area, but they only have 29.86% of all hidden danger points, with a density of 0.01 per square kilometer. From this we can see that this risk zoning is scientifically reasonable and consistent with the overall situation in PRD region, providing a certain basis and method guidance for geological hazard risk control and management, land spatial planning as well as resilient planning and construction in PRD.
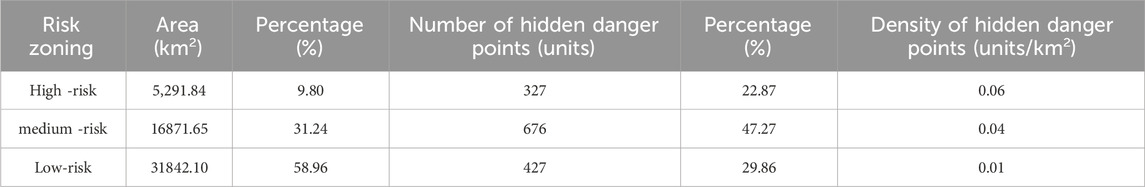
Table 8. Result verification.
The exploration of comprehensive disaster mitigation and prevention strategies for major geological disasters triggered by extreme weather events, along with the enhancement of scientific, technological and management skills in active disaster reduction, pose significant challenges for China’s geo-hazard prevention and control efforts. Meanwhile, the impact of neotectonics and seismic activity, climate change, population growth, urbanization, and the challenges associated with cross-regional comprehensive disaster prevention have been extensively investigated in macroeconomic research, significantly affecting the development of comprehensive geo-hazard reduction strategies in China. The aforementioned factors impact the macro research and development of geohazard mitigation in China.
Ensuring urban geosafety of PRD is paramount, given its significant economic and urban density. Establishing a robust early warning system is crucial for urban geosafety in PRD urban agglomeration. This system should be complemented by geohazard risk assessments and appropriate zoning measures. At the same time, the PRD urban agglomeration, characterized by high economic and urban density, is crucial in fostering sustainable development by enhancing its resilience and comprehensive disaster prevention capacity. While the present research assesses the hazardousness, vulnerability, and risk level of geo-hazard in urban agglomerations in the PRD, it is essential to note that the study exhibits certain shortcomings. Due to limitations in data acquisition, additional data related to the ecological environment, infrastructure, and socio-economics could be incorporated in the subsequent vulnerability assessment to enhance the analysis of results. The literature review in this research employs a combination of the risk matrix method, grey correlation, and weighted information method. Future studies should emphasize the comparative analysis of different methodologies. During the risk evaluation process, it is crucial to closely examine the interrelationships among various disaster risk factors and regional connections. Furthermore, investigating influencing factors and the impact of environmental changes on disaster processes and risk results is essential to develop more precise mitigation strategies. Future research endeavors should prioritize exploring strategies for preventing and controlling geo-hazard risks in the PRD region.
With the acceleration of urbanization and changes in extreme environmental events, geo-hazard risk evaluation has become a major topic for urban agglomerations seeking resilient development. Taking the PRD urban agglomeration as the study area and with the support of GIS, the present research firstly evaluates the hazardousness of eight evaluation factors, such as elevation, slope, slope direction, and land use type, by using the weighted informativeness approach. It then adopts the gray correlation method and evaluates the vulnerability based on the regional population density, building density, GDP density, and road density. Finally, an analysis of risk level and risk zoning was carried out. The main conclusions are as follows:
The hazardousness of geologic hazards in the PRD is predominantly low-risk and is located mainly in the Zhaoqing municipal district, the high-hazardousness areas of geological hazards are concentrated in the north, i.e., the area around Guangzhou, Dongguan and Huizhou. Rainfall factors have the most significant impact on the hazardousness of geologic disasters. Unlike traditional mountainous cities, over 61.84% of the PRD region is less than 100 m above sea level, while most of the densely populated and economically developed areas are clustered in the plains and hilly areas, so elevation is not a major influence on the hazardousness of geological hazards in the PRD region.
Substantial regional variations exist in terms of vulnerability. The high vulnerability area comprises only 9.8% of the study area, the low-vulnerability zones accounting for 82.93%, The degree of economic development has a greater impact on the vulnerability to geologic hazards. The medium- and high-vulnerability zones are situated at the sea entrance of the PRD, characterized by its flat terrain, economic prosperity, and dense population. In contrast, the low-vulnerability zones exhibit lower levels of development in terms of population density, GDP density, and infrastructure.
Large spatial differences in geohazard risks in the PRD. Conversely, the central zone of the area presents a heightened risk of geohazards, while the peripheral areas exhibit lower risks. These geohazard patterns are distinguished by a radial distribution. The northwestern region of the PRD exhibits a low susceptibility to geo-hazards, comprises 27.40% of the overall area. The causes of geologic hazards are diverse and interconnected. Factors contributing to these hazards include the low elevation of the central terrain, the elevated topography of the surrounding areas, the abundance of water resources in flat regions attracting human settlements, the increased vulnerability of human populations to geologic events, and the alteration of natural conditions due to human activities, which exacerbate the likelihood of disasters.
(1) Pay attention to the geologic disaster risk potential investigation and evaluation project aims to establish a comprehensive investigation and evaluation system. This initiative is designed to significantly improve the capacity to identify geologic disaster risks and potential hazards effectively. Meanwhile, enhancing geological survey protocols can facilitate timely evacuations, thereby mitigating risks to both lives and properties.
(2) To build a geologic disaster prevention and control management system ensures the success of the project and enhances the geologic disaster group policy and prevention system. Simultaneously, it has assumed the responsibility for the prevention and management of geo-hazards, enhanced source control, implemented dual-control measures for risks and potential hazards, and facilitated collaborative efforts to mitigate disasters. This system aims to establish a comprehensive and unified command and control system to coordinate disaster mitigation efforts.
(3) Strengthen the development of scientific and technological capabilities in geologic disaster management, and establishment of an innovative platform for geologic disaster risk prevention and control among universities, research institutes, and local governments. The collaboration aims to bolster scientific research and elevate the level of scientific and technological innovation in the field of geo-hazard prevention. The focus will be on addressing the challenges and obstacles encountered in preventing and controlling geo-hazard.
The original contributions presented in the study are included in the article/Supplementary material, further inquiries can be directed to the corresponding authors.
BT: Data curation, Funding acquisition, Methodology, Project administration, Writing–review and editing. HR: Conceptualization, Data curation, Investigation, Methodology, Software, Writing–original draft. J-aQ: Investigation, Methodology, Resources, Writing–review and editing. CM: Writing–review and editing. YC: Software, Writing–review and editing.
The author(s) declare that financial support was received for the research, authorship, and/or publication of this article. We are grateful for the financial support from project of the Teaching Reform Project of Guangzhou Xinhua College(2023KCJ001 and 2022J002); First-class Undergraduate Major of Guangzhou Xinhua College: Natural Geography and Resource Environment (2024YLZY011); Teaching Reform Project of Higher Education in Guangdong Province (2022J002-2); College students’ innovative entrepreneurial training program (202413902003); Guangdong Geological Hazard Risk Survey (1:250,000) Project (0835-220Z52802171); Guangdong Province Geological Disaster Emergency Response and Rescue Technology Capacity Enhancement Research Project (0809-2140GDC35071); Guangdong Province Major Emergency Geological Disasters Emergency Monitoring and Warning and Disposal Technology Research (2022025).
Author HR was employed by Guangdong Geological Engineering Company.
The remaining authors declare that the research was conducted in the absence of any commercial or financial relationships that could be construed as a potential conflict of interest.
All claims expressed in this article are solely those of the authors and do not necessarily represent those of their affiliated organizations, or those of the publisher, the editors and the reviewers. Any product that may be evaluated in this article, or claim that may be made by its manufacturer, is not guaranteed or endorsed by the publisher.
Amirzadeh, M., Sobhaninia, S., and Sharifi, A. (2022). Urban resilience: a vague or an evolutionary concept? Sustain. Cities Soc. 81, 103853. doi:10.1016/J.SCS.2022.103853
Biswajeet, P., and Saro, L. (2010). Delineation of landslide hazard areas on Penang Island, Malaysia, by using frequency ratio, logistic regression, and artificial neural network models. Environ. Earth Sci. 60 (5), 1037–1054. doi:10.1007/s12665-009-0245-8
Cai, X. Y., and Tie, Y. B. (2016). Progress of urban geological disaster vulnerability assessment in domestic. J. Catastrophology 31 (4), 200–204. doi:10.3969/j.issn.1000-811X.2016.04.036
Caleca, F., Tofani, V., Segoni, S., Raspini, F., Rosi, A., Natali, M., et al. (2022). A methodological approach of QRA for slow-moving landslides at a regional scale. Landslides 19 (7), 1539–1561. doi:10.1007/S10346-022-01875-X
Chang, J. E., and Jiang, T. L. (2007). Research on the weight of coefficient through analytic hierarchy process. J. wut Inf. Manag. Eng. 29 (1), 153–156. doi:10.3963/j.issn.1007-144X.2007.01.041
Corominas, J., van Westen, C., Frattini, P., Cascini, L., Malet, J. P., Fotopoulou, S., et al. (2014). Recommendations for the quantitative analysis of landslide risk. Bull. Eng. Geol. Environ. 73, 209–263. doi:10.1007/S10064-013-0538-8
Daniele, G., Guido, L., Oriol, M., and Dematteis, N. (2022). Remote sensing analysis of geologic hazards. Remote Sens. 14 (19), 4818. doi:10.3390/RS14194818
Dong, J., Liao, M., Xu, Q., Zhang, L., Tang, M., and Gong, J. (2018). Detection and displacement characterization of landslides using multi-temporal satellite SAR interferometry: a case study of Danba County in the Dadu River Basin. Eng. Geol. 240, 95–109. doi:10.1016/j.enggeo.2018.04.015
Fan, L. F., Hu, R. L., Zeng, F. C., Wang, S. S., and Zhang, X. Y. (2012). Application of weighted information value model to landslide susceptibility assessment——a case study of Enshi City, Hubei province. J. Eng. Geol. 20 (4), 508–513. doi:10.3969/j.issn.1004-9665.2012.04.005
Fang, C. L., and Wang, Y. (2015). A comprehensive assessment of urban vulnerability and its spatial differentiation in China. Acta Geogr. Sin. 70 (2), 234–247. doi:10.11821/dlxb201502005
Felipe, O., Marcos, M., and Gonzalo, Y. (2022). High-resolution deformation monitoring from DInSAR: implications for geohazards and ground stability in the metropolitan area of santiago, Chile. Remote Sens. 14 (23), 6115. doi:10.3390/RS14236115
Fell, R., Corominas, J., Bonnard, C., Cascini, L., Leroi, E., and Savage, W. Z. (2008). Guidelines for landslide susceptibility, hazard and risk zoning for land use planning. Eng. Geol. 102 (3-4), 99–111. doi:10.1016/j.enggeo.2008.03.014
Gómez, H., and Kavzoglu, T. (2004). Assessment of shallow landslide susceptibility using artificial neural networks in Jabonosa River Basin, Venezuela. Eng. Geol. 78 (1), 11–27. doi:10.1016/j.enggeo.2004.10.004
Hu, M. L. (2022). Review of applications of grey system theory in sustainable development research. J. Nanjing Univ. Aeronautics Astronautics Soc. Sci. 24 (4), 19–31. doi:10.16297/j.nuaass.202204003
Huang, R. Q., Xiang, X. Q., and Ju, N. P. (2004). Assessment of China’s regional geohazards: present situation and problems. Geol. Bull. China 23 (11), 1078–1082. doi:10.3969/j.issn.1671-2552.2004.11.005
Jabareen, Y. (2013). Planning the resilient city: concepts and strategies for coping with climate change and environmental risk with climate change and environmental risk. Cities .31 (2), 220–229. doi:10.1016/j.cities.2012.05.004
Ji, Y., Li, C., Gao, S., Chen, J., and Zheng, M. (2018). Risk assement of geological hazard of hancheng city in shaanxi province. J. Catastrophology 33 (3), 194–200. doi:10.3969/j.issn.1000-811X.2018.03.037
Khalid, A. M., and Ali, Y. (2019). Economic impact assessment of natural disaster with multi-criteria decision making for interdependent infrastructures. Environ. Dev. Sustain. 22 (8), 7287–7311. doi:10.1007/s10668-019-00499-x
Li, J., and Zhou, C. H. (2003). Appropriate grid size for terrain based landslide risk assessment in lantau island Hong Kong. J. Remote Sens. 7 (2), 86–93. doi:10.11834/jrs.20030202
Li, Y., Meng, H., Dong, Y., Hu, S. E., et al. (2004). Main Types and characterisitics of geo-hazard in China ———based on the results of geo-hazard survey in290counties. Chin. J. Geol. Hazard Control 15 (2), 32–37. doi:10.16031/j.cnki.issn.10038035.2004.02.005
Lu, Q. Z., Peng, J. B., and Zhao, F. S. (2003). An overview on the study of risk assessment of geological hazards. J. Catastrophology. 18 (4), 60–64. doi:10.3969/j.issn.1000-811X.2003.04.012
Ma, Z. J., and Mei, G. (2021). Deep learning for geological hazards analysis: data, models, applications, and opportunities. Earth-Science Rev. 223, 103858. doi:10.1016/J.EARSCIREV.2021.103858
Ma, X. F., Zhu, H. M., Zhang, Y. S., and Mao, Y. F. (2021). Study on the provincial risk assessment of geological disasters: a case of Zhejiang province. Zhejiang land Resour. (1), 57–65. doi:10.16724/j.cnki.cn33-1290/p.2021.s1.010
Ma, Y. S., Zhang, Y. C., Zhang, C. S., and Wang, J. S. (2004). Theory and approaches to the risk evaluation of geological hazards. J. geomechanics 10 (1), 7–18. doi:10.3969/j.issn.1006-6616.2004.01.002
Novellino, A., Cesarano, M., Cappelletti, P., Di Martire, D., Di Napoli, M., Ramondini, M., et al. (2021). Slow-moving landslide risk assessment combining Machine Learning and InSAR techniques. Catena 203, 105317. doi:10.1016/J.CATENA.2021.105317
Qi, X., Tang, C., Chen, Z. F., and Shao, C. S. (2012). Research of geohazards risk assessment. J. Nat. Disasters 21 (5), 33–40. doi:10.13577/j.jnd.2012.0506
Ruan, S. Y., and Huang, R. Q. (2001). Application of GIS-based information model on assessment of geological hazards risk. J. Chengdu Univ. Technol. 28 (1), 89–92. doi:10.3969/j.issn.1671-9727.2001.01.018
Segoni, S., and Caleca, F. (2021). Definition of environmental indicators for a fast estimation of landslide risk at national scale. Land 10 (6), 621. doi:10.3390/LAND10060621
Shi, J. S., Wu, S. R., Zhang, Y. S., and Wang, T. (2012). Integrated landslide mitigation strategies study for global change in China. Geol. Rev. 58 (02), 309–318. doi:10.16509/j.georeview.2012.02.018
Stevenson, P. C. (1997). An empirical method for the evaluation of relative landslip risk. Bull. Eng. Geol. Environ. 16 (1), 69–72. doi:10.1007/BF02591451
Tang, B., Liu, X. L., and Shang, Z. H. (2012). Vulnerability of urban disasters and its evaluation index. J. Catastrophology. 27 (4), 6–11. doi:10.3969/j.issn.1000-811X.2012.04.002
Tang, Y. D., Zhang, J. L., Yu, X., and Luo, R. R. (2023). A review of research on disaster indirect economic loss assessment. J. Nat. Disasters 32 (6), 1–11. doi:10.13577/j.jnd.2023.0601
Tian, F., Zhang, J., and Ran, Y.(2017). Hazard assessment and influence factors analysis of debris flow disaster in Hexi Corridor. J. Nat. disasters ,26(3):139–147. doi:10.13577/jjnd.2017.0317
Wang, J., Li, M. Y., and Wu, S. H. (2023). Theories and methodologies for assessing multi-hazard risk. World Reg. Stud. 32 (10), 100–109. doi:10.3969/j.issn.1004-9479.2023.10.2021659
Wang, L., Chang, M., and Xing, Y. L. (2021). Risk assessment of landslide geological hazards based on information method model and GIS. J. Geol. Hazards Environ. Preserv. 32 (2), 14–20. doi:10.3969/j.issn.1006-4362.2021.02.003
Xiang, X. Q., and Huang, R. Q. (2000). Risk assessment and risk management for slope geohazards. J. Geol. Hazards Environ. Preserv. 11 (1), 38–41. doi:10.3969/j.issn.1006-4362.2000.01.008
Xu, Q., Dong, X. J., and Li, W. L. (2019). Integrated space-air-ground early detection, monitoring, and warning system for potential catastrophic geohazards. Geomatics Inf. Sci. Wuhan Univ. 44 (07), 957–966. doi:10.13203/j.whugis20190088
Yi, L., Xian, J. H., Zheng, X. Z., et al. (2023). Spatiotemporal dynamics and anthropogenic drivers of geological hazard prevention efficiency in China. Cities 2023, 143. doi:10.1016/J.Cites.2023.104607
Yik, M., Pun, W. K., Kwok, F. H. C., Pho, J., and Ng, C. W. W. (2023). Perceptions of landslide risks and warnings in Hong Kong. Landslides 20 (6), 1211–1224. doi:10.1007/S10346-022-02021-3
Yu, C. J., and Liu, X. L. (2012). Assessment of hazardousness of collapses, landslides and debris flows in Guangdong. Trop. Geogr. 32 (4), 344–351. doi:10.13284/j.cnki.rddl.001639
Zhang, L., and Zhang, J. J. (2000). The theory and method of risk zonation of geo-hazar. J. Geol. Hazards Environ. Preserv. 11 (4), 323–328. doi:10.3969/j.issn.1006-4362.2000.04.011
Zhao, W. D., Chen, Y. Y., Hou, J., Chen, Y. H., Ji, B., and Ma, L. (2023). A regional early warning model of geological hazards based on big data of real-time rainfall. Nat. Hazards 116 (3), 3465–3480. doi:10.1007/S11069-023-05819-Z
Keywords: geo-hazard, vulnerability, risk, weighted informativeness method, PRD
Citation: Tang B, Ren H, Qiu J-a, Miao C and Chen Y (2024) Evaluation of geo-hazard risks in the pearl river delta based on geographic information system and weighted informativeness approach. Front. Environ. Sci. 12:1406386. doi: 10.3389/fenvs.2024.1406386
Received: 25 March 2024; Accepted: 16 May 2024;
Published: 27 June 2024.
Edited by:
Venkata Ravibabu MandlaReviewed by:
Nisha Rani, Geological Survey of India, IndiaCopyright © 2024 Tang, Ren, Qiu, Miao and Chen. This is an open-access article distributed under the terms of the Creative Commons Attribution License (CC BY). The use, distribution or reproduction in other forums is permitted, provided the original author(s) and the copyright owner(s) are credited and that the original publication in this journal is cited, in accordance with accepted academic practice. No use, distribution or reproduction is permitted which does not comply with these terms.
*Correspondence: Bo Tang, dGJhbGxlbjE5NkAxNjMuY29t; Jin-an Qiu, NDkxNTUzNzI0QHFxLmNvbQ==
Disclaimer: All claims expressed in this article are solely those of the authors and do not necessarily represent those of their affiliated organizations, or those of the publisher, the editors and the reviewers. Any product that may be evaluated in this article or claim that may be made by its manufacturer is not guaranteed or endorsed by the publisher.
Research integrity at Frontiers
Learn more about the work of our research integrity team to safeguard the quality of each article we publish.