 Lungile Senteni Sifundza1,2*
 John G. Murnane2
 Karen Daly1Luis Lopez-Sangil1Simon Leach1
 Patrick Tuohy3John Cardiff1
 Owen Fenton1
- 1Teagasc, Environmental Research Centre, Wexford, Ireland
- 2School of Engineering, University of Limerick, Limerick, Ireland
- 3Teagasc, Animal and Grassland Research and Innovation Centre, Cork, Ireland
The mobilisation and impact of roadway runoff on dairy farms has been established as a sub-component of the nutrient transfer continuum. It is acknowledged that fresh nutrient sources deposited on roadways dominate runoff and recent work has shown that available phosphorus (P) in roadway substrates is also an important source component. The objectives of this study were to understand spatial and temporal available P concentrations in roadway substrate (aggregate and soil mix) across dairy and beef farms during the open (February–October, when cows use the roadway network and fields) and closed (November–January, when cows were housed) periods and identify locations which could be considered critical source areas (CSA). For the study, roadway substrate samples were taken at 18 locations on each farm, across eight sampling periods, and were analysed for available P. Results showed that mean available P concentrations (Morgan’s P) in the sampling locations ranged from 15.9 to 101.4 mg L-1 for the Dairy Farm, from 4.1 to 59.4 mg L-1 for Beef Farm 1 and from 6.3 to 23.2 mg L-1 for Beef Farm 2. In open period, the results showed that mean available P concentrations were 75.4 ± 30.9, 14.9 ± 3.2 and 13.4 ± 2.5 mg L-1 for the Dairy Farm, Beef Farm 1 and Beef Farm 2, respectively. In closed period, the mean available P were 40.3 ± 17.2, 10.4 ± 1.0 and 9.8 ± 0.2 mg L-1 for Dairy Farm, Beef Farm 1 and Beef Farm 2, respectively. Overall, P concentrations on the Dairy Farm roadways was up to 4 times greater than that in the Beef Farms’ roadways. Compared to soils in adjacent fields, P concentrations in the Dairy and Beef Farms roadways was up-to 7 and 2 times higher, respectively. Critical roadway sections that required mitigation were two in the Dairy Farm, one in Beef Farm 1 and two in Beef Farm 2. In addition to fresh faeces and urine (i.e., dominant source of nutrients in farm roadways), this study showed that nutrient enriched roadway materials are a labile P source. Thus, future mitigation of roadway runoff must consider all roadway nutrient sources, including livestock fresh excreta as well as used roadway surface materials.
1 Introduction
On poorly draining soils, phosphorus (P) sources can become mobilised during and shortly after rainfall along different surface-or-near-surface runoff pathways (Sharpley et al., 2001; Adams et al., 2020; Ezzati et al., 2020) and if unimpeded, can discharge to fresh water systems with negative environmental impacts (Adams et al., 2014; Mellander et al., 2022; McDowell et al., 2023). Excess P to freshwater causes eutrophication, increasing algal bloom and other aquatic plants resulting in reduced dissolved oxygen required by aquatic ecosystem (Smith et al., 1999; Jarvie et al., 2013; Cassidy et al., 2017). To mitigate the environmental challenges presented by P mobilisation, many international, regional and local policies and legislation for agricultural nutrient management have been developed and continue to be modified and implemented at farm level (Vadas et al., 2018). For instance, as part of the European Union Water Framework Directive (EU WFD) (2000/60/EC), all waterbodies must achieve at least good water quality status by certain reporting periods. For agriculture, the Nitrates Directive (91/676/EEC) aims to protect water quality from pollution by agricultural sources and to promote the use of good farming practice. All EU Member States are required to prepare a National Nitrates Action Programme (NAP) that outlines the rules for the management and application of livestock manures and other fertilisers on farms. For example, in the Nitrates Directive (S.I No. 605 of 2017) in Ireland, a rule from 1st January 2021 states that roadway runoff cannot enter waters on all farms. These regulations apply year-round (i.e., open period when animals are outside for up to 12 h a day and closed periods when they are housed). Presently, Nitrates Derogation allows farmers to exceed the limit of 170 kg of livestock manure nitrogen per hectare set down in the Nitrates Regulations, up to a maximum of 220 kg or 250 kg per hectare, subject to adherence to stricter rules that aim to protect water quality.
Internal roadways on dairy farms were established as a sub-component of the nutrient transfer continuum by Fenton et al. (2022) with distinct source-pathway-mobilisation and impact components. The study showed that surface substrate materials of roadways were identified as a P source component. In Ireland, roadway surface materials are a composite of locally sourced crushed stone aggregate (negligible P concentration) and soil from neighbouring fields where animals graze (Fenton et al., 2021). The nutrient content in the surface material is a product of the fertilised soil and animal deposits (dung pats and urine) that fall onto the roadway surface during animal movement to and from the milking parlour to grazing fields (Hubbard et al., 2004; Phillips et al., 2013). Fenton et al. (2022) examined the spatial P distribution of farm roadway material on a dairy farm in the south-east of Ireland and measured concentrations, up to 14 times greater than the highest index four threshold of 8.0 mg Morgan’s P L-1 (available P) for grassland soils. In Ireland, the P index system is used as guide to application of fertiliser P for grasslands and other crops and classifies soil available P from ‘very low’ (soil index 1, good crop response potential to P application) to ‘sufficient/excess’ (soil index 4, no crop response potential to P application) (Dunne et al., 2021). On the dairy farm, Fenton et al. (2022) showed direct connectivity between available P on the roadway surface and waters, identifying three distinct critical source areas (CSA).
Within agriculture in Ireland, pastoral agricultural systems are the main contributors to surface water degradation (EPA, 2020; Maher et al., 2023). Moreover, 12% of agriculture-related ammonia emission in Ireland is from livestock production through dung and urine deposits (Fischer et al., 2016). However, dairy and beef farming are the most practised (approx. 7.3 million cattle) and profitable pastoral farming systems (Central-Statistics-Office, 2020). For example, beef farming alone contributes to over 25% of total agricultural output in Ireland, which is among the top 10 beef exporters globally (Teagasc, 2023). Dairy and beef pastoral systems have succeeded because of the temperate climate, which allows growing of grass for a longer season (Maher et al., 2023). Phosphorus concentrations within internal roadways could vary spatially and temporally, depending on farm typology. For example, in dairying, the farm roadways are generally intensively used during the milking season (twice a day), especially near the farmyard and the milking parlour (McDowell et al., 2020b). Whereas in beef farms, farm roadways are used more sporadically (Teagasc, 2020b). Furthermore, Fenton et al. (2021) highlighted future research should investigate the spatial and temporal distribution of P deposited on roadways during the open (February to September) and closed periods (hydrologically active period from October to January), when animals graze and are housed, respectively on beef and dairy systems.
The objective of the present roadway surface material study was to: 1) compare and contrast spatial and temporal available P concentrations across a dairy farm and two beef farms during the open (February—October) and closed (November—January) periods and 2) discuss which locations could be considered CSA’s, where connectivity between the source and waters needed to be broken. For this study, roadway material samples were taken at 18 locations on each farm, across eight sampling periods covering open periods, when animals were using the roadway network and fields, and closed periods when animals were housed, and the roadways were not being used. Visual examinations at each location established if a CSA existed across the sampling locations and for those established as such, mitigation actions are discussed.
2 Materials and methods
2.1 Study farms
The study was conducted on three adjacent farms located at Johnstown Castle, Wexford, in the southeast of the Republic of Ireland (Figure 1). The Johnstown catchment receives an annual average rainfall of about 1,100 mm and comprises a high intensity grass-based dairy farm (Dairy Farm) and two low intensity beef farms (Beef Farm 1 and Beef Farm 2), whose characteristics are summarised in Table 1. While soil type is variable across the farms exhibiting well, moderate, and poor drainage, the internal farm roadway networks are extensive (Table 1). In poorly draining soils, artificial drainage systems consisting of underground tile drains and open surface ditches have been installed, providing connectivity to waters in some areas (Clagnan et al., 2019). The farm roadway network, the stream network and roadway material sampling locations for each of the three farms are presented in Figure 2.
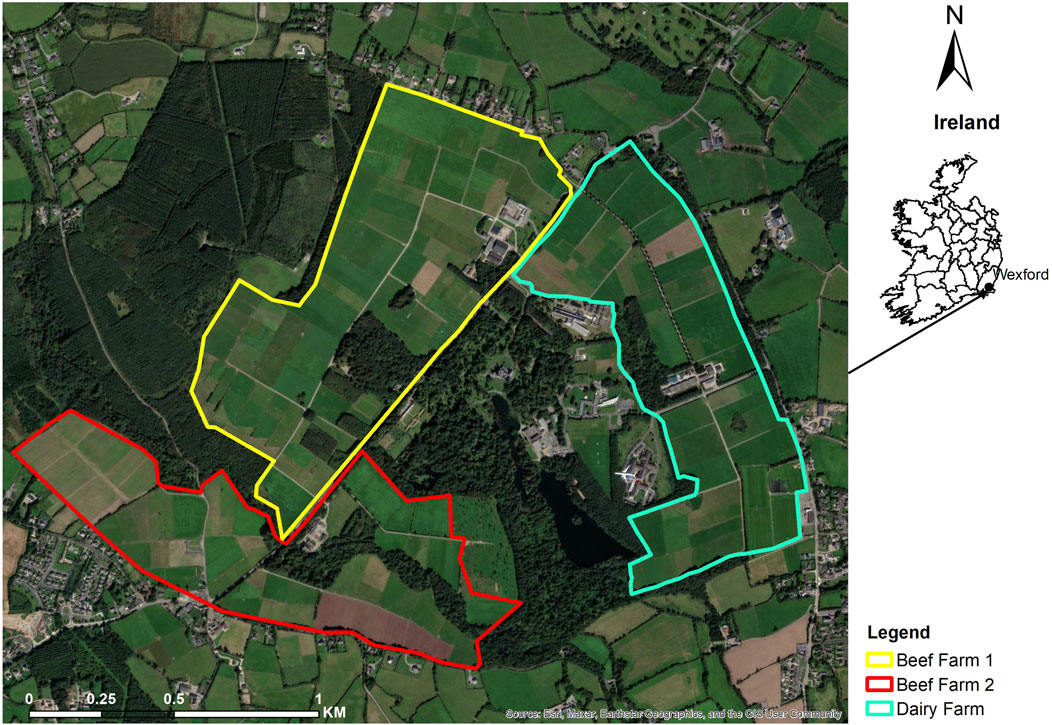
Figure 1. Location of the three study farms in Ireland (Wexford) within the Johnstown Castle Estate.
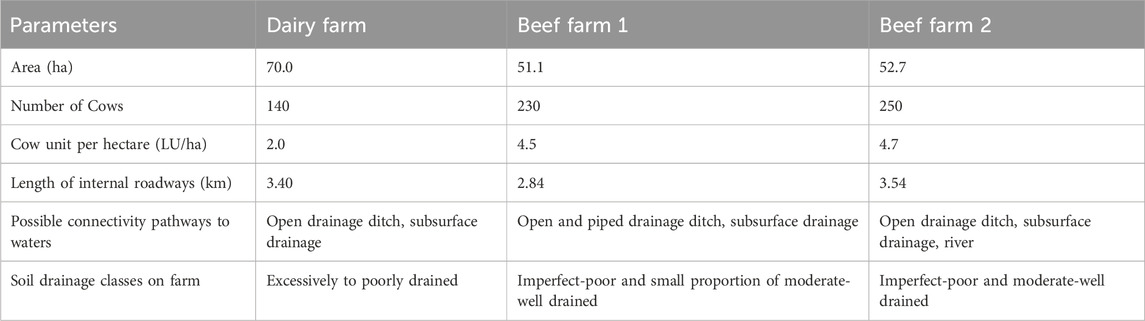
Table 1. Farm characteristics used in the present study. LU/ha is livestock units per hectare.
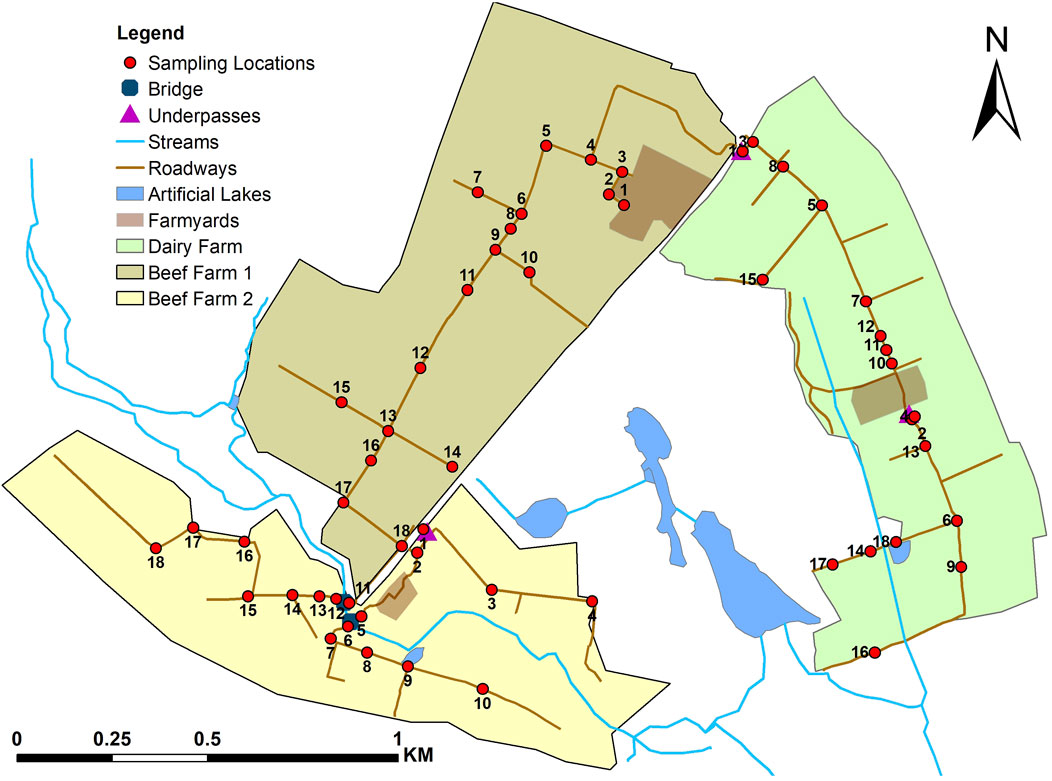
Figure 2. Internal farm roadway network, location of bridges across streams (n = 2), underpasses under public roadways (n = 3), surface water streams, artificial lakes, and farmyards (n = 3). Red dots represent roadway material sampling locations for the three study farms.
2.2 Farm roadway sampling
Samples of roadway material were collected as described by Fenton et al. (2022) from farm roadways at 18 locations on each farm (Figure 2). It is important to note that the roadway material that was collected did not incorporate fresh faecal material, therefore contaminated areas with fresh excreta material from cows were avoided. Sampling locations on each farm were selected based on the usage and the potential of the roadway section to be a hotspot for cow excreta. At each sampling location, two roadway material samples were randomly taken from the surface of the roadway (i.e., substrate taken to a maximum depth of 1 cm) using a scoop and/or spade if roadway material was consolidated. The roadway material samples were placed in labelled sample bags and transported directly to the soil laboratory for analysis. As a control, fresh unused roadway material (limestone chipping), which was stock-piled in storage on the farm, was sampled and analysed. To compare roadway available P material concentrations at certain locations to the adjacent fields, soil sampling records for every field to inform nutrient management planning were used.
Detailed information and representative photographs of each sampling location for each farm is shown on Table 2; Figure 3 for Dairy Farm, Table 3; Figure 4 for Beef Farm 1 and Table 4; Figure 5 for Beef Farm 2. In all three farms, sampling was done between September 2022 and October 2023 for the Dairy Farm, and November 2022 and October 2023 for the two Beef Farms (Table 5). The months of November, December and January were sampled to represent the closed period and the months of March, May, September and October were sampled to represent the open period of the year.
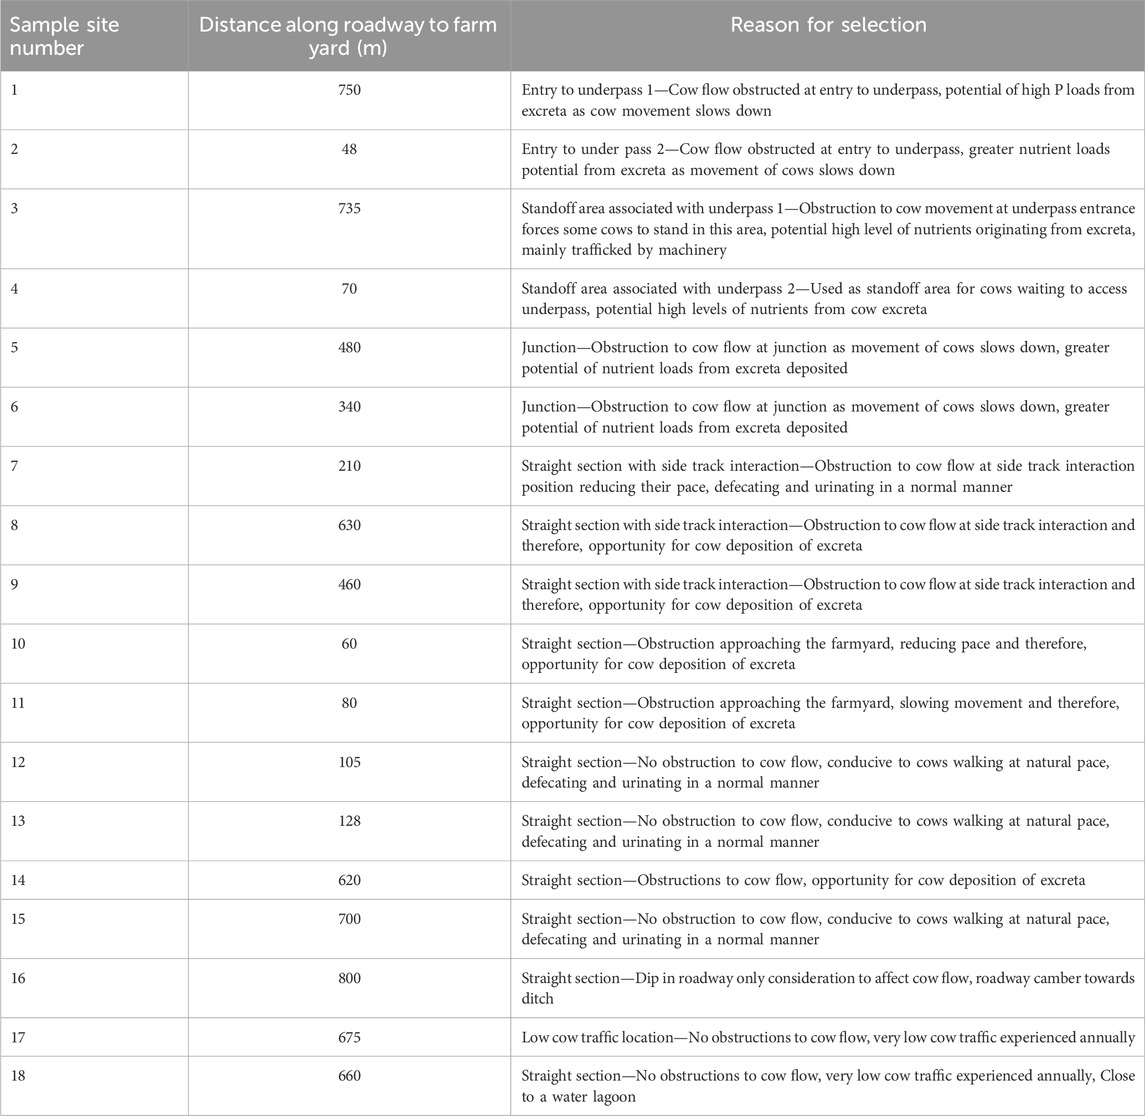
Table 2. Roadway sampling locations on the Dairy Farm with description of sampling sites, distance from farm yard, roadway gradient and width description and reason for selection (adapted from Fenton et al. (2022) with new location 18).
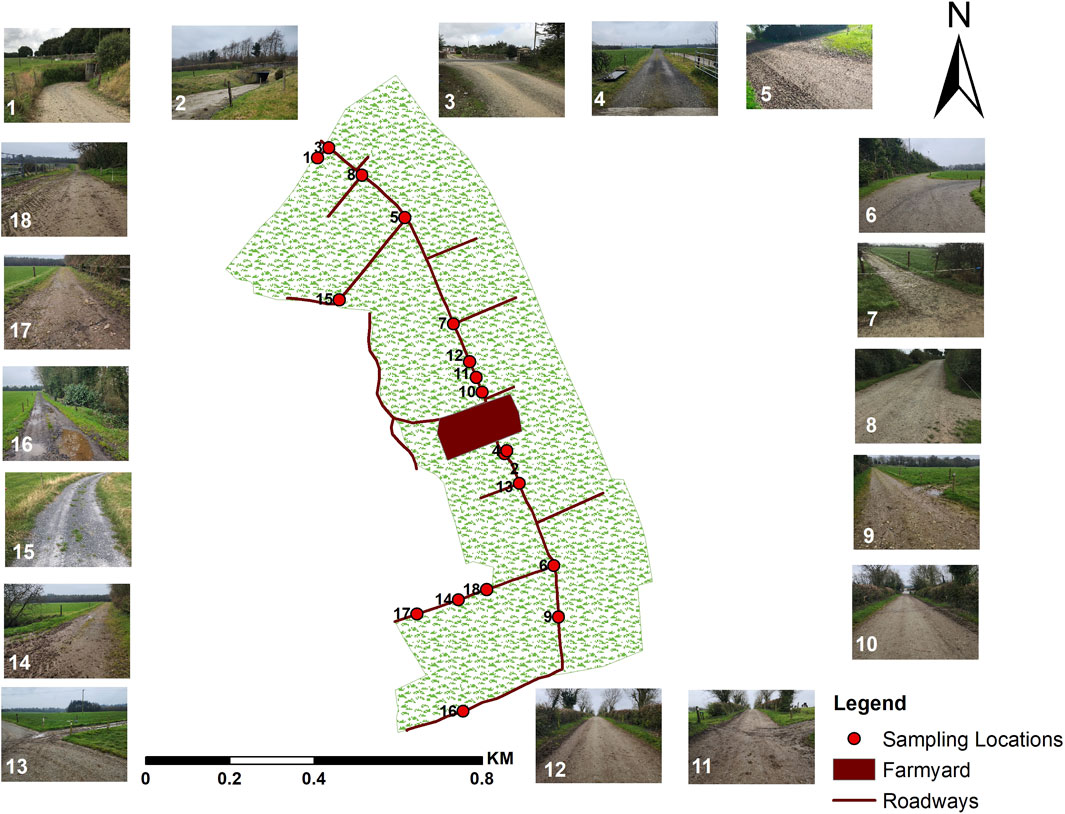
Figure 3. Roadway network of the Dairy Farm and sampling locations with representative photographs. Table 3 contains location details.
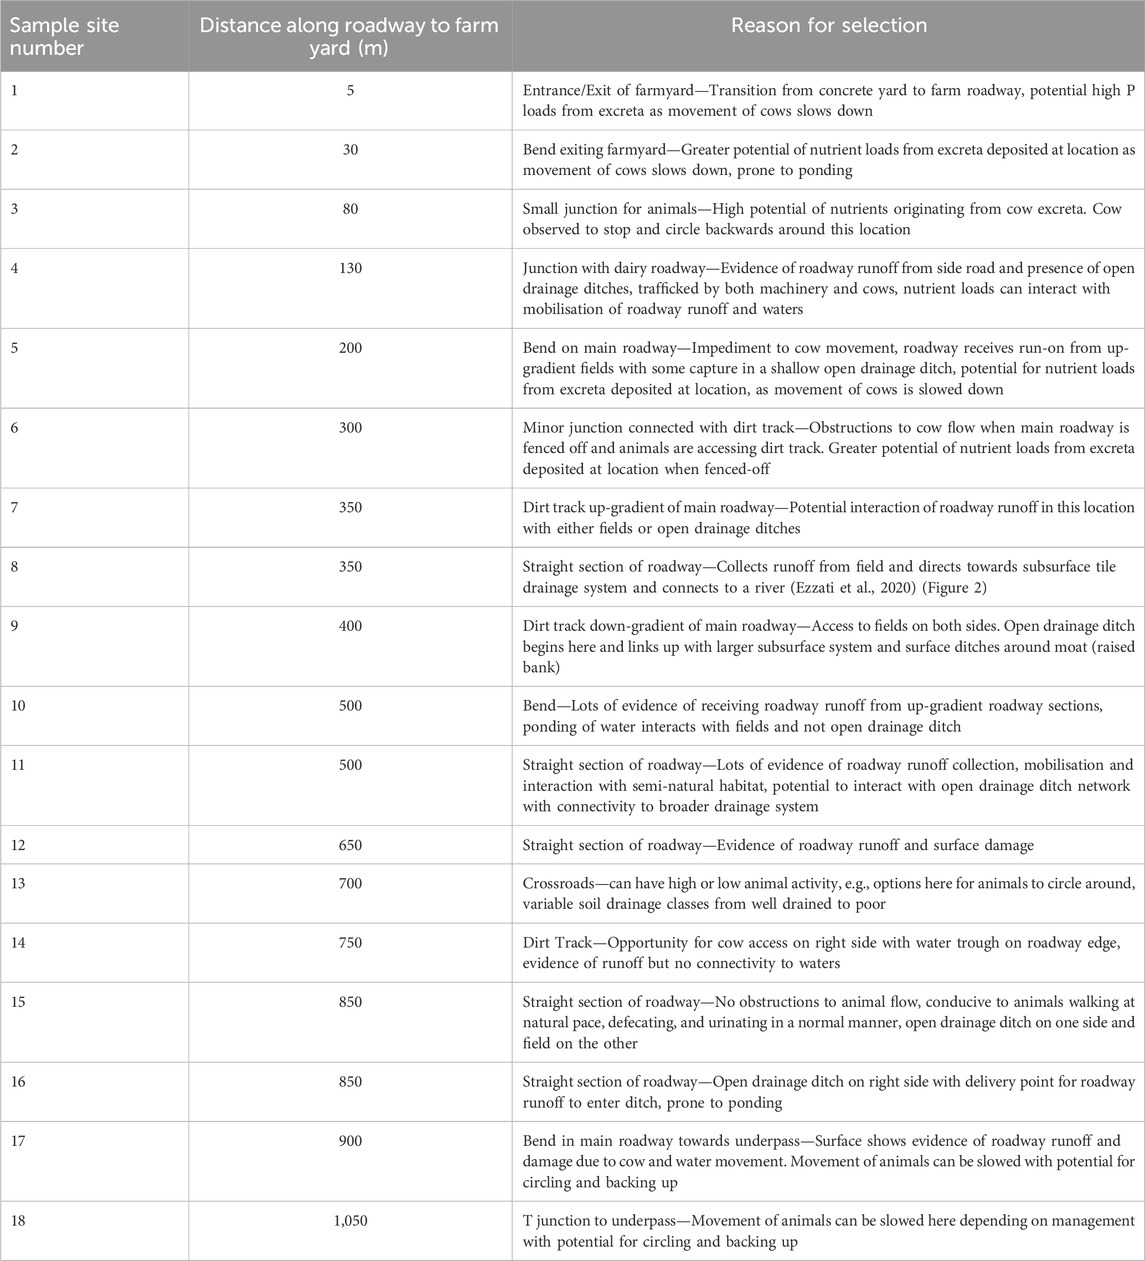
Table 3. Roadway sampling locations on the Beef Farm 1 with description of sampling sites, distance from farmyard, gradient and width description and reason for selection.
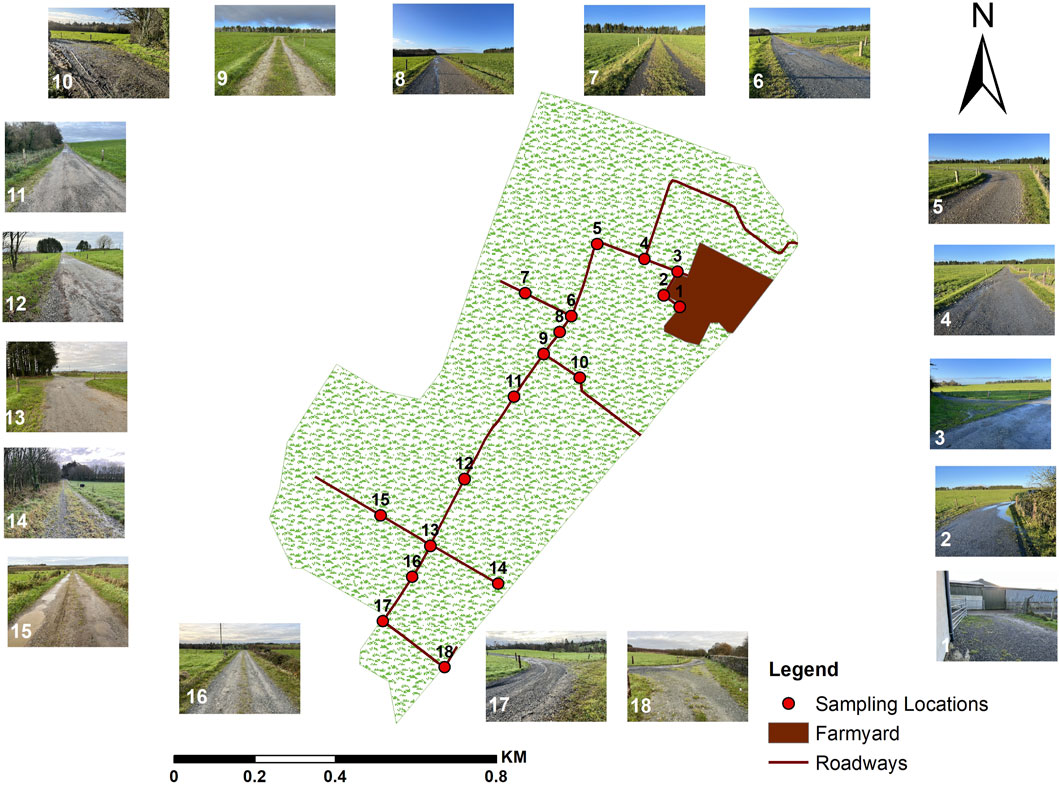
Figure 4. Roadway network of the Beef Farm 1 and sampling locations with representative photographs. Table 4 contains location details.
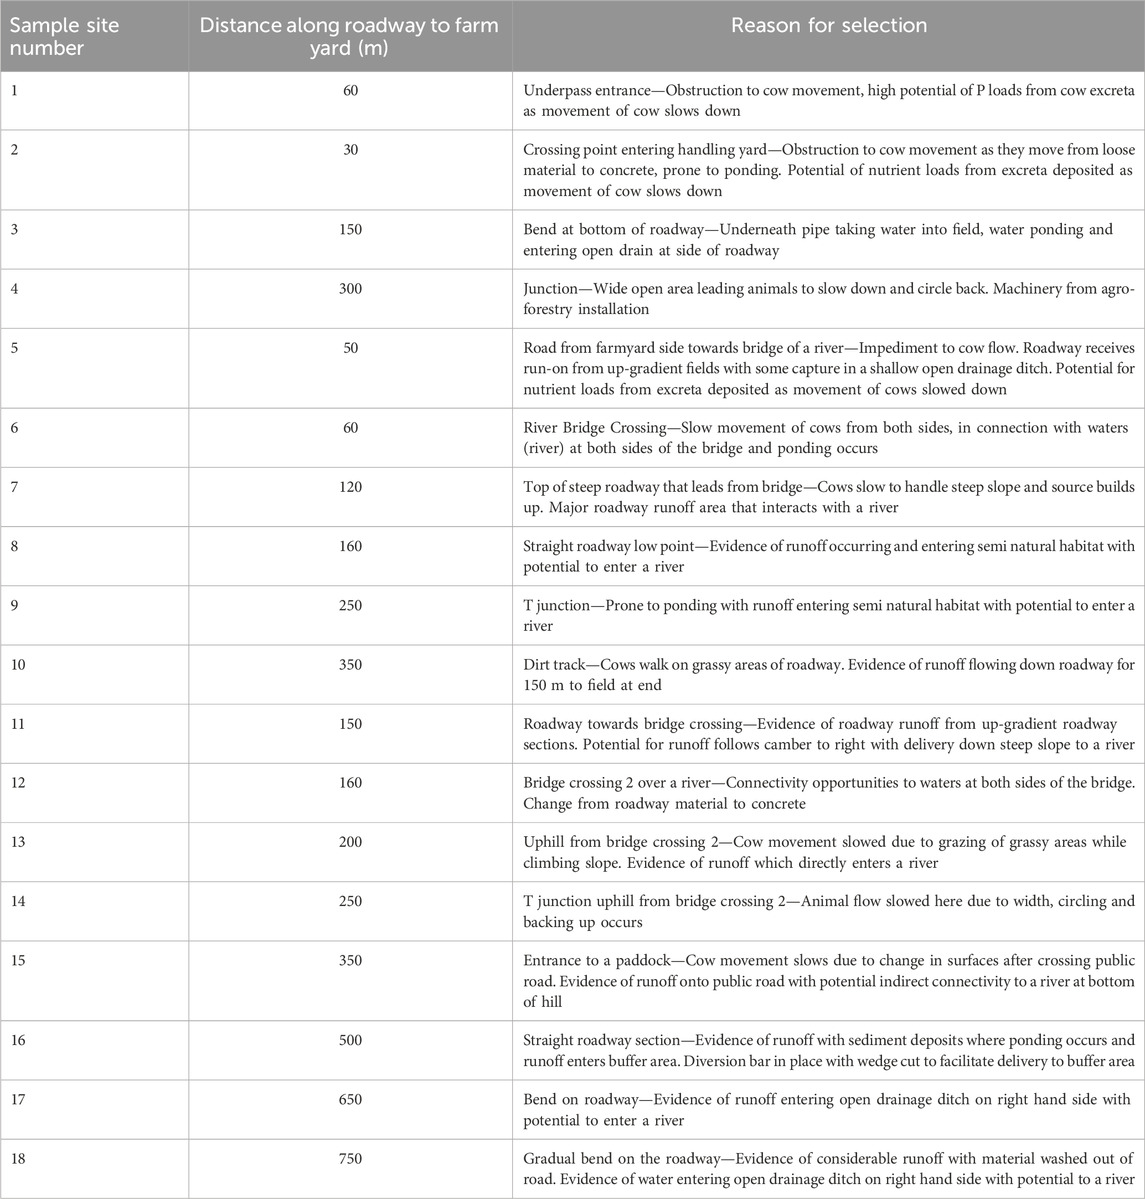
Table 4. Roadway material sampling locations on the Beef Farm 2 with description of sampling sites, distance from farm yard, gradient and width description and reason for selection.
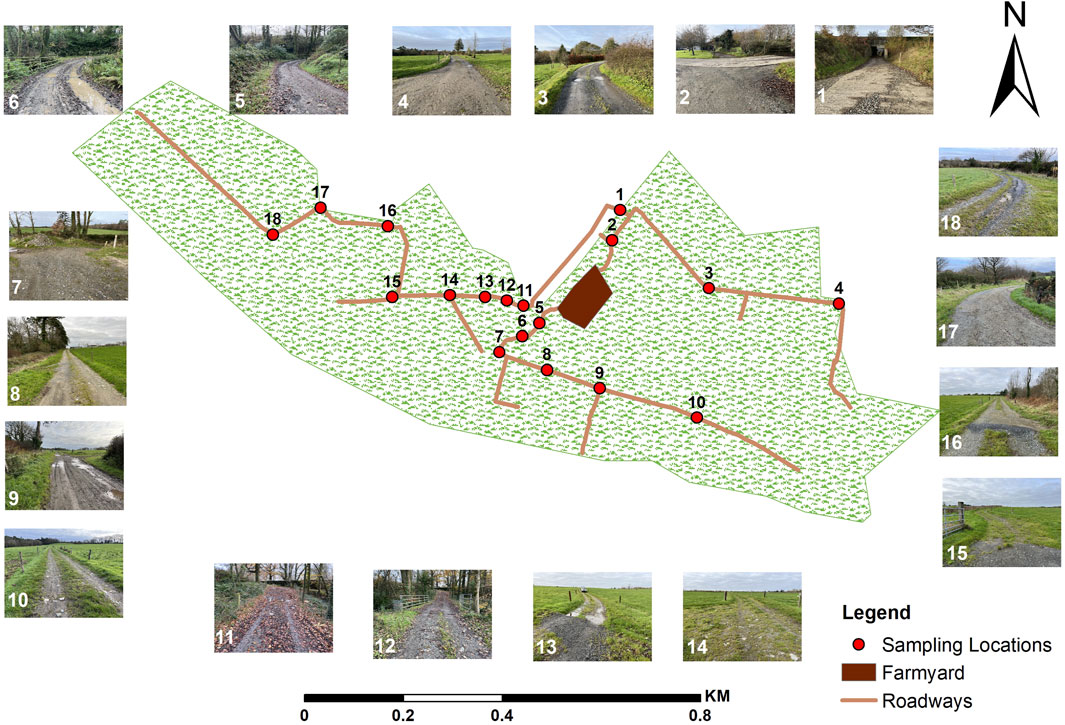
Figure 5. Roadway network in the Beef Farm 2 with representative photographs of the sampling locations. Table 5 contains location details.
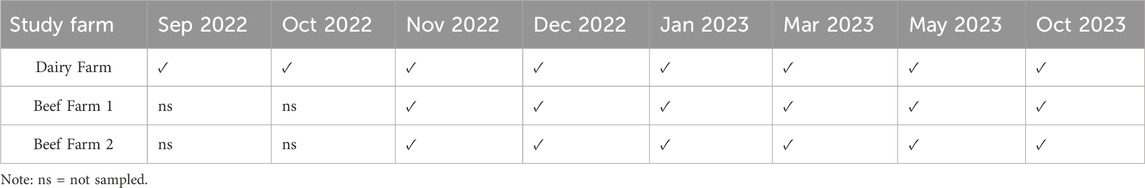
Table 5. Sampling period for 18 locations on each of the three study farms.
2.3 Laboratory analyses
All collected roadway material samples were oven dried at 40°C, sieved through 2 mm sieve to remove debris and stored at room temperature before analysis. Morgan’s extraction solution, composed of sodium acetate and acetic acid reagent buffered at pH 4.8, was used to determine available P. Three-millilitre volume (3 mL) of farm roadway substrates samples were shaken for 30 min at room temperature with 15 mL Morgan’s solution (ratio of 1:5) and then filtered (Morgan, 1941). The filtrates were then analysed for P concentration using the principle of flow injection analysis on the Lachat QuickChem 8,500 series continuous flow analyser.
2.4 Data analysis
All results generated in this study were analysed using Minitab v17 and GraphPad Prism v 9.1.0 statistical software for spatial and temporal distribution of roadway material nutrient status between farms, and for correlations and differences. Analysis of Variance (ANOVA) was used to identify significant differences in the P concentrations between the sampling locations and periods sampled at a significance level p < 0.05. The Pearson correlation analysis was also used to determine if there is any relationship between the P concentrations and rainfall in the study area.
3 Results
3.1 Roadway material pH
The mean pH of the roadway material was 7.56 ± 0.30, 7.89 ± 0.43 and 7.71 ± 0.49 for the Dairy Farm, Beef Farm 1 and Beef Farm 2, respectively. This was slightly lower than the mean pH (8.76) of the fresh road surface stone aggregate that was used to construct the roadways. Mean pH of the field soils adjacent to the roadways in 2023 were 6.2 ± 0.28, 6.3 ± 0.35 and 6.4 ± 0.27 in the Dairy Farm, Beef Farm 1 and Beef Farm 2, respectively. The target pH for grassland fields is 6.2, to optimise grass yields and minimise nutrient losses as low pH makes P less available by binding with aluminium or iron compounds while high pH levels tend to precipitate phosphate with calcium (Teagasc, 2020a).
3.2 Spatial patterns of available P
The mean values of the available P concentrations measured on 18 sampling locations in each farm are presented in Table 6. The overall trend indicates that the Dairy Farm had the highest mean spatial concentration of available P, while the P concentrations for the beef farms were comparable with each other, except for L1 on Beef Farm 1.
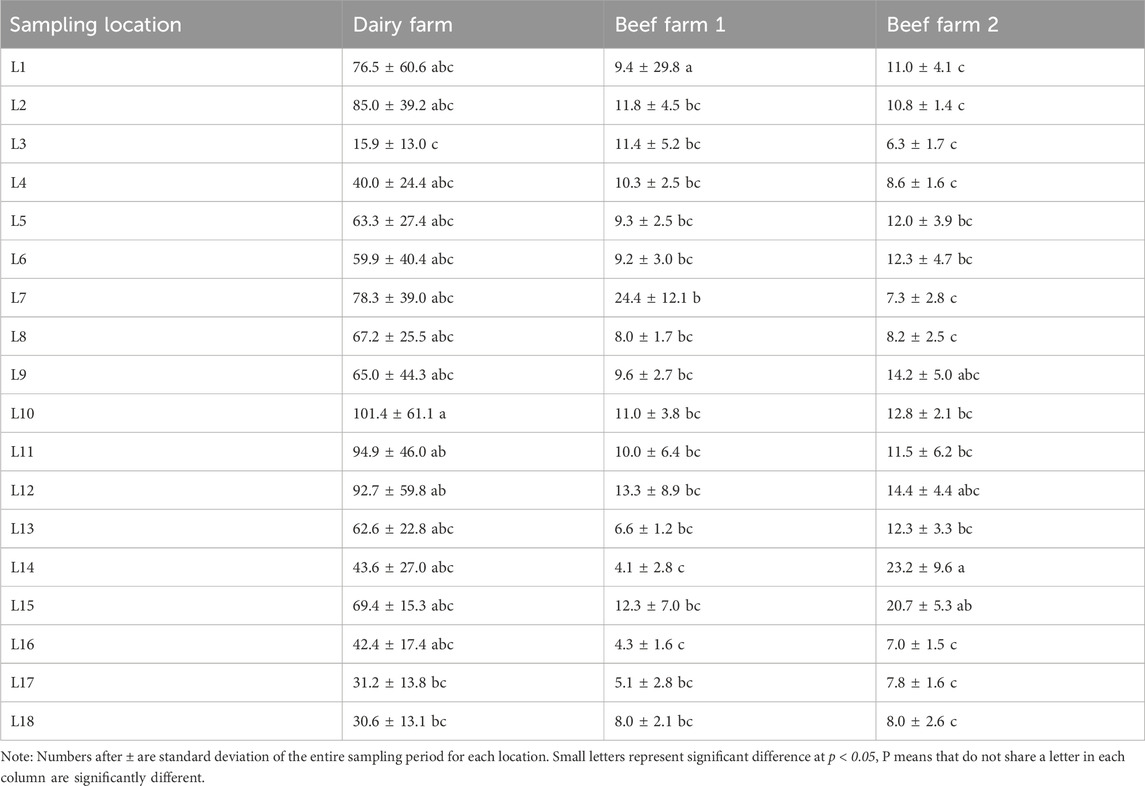
Table 6. Mean values of P concentrations (mg L-1) in the three farms within each sampling location for both closed and open periods.
Specifically for the Dairy Farm, available P concentrations ranged from 15.9 ± 13.0 to 101.4 ± 61.1 mg L-1 at the different sampling locations. The highest mean P concentration of 101.4 ± 61.1 mg L-1 was observed at L10, which is a straight section of the roadway approximately 60 m from the farmyard. However, it was comparable to L11 and L12, which had 94.9 ± 46.0 and 92.7 ± 59.8 mg P L-1 respectively. L1, L2, and L7 also showed high mean P concentrations ranging from 76.0± −85.0 mg L-1. Furthermore, L5, L6, L8, and L13 had mean P concentrations ranging from 59.9 ± 40.4 to 67.2 ± 25.5 mg L-1. The lowest mean P concentration ranged from 15.9 ± 13.0 to 43.6 ± 27.0 mg L-1 and these were observed in sampling L3, L14, L16, L17, and L18. When comparing between L10 (highest) and L3 (lowest), the increase in P concentrations was 84.2% and they are significantly different at p < 0.05 (Table 6).
For Beef Farm 1, the results showed that the mean P concentrations in L1 (59.4 mg L-1) was significantly (p < 0.05) different from the other 17 sampling locations. L7 (24.4 mg L-1) was significantly different to L14 (4.1 mg L-1) and L16 (4.3 mg L-1) but not the other 14 sampling locations (Table 6). The mean P concentration in the other sampling locations, i.e., L2, L3, L4, L5, L6, L8, L9, L10, L11, L12, L13, L15, L17and L18 were comparable ranging between 5.1 ± 2.8 to 13.3 ± 8.9 mg L-1. When comparing the Beef Farm 1 results to Dairy Farm, 89% of the sampling locations in Beef Farm 1 had mean P concentrations lower than 15 mg L-1 which was the minimum concentration in the Dairy Farm.
For Beef Farm 2, the mean P concentrations ranged from 6.31 ± 1.7 to 23.2 ± 9.6 mg L-1 (Table 6). L14 (T junction uphill from bridge crossing, see Table 6; Figure 3) had the maximum mean P concentration but was not significantly different (p < 0.05) to the P concentration in L9, L12 and L9. However, L14 was significantly different to the other 14 sampling locations as shown in Table 6. The minimum P concentration was at L3 (bend at bottom of roadway).
3.3 Temporal patterns of available P
The monthly mean P concentrations for all locations exhibited a seasonal trend across all three farms (Table 7). For the Dairy Farm, September and October 2022 (just before the closed season) had a significantly (p < 0.05) higher available mean P concentration relative to all sampled months (109 ± 46.4 mg L-1 and 105 ± 42.5 mg L-1, respectively). Whereas, January 2023 (closed period) had significantly lower mean available P of 28.4 ± 9.5 mg L-1 concentration relative to September 2022, October 2022 and May 2023 but was not significantly different to November 2022, December 2022, March 2023 and October 2023 (Figure 6). The available P concentrations in the other remaining months were not significantly different from each other but it varied with the different sampling locations. Generally, the mean available P concentration results showed a decreasing trend from November 2022 until January 2023 (closed period) followed by increases again in March and May (open period, Figure 6).
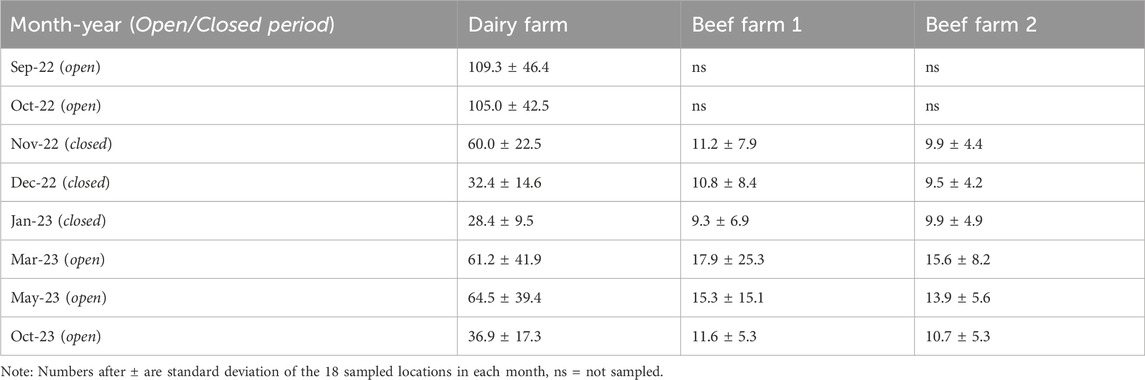
Table 7. Mean P concentrations in mg L-1 showing the temporal variation of available P concentrations for all three farms (September 2022 - October 2023).
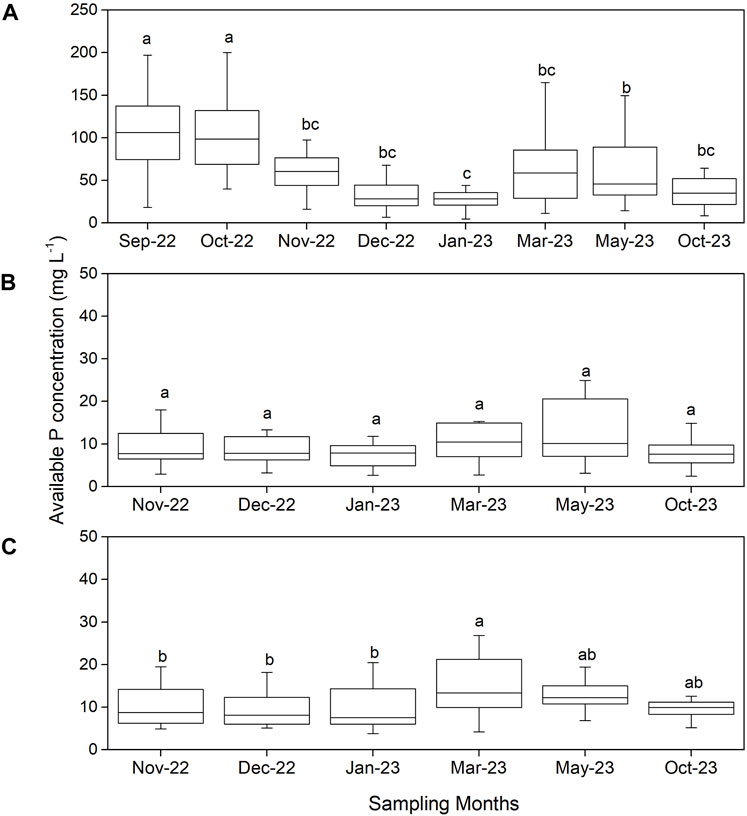
Figure 6. Temporal variability of available phosphorus concentrations for different months in the three farms; (A) Dairy Farm, (B) Beef Farm 1 and (C) Beef Farm 2. Small letters above each box plot represent significant difference (p < 0.05) of mean P of each month compared to others. Bars that do not share a letter are significantly different.
For Beef Farm 1, the P concentrations were not significantly (p < 0.05) different between the months (Figure 6). However, the highest mean P concentration (17.9 ± 25.3 mg L-1) was observed in March 2023 (open period), while the lowest mean was 9.3 ± 6.9 mg L-1 recorded in January 2023 (closed period). In the other months, the mean P concentrations ranged from 10.8 to 15.3 mg L-1. In Beef Farm 2, March 2023 had significantly higher (p < 0.05) mean P concentration (15.6 ± 8.2 mg L-1) relative to November 2022, December 2022, and January 2023 but not significantly different from May and October 2023 (Figure 6). Overall, the P concentrations followed the same trend over the months in all three farms studied. The P concentration generally declined around the closed period, winter months, i.e., December and January and increased in the open period.
3.4 Available P of adjacent fields to sampling locations
Available P concentrations on farm roadways in all farm typologies was higher than the P concentration in the soils of the adjacent fields (Figure 7). In grasslands soils, the target index P is index 3 (P between 5.1 and 8.0 mg L-1) and greater than 8.0 mg L-1 (index 4) has environmental implications. The average P concentration on the grassland fields in the Dairy Farm was found to be 8.6 mg L-1 while in the beef farms were 7.0 and 4.8 mg L-1 for Beef Farm 1 and Beef Farm 2, respectively.
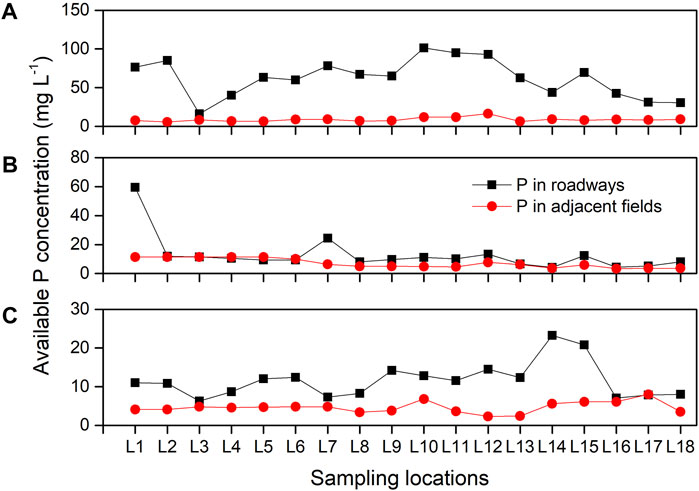
Figure 7. Comparison between mean P concentrations from sampling locations in the farm roadways and mean P concentration from soils of fields adjacent each sampling location in the (A) Dairy Farm, (B) Beef Farm 1 and (C) Beef Farm 2.
3.5 Rainfall and available P concentrations
The Dairy Farm was used to correlate with rainfall as it exhibits very high mean P concentration on the roadways. Figure 8 shows the relationship between the mean monthly P concentrations observed in the Dairy Farm and cumulative rainfall recorded 30 days before each sampling date. Statistically, there was a significant negative correlation (p < 0.05) between the mean monthly P concentrations from the Dairy Farm and the rainfall with r2 = 0.47 and p = 0.0377. When the rainfall received was high, the available P from the roadway material decreased, as no new material was being deposited on the roadways (animals were housed).
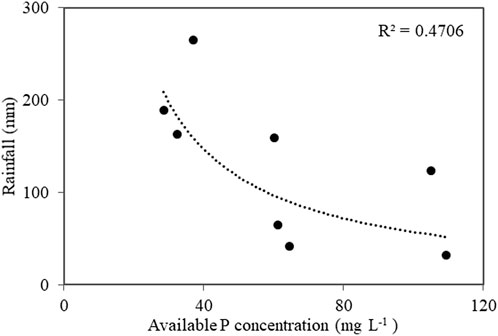
Figure 8. Relationship between mean monthly P concentrations and rainfall recorded at the Dairy Farm during the sampling period.
4 Discussion
4.1 Spatial and temporal aspects of available P concentrations
Spatially on the Dairy Farm, the results from this study concur with those of Fenton et al. (2022) and demonstrate that farm roadways on these farming systems have elevated P concentrations and are a sub-component of the nutrient transfer continuum. However, the temporal data suggests that this source is available all year round to be lost in roadway runoff. Highest concentrations are found during the open period but are sustained and start to decline over the closed period (due to lack of fresh deposits as cows are housed and frequent rainfall during that period) only to rise again once cows are given access to paddocks for grazing. What is also interesting is that the spatial and temporal signal of beef farms although lower than that of the dairy system was not insignificant and therefore needs to be managed within critical source areas.
Spatial results concur with animal movement dynamics, with some areas within the roadway network more vulnerable to P deposition and storage of nutrients within surface materials (i.e., as animals slow or are impeded) (Vero and Doody, 2021). It must also be noted that the present study only samples roadway materials, where fresh deposits on roadways would also contribute to roadway runoff concentrations during runoff events. In the current study, P concentrations were higher in locations closer to farmyards (within ∼100 m) because they are most frequently used by the cows, sometimes in standing positions with associated high excreta deposits. For example, L10, L11, and L12 in the Dairy Farm had higher P concentrations because these were roadways that lead to the farmyard so animals use them twice daily when they are going for milking. L10, L11, and L12 were 60 m, 80 m, and 105 m, respectively away from the farmyard. In Beef Farm 1, L1 had the highest mean P concentrations than the other sampling locations because the sampling location was about 5 m from the beef farmyard which cows frequently visit. This frequency of animals using the same roadway increase the excreta deposited into the roadways thus, showing higher P relative to other farm roadways sections (Vero and Doody, 2021). Similar observations have been reported by McCormick et al. (2009) who indicated that areas closer to farm yards had larger P concentrations due to their proximity to farm buildings thus, prone to receiving leakages from silos and yard washings. Additionally, the higher accumulation could be associated with cow movements towards farmyards being impeded due to a change of surface road material from aggregate and soil to concrete, thus reducing pace and therefore, increasing opportunities for cow deposition of excreta (Ebling et al., 2022).
Results also showed elevated available P concentrations on roadways associated with underpasses. For example, sampling L1 and L2 in the Dairy Farm showed P concentrations of 76.5 and 85.0 mg L-1, respectively, while sampling location one in the Beef Farm 2 showed mean P of 11.0 mg L-1. These sampling locations were located at an underpass, where cows move under public roadways. The source of nutrients in roadway materials is a combination of many factors on the farm. Fenton et al. (2022) lists each of these contributing sources, which are dominated by fresh animal faeces and urine but also may include soil nutrients incorporated into surface materials from trafficking and animal hoofs originating from adjacent fields. The higher P concentration in these locations can be strongly linked with the impaired movement of the cows thus, giving them an opportunity to excrete a lot while standing (Fenton et al., 2021). Farm roadways which were rarely used by animals showed low P concentrations. This is confirmed by results observed from the two Beef Farms used in this study. The mean P concentrations of both Beef Farms was relatively lower than in the Dairy Farm. This is associated with the less usage of these farm roadways in beef enterprises thus, less excreta deposition.
The results demonstrated that, the mean P concentrations were low within the farm roadway material collected in December and January in all three farms. In Ireland, during these months it is the winter period whereby cows are housed (approximately 132 days per year) (Crossley et al., 2022), farm roadways are minimally used and P deposits from animal excreta are significantly reduced from the roadways. In addition, during the autumn-winter months high and frequent rains are received which increases the chances of mobilising the P concentrations through runoff. On the other hand, the P on the roadways showed an increase in March and May in three farms because this is the period cows start pasture grazing and rainfall amounts typically reduce. We assume that the combination of less rains and frequent use of roadways during the open period, results to the accumulation of P within farm roadways, especially in dairy farming where roadways are used intensively.
4.2 Connectivity of available P source with waters on the farms
Negative impact occurs when roadway runoff enters waters (McDowell et al., 2020b; Scott et al., 2024) as stated in the regulations and emphasized by Fenton et al. (2022) that farm roadways are part of the nutrient transfer continuum. If runoff has high nutrient concentrations, this may lead to degradation of drinking water quality (Buchanan et al., 2013) and aquatic ecosystems (Dodds and Smith, 2016; Sharpley, 2016). A critical source area is created where the source (in this case available P in roadway materials) becomes mobilised during a rainfall event and this enters waters as soiled runoff (Thomas et al., 2016). Therefore, for a sampling location to pose a threat to water quality, there must be a connection to waters at that point and the potential to generate runoff that can transport pollutants (Mellander et al., 2012; Monaghan et al., 2021; Rice et al., 2022).
In this study, critical roadway sections were visually identified using the criteria described by Fenton et al. (2022), where the source, mobilisation potential and delivery to waters are assessed. In their study, Fenton et al. (2022) found four locations (L1, L2, L10, and L16) in the same Dairy Farm to be critical source areas (source, pathway, receptor all present). However, since that study, some mitigation measures have been implemented on two of the critical source areas. The mitigation measures implemented involved the construction of angled diversion bars at equal intervals (approx. 25 m apart and 15 cm high) on the roadway, diverting runoff to the adjacent fields at L10, L11 and L12, and changing the camber of the roadway away from waters (open drainage ditch) into the field (considered a buffer) at L16 (Figure 9). Therefore, in the Dairy Farm, both L1 and L2 (both underpasses) remain CSAs as they are connected to waters through groundwater (L1) and underground piping to a stream (L2). Moreover, mobilisation of soiled runoff during rainfall in the open period is very high due to steep gradient of the underpass entrance and exits. This needs attention through diversion bars to buffer areas (fields) and regular maintenance of underpass tanks and removal of surface ditch connectivity during overflow conditions (McDowell et al., 2007; Adams et al., 2018).
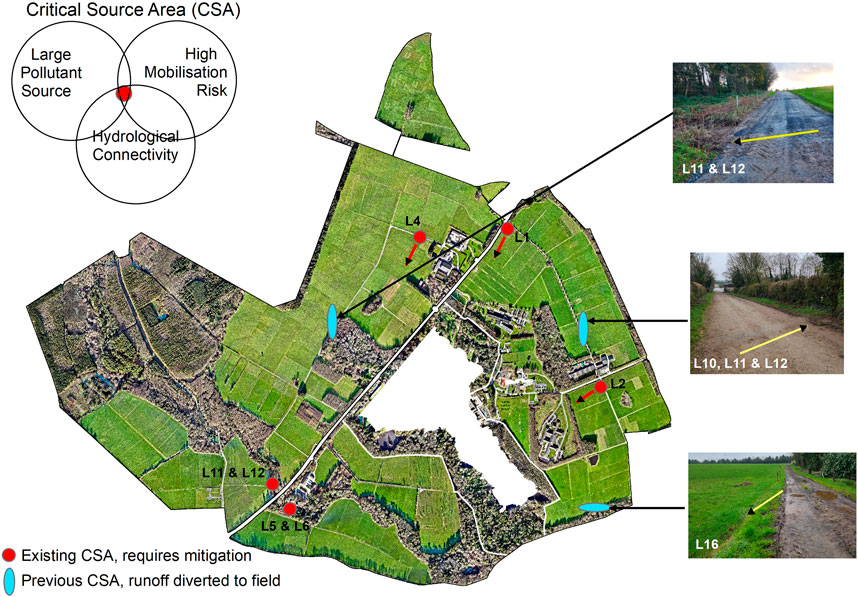
Figure 9. Existing and previous critical source areas with examples of mitigation measures implemented to divert the runoff pathway on the dairy and beef farms.
On Beef Farm 1, only sampling location L4 is considered a critical source area as it visually shows mobilisation of runoff from the side of the roadway connecting to an open drainage ditch. Previous critical source areas included L11 and L12 which combined and delivered runoff from the roadway to an open drainage ditch that connects to the broader drainage system of the farm. This has been mitigated by constructing diversion bars (Figure 9). On Beef Farm 2, two CSA were visually identified. L5 and L6 combine to create a critical source area which delivers P directly into a river. Mobilisation is high at L5 due to the gradient sloping towards L6 (which is directly at a river bridge crossing). Additionally, in Beef Farm 2, L11, L12 and L13 combine to create a critical source area delivering P to the river. L12 is at a river bridge crossing whereas, L11 and L13 are on each side of the bridge sloping towards L12. These critical source areas require mitigation to disconnect the soiled roadway runoff from entering waters. However, not only high P areas requires management, but all areas connected to water needs to be managed as they can potentially be high P stores in the future.
It should be noted that available P associated with roadway materials is high across all farms during the closed and open periods. The concentrations found in the present study should be considered elevated and high and therefore, at any location where concentrations are high changes to the roadway infrastructure to streamline animal traffic should be considered. Where any roadway runoff connection to waters occurs, concentrations found in the surface materials themselves, which are distinct from fresh deposits should be considered high and therefore, the pathway needs to be broken through introduction of a mitigation measure. For example, altering the flow paths using bunds and diversion bars to natural buffer zones (Adams et al., 2018) as well as alleviating soil water repellency to reduce loss of P in surface runoff (McDowell et al., 2020a). Primarily, mitigation should be targeted at key locations where critical source areas are found and maintained or updated with both the open and closed periods in mind.
5 Conclusion
This study assessed the available P concentrations on internal farm roadways of a Dairy Farm and two Beef Farms. The spatial pattern of available P concentrations showed that roadway networks store large sources of P, which if connected to waters could have poor outcomes for water quality. Spatial differences within each farm showed that concentrations were higher within 100 m of the farmyard and where livestock movement is impeded at junctions and underpasses. The temporal signature of available P showed rising trends in the open period and falling trends in the closed period, when livestock are housed and do not use the roadways. The concentration of mean available P in roadway materials was highest in the Dairy Farm, and lower but comparable with each other for both Beef Farms roadway concentrations. This is because roadways in dairy farms are used much more intensively than in beef farms when livestock move from paddocks to farmyard for milking. A visual CSA approach was employed to determine farm roadway sections that were connected to waters, and required mitigation measures. Critical source areas on two of the farms, where the roadway material source of P is high, should be earmarked for implementation of mitigation measures to minimise the P source from livestock and break the connectivity between soiled roadway runoff and waters.
Data availability statement
The original contributions presented in the study are included in the article/Supplementary material, further inquiries can be directed to the corresponding author.
Author contributions
LS: Conceptualization, Data curation, Formal Analysis, Methodology, Visualization, Writing–original draft, Writing–review and editing. JM: Conceptualization, Funding acquisition, Methodology, Supervision, Writing–review and editing. KD: Conceptualization, Methodology, Supervision, Writing–review and editing. LL-S: Visualization, Writing–review and editing. SL: Visualization, Writing–review and editing. PT: Conceptualization, Methodology, Supervision, Writing–review and editing. JC: Investigation, Methodology, Writing–review and editing. OF: Methodology, Conceptualization, Funding acquisition, Supervision, Writing–review and editing.
Funding
The author(s) declare that financial support was received for the research, authorship, and/or publication of this article. The ROAD-READY project (2040) was funded by Teagasc core funding.
Acknowledgments
The authors thank the Teagasc Walsh Scholarship for support of the first author. Special thanks goes to farm and laboratory staff members for their time, advice and patience and to those who helped with training and testing of samples.
Conflict of interest
The authors declare that the research was conducted in the absence of any commercial or financial relationships that could be construed as a potential conflict of interest.
Publisher’s note
All claims expressed in this article are solely those of the authors and do not necessarily represent those of their affiliated organizations, or those of the publisher, the editors and the reviewers. Any product that may be evaluated in this article, or claim that may be made by its manufacturer, is not guaranteed or endorsed by the publisher.
References
Adams, R., Arafat, Y., Eate, V., Grace, M. R., Saffarpour, S., Weatherley, A., et al. (2014). A catchment study of sources and sinks of nutrients and sediments in south-east Australia. J. Hydrology 515, 166–179. doi:10.1016/j.jhydrol.2014.04.034
Adams, R., Quinn, P., Barber, N., and Burke, S. (2020). Identifying flow pathways for phosphorus transport using observed event forensics and the CRAFT (catchment runoff attenuation flux tool). Water 12 (4), 1081. doi:10.3390/w12041081
Adams, R., Quinn, P., Barber, N., and Reaney, S. (2018). The role of attenuation and land management in small catchments to remove sediment and phosphorus: a modelling study of mitigation options and impacts. Water 10 (9), 1227. doi:10.3390/w10091227
Buchanan, B., Falbo, K., Schneider, R., Easton, Z., and Walter, M. (2013). Hydrological impact of roadside ditches in an agricultural watershed in Central New York: implications for non-point source pollutant transport. Hydrol. Process. 27 (17), 2422–2437. doi:10.1002/hyp.9305
Cassidy, R., Doody, D. G., and Watson, C. J. (2017). Impact of legacy soil phosphorus on losses in drainage and overland flow from grazed grassland soils. Sci. Total Environ. 575, 474–484. doi:10.1016/j.scitotenv.2016.07.063
Central-Statistics-Office (2020). Census of agriculture 2020 - preliminary results. Available at: https://www.cso.ie/en/releasesandpublications/ep/p-coa/censusofagriculture2020-preliminaryresults/kf/ (Accessed October 29, 2023).
Clagnan, E., Thornton, S. F., Rolfe, S. A., Wells, N. S., Knoeller, K., Murphy, J., et al. (2019). An integrated assessment of nitrogen source, transformation and fate within an intensive dairy system to inform management change. PloS one 14 (7), e0219479.
Crossley, R., Bokkers, E., Browne, N., Sugrue, K., Kennedy, E., and Conneely, M. (2022). Risk factors associated with indicators of dairy cow welfare during the housing period in Irish, spring-calving, hybrid pasture-based systems. Prev. Veterinary Med. 208, 105760. doi:10.1016/j.prevetmed.2022.105760
Dodds, W. K., and Smith, V. H. (2016). Nitrogen, phosphorus, and eutrophication in streams. Inland Waters 6 (2), 155–164. doi:10.5268/iw-6.2.909
Dunne, K., Holden, N., and Daly, K. (2021). A management framework for phosphorus use on agricultural soils using sorption criteria and soil test P. J. Environ. Manag. 299, 113665. doi:10.1016/j.jenvman.2021.113665
Ebling, É. D., Reichert, J. M., Minella, J. P. G., Holthusen, D., Broetto, T., and Srinivasan, R. (2022). Rainfall event-based surface runoff and erosion in small watersheds under dairy and direct-seeding grain production. Hydrol. Process. 36 (9), e14688. doi:10.1002/hyp.14688
EPA (2020). Ireland's environment: an integrated assessment 2020. Available at: https://www.epa.ie/publications (Accessed February 16, 2024).
Ezzati, G., Fenton, O., Healy, M. G., Christianson, L., Feyereisen, G. W., Thornton, S., et al. (2020). Impact of P inputs on source-sink P dynamics of sediment along an agricultural ditch network. J. Environ. Manag. 257, 109988. doi:10.1016/j.jenvman.2019.109988
Fenton, O., Rice, P., Murnane, J. G., Tuohy, P., and Daly, K. (2022). Dairy farm roadway surface materials as a P-source within the nutrient transfer continuum framework. Front. Environ. Sci. 10. doi:10.3389/fenvs.2022.878166
Fenton, O., Tuohy, P., Daly, K., Moloney, T., Rice, P., and Murnane, J. G. (2021). A review of on-farm roadway runoff characterisation and potential management options for Ireland. Water, Air, Soil Pollut. 232 (3), 89. doi:10.1007/s11270-021-05027-0
Fischer, K., Burchill, W., Lanigan, G., Kaupenjohann, M., Chambers, B., Richards, K. G., et al. (2016). Ammonia emissions from cattle dung, urine and urine with dicyandiamide in a temperate grassland. Soil Use Manag. 32, 83–91. doi:10.1111/sum.12203
Hubbard, R., Newton, G., and Hill, G. (2004). Water quality and the grazing animal. J. animal Sci. 82 (Suppl. l_13), E255–E263. doi:10.2527/2004.8213_supplE255x
Jarvie, H. P., Sharpley, A. N., Withers, P. J., Scott, J. T., Haggard, B. E., and Neal, C. (2013). Phosphorus mitigation to control river eutrophication: murky waters, inconvenient truths, and “postnormal” science. J. Environ. Qual. 42 (2), 295–304. doi:10.2134/jeq2012.0085
Maher, P. J., Egan, M., Murphy, M. D., and Tuohy, P. (2023). Assessment of the current performance of grazing infrastructure across Irish dairy farms. J. Dairy Sci. 106 (7), 4759–4772. doi:10.3168/jds.2022-22799
McCormick, S., Jordan, C., and Bailey, J. (2009). Within and between-field spatial variation in soil phosphorus in permanent grassland. Precis. Agric. 10, 262–276. doi:10.1007/s11119-008-9099-4
McDowell, R. W., Catto, W., and McDowell, N. L. S. (2020a). The mitigation of phosphorus losses from a water-repellent soil used for grazed dairy farming. Geoderma 362, 114125. doi:10.1016/j.geoderma.2019.114125
McDowell, R. W., Daly, K., and Fenton, O. (2020b). Research note: mitigation of phosphorus, sediment and Escherichia coli losses in runoff from a dairy farm roadway. Ir. J. Agric. Food Res. 59 (1), 201–205. doi:10.15212/ijafr-2020-0117
McDowell, R. W., Hawke, M., and McIntosh, J. (2007). Assessment of a technique to remove phosphorus from streamflow. N. Z. J. Agric. Res. 50 (4), 503–510. doi:10.1080/00288230709510318
McDowell, R. W., Macintosh, K. A., and Depree, C. (2023). Linking the uptake of best management practices on dairy farms to catchment water quality improvement over a 20-year period. Sci. Total Environ. 895, 164963. doi:10.1016/j.scitotenv.2023.164963
Mellander, P.-E., Galloway, J., Hawtree, D., and Jordan, P. (2022). Phosphorus mobilization and delivery estimated from long-term high frequency water quality and discharge data. Front. Water 4. doi:10.3389/frwa.2022.917813
Mellander, P.-E., Melland, A. R., Jordan, P., Wall, D. P., Murphy, P. N. C., and Shortle, G. (2012). Quantifying nutrient transfer pathways in agricultural catchments using high temporal resolution data. Environ. Sci. Policy 24, 44–57. doi:10.1016/j.envsci.2012.06.004
Monaghan, R., Manderson, A., Basher, L., Smith, C., Burger, D., Meenken, E., et al. (2021). Quantifying contaminant losses to water from pastoral landuses in New Zealand I. Development of a spatial framework for assessing losses at a farm scale. N. Z. J. Agric. Res. 64 (3), 344–364. doi:10.1080/00288233.2021.1936572
Morgan, M. F. (1941) Chemical soil diagnosis by the universal soil testing system. Connecticut, United States: Connecticut Agricultural Experimental Station. Bulletin, 450.
Phillips, C., Beerda, B., Knierim, U., Waiblinger, S., Lidfors, L., Krohn, C., et al. (2013). “A review of the impact of housing on dairy cow behaviour, health and welfare,” in Livestock housing: modern management to ensure optimal health and welfare of farm animals (Wageningen Academic Publishers), 221–232. doi:10.3920/978-90-8686-771-4_02
Rice, P., Daly, K., Tuohy, P., Murnane, J. G., Nag, R., and Fenton, O. (2022). Evaluating connectivity risk of farm roadway runoff with waters-Development and sensitivity analysis of a semi quantitative risk model. Sci. Total Environ. 851, 158114. doi:10.1016/j.scitotenv.2022.158114
Scott, A., Cassidy, R., Arnscheidt, J., and Jordan, P. (2024). Soil phosphorus, hydrological risk and water quality carrying capacities in agricultural catchments. Catena 240, 107964. doi:10.1016/j.catena.2024.107964
Sharpley, A. (2016). Managing agricultural phosphorus to minimize water quality impacts. Sci. Agric. 73, 1–8. doi:10.1590/0103-9016-2015-0107
Sharpley, A., McDowell, R. W., and Kleinman, P. J. A. (2001). Phosphorus loss from land to water: integrating agricultural and environmental management. Plant Soil 237 (2), 287–307. doi:10.1023/A:1013335814593
Smith, V. H., Tilman, G. D., and Nekola, J. C. (1999). Eutrophication: impacts of excess nutrient inputs on freshwater, marine, and terrestrial ecosystems. Environ. Pollut. 100 (1-3), 179–196. doi:10.1016/s0269-7491(99)00091-3
Teagasc (2020a). Major and micro nutrient advice for productive agricultural crops. Available at: https://www.teagasc.ie/media/website/publications/2020/Major--Micro-Nutrient-Advice-for-Productive-Agricultural-Crops-2020.pdf (Accessed March 5, 2024).
Teagasc (2020b). What is in farm roadway runoff? Available at: https://www.teagasc.ie/publications/2020/what-is-in-farm-roadway-runoff.php (Accessed October 20, 2023).
Teagasc (2023). Beef farming and its challenges in Ireland. Available at: https://www.teagasc.ie/news--events/daily/beef/beef-farming-and-its-challenges-in-ireland.php (Accessed October 20, 2023).
Thomas, I. A., Mellander, P.-E., Murphy, P. N. C., Fenton, O., Shine, O., Djodjic, F., et al. (2016). A sub-field scale critical source area index for legacy phosphorus management using high resolution data. Agric. Ecosyst. Environ. 233, 238–252. doi:10.1016/j.agee.2016.09.012
Vadas, P., Fiorellino, N. M., Coale, F. J., Kratochvil, R., Mulkey, A. S., and McGrath, J. M. (2018). Estimating legacy soil phosphorus impacts on phosphorus loss in the Chesapeake Bay watershed. J. Environ. Qual. 47 (3), 480–486. doi:10.2134/jeq2017.12.0481
Keywords: agriculture, nutrient continuum, critical source area, runoff, water quality
Citation: Sifundza LS, Murnane JG, Daly K, Lopez-Sangil L, Leach S, Tuohy P, Cardiff J and Fenton O (2024) Phosphorus in farm roadway substrates: contrasting spatial and temporal patterns in dairy and beef farms. Front. Environ. Sci. 12:1405378. doi: 10.3389/fenvs.2024.1405378
Received: 25 March 2024; Accepted: 24 May 2024;
Published: 12 June 2024.
Edited by:
Stevo Lavrnic, University of Bologna, ItalyReviewed by:
Bingqian Fan, Chinese Academy of Agricultural Sciences (CAAS), ChinaDavid William O'Connell, Trinity College Dublin, Ireland
Copyright © 2024 Sifundza, Murnane, Daly, Lopez-Sangil, Leach, Tuohy, Cardiff and Fenton. This is an open-access article distributed under the terms of the Creative Commons Attribution License (CC BY). The use, distribution or reproduction in other forums is permitted, provided the original author(s) and the copyright owner(s) are credited and that the original publication in this journal is cited, in accordance with accepted academic practice. No use, distribution or reproduction is permitted which does not comply with these terms.
*Correspondence: Lungile Senteni Sifundza, bHVuZ2lsZS5zaWZ1bmR6YUB0ZWFnYXNjLmll