- School of Economics and Law, Chaohu University, Chaohu, China
Introduction: As a means of environmental regulation, the low-carbon city pilot policy aims to address climate change and alleviate environmental resource pressures in economic development. The development of low-carbon cities often requires changes to the existing industrial and energy structures, which will have a significant impact on the regional economy.
Methods: The study is based on panel data from 273 prefecture level cities in China from 2012 to 2022, and uses the Analytic Hierarchy Process and Entropy Comprehensive Evaluation Method to construct an evaluation index system for urban circular benefits. Finally, the multiple time point differences model and mediation effect model were used to evaluate the impact and influencing factors of policies on urban economy.
Results: The results indicate that at the 1% level, the explanatory variable coefficient significantly improves the level of urban circular economy development after adding control variables. The construction of low-carbon pilot cities has improved the performance of circular economy development by about 6.42%. The mediating effect of industrial structure rationalization is significantly positive at the 1% significance level, indicating that the construction of low-carbon pilot cities has greatly promoted the coordinated development of industrial relations within China’s low-carbon development regions.
Discussion: It can be seen that the low-carbon city pilot policy has a significant promoting effect on China’s economic development and the development of urban circular economy. Therefore, it is recommended to further expand the pilot scope of low-carbon cities and fully leverage their promoting role.
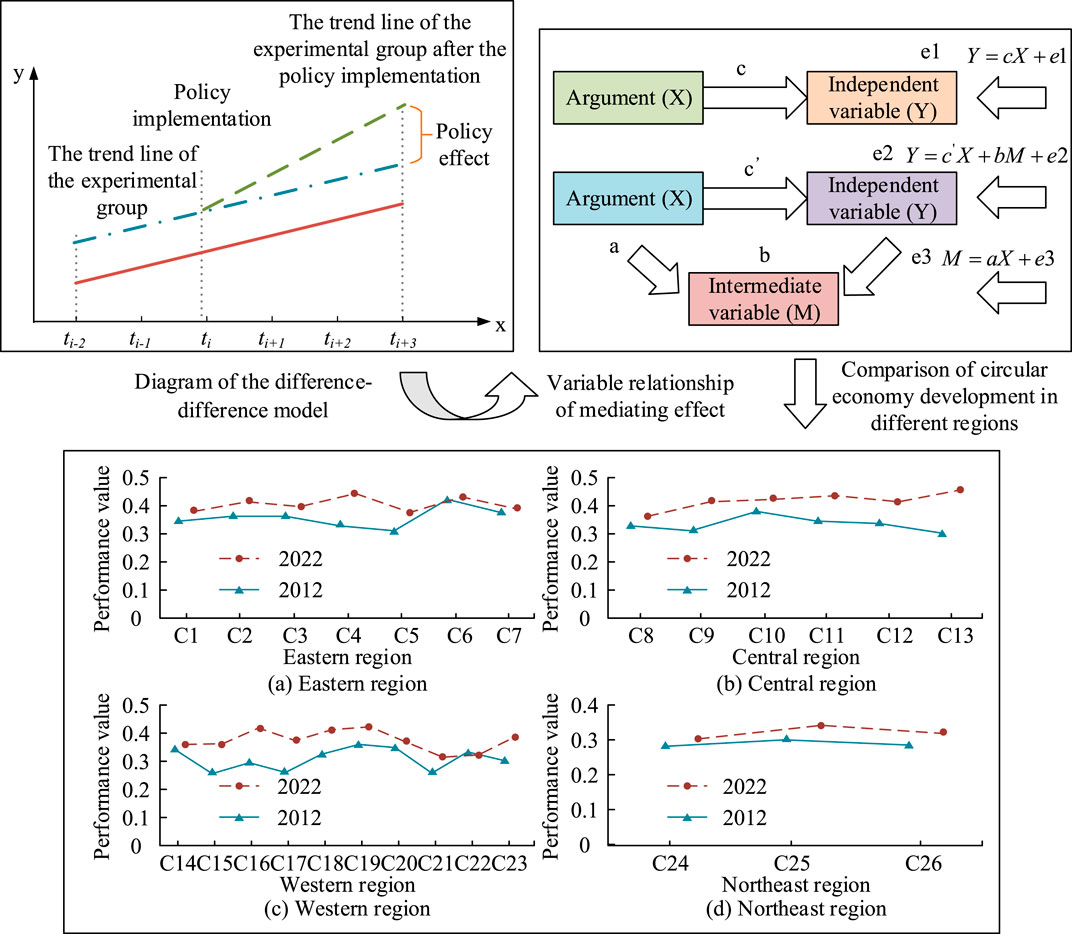
GRAPHICAL ABSTRACT | This article is based on panel data from 273 prefecture level cities from 2012 to 2012, and uses a multi time difference model to analyze the impact of low-carbon city pilot policies on the development of urban circular economy. The research results indicate that the construction of low-carbon pilot cities has significantly promoted the coordinated development of intra regional industrial relationships.
1 Introduction
Low-carbon city (LC) is an environmental regulation policy to address climate change, and it is of great significance for an environmentally friendly society (Chen et al., 2021). Against the backdrop of low-carbon economy (LE) strategies being implemented by national and local governments, LE is also an important development trend and core strategy for future economic and social development. Its core lies in the sustainable utilization of ecological resources, and it aims to achieve green development by a low-pollution and low-energy consumption industrial development system (Liu et al., 2022a). In terms of low-carbon city construction and urban economic development, many domestic and foreign scholars, such as Chen et al. (2023a), have pointed out in their research that CSR can effectively stimulate green exploratory innovation through mandatory and market-driven regulation, but voluntary regulation has negative effects on it. Secondly, other studies have also proposed that circular economy practices can significantly improve enterprise performance, especially in state-owned, large and heavily polluting enterprises, while innovation and digital transformation strategies as well as moderate practice intensity are the key (Chen and Dagestani, 2023). Finally, relevant studies have pointed out that air quality monitoring policies significantly improve urban ecological efficiency, and governments and ngos play different roles in this process to achieve sustainable urban development (Chen et al., 2023b). In addition, the current policy implementation mechanism mainly focuses on urban LE and total factor productivity, and takes carbon emissions as an evaluation index. The research on circular economy mainly focuses on the connotation of circular economy and its impact on economic and social development. As the problem of climate change intensifies, research on the impact of low-carbon policies on economic development is helpful in finding a path of coordinated development between the economy and the environment while achieving carbon emission reduction. As a model of sustainable development, CE emphasizes efficient use of resources and environmental protection. Therefore, studying the impact of low-carbon policies on CE can help understand their role in resource recovery and reducing pollution emissions. This paper focuses on the effects of the LC on the development of the CE and explores their underlying mechanisms. It innovatively constructs a novel system for urban CE development and comprehensively measures the development level of prefecture-level cities using the analytic hierarchy process (AHP) and entropy weight method. A multiple time-point difference-in-differences (DID) model is built to assess LC construction’s impact on urban CE. The main innovations of this study are as follows: Firstly, an index system is constructed to evaluate the development of urban CE. This is achieved by utilizing AHP and entropy methods to comprehensively measure 273 prefecture-level cities in China. This approach allows for a comprehensive and objective reflection of the development of urban CE. Secondly, the multiple time-point DID model is used to evaluate the impact of LC pilot policies on the development of CE as a quasi-natural experiment, which improves the accuracy of the model and reduces selection bias and endogenous problems. Furthermore, the mediation effect model is employed to elucidate the mechanism through which LC pilot policies influence the advancement of CE. The intermediary effects of industrial structure rationalization, green technology progress, energy consumption structure optimization, and upgrading are utilized to reveal the policy effect. Finally, based on the data from 273 prefecture-level cities from 2012 to 2022, a large sample empirical study is conducted to enhance the robustness and universality of the results, and the conclusions are more representative. The paper aims to provide scientific and effective decision support for accelerating China’s CE system and achieving green transformation.
This study is divided into six parts. The first part introduces the background and importance of LC pilot projects, and elaborates on the concepts of LE and CE. The second part summarizes the research on the impact of urban CE both domestically and internationally. The third part introduces research methods, discusses environmental regulatory tools and their impact mechanisms on the CE, then designs performance indicators and measurement methods for the CE, and constructs a multiple time-point DID model and mediation effect model. The fourth part is empirical analysis, which includes an examination of the impact of policies on CE performance and a discussion of regional differences. Additionally, it addresses the indirect impact of policies on CE through industrial structure rationalization, green technology progress, and energy structure optimization. The fifth part proposes policy adjustment suggestions for regional differences, including green technology and energy structure optimization. The sixth part summarizes the research methods and experimental results, and proposes future research directions.
2 Related works
As the national and local governments gradually implements the development strategy for LE, the LE begins to receive attention from countries around the world. Many scholars have conducted research and evaluation on its implementation effects in various aspects. Firstly, Yu Y and other scholars conducted in-depth research on the correlation between LC and carbon emission efficiency, and used the DID combined with propensity score matching (PSM) to prove that the LC significantly improved carbon emission reduction in Central and Eastern Europe (Yu and Zhang, 2021). Liu F and other scholars evaluated the LC in China by incorporating carbon emissions into the evaluation framework. Based on a multi-period DID, they found that LC can achieve both direct carbon emission reduction and indirect reduction through optimizing industrial structure, technological innovation, and other means (Liu, 2022). Wen S and other scholars used panel data from 208 cities and calculated the impact of LC on carbon emission efficiency through PSM and DID. The study showed that the overall LC could significantly improve the carbon dioxide emission rate in pilot areas (Wen et al., 2022). In terms of environmental pollution control, Liu Z and other researchers took the LC in China to analyze the motivation of local sustainable development action under authoritarian background. The study demonstrated that LC facilitated the advancement of environmental governance, thereby fostering the sustainable development of local areas (Liu et al., 2022b). Yan J and other researchers constructed a PSM-DID and mediation effect model using panel data from 271 cities in China. Research results showed the average annual concentration of PM2.5 decreased by 14.29% (Yan et al., 2021).
In terms of economic development, Qiu S and other scholars used the PSM-DID model to prove that in large cities, non-resource cities, and eastern cities, LC projects positively impacted regional economic development (Qiu et al., 2021). In the CE, Gong Z and other researchers based on the enterprise social responsibility research of radial basis function neural network, constructed a low-carbon CE system. The study verified the coupling development relationship between the environment and economy through examples, and clarified the connotation of low-carbon CE (Gong et al., 2021). Zhang W and other scholars used panel data from 30 provincial-level administrative regions to empirically study how carbon emissions trading promotes green technology innovation. The study found that at the current stage, carbon trading had a certain inhibitory impact on green technology innovation, but significantly reduced carbon emissions and carbon intensity (Zhang et al., 2022).
In conclusion, few studies have comprehensively analyzed economic development and CE. Many studies use provincial data and ignore differences at the prefecture-level. For example, Yan et al. (2021) used the PSM-DID model but did not delve into the situation of prefecture level cities. The traditional DID model was difficult to fully capture the dynamic effects and regional differences of policies when processing multi-time points and multi-region data. Gong et al. (2021) discussed the relationship between corporate social responsibility and low-carbon CE, but did not systematically analyze the mediating effect. To reduce the selection bias and improve the robustness of the results, the evaluation index system of urban CE development is constructed. Combining AHP and entropy to measure the development level of CE in prefecture-level cities, the PSM-DID model is adopted to consider the influence of policies in the time dimension.
3 Evaluation method of the effect of LC construction on the development of urban CE
To analyze the level of CE development in cities, this study uses panel data from 273 prefecture-level cities in China from 2012 to 2022, and establishes a corresponding evaluation system. Combined with the AHP and entropy weight methods, the level of CE development in each city is evaluated. Furthermore, a multiple time-point DID model is constructed to assess the impact of LC on urban CE. Finally, based on the mediating effects model, various factors’ impact on CE development degree in cities is examined.
3.1 The promotion mechanism of LC on urban CE
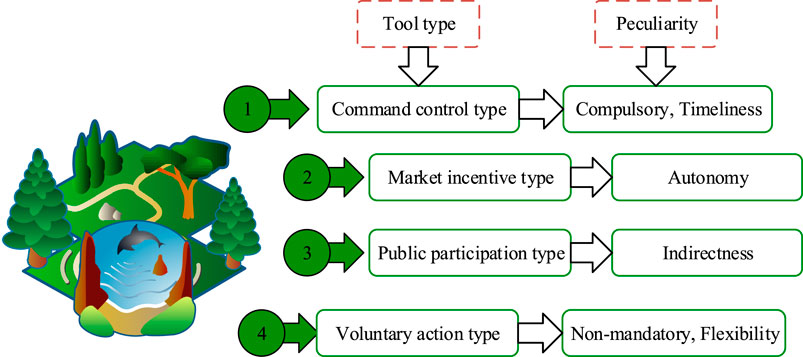
Environmental regulation refers to the various regulatory measures taken by the government or authorities in handling environmental issues. Its purpose is to protect the environment, and use market mechanisms and public roles to directly or indirectly intervene and regulate enterprises that cause environmental pollution in the production environment. Based on the existing research on environmental regulation policies and the development theory of CE, environmental regulation tools can be divided into different types according to their functional mechanisms and characteristics, as shown in Figure 1 (Teymouri et al., 2022).
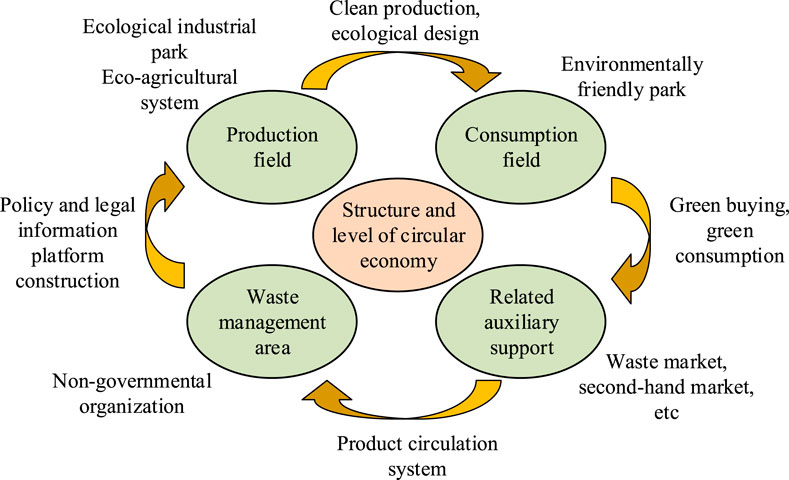
In Figure 1, there are four main types of environmental regulatory tools: command and control, market-based incentives, public participation, and voluntary actions. Command and control involve mandatory regulation of wastewater treatment plants at the government level using legal and administrative means. Corresponding laws and regulations should be formulated to unify emission standards and technological standards for pollutants. Market-based incentives adjust the costs and benefits of pollution-emitting units through various economic tools, establish systems such as emissions trading permits, impose pollution taxes, and provide compensatory subsidies. Public participation involves the public disclosure of environmental monitoring information and the signing of voluntary environmental agreements to facilitate public participation and reflect the demands and opinions of the masses through multiple channels. Voluntary actions refer to voluntary conservation activities initiated by residents, enterprises, and non-governmental organizations, as well as the establishment of nature reserves and the creation of eco-friendly cities. LCs are environmental regulatory measures proposed to address climate change. Their purpose is to promote cities’ green and low-carbon transformation in various ways for environmentally friendly society construction (Liu et al., 2021; Song and Ouyang, 2020). Within pilot cities, the responsibility for carbon emission reduction has shifted from provincial to prefecture-level cities and county-level cities. However, limiting the scope of policy pilots to specific regions is conducive to formulating reasonable low-carbon development plans based on regional characteristics, accelerating policy implementation, and ensuring the effectiveness of policy execution. LE is not only the foundation of a country but also a guarantee for sustainable social development (Deng and Shangguan, 2021). CE is an economic development model based on ecological economics, with comprehensive utilization efficiency of resources as its core and sustainable development as its goal. Based on the principles of ecological economics and sustainable development, efficient use of resources is achieved by reducing resource waste and environmental damage. The specific structure and level of CE are shown in Figure 2 (Preethi and Mamatha, 2023).
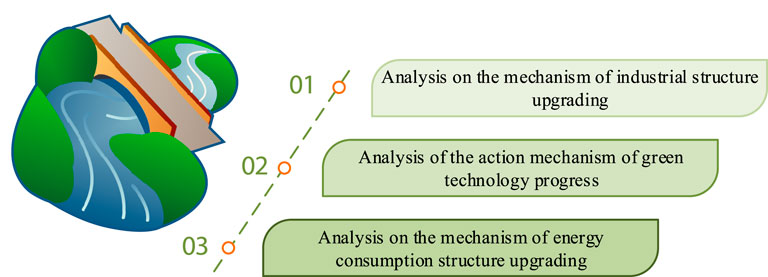
In Figure 2, both LE and CE are essentially sustainable economic models and components of the green economy. “Low-carbon” refers to achieving carbon reduction in the production and living processes, while “LE” aims to improve comprehensive resource utilization. Building a LE system can promote green transformation in various aspects, such as production, circulation, and consumption, and it is an important way to promote carbon reduction and optimize energy utilization efficiency (Mahdiraji, 2021). On the other hand, building a CE system that targets resource conservation can adjust the city’s energy consumption structure through adjustments in energy structure, control of energy consumption, reduction of coal consumption, and realization of low-carbon development. Under the background of high-quality development, the country’s attention to the ecological environment is increasing, and building LC has become the main approach to addressing environmental pollution. The pilot policies for LC have both direct and indirect effects on CE. The management of solid waste pollution, energy consumption, and the green transformation of production methods are important issues that need to be resolved urgently in CE. The core issue is how to minimize the environmental impact in the production process. Based on the understanding and analysis of LC policy, combined with the existing literature and data, a mechanism model is constructed to evaluate the impact of LC policy on the development of CE. The impact mechanism of LC pilot policies is shown in Figure 3.
Figure 3 mentions three impact mechanisms of LC. For industrial structure upgrading, the pilot policies for LC focus on developing green industries, especially industries with minimal environmental impact, such as modern service industries, optimizing industrial structure, and increasing output. The optimization and upgrading of the industrial structure to a certain extent promotes changes in consumer demand, accelerates the transformation of traditional high-energy-consuming and high-emission industries into clean and environmentally friendly industries. Under the context of carbon neutrality, green technological progress can promote core technologies, such as comprehensive utilization of waste, material recycling, green ecological product design, and green high-end equipment re-manufacturing in the CE. Breaking through technological barriers in the development of CE, accelerating the popularization and mature application of green technologies, and reducing the technological gap between China and the world in CE. From an energy perspective, the promulgation of pilot policies for LC can adjust the city’s energy consumption structure to some extent. On the one hand, the energy price mechanism can regulate China’s energy efficiency. Under certain cost conditions, enterprises will reduce their investment in energy resources by increasing the utilization of funds and other production factors, thereby improving their production efficiency. At the same time, as energy consumption levels increase, there will be a continuous decrease in enterprise demand for energy. This will prompt enterprises to continuously innovate their technologies, achieve optimal allocation of production factors and resources, and thus reduce adverse impacts on the environment.
3.2 Comprehensive measurement method for the development level of urban CE
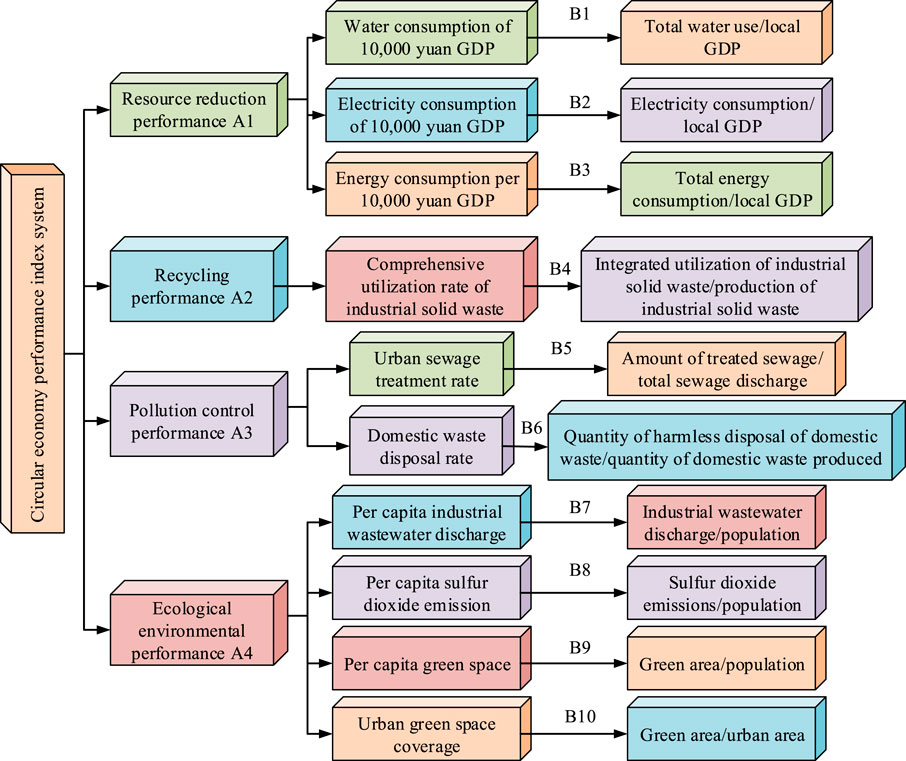
To objectively evaluate the level of CE development in cities, a scientific and comprehensive evaluation index system is established to monitor and analyze its progress and characteristics (Rodríguez-Antón et al., 2022; Ye et al., 2022). The CE uses 3R (reduction, reuse, and recycling) to achieve effective utilization of resources (Wang et al., 2021; Han et al., 2022). Throughout the entire process of production and consumption, efforts should be made to minimize resource waste, minimize damage to the ecological environment, and achieve the best balance between economy and environment. In this regard, this study refers to relevant national policies and draws on the research achievements of scholars such as Wang Xiaohong (Ramon et al., 2023). The constructed performance evaluation index system for urban CE is shown in Figure 4.
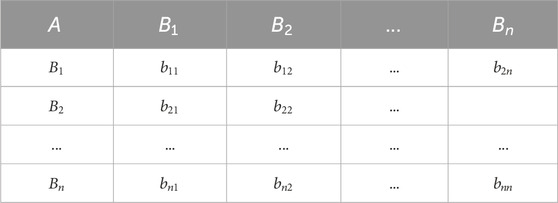
In Figure 4, the indicator system for measuring CE studied includes target layer, criterion layer, and indicator layer. The 10 basic indicators correspond to each target layer and standard layer, reflecting the specific level of urban CE development. The AHP is a weight calculation method that combines subjective and objective factors to measure the development level of CE (Akinbobola and Fafure, 2021; Ismail and Ouahrani, 2022). The specific operation is as follows: first, a judgment matrix is established. Assuming that the primary indicator
In Table 1,
In Equation 1,
Then the calculation of weights is standardized, as shown in Equation 3 (Enzai et al., 2022).
Afterwards, each column element
When measuring the consistency, the consistency ratio is calculated. Its consistency is inversely proportional to the result value. The lower the result value, the higher the consistency. The calculation of consistency ratio is shown in Equation 5 (Lacerda et al., 2021).
In Equation 5,
Each row of elements is summed up again, as shown in Equation 7.
Afterwards, the standardization process is performed as shown in Equation 8.
Based on the above process, the final feature vector
Then indicator translation is performed to eliminate negative values, as shown in Equation 10.
In Equation 10,
The entropy value
Then the coefficient of difference
3.3 Construction of an evaluation model for the effect of LC on the development of CE based on multiple time-point DID
The dependent variable selected for the study is the level of urban CE development (UE) (Gan et al., 2023). Referring to relevant national policies and previous research results, a system for urban CE development is constructed. On this basis, the study also uses the AHP and entropy method to calculate the weights of secondary and tertiary indicators, respectively (Chen et al., 2022; Li, 2024). By weighted calculation, UE is obtained in prefecture-level cities. The study takes the LC as the core explanatory variable, sets policy grouping simulation variable
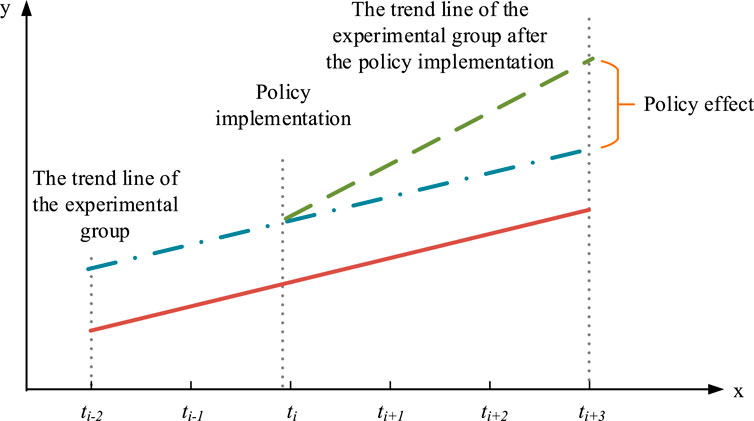
Due to the fact that public policies are usually formulated by the central government, they can largely avoid selection bias in empirical measurement and reduce endogeneity issues caused by bidirectional causality (Budziński and Czajkowski, 2022). The DID model is one of the mainstream methods for analyzing the effects of public policies in China. Compared to the traditional DID model, the multiple time-point DID model can process the policy implementation effect at multiple time points, so it is more suitable for the time span and data characteristics of this study. The DID model compensates for the shortcomings of traditional econometric methods by adding a dummy variable at the time level, which can improve the model accuracy. The standard setting is shown in Equation 14.
In Equation 14,
The study regards LC as a quasi natural experiment and uses a multiple time-point DID model to test the impact of LC pilot policies on the development of urban CE (Khuu et al., 2023; Zhao et al., 2022). Firstly, two dummy variables
To ensure empirical results’ robustness, the study selects a fusion PSM and a multiple time-point DID model for hypothesis testing. Firstly, based on the propensity score, the nearest neighbor matching method is used to find control groups that are similar to the experimental group. Then, the matched two groups are regressed to minimize the selection bias between two groups, and to obtain the purity of policy effects. By referring to relevant environmental practice cases, the impact of experimental plans on the environmental development of Chinese cities can be more accurately evaluated. The specific model is shown in Equation 16.
In Equation 16,
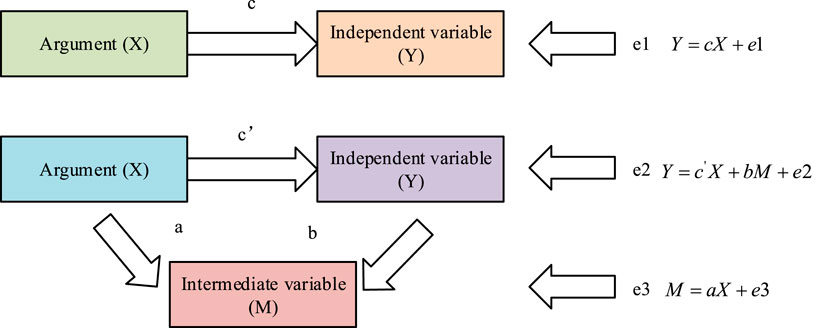
In Figure 7, there are two forms of influence of the independent variable on the dependent variable. The dependent variable
In Equation 17,
4 Empirical analysis of the impact of LC on CE development
Based on data from China Urban Statistical Yearbook during 2012–2022, 273 prefecture-level cities are selected to assess the impact of LC pilot policies on CE development. AHP and entropy method are used to measure the development level of CE, and multiple time-point DID model is used to evaluate the policy effect. Policy dummy variable and time dummy variable and their interaction terms are introduced into the model as the core explanatory variables. The robustness test is carried out by PSM method combined with multiple time-point DID model to reduce the selection bias and ensure the reliability of the results.
4.1 The dynamic effect test results of LC pilot policies
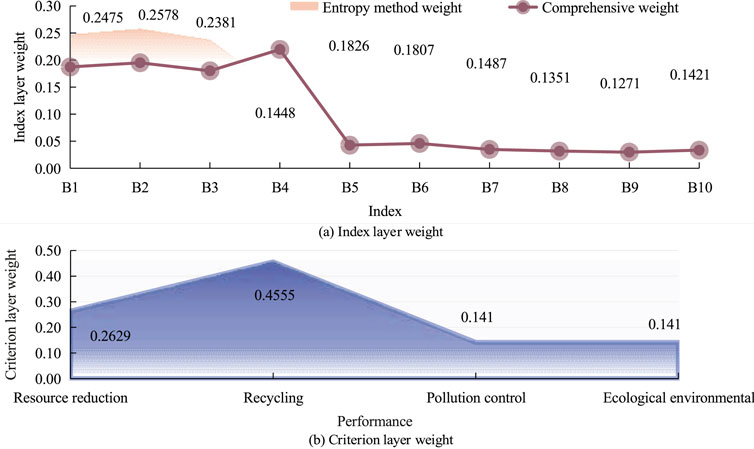
The data for the indicators of the CE performance index system in the experiment are sourced from the “China Urban Statistical Yearbook,” regional statistical yearbooks, and statistical bulletins. The data collection period spans from 2012 to 2022. The weights of each indicator in the CE index system are determined using the AHP and Entropy Method. The weight results are shown in Figure 8.
In Figure 8B, among the criterion layer, the indicator with the highest weight proportion is the reuse performance, with a weight value of 0.4555. This indicates that this indicator has the greatest impact on CE development. From Figure 8A, among the indicator layer, B1, B2, and B3 have the highest weight values, accounting for 0.2475, 0.2578, and 0.2381, respectively. The weight values of the remaining indicators range from 0.11 to 0.19. After determining the weights, the weighted function is used to measure the development performance of the CE in 273 prefecture-level cities from 2012 to 2022. The results are shown in Figure 9.
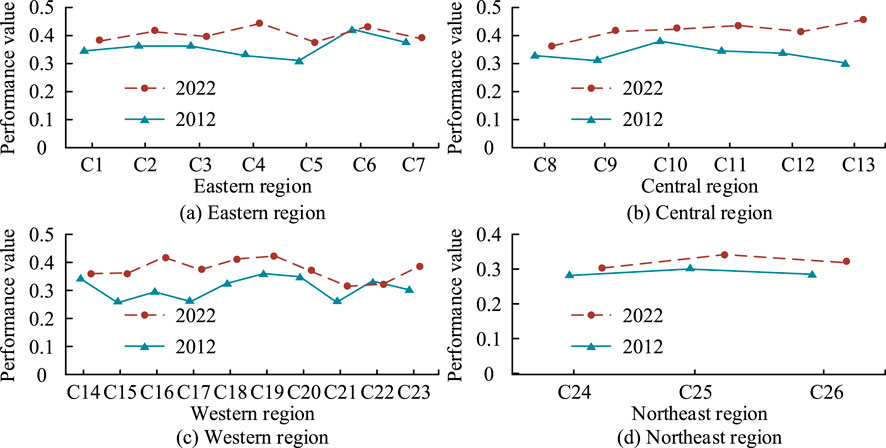
Figure 9. Comparison of CE development in different regions. (A) Eastern region (B) Central region (C) Western region (D) Northeast region.
Figure 9 reveals that the eastern and central regions show an upward trend in CE, with improvements in their CE performance from 2012 to 2022. The central region, in particular, demonstrates significant progress in CE development, gradually catching up with and surpassing the eastern region. The overall CE performance in the western and northeastern regions is far behind that of the central and eastern regions, especially the northeastern region. In general, significant differences show in CE’s spatial development in China. The central and eastern regions exhibit the most noticeable progress and are generally at a higher level nationally. However, the overall CE is still in the primary stage and developing at a relatively slow pace. Therefore, it is necessary to strengthen urban energy-saving construction and formulate corresponding energy-saving development strategies based on regional analysis.
4.2 Test results of the intermediary mechanism of the impact of LC on CE
The study selects 11-year equilibrium panel data of 273 cities in China from 2012 to 2022. Based on this, the urban CE development level index is used as the basis for calculating the dependent variable. The sample size for each variable is 3,000, and the results for the corresponding important variables are shown in Figure 10.
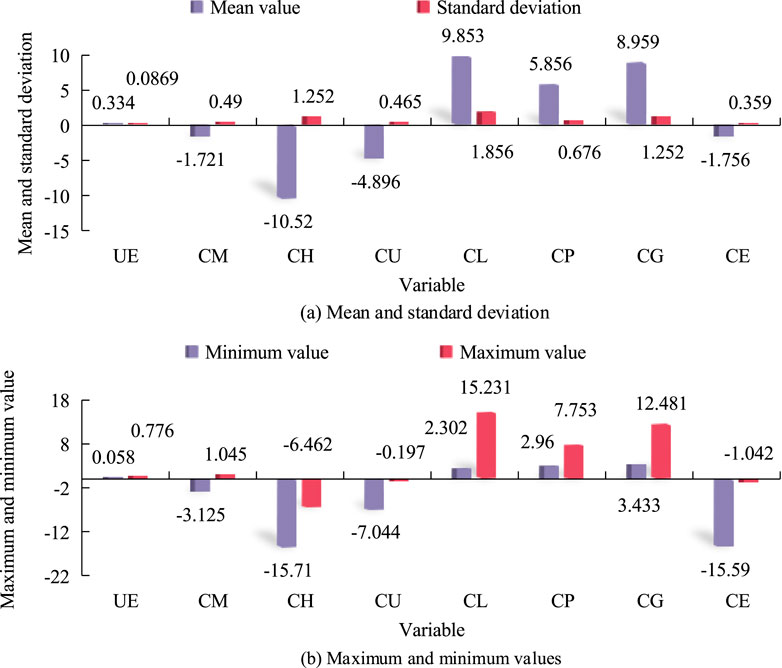
Figure 10. Descriptive statistical results of variables. (A) Mean and standard deviation (B) Maximum and minimum values.
From Figure 10, UE represents the dependent variable, the level of urban CE development. The mean value of UE is 0.334, with a standard deviation of 0.0869. The maximum and minimum values are 0.776 and 0.058. The other variables are control variables, with CH having the smallest mean value of −10.52 representing the level of human capital. The largest mean value belongs to CL, representing the level of openness, with a value of 9.853. The mean values of the other control variables range from −5 to 10. Based on the data mentioned above, the regression results obtained using the multiple time-point DID model are shown below.
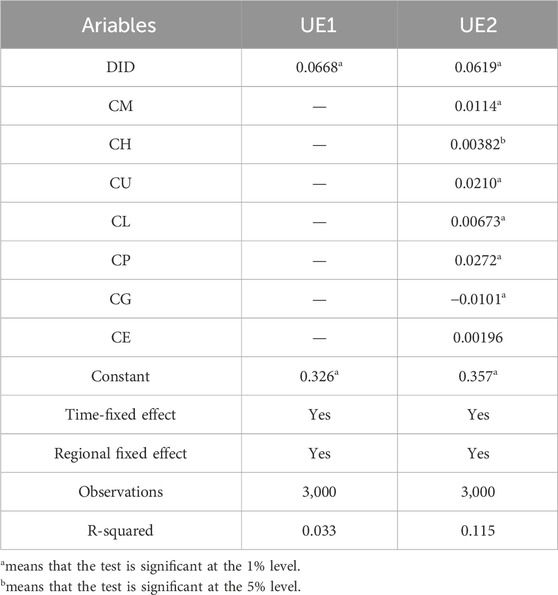
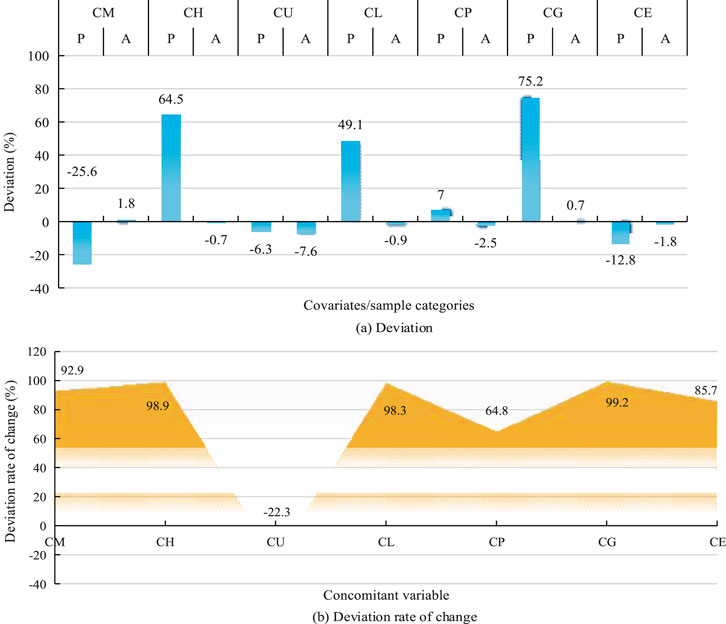
From Table 2, the coefficients of each explanatory variable reach a significance level of 1%, indicating a significant improvement in the level of CE development in LC in China without controlling for other variables. Through the analysis of the correlation between the indicators, it is found that when control variables are introduced, the level of urban CE development increases significantly by 6.3%. Regression analysis of the sample data reveals that most control variables positively impact the regional CE development level, indicating that the selected control variables in the study are reasonable. To eliminate systematic biases caused by interfering factors between two groups, the PSM-DID method is used for robustness testing. P and A represent pre-matching and post-matching, respectively. The results are shown in Figure 11.
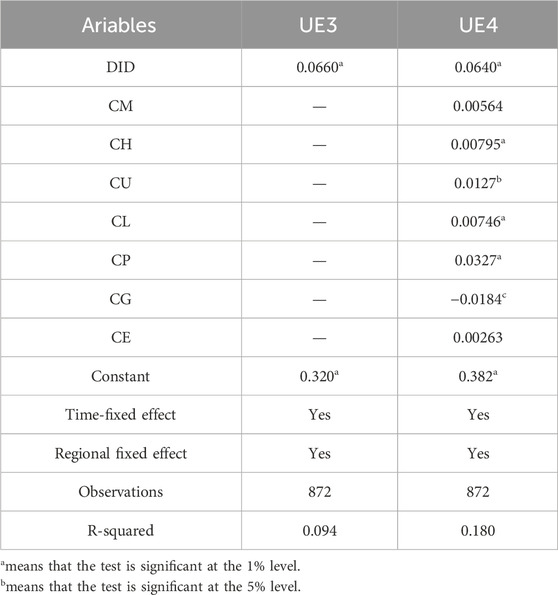
In Figure 11A, the absolute value of the standard deviation of the matched variables is all less than 10%, which is significantly lower than before matching. In Figure 11B, the deviation change rates of most variables are above 90%. Only the deviation change rate of the fixed asset investment rate for the city is negative, at −22.2%. In addition, after matching, the t-statistics are not significant. This indicates no significant difference between two groups after pairing, and the paired samples ensure the randomness of the sample, verifying that the PSM conforms to the balance hypothesis. Based on the city variables retained by PSM, a multiple time-point DID model is performed again. Regression results are shown in Table 3.
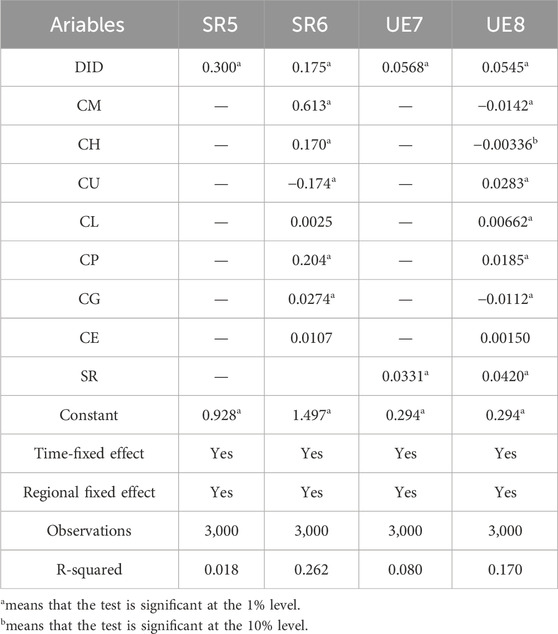
From Table 3, after solving endogeneity through the PSM-DID model, the LC still improves CE development in cities. After controlling for variables, the LC construction improves the performance of urban CE development by about 6.42%. The results are significant at the 1% level and are consistent with previous empirical results. This shows that LC’s implementation promotes China’s urban CE development. The intermediary effect of industrial structure rationalization are shown in Table 4.
From Table 4, SR5 and SR6 show the regression results of Equation 17. The coefficients of DID have reached the significant level of 1%, indicating that establishing LCs in China can effectively promote the coordinated development among the first, second, and third industries in the region. From UE7 and UE8, after introducing control variables, the coefficients of social support and social support degree are positive and significant at the 1% level. This indicates that under the condition of maximizing the output of the first, second, and third industries, the optimization of the regional industrial structure is promoted, and the rationalization of the industrial structure plays a partial intermediary effect. The empirical results of the intermediary effect model of green technology progress are shown in Table 5.
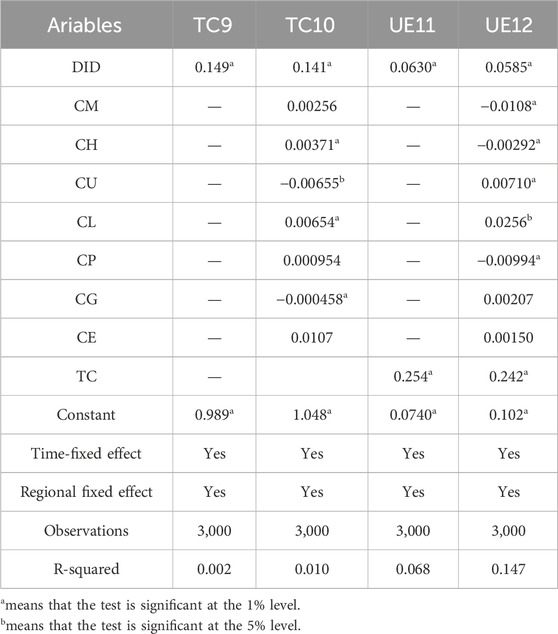
From Table 5, DID’s coefficient is significantly positive from the regression results of TC9 and TC10. This shows that LC construction can improve the regional green technological innovation ability. From the two columns of UE11 and UE12, the effect of green technology progress on CE development reaches the significant level of 1%, regardless of whether control variables are introduced or not. This means that LC pilots can promote China’s overall factor green technology progress and thus promote the development of CE. Table 6 shows the empirical results of the intermediary effect model of energy consumption structure upgrading.
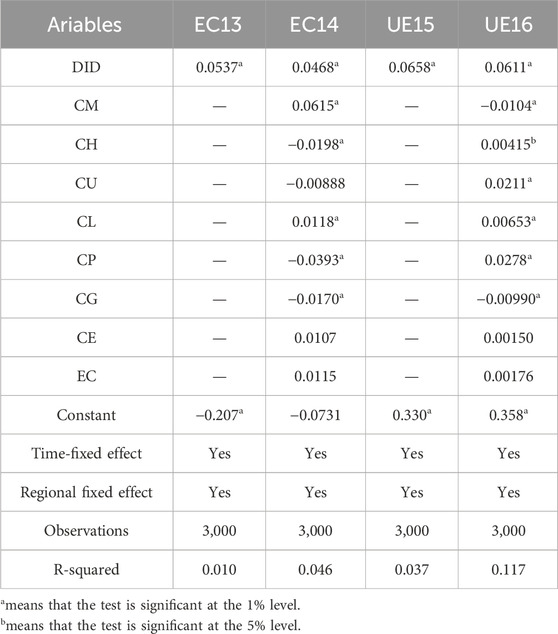
From Table 6, at a confidence level of 1%, the impact of LC pilot policy on energy consumption structure is positive, indicating that LC construction significantly optimizes the adjustment of energy consumption structure. Further examination reveals a significant positive correlation between LC and the coefficient of energy consumption structure. This means that LC policies reduce coal and other energy consumption, that is, optimize the energy consumption structure, thereby promoting urban CE, which is consistent with the expected conclusions of the research.
5 Discussion and suggestions
This paper constructs a model of the impact of LC pilot policies on the development of urban CE. Using the panel data of 273 prefecture-level cities from 2012 to 2022, this paper analyzes the impact of LC construction on the development of CE through the multiple time-point DID model. The results show that the CE development level of low-carbon pilot cities has been significantly improved, and the increase rate is 6.3% when other variables are controlled. Further robustness test through the PSM-DID model confirms that this policy significantly improves the city’s CE development performance, about 6.42%. Yu and Zhang, (2021) also proved that the LC pilot policy significantly improved the efficiency of carbon emission reduction by combining the DID method with the PSM method. Wen et al. (2022) found that the LC pilot policy significantly improved the carbon emission efficiency through the PSM method and DID method. Consistent with the above findings, the study further validates the positive economic and environmental impacts of pilot LC policies. This paper uses the method of the AHP and entropy to construct the evaluation index system of urban CE development, which makes up for the shortage of a single evaluation system in previous studies. The effectiveness of the LC pilot policy is more accurately verified by the multiple time-point DID and PSM method, and the robustness of the results is ensured. For the first time, from the three aspects of industrial structure rationalization, green technology innovation, and energy consumption structure optimization, the mediation effect of LC pilot policy on CE development is analyzed in detail. This provides a more specific reference for policy formulation.
6 Conclusion
To address the problem of economic development constraints on the environment and resources while climate change is taking place, the net effect of LC on urban CE development was explored. This study used a scientific method combining the AHP and entropy weight to calculate the level of CE development in cities at all levels in China. Based on this, the CE development in all regions of the country was evaluated. Using panel data from 273 provinces and cities from 2012 to 2022, the multiple time-point DID model and intermediary effect model were adopted to analyze LC’s effect on urban CE development. The LC pilot policy has promoted the coordinated development of primary, secondary and tertiary industries in the region, optimized the industrial structure, and improved economic benefits and environmental quality. This policy reduced industries with high pollution and high energy consumption, encouraged the development of green industries, and significantly promoted the innovation and application of green technologies. It also improved resource utilization efficiency, reduced environmental pollution, and promoted the development of energy conservation and emission reduction. Based on this, the following suggestions are put forward: First, the coverage of LC pilot should be expanded to more small and medium-sized cities and underdeveloped areas to improve the national CE level. Second, it is necessary to strengthen cooperation and exchange across provinces, cities, and counties, establish regional cooperation mechanisms, share green technologies and management experiences, and promote common development. Third, the energy pricing system should be improved, and a new energy pricing mechanism should be established to guide the rational use of energy. Fourth, research and development investment in green technologies, especially in the fields of energy conservation, environmental protection, and clean energy, should be increased. Policy incentives and financial support should be provided to encourage technological innovation and enhance international competitiveness. Fifth, according to the resource endowment and development needs of each region, scientific development plans should be formulated to promote the green industry to become a pillar industry. Finally, the promotion and education of environmental protection and low-carbon lifestyle should be strengthened, thereby forming a green development pattern of multi-party cooperation. Although this study covers 273 prefecture-level cities nationwide, differences in economic foundation, policy implementation, and environmental conditions may affect universality. Future research should use data with longer time spans and consider regional differences to develop more targeted policy recommendations.
Data availability statement
The original contributions presented in the study are included in the article/supplementary material, further inquiries can be directed to the corresponding author.
Author contributions
SX: Supervision, Writing–review and editing. YL: Investigation, Writing–original draft. JR: Investigation, Writing–original draft. WW: Investigation, Writing–original draft.
Funding
The author(s) declare that no financial support was received for the research, authorship, and/or publication of this article.
Conflict of interest
The authors declare that the research was conducted in the absence of any commercial or financial relationships that could be construed as a potential conflict of interest.
Publisher’s note
All claims expressed in this article are solely those of the authors and do not necessarily represent those of their affiliated organizations, or those of the publisher, the editors and the reviewers. Any product that may be evaluated in this article, or claim that may be made by its manufacturer, is not guaranteed or endorsed by the publisher.
References
Akinbobola, A., and Fafure, T. (2021). Assessing the impact of urbanization on outdoor thermal comfort in selected local government areas in ogun state, Nigeria. J. Environ. Sci. TE 5 (1), 120–139. doi:10.36263/nijest.2021.01.0243
Budziński, W., and Czajkowski, M. (2022). Endogeneity and measurement bias of the indicator variables in hybrid choice models: a Monte Carlo investigation. Environ. Resour. Econ. 83 (3), 605–629. doi:10.1007/s10640-022-00702-0
Chen, H., Guo, W., Feng, X., Wei, W., Gong, W., Feng, Y., et al. (2021). The impact of low-carbon city pilot policy on the total factor productivity of listed enterprises in China. Resour. Conservation Recycl. 169 (2), 105457–105458. doi:10.1016/j.resconrec.2021.105457
Chen, L., Duan, D., Mishra, A. R., and Alrasheedi, M. (2022). Sustainable third-party reverse logistics provider selection to promote circular economy using new uncertain interval-valued intuitionistic fuzzy-projection model. J. Enterp. Inf. Manag. 35 (4/5), 955–987. doi:10.1108/JEIM-02-2021-0066
Chen, P., Dagestani, A. A., and Kim, S. K. (2023a). Corporate social responsibility and green exploratory innovation-the moderating role of three environmental regulations. Technol. Analysis and Strategic Manag., 1–13. doi:10.1080/09537325.2023.2196585
Chen, P., and Dagestani, A. A. (2023). What lies about circular economy practices and performance? Fresh insights from China. JCP 416, 137893. doi:10.1016/j.jclepro.2023.137893
Chen, P., Zhao, R., and Chu, Z. (2023b). The relationship between dynamic monitoring network plans and eco-efficiency-New evidence from atmospheric quality monitoring policy in China. JEM 384 (15), 119297. doi:10.1016/j.jenvman.2023.119297
Deng, L., and Shangguan, Z. (2021). High quality developmental approach for soil and water conservation and ecological protection on the loess plateau. Front. Agric. Sci. Eng. Engl. 8 (4), 501–511. doi:10.15302/J-FASE-2021425
Enzai, D. U., Xia, N., Guo, Y., Tian, Y., Binghe, L. I., and Liu, X. (2022). Ecological effects of nitrogen deposition on urban forests: an overview. FASE 9 (3), 445–456. doi:10.15302/J-FASE-2021429
Gan, C., Wang, K., Voda, M., and Chen, L. (2023). Analysis on the impact of technological innovation on tourism development: the case of Yangtze River Delta Urban Agglomeration in China. Tour. Econ. 28 (5), 1251–1271. doi:10.1177/13548166221102590
Gong, Z., Guo, K., and He, X. (2021). Corporate social responsibility based on radial basis function neural network evaluation model of low-carbon circular economy coupled development. Complexity 2021 (5), 1–11. doi:10.1155/2021/5592569
Guo, B., Feng, Y., and Hu, F. (2024). Have carbon emission trading pilot policy improved urban innovation capacity? Evidence from a quasi-natural experiment in China. Environ. Sci. Pollut. R. 31 (7), 10119–10132. doi:10.1007/s11356-023-25699-x
Han, X., Zhang, C., Tang, Y., and Ye, Y. (2022). Physical-data fusion modeling method for energy consumption analysis of smart building. Mpce 10 (2), 482–491. doi:10.35833/MPCE.2021.000050
Ismail, N., and Ouahrani, D. (2022). Modelling of cooling radiant cubicle for an office room to test cooling performance thermal comfort and energy savings in hot climates. Energy 244 (1), 123185–124139. doi:10.1016/j.energy.2022.123185
Khuu, T., Schleif, T., Mohamed, A., Mitra, S., Johnson, M. A., Valdiviezo, J., et al. (2023). Intra-cluster charge migration upon hydration of protonated formic acid revealed by anharmonic analysis of cold ion vibrational spectra. J. Phys. Chem. A 127 (36), 7501–7509. doi:10.1021/acs.jpca.3c03971
Lacerda, L. I. D. A., José, A. R., Santos, C. A. G., Silva, R. M. D., Silva, A. M., and Nascimento, T. V. M. D. (2021). Urban forest loss using a GIS-based approach and instruments for integrated urban planning: a case study of Jo?o Pessoa, Brazil. J. Geogr. Sci. 31 (10), 1529–1553. doi:10.1007/s11442-021-1910-4
Li, R. (2024). Evaluation method of agricultural sports tourism circular economy benefits based on AHP-BP neural network from the perspective of low-carbon ecology. PAK J. AGR Sci. 61 (1), 433–443. doi:10.21162/PAKJAS/24.31
Liu, F. (2022). The impact of China’s low-carbon city pilot policy on carbon emissions: based on the multi-period DID model. Environ. Sci. Pollut. R. 30 (34), 81745–81759. doi:10.1007/s11356-022-20188-z
Liu, J., Liu, J., Fan, L., Yi, L., Song, H., and Zeng, Q. (2021). Intelligent building load scheduling based on multi-objective multi-verse algorithm. EPE 13 (4), 19–29. doi:10.4236/epe.2021.134B003
Liu, Z., Wang, J. ., and Thomas, C. W. (2022a). What motivates local sustainability policy action in China? The case of low-carbon city pilot program. Urban Aff. Rev. 58 (3), 767–798. doi:10.1177/1078087421995241
Liu, Z., Wang, J., and Thomas, C. W. (2022b). What motivates local sustainability policy action in China? The case of low-carbon city pilot program. URBAN. Aff. Rev. 58 (3), 767–798. doi:10.1177/1078087421995241
Mahdiraji, E. A. (2021). Fault locating in distributed generation network based on the use of phasor unit measurement in oil and gas industry. Sami Publ. Co. 3 (2), 147–159. doi:10.22034/JCR.2020.120918
Maurício, L. F., Barbosa, M. F., Gomes, E. P. C., Nascimento, A. P. B. D., Luca, E. F. D., and Silva, K. G. D. (2021). Ecological implications of twentieth century reforestation programs for the urban forests of So Paulo Brazil: a study based on litterfall and nutrient cycling. Ecol. PROCESS 10 (1), 1–13. doi:10.1186/s13717-021-00292-7
Okorie, O., Salonitis, K., Charnley, F., Moreno, M., Turner, C., and Tiwari, A. (2018). Digitisation and the circular economy: a review of current research and future trends. Energies 11 (1), 3009. doi:10.3390/en11113009
Preethi, P., and Mamatha, H. R. (2023). Region-based convolutional neural network for segmenting text in epigraphical images. Artif. Intell. Appl. 1 (2), 119–127. doi:10.47852/bonviewAIA2202293
Qiu, S., Wang, Z., and Liu, S. (2021). The policy outcomes of low-carbon city construction on urban green development: evidence from a quasi-natural experiment conducted in China. Sustain. CITIES. Soc. 66, 102699–102715. doi:10.1016/j.scs.2020.102699
Ramon, M., Ribeiro, A. P., Theophilo, C. Y. S., Moreira, E. G., Camargo, P. B., Bragança, C. A., et al. (2023). Assessment of four urban forest as environmental indicator of air quality: a study in a brazilian megacity. URBAN Ecosyst. 26 (1), 197–207. doi:10.1007/s11252-022-01296-7
Ramsey, D., Bouscayrol, A., Boulon, L., Desreveaux, A., and Vaudrey, A. (2022). Flexible simulation of an electric vehicle to estimate the impact of thermal comfort on the energy consumption. IEEE T Transp. Electr. 8 (2), 2288–2298. doi:10.1109/TTE.2022.3144526
Rodríguez-Antón, J. M., Rubio-Andrada, L., Celemín-Pedroche, M. S., and Ruíz-Peñalver, S. M. (2022). From the circular economy to the sustainable development goals in the European Union: an empirical comparison. Int. Environ. AGREEM-P 22 (1), 67–95. doi:10.1007/s10784-021-09553-4
Song, C., and Ouyang, Z. (2020). Gross Ecosystem Product accounting for ecological benefits assessment: a case study of Qinghai Province. Acta Ecol. Sin. 40 (10), 3207–3217. doi:10.5846/stxb202004260999
Sun, Y., and Li, H. (2021). “Data mining for evaluating the ecological compensation,” static and dynamic benefits of returning farmland to forest. ERAC 21, 111524. doi:10.1016/j.envres.2021.111524
Teymouri, E., Moradloo, A. J., and Abbasi, S. (2022). Seismic analysis of steel tanks subjected to transitional-rotational components of earthquakes. J. Earthq. Eng. 27 (11), 3153–3179. doi:10.1080/13632469.2022.2124558
Wang, Z., Sun, J., Du, Y., and Niu, W. (2021). Conservation tillage improves the yield of summer maize by regulating soil water, photosynthesis and inferior kernel grain filling on the semiarid Loess Plateau, China. J. Sci. food Agric. 102 (6), 2330–2341. doi:10.1002/jsfa.11571
Wen, S., Jia, Z., and Chen, X. (2022). Can low-carbon city pilot policies significantly improve carbon emission efficiency? Empirical evidence from China. J. Clean. Prod. 346 (20), 131131–131215. doi:10.1016/j.jclepro.2022.131131
Yan, J., Yan, J., Zhao, J., Zhao, J., Yang, X., Yang, X., et al. (2021). Does low-carbon city pilot policy alleviate urban haze pollution? Empirical evidence from a quasi-natural experiment in China. Int. J. Env. Res. PUB. He. 18 (21), 11287. doi:10.3390/ijerph182111287
Yang, L., and Yan, W. (2021). Urban ecological forestry analysis based on FPGA and dynamic image sampling. Microprocess Microsy 81 (9), 1–6. doi:10.1016/j.micpro.2020.103675
Ye, M., Deng, F., Yang, L., and Liang, X. (2022). Evaluation of regional low-carbon circular economy development: a case study in Sichuan province, China. Int. J. Clim. Chang. Str. 22 (14), 54–77. doi:10.1108/IJCCSM-03-2021-0023
Yu, Y., and Zhang, N. (2021). Low-carbon city pilot and carbon emission efficiency: quasi-experimental evidence from China. Energ. Econ. 96 (2), 105125–125. doi:10.1016/j.eneco.2021.105125
Zhang, W., Li, G., and Guo, F. (2022). Does carbon emissions trading promote green technology innovation in China? Appl. Energ. 315 (2), 119012–12. doi:10.1016/j.apenergy.2022.119012
Keywords: low-carbon, pilot policies, city, circular economy, PSM-DID
Citation: Xiao S, Liu Y, Rong J and Wang W (2024) The impact of pilot policies for low carbon city construction on the development of urban circular economy multiple time-point difference-in-differences model. Front. Environ. Sci. 12:1404676. doi: 10.3389/fenvs.2024.1404676
Received: 21 March 2024; Accepted: 04 October 2024;
Published: 23 October 2024.
Edited by:
Martin Siegert, University of Exeter, United KingdomReviewed by:
Xiaochun Zhao, Anhui University, ChinaJulianna Crippa, Federal Technological University of Paraná, Brazil
Copyright © 2024 Xiao, Liu, Rong and Wang. This is an open-access article distributed under the terms of the Creative Commons Attribution License (CC BY). The use, distribution or reproduction in other forums is permitted, provided the original author(s) and the copyright owner(s) are credited and that the original publication in this journal is cited, in accordance with accepted academic practice. No use, distribution or reproduction is permitted which does not comply with these terms.
*Correspondence: Shumei Xiao, eHNtNTAzQHNpbmEuY29t
 Shumei Xiao
 Yulan Liu