 Wei Li
 Jing Guan3
- 1Yinshanbeilu National Field Research Station of Desert Steppe Eco-hydrological System, China Institute of Water Resources and Hydropower Research, Beijing, China
- 2Institute of Water Resource for Pastoral Area Ministry of Water Resources of the People’s Republic of China, Hohhot, China
- 3Yellow River Engineering Consulting Co., Ltd, Zhengzhou, China
- 4Shaanxi Normal University, Xi’an, China
Introduction: With global warming, the disaster losses caused by extreme precipitation events are increasing. The poor natural conditions and climate change make the arid and semi-arid mountainous grassland area a sensitive region of climate change. The study on the spatio-temporal variation characteristics of extreme precipitation events in this region is helpful to improve the ability of climate prediction and disaster prevention and reduction in grassland.
Methods: Based on the daily precipitation data of four meteorological monitoring stations in the Yinshanbeilu from 1970 to 2020, the trend analysis, M-K test and wavelet analysis were used to select seven typical extreme precipitation indicators to analyze the temporal and spatial characteristics of extreme precipitation.
Results and Discussion: The results showed that the precipitation in the Yinshanbeilu increased in the past 51a, and the number of heavy rain days increased significantly. The significance test of CDD and CWD showed that the number of continuous dry days and continuous wet days decreased abruptly. The spatial analysis showed that the high value areas of R95p, R95d and PRCRTOT were all located in Siziwang Banner, and it could be concluded that the extreme precipitation risk was the highest in Siziwang Banner, while the low value areas of SDII, Rx1day, R95p and PRCRTOT were all located in Sonid Right Banner, which could be inferred that the Sonid Right Banner was relatively dry. The first main cycle of the seven indexes of extreme precipitation almost runs through the whole time series, and the starting point of the minimum main cycle changes inconsistent. In addition to the number of consecutive dry days, the other indices have a good correlation with annual precipitation, flood season and monthly precipitation from June to September, and July is the peak period of extreme precipitation events.
1 Introduction
Precipitation is an important source of water resources (Wang et al., 2023). Extreme precipitation occurs when the precipitation intensity exceeds a given threshold or percentile (Li et al., 2024). Extreme precipitation events are projected to occur more frequently under climate change (Cardoso Pereira et al., 2020; Tradowsky et al., 2023). This increase in extreme precipitation may lead to serious natural disasters such as urban waterlogging and flash floods, especially in arid areas (Abd-Elaty et al., 2023). The increase in the frequency of extreme precipitation poses a huge threat to the safety of life and property on a global and regional scale. (Zia et al., 2023). Therefore, by studying extreme precipitation events, we can better understand the supply and demand of water resources and formulate effective water resources management strategies. it is of great significance in regional flood prevention and disaster reduction (Mashao et al., 2023).
In recent years, researchers have used trend, abrupt change, and period algorithms to analyze extreme precipitation events in various regions. Research and explore the spatiotemporal changes of extreme precipitation index, summarize its changing rules, and improve local capabilities to cope with extreme precipitation (Zhao et al., 2024). For example, Chaubey et al. (2022) found that the frequency of heavy precipitation in mid-latitude areas has generally increased in the past 50–100 years Yang et al. (2024) analyzed the spatiotemporal characteristics of precipitation use efficiency (PUE) from 2001 to 2021 and studied climate driving factors. The climate driving force analysis showed that the regional contribution of precipitation was 19.57%. Wu et al. (2021) Based on weather station data in the middle and lower reaches of the Yangtze River from 1970 to 2018, the spatial and temporal distribution of 11 extreme precipitation indices was analyzed, and it was found that most of the mutations in extreme precipitation indices occurred in the 1980s and 1990s. In the globe, there is an increasing trend in the probability of extreme precipitation events, with a significant rise in the total amount of extreme precipitation. Moreover, tropical regions experience the highest frequency of extreme precipitation events (Alexander et al., 2006; Asadieh et al., 2014). Additionally, regions exhibiting a significant increase in extreme precipitation volume, intensity, and frequency outnumber those showing a decreasing trend (Donat et al., 2013). On an intercontinental scale, previous studies indicate extreme variability in precipitation levels, albeit lacking spatial consistency. Extreme precipitation in North America is on the rise (Peterson et al., 2008), while in Central and Western Africa, it is declining (Aguilar et al., 2009). Corresponding to global trends, China is witnessing an upward trend in the frequency and intensity of extreme precipitation events. From the 1960s to the 1980s, precipitation totals in China showed an upward trend, but have been declining since the 1980s (Peng et al., 2020). Regional studies, including those of the Yangtze River Basin and Northeast China, demonstrate the most pronounced positive trends (Wang et al., 2011).
The Yinshanbeilu in Inner Mongolia is not only the transition zone from Yinshan Mountain to the Mongolian Plateau, but also the transition area from a semi-arid to arid climate (WANG et al., 2005). The region serves as an extremely important functional area for windbreak, sand fixation, and biodiversity protection. Its ecosystem is fragile and highly sensitive to changes in precipitation. In recent years, extreme precipitation events have occurred frequently in this region, which are accompanied by flood events and have brought great challenges to the ecological security of the region. In this study, we applied precipitation data (1970–2020) from four regional rainfall stations in the grassland area at the Yinshanbeilu, i.e., Urad Middle Banner, Siziwang Banner, Damao Banner, and Sonid Right Banner. The investigation applied trend analysis, Kriging interpolation, M-K abrupt change analysis, wavelet transform, and correlation analyses to assess the spatiotemporal transformation characteristics, abrupt change characteristics, and periodic characteristics of the seven extreme precipitation indices in the study area. The results of this study may be applied to support the description of universally applicable rules, improve our ability to tackle extreme precipitation, and provide a reference for human and ecological protection, disaster early warning, and climate change.
2 Study area
Yinshanbeilu grassland area of Yinshan Mountain (107°25′E −114°26′E, 41°18′N −43°76′N) is located in the north-central region of Inner Mongolia (Figure 1). It is the transition zone between Yinshan Mountain and the Mongolian Plateau. It has a mid-temperate semi-arid continental monsoon climate, with large temperature differences between winter and summer and between day and night. Meteorological data from four weather stations in the statistical study area from 1970 to 2020 were obtained the multi-year average precipitation is 284 mm, mainly concentrated from July to September, and the multi-year average evaporation is 2,305 mm. The annual average temperature is 2.5°C, the annual average sunshine hours are 3,100 h, and the frost-free period is 83 d. The annual average wind speed is 4.5 m·s−1, with northerly and northwesterly winds prevailing in winter and spring. The annual number of windy days is 63, and the number of sandstorm days is 20–25 (Yang et al., 2024).
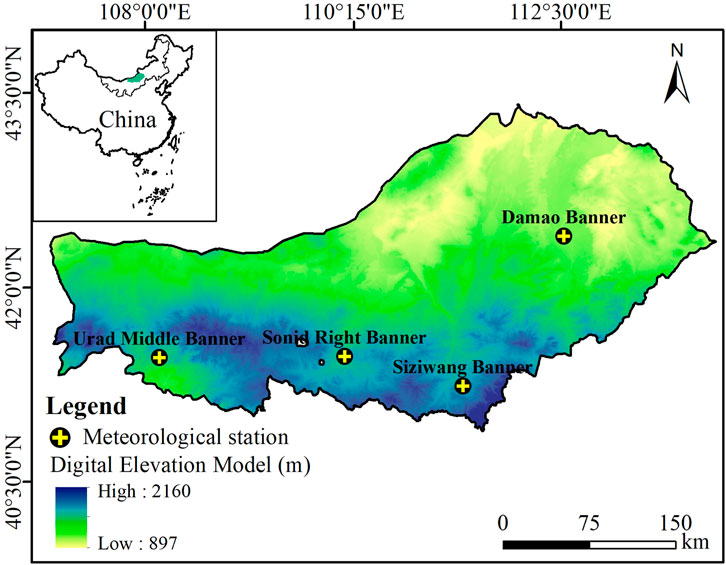
Figure 1. Study area location and site distribution map.
3 Data and methods
3.1 Data
Complete daily precipitation data for a total of 51 years (1970–2020) were used in this study. The data were retrieved from four national weather stations (https://data.cma.cn/) located in Urad Middle Banner, Siziwang Banner, Damao Banner, and Sonid Right Banner in Inner Mongolia (Figure 1).
The World Meteorological Organization (WMO) Expert Team on Climate Change Detection Monitoring and Indices (ETCCDMI) recommended 27 core indices (https://community.wmo.int/en/climate-change-detection-and-indices) to define the extreme precipitation index (Booth et al., 2012; Indices, 2019). Table 1 describes the seven extreme precipitation indices selected to quantitatively analyze the extreme precipitation characteristics in the study area. To calculate the heavy precipitation threshold and extremely heavy precipitation threshold, we first arranged the daily precipitation data (Daily precipitation ≥1 mm) from 1970 to 2020 in ascending order
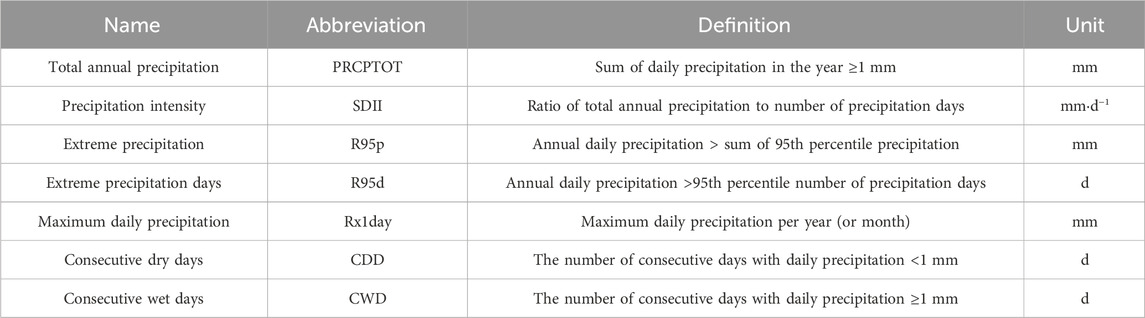
Table 1. Description of the seven extreme precipitation indices applied in this study.
3.2 Research methods
We applied the linear trend analysis method with a 10a moving average to analyze the time series of each extreme precipitation index year by year from 1970 to 2020. Mann–Kendall (M-K) abrupt change analysis and sliding T-test were applied to analyze the abrupt change characteristics of each extreme precipitation index time series (Li et al., 2020). The wavelet analysis method was used to study the periodicity of each extreme precipitation index (Rathinasamy et al., 2019). Correlation analysis was conducted using Origin software and correlation heat maps were produced using Kriging in the spatial analysis module of ArcGIS 10.7.
3.2.1 M-K test
The M-K test was used to analyze the abrupt change characteristics of each extreme precipitation index (Sa’adi et al., 2019). The M-K test is a widely used non-parametric test method in time series trend analysis. The null hypothesis
where
A value of UF > 0 indicates that the variable is increasing, while UF < 0 indicates that the variable is decreasing. A UF line and UB line exceeding the critical straight line indicates that this upward or downward trend is statistically significant. If the curves of UF and UB intersect, and the intersection is positioned between the two critical lines, then the moment corresponding to the intersection indicates the time when the abrupt change begins, described in this study as the abrupt change year.
3.2.2 Wavelet analysis
The wavelet analysis method was selected to study the periodicity of each extreme precipitation index (Beecham and Chowdhury, 2010). Each extreme precipitation index is represented by a cluster of wavelet function systems to reveal the multiple changing trends and periods present in the time series. The following equation was used to calculate the wavelet coefficient: See Eq. 3 for calculation method
where
The real-part coefficients of the wavelet were obtained from wavelet analysis using MATLAB software, and Origin drawing software was used to draw the real-part contour map of the wavelet coefficients. The isoline diagram of the real part of the wavelet coefficient can be used to reflect the periodic changes of the time series at different time scales and its distribution.
4 Results
4.1 Extreme precipitation index changes
The interannual variation diagram and statistical table of the extreme precipitation indices in various regions at the Yinshanbeilu during 1970–2020 are shown in Figure 2 and Table 2, respectively. The 10a moving average curve indicates that there was a general increasing trend in precipitation intensity (SDII) in the study area, with a non-significant change rate of 0.08 mm·d−1·(10a)−1 (Figure 2). There was a rapid decrease in SDII in the early 1980s, with the minimum value (i.e., 2.6 mm·d−1) occurring in 1982. The SDII was relatively stable until the early 1990s, and it showed a V-shaped fluctuation change from 1990 to 2010. The maximum 1-day precipitation (RX1day) demonstrated a fluctuating upward trend, with a change rate of 0.87 mm·(10a)−1. The 10a moving average RX1day continued to decline from the 1980s to the 2010s, reaching a minimum value of 17.96 mm in 2009, followed by a rapid increasing trend.
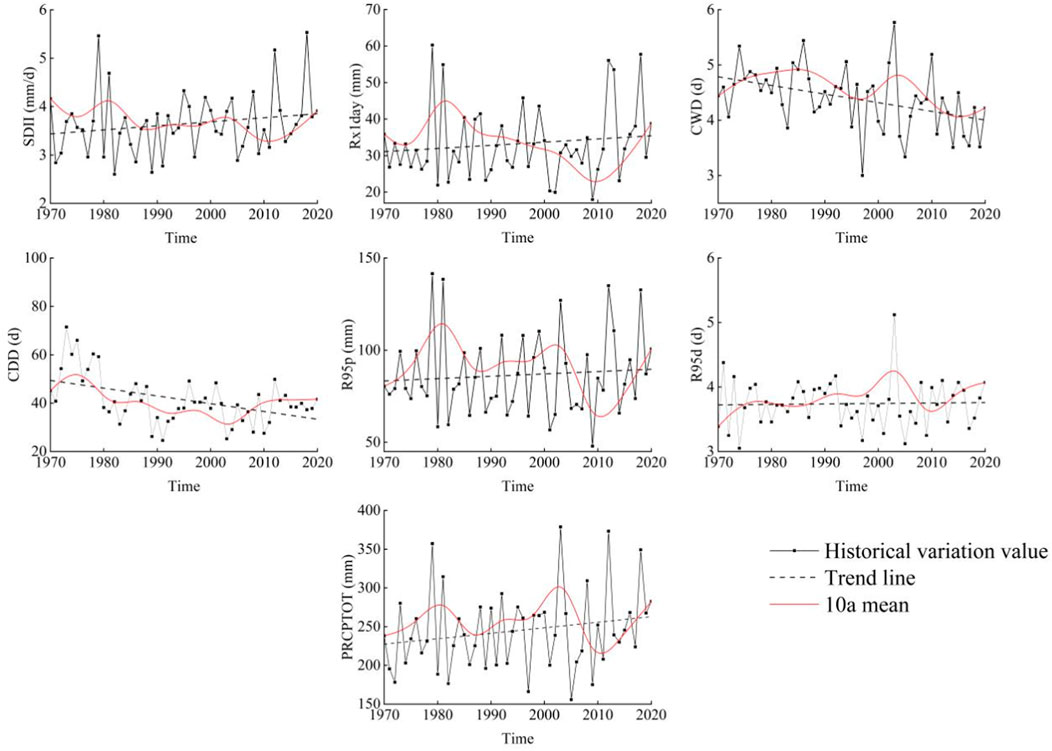
Figure 2. Interannual changes in extreme precipitation indices in the grassland area at Yinshanbeilu during 1970–2020.
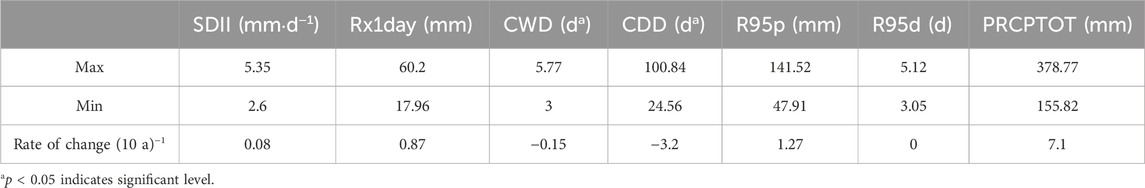
Table 2. Statistics of extreme precipitation indices in the grassland area at Yinshanbeilu during 1970–2020.
During the study period, both the number of consecutive wet days (CWD) and the number of consecutive dry days (CDD) showed a decreasing trend, which reached the 0.05 significance level. The CDD decreased at a rapid rate, with an average decrease of 3.2 d every 10 years. The maximum CWD (5.77 d) occurred in 2003, and the minimum (3 d) occurred in 1997. The maximum CDD (100.84 d) occurred in 2001 and the minimum of 24.56 d occurred in 1991. Extreme precipitation (R95p) increased slowly at a rate of 1.27 mm·(10a)−1, where the maximum (141.52 mm) and minimum (47.91 mm) values occurred in 1979 and 2009, respectively. The change rate of extreme precipitation days (R95d) in the past 50 years was 0, with a maximum value of 5.12 d in 2003 and a minimum value of 3.05 d in 1974. The annual total precipitation (PRCPTOT) showed an upward trend from 1961 to 2010, with a change rate of 7.1 mm·(10a)−1. Its maximum (378.77 mm) and minimum (152.82 mm) values occurred in 2003 and 2005, respectively.
Overall, although SDII, RX1day, R95p, and PRCPTOT changed at different rates, they all showed an increasing trend. This indicates that, under the general trend of global warming during the study period, precipitation generally showed an increasing trend at the Yinshanbeilu in the northern arid area. The number of heavy rain days increased significantly and the overall climate gradually became humid. This is consistent with a previous report on the changing trends of extreme precipitation events in the arid areas in the northwestern China during 1960–2010 (Wang et al., 2023).
4.2 Spatial distribution
The average extreme precipitation indices of the four stations in the grassland area at Yinshanbeilu were calculated from 1970 to 2020. The Kriging interpolation method in ArcGIS software was used for spatial interpolation. The spatial distribution characteristics of each extreme precipitation index were obtained, as shown in Figure 3.
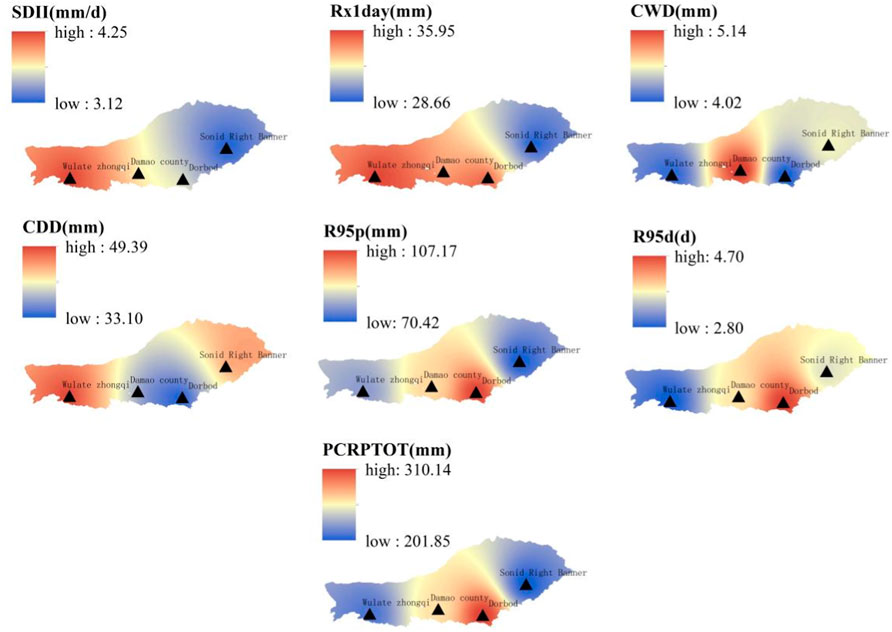
Figure 3. Spatial distribution of extreme precipitation index at Yinshanbeilu during 1970–2020.
The extreme precipitation indices SDII and Rx1day in the study area showed a gradually decreasing trend from southwest to northeast. The maximum CWD and CDD values were observed in Damao Banner (5.14 d) and Urad Middle Banner (49.39 d), respectively. The minimum CWD and CDD values were both observed in Siziwang Banner, at 4.02 d and 33.10 d, respectively. The maximum R95p, R95d, and PRCRTOT values were observed in Siziwang Banner, with values of 107.17 mm, 4.07 d and 310.14 mm, respectively. The minimum R95p (70.42 mm) and PRCRTOT (201.85 mm) values were observed in Sonid Right Banner. The low value area of R95d (2.80 d) occurred in the Urad Middle Banner.
Combined with the spatial distribution map, the highest values of R95p, R95d, and PRCRTOT all occurred in Siziwang Banner. This indicates that Siziwang Banner has the highest risk of extreme precipitation. The minimum SDII, Rx1day, R95p, and PRCRTOT values all occurred in Sonid Right Banner, indicating that Sonid Right Banner has a low precipitation level and is relatively dry. The extreme precipitation indices show significant spatial differences across the study area, with the risk of extreme precipitation significantly greater in the southeast than in the northwest.
4.3 Abrupt change analysis
Using the M-K test method, we conducted an abrupt change analysis for extreme precipitation indices in the grassland area at Yinshanbeilu during 1970–2020 (Figure 4), with a significance level of 0.05. The UF curves of CWD and CDD (Figure 4) exceed the critical line and UF < 0. Other indices only exceed the critical line for a few years and UF > 0, indicating a clear downward trend in the regional precipitation intensity and the number of continuous precipitation days. The other indices show a non-significant upward trend.
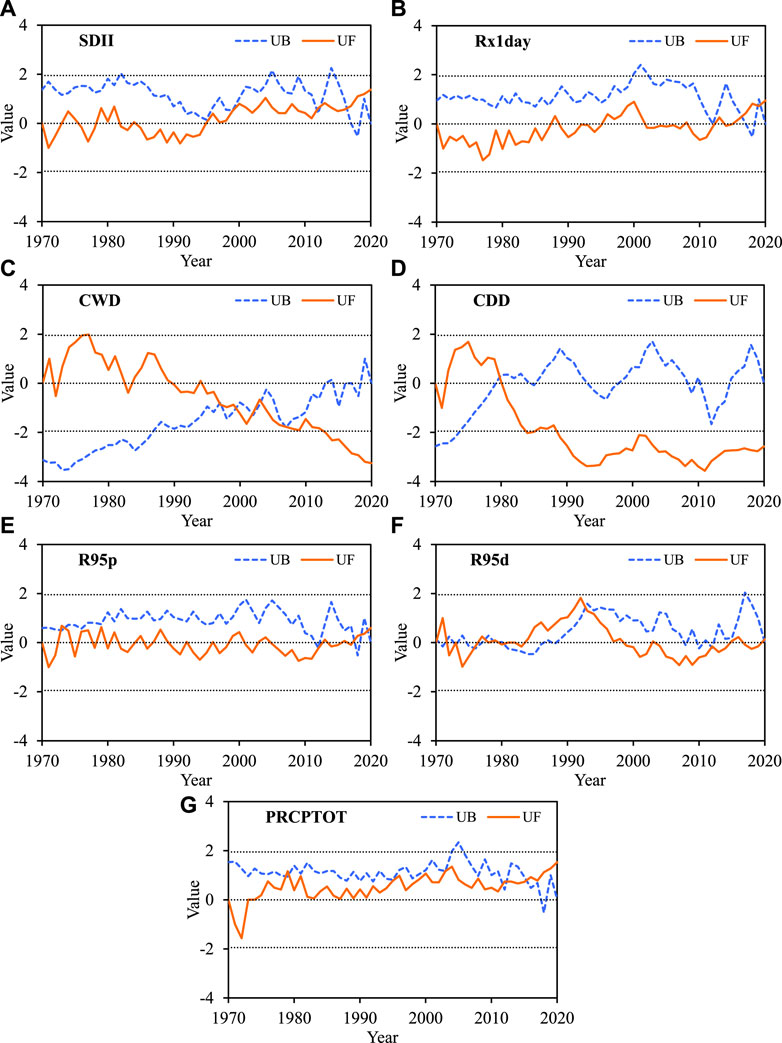
Figure 4. M-K mutation trend of extreme precipitation index in the grassland area at Yinshanbeilu from 1970 to 2020 (UF (Upward Fluctuation) and UB (Downward Fluctuation) curve distributions represent the changes in upward and downward trends in time series data).
The UB and UF curves of each extreme precipitation index have intersection points and are within the confidence interval (Figure 4), indicating that the precipitation index has experienced multiple abrupt changes over the study period. The abrupt change points of CDD, R95d, and PRCPTOT were all in the 20th century. Comparative analysis combined with the sliding T-test showed that the abrupt change point of SDII appeared in 2012, and that of R95d appeared in 1994, indicating that the precipitation intensity and the number of extreme precipitation days in the grassland area at Yinshanbeilu suddenly increased. Both passed the significance test, but there was no clear abrupt change. The abrupt changes in CDD and CWD occurred in 1993 and 1979, respectively. They reached significant levels and the abrupt changes were evident, indicating that the number of consecutive dry and consecutive wet days suddenly decreased. The remaining two extreme precipitation indices showed no significant abrupt change points.
4.4 Wavelet analysis
With the help of the Wavelet Analyzer tool in MATLAB 2018a and origin-assisted mapping, the contour maps of the real part of the wavelet coefficient of the 51-year extreme precipitation index in the Yinshanbeilu are generated. From cold to warm colors, it represents the increase in the fingertip precipitation index. The periods of wavelet analysis of each index are shown in Table 3. The cyclical characteristics of the extreme precipitation index series are analyzed (Figure 5). The SDII, CWD, CDD, R95p, and PRCPTOT indices contain four periods: Rx1day has three periods, and R95d has one period. The first main period of the seven indices was 55–56 a, which shows clear cyclical changes of abundance and drought. The average length of the four SDII periods were 25 a, 18 a, 24 a, and 5 a. In the entire time series, the first and second main periods were relatively regular and prominent, the third main period was not prominent, and the fourth main period began after 1985 (Figure 5A). The three average periods of Rx1day were 31 a, 5 a, and 17 a, with clear changes in the first and third periods. The average periods of CWD were 33 a, 23 a, 8 a and 4 a. The third and fourth main periods showed evident patterns after 2013 and 1978, respectively. The average periods of CDD were 30 a, 12 a, 24 a, and 6 a. Except for the first main period, the changes in other periods were not evident. The average periods of R95p were 35 a, 19 a, 23 a, and 4 a, and the average periods of PRCPTOT were 36 a, 20 a, 23 a, and 4 a. The period changes of these two indicators were basically the same. The period of R95p changed significantly throughout the time series. The fourth main period of PRCPTOT changed significantly after 1998. The R95d index contained only one main period, corresponding to an average period of 32 d, and the change was significant. In general, the average period corresponding to the first main period of the seven indices of extreme precipitation had two main variation ranges: 25 a and 30–36 a, and this period continued through almost the entire time series. The average period corresponding to the minimum main period was 4–6 a. In addition, we found that the starting point of each index changes inconsistently and was regional.
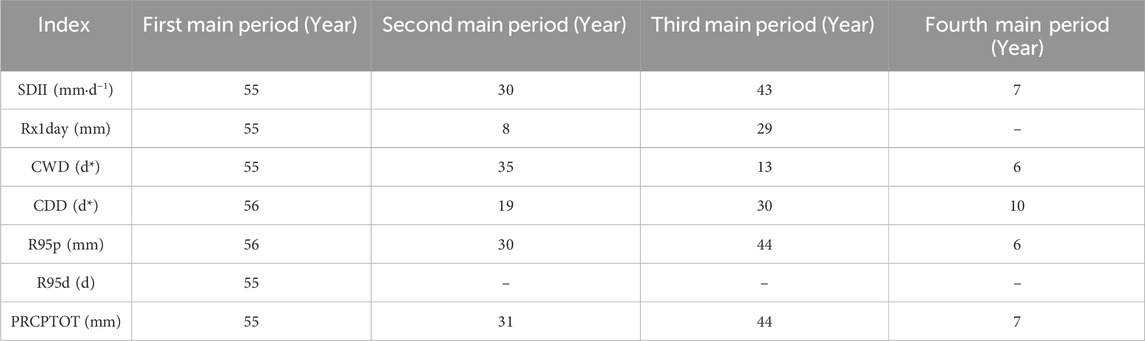
Table 3. Cyclical variation characteristics of extreme precipitation indices in the grassland area at Yinshanbeilu during 1970–2020.
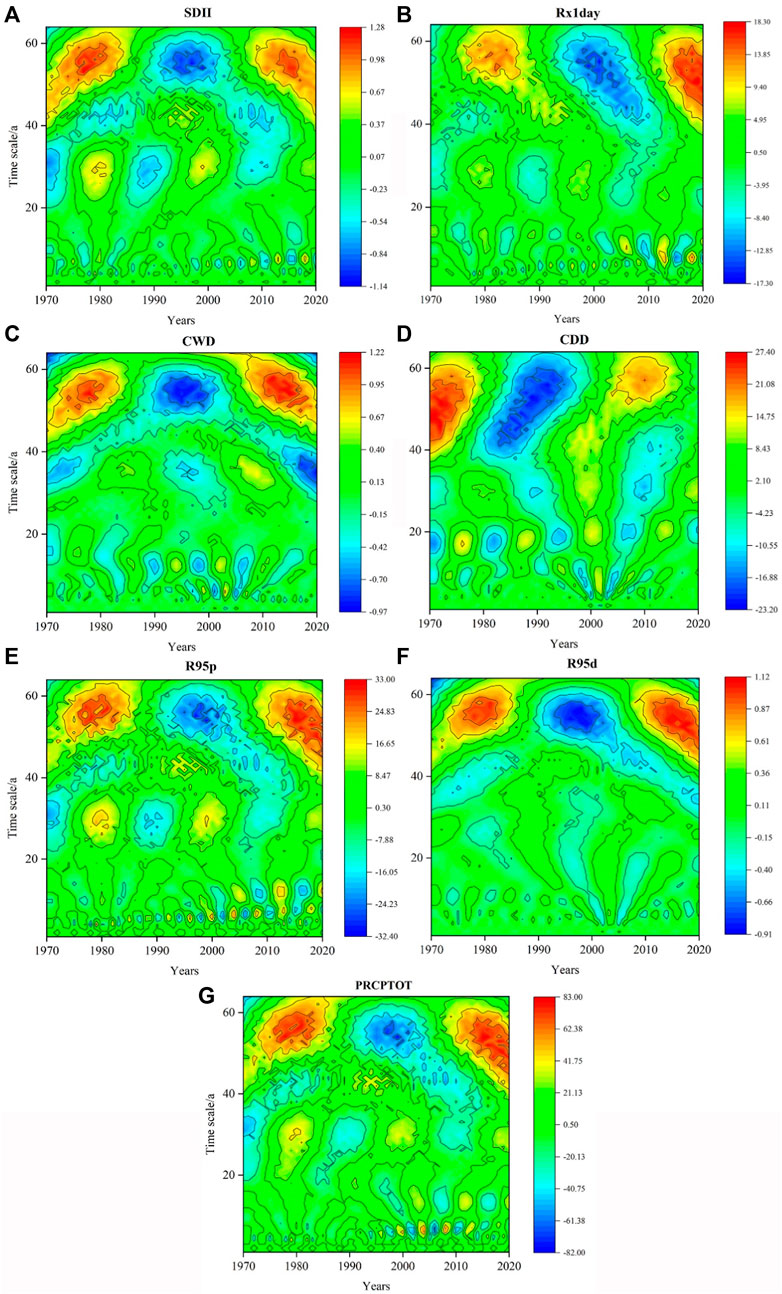
Figure 5. Contour map of the real part of the wavelet coefficient of extreme precipitation index in the grassland area at Yinshanbeilu.
4.5 Correlation between extreme precipitation indices and multi-scale precipitation
Figure 6 shows a correlation heat map based on correlation analysis and calculation of each extreme precipitation index and the total precipitation at each scale. Overall, except for CDD, good correlations were observed between the extreme precipitation indices and the annual precipitation, flood season, and monthly precipitation from June to September. There was a strong positive correlation between PRCPTOT and the total precipitation in the flood season, indicating that the precipitation in the flood season had a significant indicative effect on the annual precipitation. This indicates that the precipitation in the flood season has a decisive role in the intensity of annual precipitation, and extreme precipitation between June and September in the flood season. The total annual precipitation showed a strong positive correlation with SDII and R95p, and a positive correlation with Rx1day and R95d, indicating a significant impact of these indices on annual precipitation. By comparing the correlation between various extreme precipitation indices and precipitation in the flood and the non-flood seasons, we observed strong correlations between the extreme precipitation indices and flood season precipitation. Further correlation analyses on precipitation from June to September during the flood season revealed that the correlations with extreme precipitation indices in July during the entire flood season were stronger than in other months. This indicates that July is the main month associated with high occurrence of extreme precipitation events in the study area.
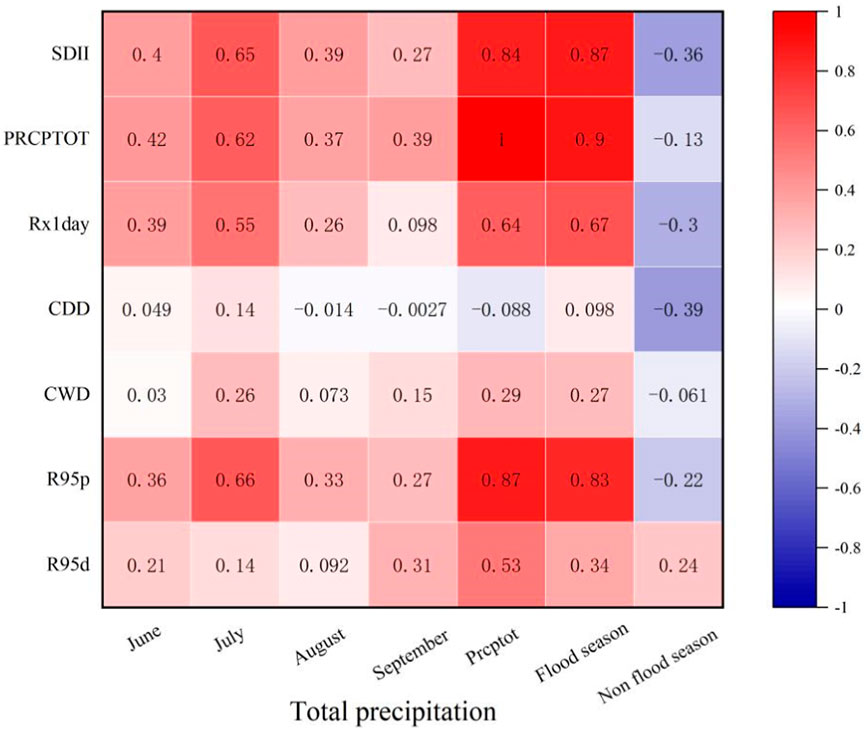
Figure 6. Correlation between extreme precipitation indices and multi-scale precipitation in the grassland area at Yinshanbeilu during 1970–2020.
5 Discussion
In this study, we found that the R95p index in the desert grassland area at Yinshanbeilu in Inner Mongolia increased slowly at a rate of 1.27 mm·(10a)−1 from 1970 to 2020, whereas the change rate of R95d in the past 50 years was 0. Although SDII, RX1day, R95p, and PRCPTOT demonstrated changes at different rates, they all showed an increasing trend, which was opposite to the extreme precipitation indices changes in the northern semi-arid area during 1961–2010 (Xu et al., 2021). The characteristics of regional precipitation changes may be influenced by the unique cyclical nature of each atmospheric circulation (Li et al., 2015). Li et al. (2015) found that the change in precipitation in Inner Mongolia has a strong relationship with the Northern boundary of WASMR, which moved southward because of the enhanced westerlies, and that the regional precipitation cycles may be influenced by their own periods of NAO and PDO. This might be due to the local characteristics of extreme precipitation, which can present major differences in spatial distribution within a region. Since our study was limited by the number of sites, the spatial distribution characteristics described are somewhat different from those in large-area studies (Gvoždíková et al., 2019). Our findings reflect the situation that the global warming trend is still intensifying, causing the acceleration in water cycle process. It also indicates that extreme precipitation in the grassland basin might continue to increase in the future.
Precipitation is directly affected by the atmospheric circulation and the water vapor supply in the source area (Gimeno et al., 2020; Peng et al., 2020). Through abrupt change test analysis, we found that CWD and CDD suddenly declined in 1979 and 1993, respectively. Both reached significant levels, and were strongly correlated to the precipitation in July during the flood season. The extreme precipitation conditions in this study are divided into two categories: drought conditions and heavy rainfall conditions, which can be characterized by CDD and R95P, and these two extreme indicators have good correlation with other indicators. Regimes belonging to the same category (Huang et al., 2005). In addition, the extreme index has a good correlation with the ENSO index, among which SDII and R95P are more sensitive to ENSO. The Lagrangian HYSPLIT backward air mass trajectory model was used to analyze the movement trajectory of atmospheric water vapor in the study area during the flood season (July) of the abrupt change year (1979; Figure 7), and explore the impact of water vapor on abrupt changes in CDD and CWD (Yang et al., 2020). During the flood season in 1979, the precipitation mainly came from local evaporative water vapor in the inland northwest and westerly air masses, which were mainly continental. By 1993, the water vapor in the flood season mainly came from Arctic Ocean water vapor. Regardless of whether the climate became dry or wet, local evaporation in the northwest of the study area in 1979 was a kind of “dry transport”, which was the cause of water vapor leading to drought, and the number of consecutive wet days decreased. In 1993, the water vapor in the study area mostly came from the northern ocean circulation. This oceanic water vapor brought heavy precipitation, with a high number of precipitation days, thus reducing CDD. It was also accompanied by the influence of local water vapor circulation (Jacox et al., 2020).
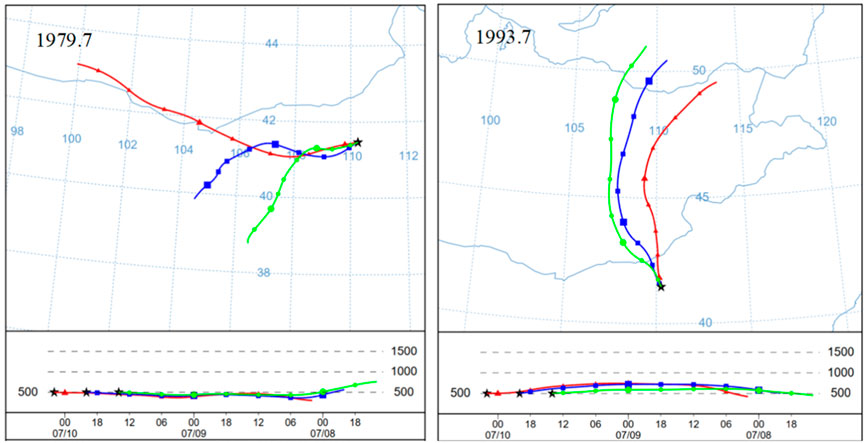
Figure 7. HYSPLIT model output source of precipitation and water vapor in the study area during the flood season in the abrupt change year.
6 Conclusion
In this paper, the temporal evolution and spatial distribution characteristics of extreme precipitation index in the Yinshanbeilu during 1970–2020 are analyzed. The main conclusions are as follows: From 1970 to 2020, the extreme precipitation index CDD and CWD in the grassland area of the Yinshanbeilu both passed the significance test and showed a decreasing trend. The changing trend of the extreme precipitation index indicates that the precipitation in Yinshanbeilu has an overall increasing trend in the past 50 years, and the number of heavy rain days has increased significantly. The mutation point of SDII appeared in 2012, and R95d appeared in 1994. Both of them passed the significance test, and the mutation was not obvious. The mutation points of CDD and CWD appeared in 1993 and 1979, respectively, indicating that the number of consecutive dry days and consecutive wet days decreased. The spatial distribution analysis showed that Siziwang Banner had the greatest risk of extreme precipitation, while Sonid Right Banner had less precipitation. The average cycle corresponding to the first main cycle of the 7 indicators of extreme precipitation mainly has two variation ranges, namely, 25a and 30–36A, and the change of this cycle is significant. Except for the number of consecutive dry days, the other indices have good correlation with annual precipitation, flood season and monthly precipitation from June to September. July is the high occurrence period of extreme precipitation events. The research results can provide scientific theoretical basis for the prevention of meteorological disasters in arid and semi-arid areas.
Data availability statement
The data analyzed in this study is subject to the following licenses/restrictions: Data will be disclosed upon request by contacting the author. Requests to access these datasets should be directed to bGl3ZWl4bDAwMTJAMTYzLmNvbQ==.
Author contributions
WL: Conceptualization, Methodology, Project administration, Writing–original draft, Writing–review and editing. JG: Conceptualization, Methodology, Supervision, Writing–review and editing. WW: Data curation, Methodology, Supervision, Writing–review and editing. YW: Investigation, Methodology, Software, Supervision, Writing–review and editing. YZ: Formal Analysis, Supervision, Validation, Writing–review and editing. WZ: Investigation, Methodology, Project administration, Software, Writing–review and editing. SW: Project administration, Resources, Supervision, Visualization, Writing–review and editing. ZC: Data curation, Methodology, Software, Supervision, Writing–review and editing.
Funding
The author(s) declare that financial support was received for the research, authorship, and/or publication of this article. This work was financially supported by the Yinshanbeilu Grassland Eco-hydrology Observation and Research Station (Grant YS2022001); the Fundamental Research Fund of the China Institute of Water Resources and Hydropower Research (Grant MK 2023J07, MK 2022J06); the Science and technology plan key project of Inner Mongolia Autonomous Region of China (2021GG0072; 2021GG0020; 2021GG0050; 2020ZD0020).
Conflict of interest
Author JG was employed by Yellow River Engineering Consulting Co., Ltd.
The remaining authors declare that the research was conducted in the absence of any commercial or financial relationships that could be construed as a potential conflict of interest.
Publisher’s note
All claims expressed in this article are solely those of the authors and do not necessarily represent those of their affiliated organizations, or those of the publisher, the editors and the reviewers. Any product that may be evaluated in this article, or claim that may be made by its manufacturer, is not guaranteed or endorsed by the publisher.
References
Abd-Elaty, I., Kuriqi, A., Pugliese, L., Zelenakova, M., and El Shinawi, A. (2023). Mitigation of urban waterlogging from flash floods hazards in vulnerable watersheds. J. Hydrology Regional Stud. 47, 101429. doi:10.1016/j.ejrh.2023.101429
Beecham, S., and Chowdhury, R. (2010). Temporal characteristics and variability of point rainfall: a statistical and wavelet analysis. Int. J. Climatol. A J. R. Meteorological Soc. 30, 458–473. doi:10.1002/joc.1901
Bonsal, B., Zhang, X., Vincent, L., and Hogg, W. (2001). Characteristics of daily and extreme temperatures over Canada. J. Clim. 14, 1959–1976. doi:10.1175/1520-0442(2001)014<1959:codaet>2.0.co;2
Booth, E. L., Byrne, J. M., and Johnson, D. L. (2012). Climatic changes in western North America, 1950–2005. Int. J. Climatol. 32, 2283–2300. doi:10.1002/joc.3401
Cardoso Pereira, S., Marta-Almeida, M., Carvalho, A. C., and Rocha, A. (2020). Extreme precipitation events under climate change in the Iberian Peninsula. Int. J. Climatol. 40, 1255–1278. doi:10.1002/joc.6269
Chaubey, P. K., Mall, R., Jaiswal, R., and Payra, S. (2022). Spatio-temporal changes in extreme rainfall events over different Indian river basins. Earth Space Sci. 9, e2021EA001930. doi:10.1029/2021ea001930
Gimeno, L., Vázquez, M., Eiras-Barca, J., Sorí, R., Stojanovic, M., Algarra, I., et al. (2020). Recent progress on the sources of continental precipitation as revealed by moisture transport analysis. Earth-Science Rev. 201, 103070. doi:10.1016/j.earscirev.2019.103070
Gvoždíková, B., Müller, M., and Kašpar, M. (2019). Spatial patterns and time distribution of central European extreme precipitation events between 1961 and 2013. Int. J. Climatol. 39 (7), 3282–3297. doi:10.1002/joc.6019
Huang, M., Peng, G., Leslie, L. M., Shao, X., and Sha, W. (2005). Seasonal and regional temperature changes in China over the 50 year period 1951–2000. Meteorology Atmos. Phys. 89, 105–115. doi:10.1007/s00703-005-0124-0
Indices, E. P. (2019). Analysis of the extreme rainfall events over upper catchment of sabarmati River Basin in western India using. Adv. Water Resour. Eng. Manag. Sel. Proc. TRACE 39, 2018.
Jacox, M. G., Alexander, M. A., Siedlecki, S., Chen, K., Kwon, Y.-O., Brodie, S., et al. (2020). Seasonal-to-interannual prediction of North American coastal marine ecosystems: forecast methods, mechanisms of predictability, and priority developments. Prog. Oceanogr. 183, 102307. doi:10.1016/j.pocean.2020.102307
Li, S., Chen, Y., Wei, W., Fang, G., and Duan, W. (2024). The increase in extreme precipitation and its proportion over global land. J. Hydrology 628, 130456. doi:10.1016/j.jhydrol.2023.130456
Li, W. B., Li, C. Y., Liu, Z. J., et al. (2015). Distribution of precipitation and its effect factors analysis in the central and western regions of Inner Mongolia during the last 60 years. J. Inn. Mong. Agric. Univ.(Nat. Sci. Ed.) 36, 84–94.
Li, X. H., Chen, Z. F., and Wang, L. (2020). Analysis of the spatiotemporal variation characteristics of main extreme climate indices in Sichuan Province of China from 1968 to 2017. Appl. Ecol. Environ. Res. 18 (2), 3211–3242. doi:10.15666/aeer/1802_32113242
Mashao, F. M., Mothapo, M. C., Munyai, R. B., Letsoalo, J. M., Mbokodo, I. L., Muofhe, T. P., et al. (2023). Extreme rainfall and flood risk prediction over the East Coast of South Africa. Water 15, 50. doi:10.3390/w15010050
Peng, D., Zhou, T., and Zhang, L. (2020). Moisture sources associated with precipitation during dry and wet seasons over Central Asia. J. Clim. 33, 10755–10771. doi:10.1175/jcli-d-20-0029.1
Rathinasamy, M., Agarwal, A., Sivakumar, B., Marwan, N., and Kurths, J. (2019). Wavelet analysis of precipitation extremes over India and teleconnections to climate indices. Stoch. Environ. Res. Risk Assess. 33, 2053–2069. doi:10.1007/s00477-019-01738-3
Sa’adi, Z., Shahid, S., Ismail, T., Chung, E.-S., and Wang, X.-J. (2019). Trends analysis of rainfall and rainfall extremes in Sarawak, Malaysia using modified Mann–Kendall test. Meteorology Atmos. Phys. 131, 263–277. doi:10.1007/s00703-017-0564-3
Tradowsky, J. S., Philip, S. Y., Kreienkamp, F., Kew, S. F., Lorenz, P., Arrighi, J., et al. (2023). Attribution of the heavy rainfall events leading to severe flooding in Western Europe during July 2021. Clim. Change 176, 90. doi:10.1007/s10584-023-03502-7
Wang, J., Zhuo, L., Han, D., Liu, Y., and Rico-Ramirez, M. A. (2023). Hydrological model adaptability to rainfall inputs of varied quality. Water Resour. Res. 59, e2022WR032484. doi:10.1029/2022wr032484
Wang, Q. S., Teng, J. W., Wang, G. J., and Xu, Y. (2005). The region gravity and magnetic anomaly fields and the deep structure in Yinshan mountains of Inner Mongolia. Chin. J. Geophys. 48, 348–355. doi:10.1002/cjg2.660
Wu, S., Hu, Z., Wang, Z., Cao, S., Yang, Y., Qu, X., et al. (2021). Spatiotemporal variations in extreme precipitation on the middle and lower reaches of the Yangtze River Basin (1970–2018). Quat. Int. 592, 80–96. doi:10.1016/j.quaint.2021.04.010
Xu, L., Zheng, C., and Ma, Y. (2021). Variations in precipitation extremes in the arid and semi-arid regions of China. Int. J. Climatol. 41, 1542–1554. doi:10.1002/joc.6884
Yang, H., Xu, G., Mao, H., and Wang, Y. (2020). Spatiotemporal variation in precipitation and water vapor transport over Central Asia in winter and summer under global warming. Front. Earth Sci. 8, 297. doi:10.3389/feart.2020.00297
Yang, Y., Liu, H., Tao, W., and Shan, Y. (2024). Spatiotemporal variation characteristics and driving force analysis of precipitation use efficiency at the north foot of Yinshan Mountain. Water 16, 99. doi:10.3390/w16010099
Zhao, Y., Zhu, D., Wu, Z., and Cao, Z. (2024). Extreme rainfall erosivity: research advances and future perspectives. Sci. Total Environ. 917, 170425. doi:10.1016/j.scitotenv.2024.170425
Keywords: extreme precipitation, arid and semi-arid regions, Yinshanbeilu, wavelet analysis, M-K test
Citation: Li W, Guan J, Wang W, Wu Y, Zhao Y, Zhang W, Wang S and Chen Z (2024) Analysis of extreme precipitation variation characteristics in mountain grasslands of arid and semi-arid regions in China. Front. Environ. Sci. 12:1403490. doi: 10.3389/fenvs.2024.1403490
Received: 19 March 2024; Accepted: 26 April 2024;
Published: 10 May 2024.
Edited by:
Zhiming Han, Northwest A&F University, ChinaReviewed by:
Xiaoliang Ma, Lanzhou University, ChinaShuang Song, Shenyang Agricultural University, China
Copyright © 2024 Li, Guan, Wang, Wu, Zhao, Zhang, Wang and Chen. This is an open-access article distributed under the terms of the Creative Commons Attribution License (CC BY). The use, distribution or reproduction in other forums is permitted, provided the original author(s) and the copyright owner(s) are credited and that the original publication in this journal is cited, in accordance with accepted academic practice. No use, distribution or reproduction is permitted which does not comply with these terms.
*Correspondence: Yingjie Wu, d3V5aW5namllMTIzMEAxNjMuY29t