
95% of researchers rate our articles as excellent or good
Learn more about the work of our research integrity team to safeguard the quality of each article we publish.
Find out more
ORIGINAL RESEARCH article
Front. Environ. Sci. , 15 July 2024
Sec. Ecosystem Restoration
Volume 12 - 2024 | https://doi.org/10.3389/fenvs.2024.1403342
 Chao Ying1,2,3
 Yifan Li4Yuxin Chen2Jie Zhong2
 Shunyi Ai2Peng Tian2
 Qiyu Huang2Luodan Cao2,5*
 Abdul M. Mouazen5
Introduction: Rural ecological environment construction, as a pivotal component of the rural revitalization strategy and ecological civilization construction strategy, plays an indispensable role in promoting sustainable agricultural development and safeguarding ecological security. An accurate assessment and prediction of Rural Ecological Environment Quality (REEQ) serves as the theoretical basis to achieving these goals, and provide scientific guidance for future rural ecological environment construction and planning. The field of regional ecology, proposed in the mid-20th century, represents an emerging interdisciplinary domain that integrates ecology, geography, and economics. It plays a pivotal role in addressing large-scale ecological challenges and fostering social sustainability. As global urbanization continues to advance, urban ecological environments undergo significant transformations under the pressures of intense human activities. Scholars have increasingly focused on the essence, evolutionary patterns, and causal mechanisms shaping urban ecological environment quality. Consequently, ecological environment assessments have evolved from singular pollution evaluations to comprehensive ecological appraisals. However, coastal rural area with complex geographical conditions and fragile ecological environments are often neglected and marginalized. Currently, there are few specialized evaluation systems for REEQ, making it difficult to accurately reveal the evolution pattern of rural ecological environment. This weakens its guidance on practical rural ecological environment governance and restoration.
Methods: The Pressure-State-Response (PSR) model can simplify the identification process of driving factors for REEQ, reflect the feedback mechanism between indicators, and is conducive to scientific and accurate evaluation of REEQ. Therefore, we constructed an evaluation index system for REEQ based on the PSR. We measured REEQ in the eastern coastal area of China, analyzed its spatiotemporal characteristics and development trends, and used the obstacle degree model to identify obstacle factors. It is beneficial for rural areas to grasp the evolution laws of REEQ, provide theoretical basis for the formulation of sustainable development policies, and provide scientific policy recommendations.
Results: Our findings indicate that: 1) From 2000 to 2020, REEQ in the eastern coastal area of China has continuously improved, with the index value increasing from 0.454 to 0.525, a total growth of 15.64%. The number of high-level REEQ areas increased from 0 to 29, showing a positive development trend. 2) High-density areas of REEQ in the eastern coastal area of China are concentrated in the northern parts of Guangdong and Zhejiang provinces. The center of REEQ has shifted from the southwest to the northeast. 3) The obstacle degrees of various criteria layers in REEQ are relatively stable, with the response subsystem being the highest, followed by the state and pressure subsystems. Forest coverage, per capita grain production, effective irrigation rate of farmland, afforestation area in the current year, per capita disposable income of rural residents, and per capita mechanical power of farmers are the main obstacle indicators. 4) From 2020 to 2035, REEQ in the eastern coastal area of China will continue to improve. The standard deviation ellipse will move towards the northwest, the center will shift from the southwest to the northeast, the rotation angle will slowly decrease, showing a northwestward trend.
The rural ecological environment is an organic combination of nature and socio-economic factors within rural areas (Zhu et al., 2021). The deepening of the new “Four Modernizations” and the rural revitalization strategy has intensified the element flow of urban and rural (Qian et al., 2022), prompting the transformation and expansion of rural spatial “elements-structure-function” (Meier, 1997). This has led to the reshaping of rural socio-economic forms and spatial structures (Rao, 2022), resulting in conflicts between economic development and environmental protection (Cai et al., 2021). Ecological problems such as land degradation, water pollution, and air pollution have become increasingly prominent in rural areas (Zou et al., 2020; Xue et al., 2022).As China enters the crucial stage of building a moderately prosperous society in all respects, the issue of REEQ serves as the natural foundation for rural revitalization and shared prosperity. The assessment and prediction of REEQ, and the diagnosis of obstacle factors are key factors for the restoration and improvement of rural ecological environment. These aspects are essential for achieving rural revitalization and the sustainable development of rural areas.
The ecological environment is a whole composed of various ecosystems composed of biological communities and non-biological natural factors, which is closely related to human survival and development. Since the concept of ecological environment is not unified, the connotation of ecological environment evaluation can be mainly divided into three aspects: the changing laws of ecosystems and their components, the dynamic changes and external characteristics of different ecosystems, and the suitability of different ecosystems for human survival. The evaluation of ecological environmental quality originated from ecological risk assessment in the 1960s (Song et al., 2013). In the 1960s, the United States stipulated in the National Environmental Policy Act that an ecological environment assessment report must be prepared before engineering construction. Subsequently, Canada, Sweden and other countries also stipulated corresponding environmental impact assessment systems in their environmental protection laws, reflecting that the embryonic stage of ecological environmental quality evaluation focused more on the impact of single environmental pollution; in the 1970s, ecological environment quality evaluation gradually turned to ecosystem service function evaluation, and Costanza et al. classified and estimated the global ecosystem service value (Costanza et al., 1997); in the 1980s, ecological environment quality evaluation shifted to ecosystem health evaluation, and Rapport et al. proposed that a healthy ecosystem has the ability to maintain organizational structure, self-regulate, and resist interference, and it has become an important basis for evaluating the health of ecosystems (Rapport et al., 1998); after the 1990s, the United States, Canada and other countries successively launched regional and national ecological environment monitoring and assessment programs (EMAP), and ecological research networks covering ecological factors such as species, vegetation, climate, hydrology, soil, and human activities, and ecological environment evaluation has entered the stage of comprehensive sustainable evaluation (Cui et al., 2022). Comprehensive ecological environmental quality assessment takes into account not only the objective ecological environmental conditions but also the impact of socio-economic activities on the environment. It exhibits characteristics of multi-perspective, multi-level, and multi-scale analysis. Previous studies have diversified into various aspects, including urban areas (Zhu et al., 2022), wetlands (Yang et al., 2021), forests (Xiang et al., 2020), oceans (Qian, 2023), covering ecological risk assessment (Yin, 2023), ecological security assessment (Ghosh et al., 2021), carrying capacity assessment (Sun et al., 2022), ecological vulnerability assessment (Hu et al., 2021), and others. This transition has seen a shift from qualitative descriptions to quantitative analyses involving methods.
Currently, scholars have conducted extensive research on ecological environment quality. System dynamics, ecological footprint method, fuzzy discrimination method, comprehensive evaluation method, etc., have been widely used in ecological environment quality evaluation. System dynamics conducts dynamic evaluation of ecological environment quality from the perspective of system coordinated development, which can better reflect the driving relationship between population, natural environment and economic development. However, it is difficult to grasp the parameters and has strong regional restrictions, which can easily lead to unreasonable design of system dynamics models. It is not suitable for medium and large-scale regional studies (Li and Luo, 2022). The ecological footprint method from the perspectives of resource supply and consumption to evaluate. It has the advantages of being simple and easy to operate. However, the ecological footprint indicator is too single and lacks comprehensive consideration of factors such as technology and management, making it difficult to achieve dynamic prediction and analysis (Gao et al., 2020). The fuzzy discrimination method is based on fuzzy mathematics theory. It quantifies the fuzzy factors in the system according to the degree of membership and expresses them with a continuous value between 0 and 1. The calculation method is simple and easy, but the evaluation index is often not sensitive enough and often loses useful information (Cheng et al., 2020). The comprehensive evaluation method constructs an evaluation index system based on the connotation and process of ecological environment quality, and uses the weight calculation method to assign index weights and then calculate the comprehensive index to reflect the ecological environment level. The calculation process of this method is relatively simple and the evaluation results are relatively accurate, but it requires a lot of indicator data support (Li et al., 2022a). In order to scientifically and accurately evaluate the quality of REEQ in eastern coastal area of China, this article selects a more comprehensive, macro and accurate comprehensive index method to make the results more comprehensive, logical and systematic.
The evaluation of REEQ is the application and practice of ecological environmental assessment in rural areas. Previous research has approached this topic from various perspectives such as rural geography (Argent, 2019), rural reconstruction (Wang et al., 2019), rural economy (Wei et al., 2023), and urban-rural integration (Zhang et al., 2023). It has drawn from multiple disciplines including geography (Wen and Burley, 2020), ecology (Huang and Li, 2022), and urban planning (Yang Z. et al., 2022). These studies have primarily focused on aspects such as the evolution of rural ecological environmental systems (Gu et al., 2022), current issues and strategies for improvement (Wang J. et al., 2022), assessment models (Zhang and Zeng, 2022), influencing factors and driving mechanisms (Li et al., 2020).However, there has been relatively less consideration of the spatial and temporal evolution patterns of REEQ in long time at medium scale. Many studies have predominantly conducted qualitative analyses of improvement paths concerning current issues, often lacking quantitative diagnostics of obstructive factors. Moreover, previous research has predominantly been concentrated in China’s central and western region (Xu and Sun, 2021; Yang et al., 2023). In contrast, rural area in the eastern coastal area of China have experienced significant changes in ecological environments due to rapid socio-economic development. Therefore, there is an urgent need to gain a clear understanding of the temporal and spatial evolution patterns of REEQ. Additionally, most studies have focused on small to medium spatial scales such as county-level or city-level (Xu et al., 2021; Xu et al., 2023), and there has been a relative scarcity of research focusing on the eastern coastal area where ecological environmental changes are more pronounced and the human-nature conflicts are more prominent. Consequently, this study selects administrative units at the city-level with comprehensive data coverage as the research scale, aiming to accurately assess REEQ, elucidate the characteristics of spatial differentiation in rural ecological environments, and provide guidance for the formulation of rural environmental policies and region-specific optimization strategies.
Currently, widely used evaluation models include the PSR, DFSR, and DPSIR model. The PSR model provides a process control perspective to reflect the complex relationships within the human activities and resource-environment systems. This model is advantageous in illustrating the interconnections among indicators, revealing cause-and-effect relationships between external disturbances and environmental changes, and it possesses high scalability and systemic characteristics (Tian et al., 2022).At multiple scales such as provincial, municipal, and watershed levels, the PSR model has been employed to construct indicator systems and evaluate ecological environmental quality. It has also been used to propose enhancement strategies such as accelerating the development of real-time monitoring platforms, promoting green innovations, and strengthening environmental regulations. These strategies serve as theoretical foundations for regional ecological conservation and sustainable development (Li T. et al., 2023; Xie et al., 2023).The DFSR model, which builds upon the PSR model (Gao and Li, 2022), replaces pressure indicators with driving force indicators, thereby expanding the coverage of human-induced activity indicators, including economic activities and social systems. On the other hand, the DPSIR model, an extension of the PSR model, introduces driving force and impact indicators, making it more suitable for regions with intense human activities (Liu et al., 2022). However, it is important to note that the DPSIR model comes with increased requirements for indicator data. The PSR model simplifies the process of identifying driving factors affecting ecological environmental quality. It utilizes concise multidimensional indicators to comprehensively evaluate the natural and socio-economic complex, avoiding the issue of vague definitions in target layers found in models like DFSR and DPSIR. Consequently, the PSR model is considered an ideal choice for assessing ecological environmental quality at medium spatial scales and is well-suited for evaluating rural areas in the eastern coastal area of China.
Since the beginning of economic reforms and opening up, the eastern coastal area of China have played a pivotal role as an economic core area. Despite covering only 13% of the land area, this region sustains over 45% of the country’s population and generates more than 50% of the GDP. In the process of socio-economic development and ecological evolution, the eastern coastal area have held significant importance. The high-intensity development and rapid urbanization have not only driven rural socio-economic development and optimized industrial structures but have also profoundly transformed the rural landscape. These changes have had a notable impact on the functionality and structure of the ecological environment. As a result, the issue of rural ecological environment in the eastern coastal area of China has become representative and typical. There is an urgent need for an assessment of REEQ to understand the spatiotemporal patterns and evolutionary trends of rural ecological environment, diagnose the primary obstacles, and provide scientific recommendations for the rational planning and sustainable development of rural area in the eastern coastal area of China.
Hence, the objectives of this article are as follows: 1) Construct an evaluation indicator system for REEQ, which will be used for assessing the REEQ in the eastern coastal area of China. 2) Analyze the spatiotemporal patterns of REEQ in the eastern coastal area of China from 2000 to 2020 and reveal the patterns of change. 3) Predict the development trends and future focus of REEQ in the eastern coastal area of China for the period 2025–2035. 4) Effectively identify the obstacles affecting REEQ in the eastern coastal area of China and propose corresponding policy recommendations.
The eastern coastal area of China (Figure 1) span tropical, subtropical, and temperate monsoon climate zones. The topography is mainly characterized by plains and low hills. The area boasts an extensive coastline of 18,000 km, endowed with abundant natural resources such as islands, biodiversity, and energy resources. Since the reform and opening-up policy, the socio-economic development in the eastern coastal area of China has progressed rapidly, making it a key region in terms of China’s economy, transportation, and talent. In 2022, the GDP of the eastern coastal provinces reached 6.29 trillion yuan, accounting for 51.96% of the national GDP. However, the high-intensity development and frequent human activities in this region have led to ecological environmental problems, including a decline in biodiversity, vegetation destruction, water resource shortages, soil pollution, and more. These issues have become significant bottlenecks hindering rural development and rural revitalization. Therefore, it is essential to understand the evolutionary patterns of REEQ and identify obstacles to promote sustainable development of rural ecological environments. Considering data availability and completeness, and in line with administrative characteristics and research needs, this study selected 52 coastal cities from 11 provinces and regions, including Liaoning, Hebei, Tianjin, Shandong, Jiangsu, Shanghai, Zhejiang, Fujian, Guangdong, Guangxi Zhuang Autonomous Region, and Hainan. (Taiwan, Macau, and Hong Kong are excluded from this study, and Shenzhen is not considered due to the cancellation of agricultural household registration in the city in 2004).
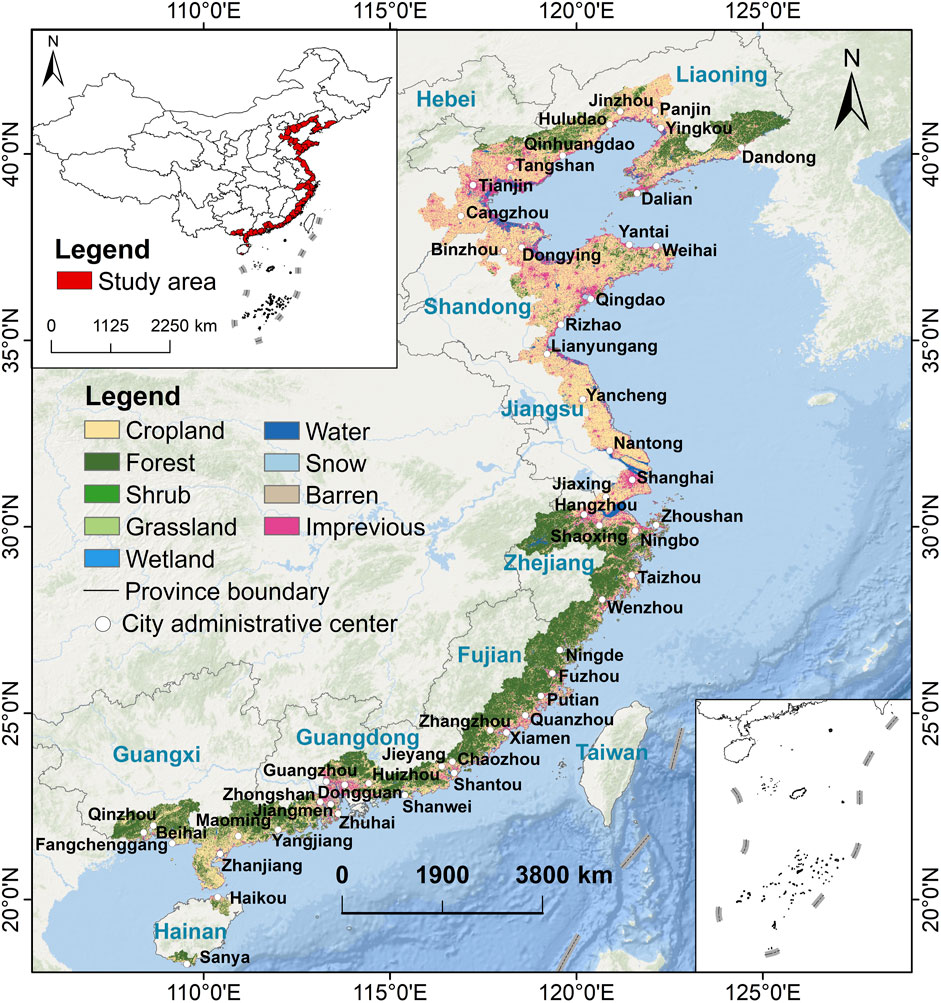
Figure 1. Location of the study area and the land use status in 2020.
The socio-economic data used in this study were sourced from the Statistical Yearbooks of various provinces and cities. Environmental governance data primarily came from the “China Environmental Statistical Yearbook” and the “China Urban Statistical Yearbook.” In cases where data were missing, smoothing methods were applied as substitutes. Additionally, some indicator data were recalculated in this study. For instance, the scale of livestock and poultry farming was recalculated by converting cattle, pigs, sheep, and poultry into a common unit of measurement, which is the pig, using different pollution coefficients for each from the “Second National Pollution Census.” Since data on agricultural COD emissions only became available after 2011, to maintain consistency in terms of calculation, source strength estimation methods were employed (Liang, 2009). These methods referred to the pollution coefficient of the breeding industry, the scale of livestock and poultry farming, and pollutant loss coefficients from the “Second National Pollution Census” to calculate agricultural COD emissions.
The overall approach is illustrated in Figure 2. Based on the PSR model, an indicator system was constructed to calculate the comprehensive index of REEQ in the eastern coastal area of China, as well as various dimension indices. Subsequently, the standard deviation ellipse and grey forecasting model were employed to analyze and predict the evolving pattern of REEQ. Finally, an obstacle degree model was used to identify the primary obstacles to REEQ and propose relevant policy recommendations.
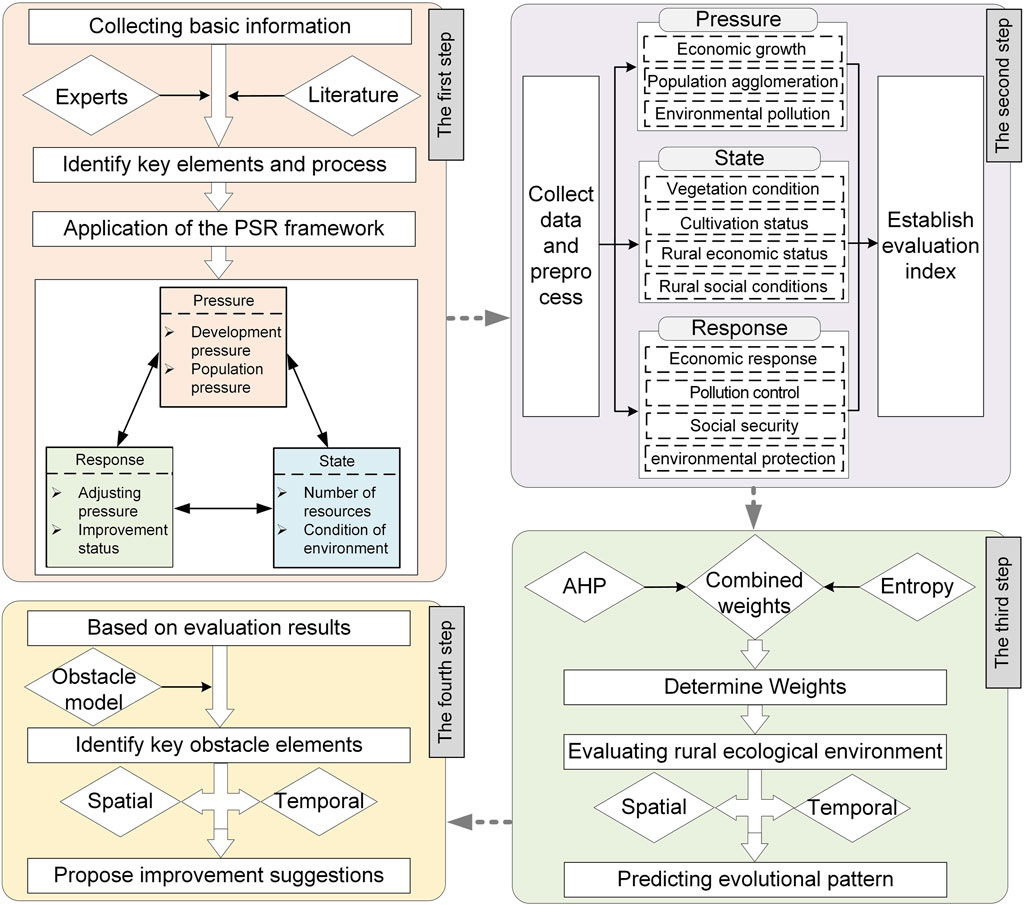
Figure 2. Overall research approach.
The key to assessing REEQ is to establish a scientifically reasonable indicator system (Wang et al., 2021). As the rural ecological environment is a complex giant system composed of multiple attributes and dimensions, it is influenced by both the natural environment and socio-economic factors (Yurui et al., 2020). The PSR model is well-suited to reflect the entire process of environmental response formulation and impact. The PSR model initially proposed and applied to ecological environmental assessment by the Organization for Economic Co-operation and Development (OECD). Based on the interdependence between human and nature, the inherent logical relationship between economy and environment is objectively explained, and a dynamic model structure is formed by coupling the three causal subsystems of pressure, state and response. Compared with the existing DFSR, DPSIR, and DPSIRM model, the PSR model can comprehensively and objectively evaluate the ecological environment with simpler multidimensional indicators, and avoid problems such as fuzzy relationship and unclear definition of the target layer. Based on the actual conditions of the study area and data availability, a comprehensive REEQ system was constructed, encompassing the social, economic, and resource-environmental aspects (Table 1).
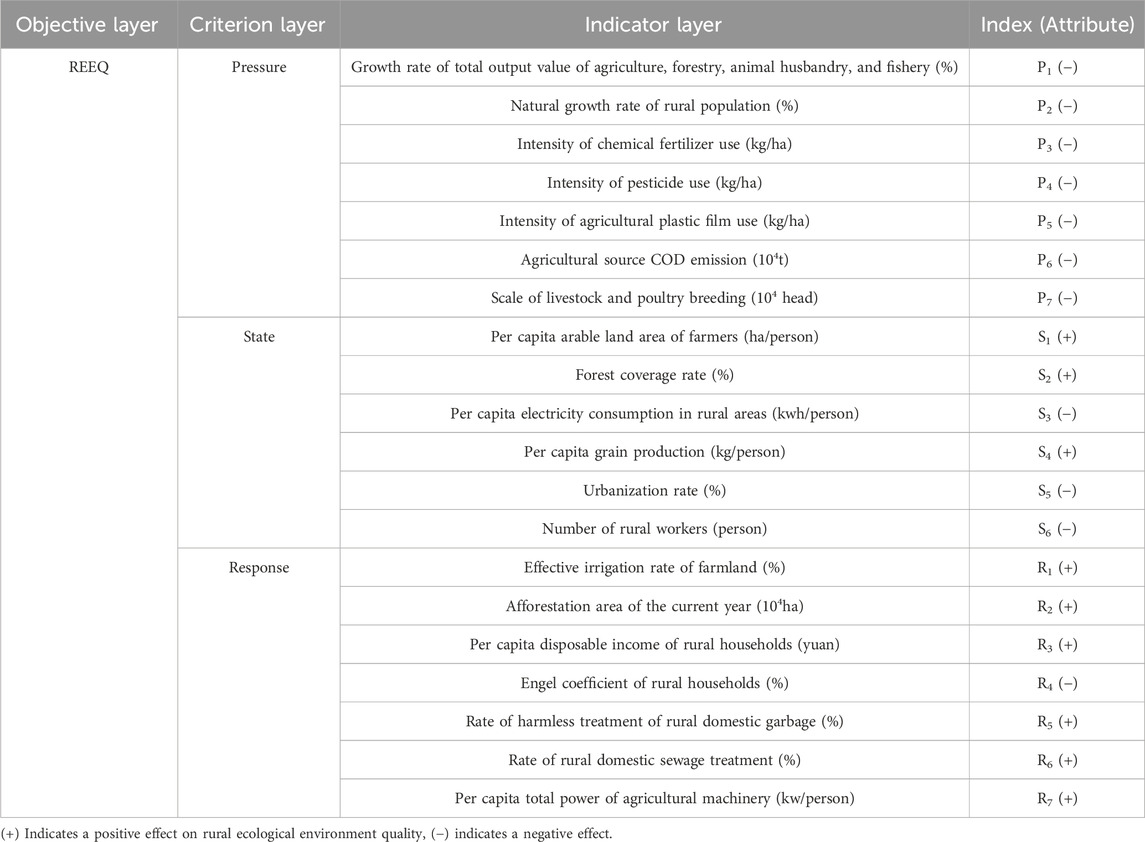
Table 1. Evaluation index system for REEQ.
Pressure represents the force that exerts a negative impact on the ecological environment during the process of rural production and living. In this context, the growth rate of the total output value of agriculture, forestry, animal husbandry, and fisheries represents the level of regional agricultural economic development, and economic growth in agriculture often has negative effects on the ecological environment (Li et al., 2022a). The natural population growth rate represents changes in the regional population size, and a high natural population growth rate tends to increase the burden on resources and the environment (Lin et al., 2019). This has a detrimental impact on the ecological environment. The improper handling of chemical fertilizers, pesticides, agricultural plastic film, and livestock and poultry manure can lead to environmental pollution in rural areas (Guo et al., 2021), resulting in a decline in REEQ.
Condition refers to the current situation resulting from changes in the rural ecological environment during the process of production and living, considering both natural and human activities. Among these indicators: Forest coverage rate reflects the degree of rural ecological environment protection (Nunes et al., 2019). Per capita cultivated area of crops and per capita electricity consumption reflect the efficiency of land and energy utilization during the production process. Large-scale cultivation and extensive energy use are unfavorable for the development of the ecological environment (Li S. et al., 2023). Per capita grain production reflects agricultural production capacity and food security. A higher per capita grain production can better ensure food security, reduce the expansion of arable land, and mitigate the disruption of the rural ecological environment (Yu et al., 2022). Urbanization rate and the number of rural employees reflect the socio-economic level of rural areas. Socio-economic development patterns that come at the cost of resources and the environment are detrimental to improving the REEQ.
Response primarily refers to the extent to which governments, organizations, and individuals actively take countermeasures to improve the rural ecological environment. Among these indicators: The effective irrigation rate in farmland and per capita mechanical total power of rural residents reflect agricultural production efficiency. High-efficiency production can effectively utilize resources and reduce environmental damage (Chen and Zhang, 2019). The afforestation area in the current year reflects the government’s macro-control of ecological land use. A larger afforestation area can promote the improvement of the ecological environment. Rural residents’ per capita disposable income and Engel coefficient reflect the improvement in rural economic and living standards. This is conducive to attracting investment, changing industrial structures, and has a positive impact on the quality of the ecological environment (Gu et al., 2022). The treatment rates of domestic garbage and domestic sewage reflect rural pollution control. Strict control systems are beneficial for slowing down rural environmental pollution and promoting the improvement of the REEQ.
The combination weighting method combines both subjective and objective weighting methods. This approach is advantageous as it reduces subjective influence while objectively and comprehensively reflecting the dynamic characteristics of indicators. It avoids situations where the objective weighting method might ignore the current situation and result in an unreasonable weight allocation. Following the principles of the Lagrange condition extremum principle (Hou et al., 2023), the weights are calculated using the Analytic Hierarchy Process and the Entropy method (Saaty, 1977; Li and Yi, 2020). After obtaining the weights, the Comprehensive index method is used to calculate the comprehensive index, reflecting the level of REEQ.
Kernel density analysis helps to reflect the distribution characteristics and spatial clustering status of REEQ, considering the spatial distance attenuation of geographic elements (Yuan et al., 2023). The standard deviation ellipse model is employed to describe the spatiotemporal evolution patterns of REEQ (Wang H. et al., 2022). Additionally, the grey prediction model is utilized to forecast the future spatiotemporal patterns of REEQ in coastal cities (Hu et al., 2022). Finally, based on the obstacle degree model, the degree to which various obstacles constrain REEQ is quantified (Sun et al., 2023), as shown in Eq. 1:
In the formula,
REEQ in the eastern coastal area of China shows an upward trend (Figure 3), with the index value increasing from 0.454 to 0.525, representing a total growth of 15.64%, transferring from a low level to a high level. At the provincial level, Hebei has the highest level of REEQ, followed by Liaoning, Shandong, Jiangsu, Zhejiang, Fujian, Guangxi, and Hainan, while Tianjin and Shanghai have lower levels. There are significant differences in the development speed of REEQ among different provinces, leading to dramatic changes in the ranking pattern. Hebei and Jiangsu have developed rapidly, moving from eighth and ninth place in 2000 to first and second place in 2020, respectively, while Guangxi and Hainan have experienced slow development, with some provinces even regressing in their rankings. Except for Hebei and Fujian, the coefficient of variation in other provinces has continuously decreased, indicating a gradual reduction in the gap REEQ within most provinces.
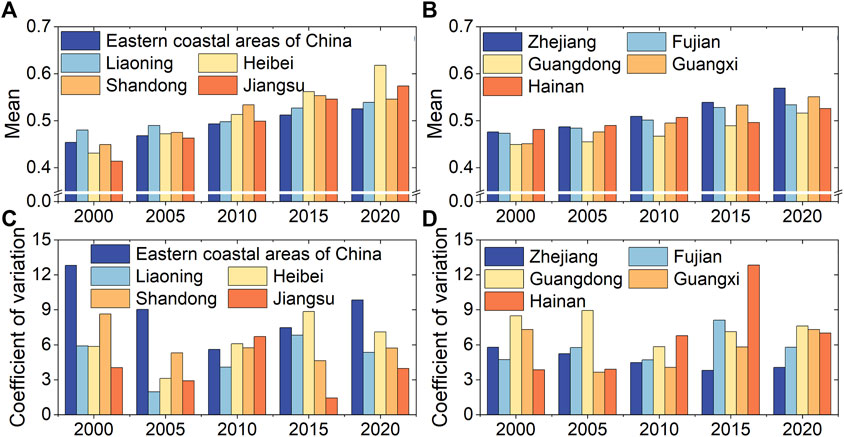
Figure 3. (A, B) Average value and (C, D) coefficient of variation of REEQ in eastern coastal area of China.
At the municipal level (Figure 4), REEQ in coastal area has generally improved, but the growth rate varies. Cities such as Huludao, Tangshan, Shanghai, Huizhou, and Dongguan have experienced rapid development in REEQ, with an average annual growth rate exceeding 10%. On the other hand, cities like Jinzhou, Huizhou, Yangjiang, and Maoming have seen slower development, with an average annual growth rate of only about 1%. The number of high-level areas in terms of REEQ in the eastern coastal area of China has increased from 0 in 2000 to 29 in 2020, while the number of low and relatively low-level areas has decreased from 35 in 2000 to 2 in 2020, indicating a positive development trend.
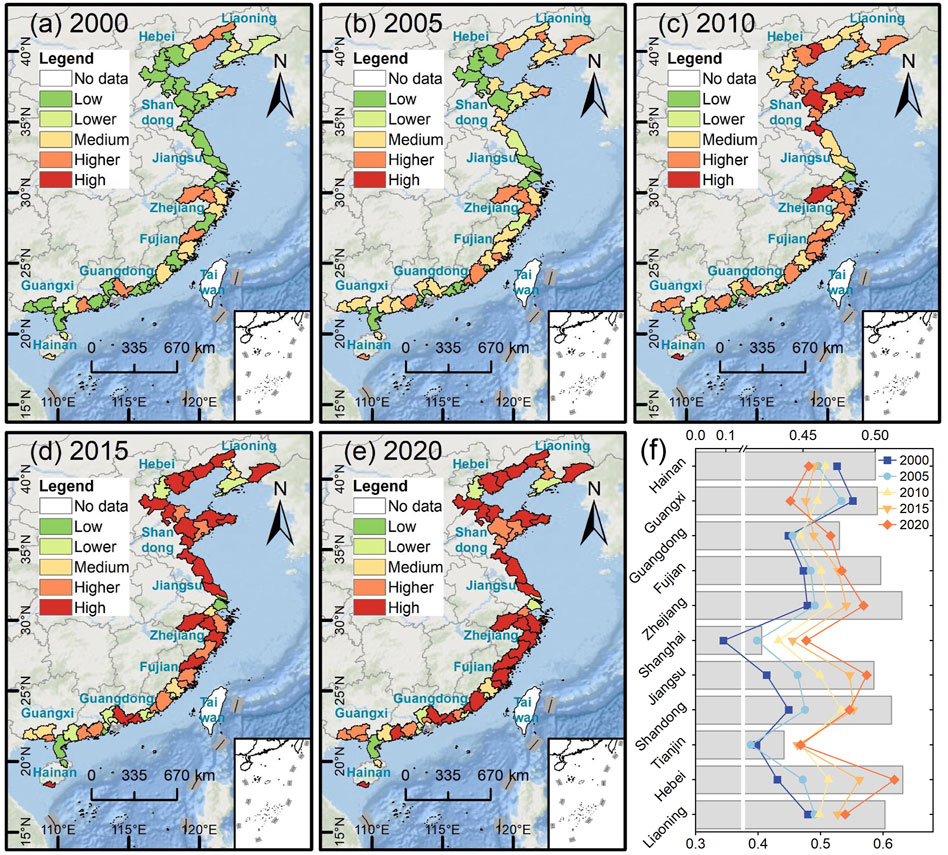
Figure 4. (A–E) The spatial distribution and (F) mean of REEQ in the eastern coastal area of China from 2000 to 2020.
In the REEQ subsystems, the Pressure index has slightly increased, the State index has slowly declined, and the Response index has risen rapidly and stabilized (Figure 5). In 2000, the Pressure index was 0.195, and by 2020, it had only increased to 0.201. This is attributed to a significant reduction in the adverse effects of increased fertilizer and agricultural plastic film usage intensity on rural ecological environment due to the positive impact of agricultural source COD emissions and natural population growth rate. However, it is essential to closely monitor the trends in the use of agricultural plastic film and fertilizers and actively promote organic fertilizers to reduce soil and water pollution. Zhejiang, Hainan, and Fujian ranked as the top three in the Pressure index, followed closely by Shanghai, Guangdong, and Jiangsu. Hebei had the lowest ranking, while Tianjin and Shandong need improvement. Areas with low Pressure index are concentrated in North China, primarily due to severe salinization and poor soil fertility in this area, requiring more measures such as water, fertilizers, pesticides, and plastic film to promote crop growth. Additionally, the rapid population growth has added pressure on the rural environment, resulting in lower Pressure index.
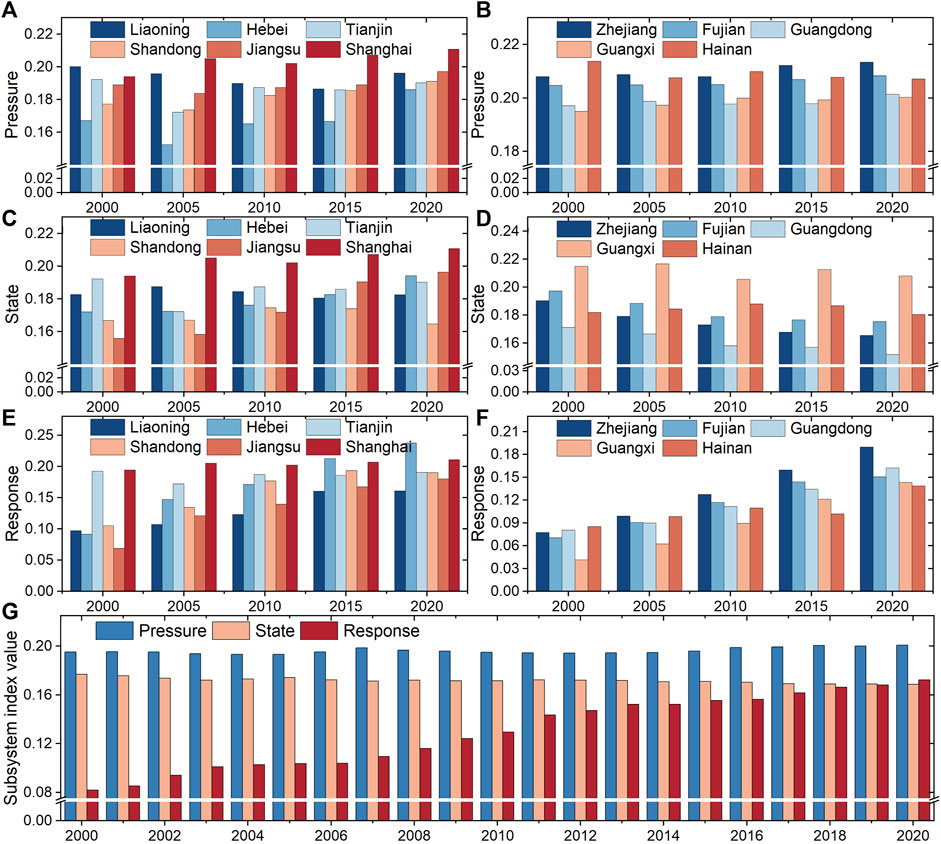
Figure 5. Dynamic changes in the (A, B) pressure, (C, D) state, (E, F) response, and (G) overall subsystems of REEQ in the eastern coastal area of China.
In 2000, the Status index for the REEQ in the eastern coastal area of China was 0.177, and by 2020, it had decreased to 0.169. This indicates that the State subsystem has been influenced by Pressure, leading to a relatively poor development trend of various components of the rural ecological environment. There is still significant room for improvement in the future. Guangxi, Hainan, and Liaoning belong to the first tier, while Fujian, Hebei, Shandong, Zhejiang, and Jiangsu belong to the second tier. Guangdong, Tianjin, and Shanghai are in the third tier. Areas with low Status index are concentrated in economically developed provinces area, where industrialization, urbanization, and improved economic levels have accelerated the deterioration of REEQ.
In 2000, the Response index for the REEQ in the eastern coastal area of China was 0.082, and by 2020, it had increased to 0.172. This improvement can be attributed to the optimization of harmless treatment rates for household waste, sewage treatment rates, and mechanical power. Additionally, as people gradually recognized the importance of rural ecological environments, investments in rural ecological environment protection and pollution prevention increased significantly, contributing to a substantial improvement in REEQ. Hebei, Shandong, and Tianjin are in leading positions in terms of REEQ response subsystem, while the Guangxi has the lowest level. The differences in response among other provinces and municipalities are not significant, closely related to their own ecological environment foundations. Looking at changes in the comprehensive subsystem, the rural ecological environment in the eastern coastal area of China has experienced a slight increase in pressure from ecological destruction and environmental pollution. However, due to the improvement in environmental protection measures and capabilities, the ability to control environmental damage has exceeded the rate of destruction, leading to an overall improvement in the ecological environment, trending towards a healthier state.
The spatial pattern of REEQ in the eastern coastal area of China has shown minimal changes in kernel density values (Figure 6). However, these values have consistently increased over the years, with the highest kernel density values recorded in 2000 (0.217), 2005 (0.221), 2010 (0.230), 2015 (0.249), and 2020 (0.263). Regions experiencing significant changes are concentrated in Zhejiang and Guangdong, closely related to the rural ecological environment policies in these two provinces. Zhejiang has implemented three rounds of “811″actions, the “Thousand Villages Demonstration and Villages Remediation” initiative, and the “Five Improvements for Rural Environmental Enhancement” project. It has also enacted policies and regulations such as the “Implementation Plan for Pollution Control in Agriculture and Rural Areas in Zhejiang Province” and the “Implementation Plan for Comprehensive Improvement of Rural Environment in Zhejiang Province.” Guangdong, on the other hand, has issued action plans such as the “Action Plan for Rural Environmental Protection in Guangdong Province,” “Action Plan for Rural Environmental Protection in Guangdong Province (2011–2013)” and “Action P. for Rural Environmental Protection in Guangdong Province (2014–2017).” These policies have led to the improvement and restoration of rural ecological environments in both provinces. There are two high kernel density areas of REEQ in the eastern coastal area of China. One is centered around Guangdong and extends to the northeast and southwest. The other is centered around the coastal areas of Hangzhou Bay and expands to the north and south. In addition, the high kernel density aggregation area in the northern coastal area extends to the northeast and southwest with cores in Dongying and Yantai.
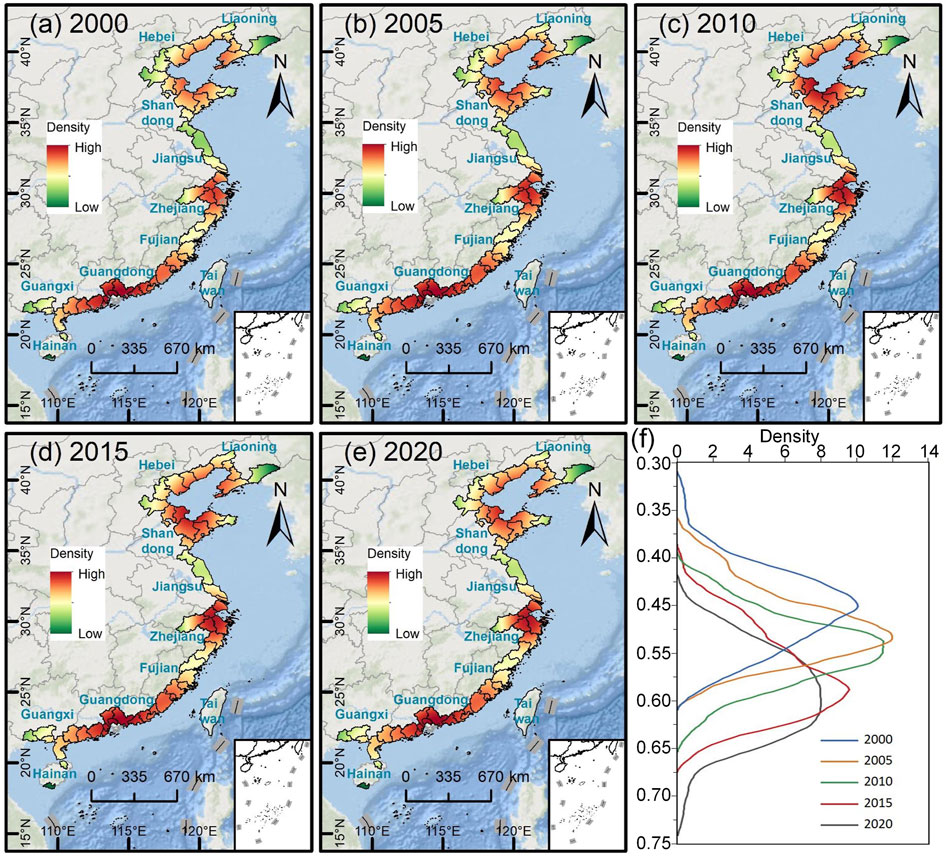
Figure 6. (A–E) The spatial distribution of Kernel Density and (F) kernel density estimation of REEQ in the eastern coastal area of China from 2000 to 2020.
The center of gravity of REEQ in the eastern coastal area of China shows a trend of moving from the southwest to the northeast (Figure 7), with a total displacement of approximately 39.60 km. The trajectory of center of gravity migration changed from southwest to northeast from 2000 to 2015 and then reversed from northeast to southwest from 2015 to 2020. The rate of movement of the coastal area center of gravity first accelerated, then slowed down, and then accelerated again, with the fastest rate of movement occurring from 2005 to 2010 at 3.38 km per year. The standard deviation ellipse of REEQ is concentrated in the central part of the 11 coastal provinces and cities (Zhejiang), and the center of gravity tends to move north, which is consistent with the current development status of REEQ in coastal area. In terms of spatial extent, the spatial distribution pattern of REEQ has similarities, and the orientation of the standard deviation ellipse tends to be northeast-southwest from 2000 to 2020. The difference between the long and short axes decreased from 2000 to 2015, indicating an increase in centripetal force in the spatial distribution of REEQ during this period. From 2015 to 2020, this difference increased, indicating a decrease in spatial distribution dispersion and directionality. Overall, the spatial distribution pattern of REEQ remains stable, with a dominant north-south orientation, and the long axis shows a trend of moving northward. The rotation angle of REEQ exhibits a decreasing trend, decreasing from 26.37° in 2000° to 26.02° in 2020, with the maximum rotation angle of 26.40° occurring in 2005. In general, although the rotation angle of REEQ has undergone slight changes, the overall distribution pattern is stable, showing a trend of northeastward movement, which is opposite to the movement direction of the standard deviation ellipse.
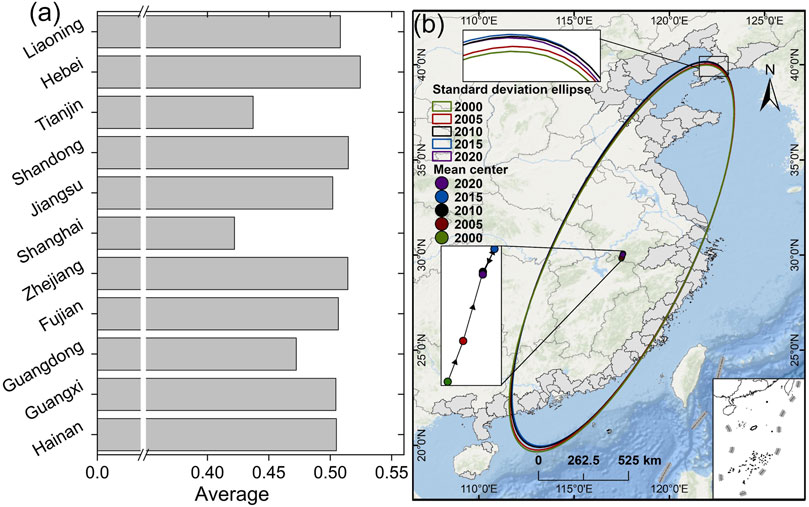
Figure 7. (A) The standard deviation ellipse and (B) center of gravity migration path of REEQ in eastern coastal area of China from 2000 to 2020.
There are numerous indicators for REEQ, and to highlight the key obstacle factors, the top five obstacle factors in terms of obstacle intensity were selected (Table 2). During the study period, the top five obstacle factors remained relatively stable, including S2 (forest coverage rate), S4 (per capita grain production), R1 (effective irrigation rate of farmland), R2 (afforestation area in the current year), R3 (per capita disposable income of rural residents), and R7 (per capita mechanical power of farmers). High obstacle intensity indicators are concentrated in the state and response subsystems. When combined with the subsystem indices mentioned earlier, it becomes evident that although the coastal area have actively implemented governance policies and protective measures, the effectiveness of existing policy measures has been relatively limited due to the rapid development of rural socio-economics.
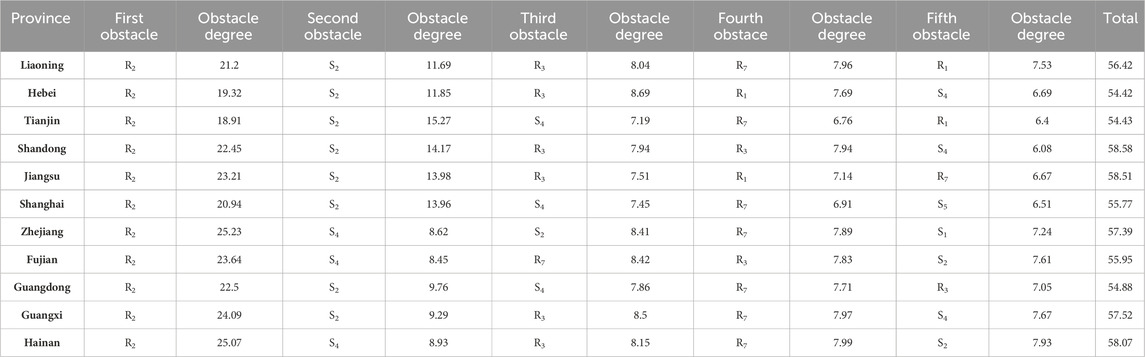
Table 2. Obstacle factors for REEQ in eastern Coastal area of China from 2000 to 2020.
R1 and S2 are the first and second obstacle indicators, and their impact on the development of REEQ remains stable. Forests play a crucial role in air purification, water resource conservation, and soil conservation. While the government continues to invest in afforestation, the one-sided nature of afforestation plans, coupled with insufficient technological capabilities and awareness, may hinder the effective restoration of ecosystem service functions provided by vegetation. Additionally, afforestation areas have decreased in recent years, and without timely adjustments, this may further impede the improvement of REEQ. S4 is related to urban and rural food security, and the decrease in per capita grain production necessitates more land for cultivation, resulting in the conversion of natural land use types such as forests and grasslands into arable land. This leads to a decline in REEQ. Continuous improvement in technological capabilities and the use of technology to enhance crop quality and increase per capita grain production are required. R1 is an obstacle factor in the North China region, which is related to severe soil salinization in this area. Planting on salinized land requires more fresh water for irrigation, leading to a decrease in the effective irrigation rate, which inhibits REEQ. R7 results in energy consumption and emissions of polluting gases, but it can also indirectly contribute to ecological environment protection through agricultural economic benefits. Therefore, continuous improvement in technological capabilities is necessary to reduce pollution emissions, ensuring that the positive impact outweighs the negative. Although the obstacle intensity of R3 has decreased, it remains an important obstacle factor affecting rural ecological environment.
Using the C (posterior difference) validation to verify the prediction results, except for the 10 coastal cities of Jinzhou, Huludao, Weifang, Weihai, Ningde, Fuzhou, Huizhou, Zhongshan, Zhuhai, and Jiangmen, the C values in other coastal cities are all less than 0.3, indicating good accuracy and reliability of the prediction results. The future development of REEQ in eastern coastal area of China is on a continuous upward trend. By 2035, the comprehensive score will increase from 0.542 to 0.630, indicating a favorable trend in the development of REEQ in future years. Environmental governance measures in rural areas will be effectively implemented, leading to a gradual reduction in environmental pollution and continuous improvement of the ecosystem.
The future standard deviation ellipse centroid of REEQ in eastern coastal area of China tends to move northwestward (Figure 8). The rate of centroid movement decreases year by year, with the fastest movement rate from 2020 to 2025, reaching 2.17 km/year. The centroid moves from the southwest to the northeast. Liaoning and Shandong have relatively extensive rural areas with abundant natural resources. However, traditional agricultural production methods still dominate, leading to various unreasonable practices in pesticide, fertilizer, and plastic film usage. In the future, it is necessary to promote industrial structural transformation and upgrading under the guidance of the concept of high-quality rural economic development, develop leisure and emerging agriculture, improve agricultural development efficiency, and reduce the degradation REEQ. In the future, both the long and short axes of the standard deviation ellipse of REEQ will show a slight growth trend, but the difference between them will continue to decrease, indicating an increase in the centripetal force of the spatial distribution of REEQ. The future development center will move northward. The rotation angle of the standard deviation ellipse shows a slow declining trend, indicating a northwestward movement, consistent with the direction of movement of the standard deviation ellipse.
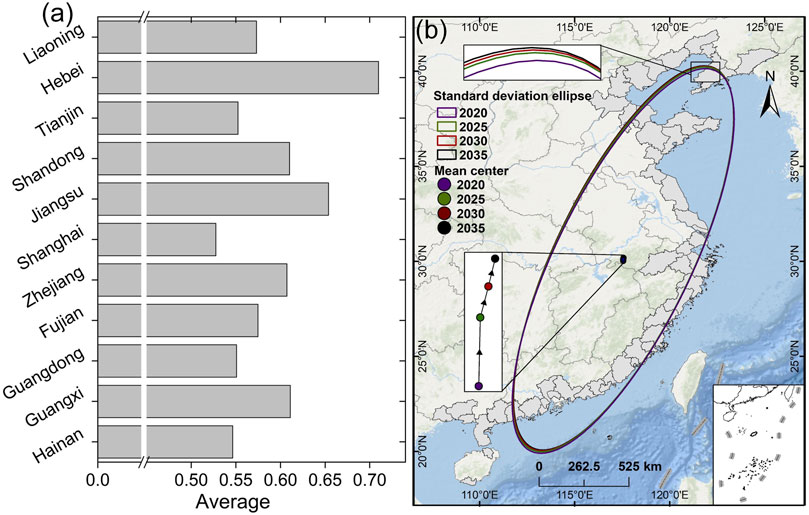
Figure 8. (A) The standard deviation ellipse and (B) center of gravity migration path of REEQ in eastern coastal area of China from 2020 to 2035.
The evaluation of REEQ requires the identification of major issues and contradictions within rural ecological environments. It also involves exploring the evolving status and development directions of rural ecological environments. However, due to the wide range of evaluation subjects and the diversity of resource environments and geographical regions, there is still a lack of uniformity in evaluation methods. These methods primarily include the ecological footprint method (Li et al., 2022b), remote sensing index method (Huang et al., 2021), and comprehensive evaluation method (Yang Q. et al., 2022).
The ecological footprint method, starting from a perspective of biomass, converts resources and energy consumption into land area to assess whether ecosystems are within a sustainable capacity (Siche et al., 2010). While the results are intuitive and operationally feasible, this method tends to overlook the micro-level aspects within the system and lacks consideration for inter-city variations. As a result, the model’s accuracy needs improvement.
The remote sensing index method utilizes image data to comprehensive quantitatively describe various aspects such as climate, topography, land cover, hydrology, and vegetation (Boori et al., 2021). However, in terms of selecting remote sensing indicators, it excessively emphasizes natural environmental indicators, often neglecting considerations related to human economic activities and social development levels. This leads to results that are more aligned with the ecological environment quality under natural conditions without human interference.
The comprehensive evaluation method involves assigning weights to indicators and calculating a composite index to reflect the overall level of ecological environment quality. This method considers a wide range of factors, is computationally simple and flexible, and is suitable for regions with complex functional structures. Given the complexity of rural ecological environments, where single indicators may not fully capture the information on ecological environment quality and problems, the comprehensive evaluation method can provide comprehensive and systematic support for rural ecological environment protection and sustainable development.
The evolution path of the development obstacles of REEQ in the eastern coastal area of China can be divided into three stages. In the first stage (2000–2005), the obstacles at the pressure and state levels rapidly increased, while the obstacles at the response level continued to decrease. This was because during this stage, rural socio-economic development still came at the cost of resource and environmental consumption, with a lower level of attention to the ecological environment. The increasing ecological pressure led to a continuous deterioration of the ecological environment.
In the second stage (2005–2010), the obstacles at the response level increased rapidly. During this phase, both the government and scholars gradually recognized the importance of the rural ecological environment. However, the relevant government policies were still few and lagged behind the ecological environment issues, and did not achieve effective results.
In the third stage (2010–2020), the obstacles at the response level continued to decrease. Government responses to policies had some impact, but the obstacles at the state level continued to rise. This indicates that the accuracy and effectiveness of current responses still need improvement. In the future, government responses need to grasp the key factors more accurately and effectively improve the REEQ.
The calculation of specific indicator obstacles in the evaluation system of REEQ in the eastern coastal area of China is shown in Figure 9. The change trends of obstacle levels for each criterion layer are different, but the overall ranking pattern is relatively stable, with the response level consistently having the highest obstacles and the pressure level having the lowest obstacles. The response subsystem shows a fluctuating decreasing trend, the state subsystem exhibits a fluctuating increasing trend, and the pressure subsystem remains relatively stable. Based on the changing trends of the criterion layers, improving the governance capacity and technological level of REEQ should be prioritized through the response subsystem. Simultaneously, the state and pressure subsystems should be considered to achieve moderate rural socio-economic development while rigorously monitoring and repairing the ecological environment. All of these efforts will collectively contribute to enhancing the REEQ in the eastern coastal area of China.
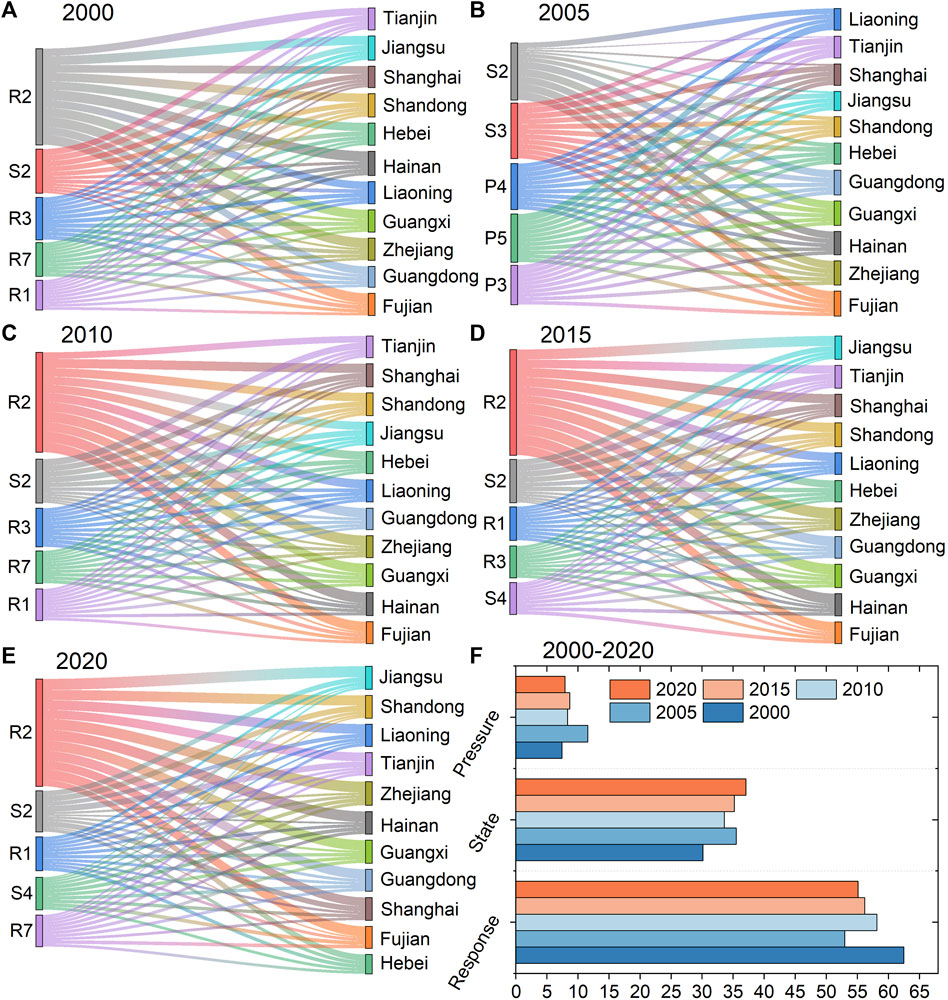
Figure 9. The change of the main obstacle factors in (A–E) index layer and (F) criterion layer from 2000 to 2020.
As urbanization and the rural revitalization strategy advance in eastern coastal area of China, significant achievements have been made in the socio-economic development of rural areas. However, this progress has also resulted in notable ecological and environmental challenges. Based on the research findings, recommendations are provided in terms of pressure, state, and response:
1. During the evolution of REEQ, the significant impact of chemical fertilizers, pesticides, and plastic film is evident. It is essential to accelerate the transformation of development concepts and approaches towards green, sustainable rural development. Embracing resource-efficient and environmentally-friendly agricultural practices is crucial. The government needs to continuously strengthen monitoring and supervision, and accelerate the introduction of emission standards for the use of fertilizers, pesticides, and plastic films. The use of fertilizers, pesticides, and plastic films has decreased by 15% compared to 2020, with an annual reduction of no less than 3%. The coverage rate of soil testing and formula fertilization technology for major crops should be stable at over 90%, and the utilization rate of fertilizers for the three major grain crops should reach 45%. At the same time, the government should accelerate the development of science and technology and the transformation of achievements, promote the transformation of traditional agriculture from highly relying on agricultural chemical inputs to relying on technological progress and labor quality, and effectively improve the rural ecological environment. For example, Pinghu has collaborated with the Chinese Academy of Agricultural Sciences and local science and technology enterprises to develop new technologies such as fertilizer and pesticide reduction, and full quantification of crop straw utilization, achieving water resource recycling and water ecosystem management. This has made important contributions to the historic transformation of county rivers from generally inferior Class 5 water quality to Class 3 water quality, and supported Pinghu to be recognized as a provincial-level leading county for agricultural green development.
2. Ecological land, such as forests and grasslands, plays a crucial role in promoting green rural development. However, in the process of rapid rural economic development and urbanization, a significant portion of ecological land has been converted into construction land and arable land. While measures like converting cropland to forests and returning farmland to lakes have resulted in some construction land being converted back to forests or grasslands, the future trend is not optimistic. It is necessary to expedite the identification of key areas for rural ecological protection and restoration, firmly adhere to the redlines for arable land and ecological conservation, and strengthen ecological conservation efforts, and strive to increase the proportion of ecological land to over 40% of the land area, achieve forest coverage of over 25%, and the water surface ratio of rivers and lakes not less than 10%. For example, since the pilot project of ecological protection and restoration of mountains, rivers, forests, fields, lakes and grass in the Nanling Mountains in northern Guangdong, Nanxiong has focused on the positioning of key ecological functional areas and important water conservation areas, innovated various ecological governance technologies, significantly improved vegetation coverage and biodiversity, and added more than 6,000 hm2 of farmland, which not only preserves the red line of farmland, but also achieves multi-win economic, social and ecological benefits.
3. Current rural ecological and environmental governance faces challenges related to significant funding requirements, inadequate investment, lack of governance entities, and a lagging governance market. The government needs to strengthen investment in environmental protection governance, achieve an annual increase of 5% in environmental protection funding, and establish diversified financing channels through enterprises, government, and social capital, innovate rural environmental governance mechanisms, encourage a variety of market entities to participate in rural environmental pollution control, and tailor environmental protection standards and regulations to local conditions. This will promote the institutionalization and normalization of rural environmental governance. For example, Wangjiataihou Village in Qingdao has received more than 60 million government funds to comprehensively improve the village’s ecological environment, thoroughly clean up stubborn hygiene blind spots such as garbage dumps and toilets, lay sewage pipes to achieve rainwater and sewage diversion and flow into the sewage treatment station for treatment, and formulate corresponding pollution treatment regulations to promote environmental governance to institutionalization and normalization. Through joint governance from multiple aspects, Wangjiataihou Village has been awarded honorary titles such as China Rural Governance Demonstration Village and Shandong Province Ecological Culture Village.
Rural ecological environments are characterized by their complexity and variability, influenced by a multitude of factors including internal ecosystem dynamics and socioeconomic development. Constructing models to measure REEQ may not fully capture this complexity and can be subject to human subjectivity during the evaluation process. Therefore, continuous theoretical refinement and in-depth practical exploration are needed. The key to accurate evaluation results lies in the indicator system. Due to significant changes in rural administrative divisions and the absence of clear boundaries, using statistical data from government statistical yearbooks as indicators reflects the overall current state of REEQ in a relatively objective manner. However, it cannot account for internal heterogeneity within rural areas. In the future, it is necessary to gradually improve the evaluation indicator system, construct a multi-source data approach, and combine spatial connectivity assessment methods to analyze the heterogeneity and underlying mechanisms of REEQ. This will enable the achievement of coordinated and sustainable development of rural ecological environments and socioeconomic factors.
This study used a grey forecasting model to predict the future REEQ in eastern coastal area of China, which to a certain extent reflects the future trends. However, forecasting models cannot determine the stability of future development trends. It is necessary to strengthen the analysis of the stability of the future development trend, so as to more accurately evaluate the future development of rural ecological environment in the eastern coastal area of China. REEQ is influenced by various factors including social, economic, and ecological aspects. This study only considered the future status of REEQ in eastern coastal area of China under the existing development model. It did not consider scenarios involving the protection of key ecological environments and the development of socioeconomic factors. Therefore, it is essential to conduct scenario simulations to address the current research limitations.
Based on the PSR model, an evaluation indicator system was constructed from the perspectives of pressure, state, and response to measure REEQ. The study analyzed and predicted the spatial distribution pattern of REEQ. The research findings indicate an upward trend in REEQ in eastern coastal area of China, transitioning from low to high levels. The number of high-grade REEQ areas increased from 0 to 29 by 2020, showing a positive development trend. Although there is minimal variation in the kernel density values of REEQ, they continue to rise. High-value areas are concentrated in northern Guangdong and Zhejiang. The center of gravity of REEQ standard deviation ellipses shows a tendency to move from the southwest to the northeast, with directions trending from the northeast to the southwest. The rotation angle exhibits a downward trend. From 2020 to 2035, REEQ in eastern coastal area of China will continue to improve. The standard deviation ellipse is expected to move in the northwest direction, with the center of gravity shifting from the southwest to the northeast, while the rotation angle gradually decreases, aligning with the direction of ellipse movement, indicating a northwestward trend.
Identifying and diagnosing obstacles to REEQ and proposing policy recommendations can provide a scientific basis for the sustainable development of rural areas. In the criteria layer of REEQ in eastern coastal area of China, the pattern of obstacle degree ranking remains relatively stable, with the response subsystem having the highest obstacle degree, followed by the state and pressure subsystems. The top 6 obstacle indicators are basically stable; In response to obstacles such as the effective irrigation rate of farmland and the per capita total mechanical power of farmers, it is necessary to accelerate the development of science and technology and the transformation of achievements. By improving the effective utilization rate of agricultural water, fertilizers, and pesticides, accelerating the treatment of solid waste and wastewater, it is necessary to promote the REEQ; In response to obstacles such as per capita grain yield, forest coverage, and annual afforestation area, by identifying key areas for rural ecological protection and restoration, utilizing geographic information technology to grasp the types, structures, functions, and damage of ecosystems, and based on different main environmental factors in different restoration areas, an integrated protection and restoration technology system suitable for the region is constructed. At the same time, relevant policies and legal systems for land ecological protection are further improved, and the red line for farmland and ecological protection is firmly maintained; In response to obstacles such as per capita disposable income of rural households, we will innovate and develop rural environmental governance mechanisms. By increasing funding for fishery resource protection and fishermen’s conversion subsidies, rural environmental protection funds, forestry subsidies, and agricultural and forestry technology transformation and promotion funds, we will encourage multiple market entities to participate in rural environmental pollution control and accelerate the transformation of scientific and technological achievements. While improving the income of rural residents, we will promote rural environmental governance.
The evaluation of REEQ involves multiple disciplines such as geography, ecology, and economics. Future research should strengthen interdisciplinary collaboration, highlight disciplinary integration, and use multiple technological means such as 3S technology platforms, artificial intelligence, and spatiotemporal big data to integrate multi-source data, providing scientific support for the long-term monitoring of REEQ. At the same time, the evaluation index system for REEQ needs to be tailored to local conditions, objectively reflecting the essential characteristics of the ecosystem, comprehensively considering natural, human activities, and socio-economic factors, deeply exploring the impact and response mechanism of indicator factors on the ecological environment, and formulating a unified evaluation index system.
The original contributions presented in the study are included in the article/Supplementary Material, further inquiries can be directed to the corresponding author.
CY: Conceptualization, Investigation, Software, Validation, Writing–original draft, Writing–review and editing. YL: Conceptualization, Software, Writing–original draft, Resources. YC: Methodology, Resources, Supervision, Writing–review and editing. JZ: Investigation, Validation, Writing–review and editing. SA: Validation, Writing–review and editing. PT: Validation, Visualization, Writing–review and editing. QH: Validation, Writing–review and editing. LC: Resources, Validation, Writing–review and editing. AM: Supervision, Writing–review and editing.
The author(s) declare that financial support was received for the research, authorship, and/or publication of this article. This research was supported by the National Natural Science Foundation of China (42276234), the Open Fund of the Key Laboratory of Coastal Zone Exploitation and Protection, Ministry of Natural Resources of China (2023CZEPK04), Natural Science Foundation of Zhejiang Province (No. LQ20D010006), Zhejiang Provincial Philosophy and Social Sciences Planning Project (No. 24NDQN128YBM), Ningbo University graduate research innovation Fund (IF2023038).
The authors declare that the research was conducted in the absence of any commercial or financial relationships that could be construed as a potential conflict of interest.
All claims expressed in this article are solely those of the authors and do not necessarily represent those of their affiliated organizations, or those of the publisher, the editors and the reviewers. Any product that may be evaluated in this article, or claim that may be made by its manufacturer, is not guaranteed or endorsed by the publisher.
Argent, N. (2019). Rural geography III: marketing, mobilities, measurement and metanarratives. Prog. Hum. Geogr. 43, 758–766. doi:10.1177/0309132518778220
Boori, M. S., Choudhary, K., Paringer, R., and Kupriyanov, A. (2021). Eco-environmental quality assessment based on pressure-state-response framework by remote sensing and GIS. Remote Sens. Appl. Soc. Environ. 23, 100530. doi:10.1016/j.rsase.2021.100530
Cai, J., Li, X., Liu, L., Chen, Y., Wang, X., and Lu, S. (2021). Coupling and coordinated development of new urbanization and agro-ecological environment in China. Sci. Total Environ. 776, 145837. doi:10.1016/j.scitotenv.2021.145837
Chen, H., and Zhang, X. (2019). Study on the path of agricultural ecological construction improving agricultural production efficiency. Ekoloji Derg.
Cheng, W., Xi, H., Sindikubwabo, C., Si, J., Zhao, C., Yu, T., et al. (2020). Ecosystem health assessment of desert nature reserve with entropy weight and fuzzy mathematics methods: a case study of Badain Jaran Desert. Ecol. Indic. 119, 106843. doi:10.1016/j.ecolind.2020.106843
Costanza, R., d'Arge, R., De Groot, R., Farber, S., Grasso, M., Hannon, B., et al. (1997). The value of the world's ecosystem services and natural capital. nature 387, 253–260. doi:10.1038/387253a0
Cui, R., Han, J., and Hu, Z. (2022). Assessment of spatial temporal changes of ecological environment quality: a case study in huaibei city, China. Land 11, 944. doi:10.3390/land11060944
Gao, S., Sun, H., Cao, G., Zhao, L., Wang, R., and Xu, M. (2020). Dynamic state of ecosystem carrying capacity under island urbanization: a case study of pingtan island in the southeastern coast of China. J. Environ. Eng. Landsc. Manag. 28, 1–8. doi:10.3846/jeelm.2020.9798
Gao, Y., and Li, Z. (2022). Study of coupling coordination development of ecology and economy of gansu area of qilian mountain national park in China based on dfsr model. Fresenius Environ. Bull. 31, 7019–7030.
Ghosh, S., Chatterjee, N. D., and Dinda, S. (2021). Urban ecological security assessment and forecasting using integrated DEMATEL-ANP and CA-Markov models: a case study on Kolkata Metropolitan Area, India. Sustain. Cities Soc. 68, 102773. doi:10.1016/j.scs.2021.102773
Gu, J., Zheng, J., and Zhang, J. (2022). Research on the coupling coordination and prediction of industrial convergence and ecological environment in rural of China. Front. Environ. Sci. 10, 1014848. doi:10.3389/fenvs.2022.1014848
Guo, L., Cao, A., Huang, M., and Li, H. (2021). Effects of haze pollution on pesticide use by rice farmers: fresh evidence from rural areas of China. Environ. Sci. Pollut. Res. 28, 62755–62770. doi:10.1007/s11356-021-15133-5
Hou, S., Zhen, Y., Cao, X., Zhang, W., and Wu, T. (2023). Evaluation index system of urban agglomeration governance under the background of high-quality development: a case of the yangtze river delta. Econ. Geogr. 42, 35–44. doi:10.15957/j.cnki.jjdl.2022.02.005
Hu, X., Ma, C., Huang, P., and Guo, X. (2021). Ecological vulnerability assessment based on AHP-PSR method and analysis of its single parameter sensitivity and spatial autocorrelation for ecological protection–A case of Weifang City, China. Ecol. Indic. 125, 107464. doi:10.1016/j.ecolind.2021.107464
Hu, Z., Qian, M., Teng, X., Zhang, Z., Zhong, F., Cheng, Q., et al. (2022). The spatiotemporal evolution of ecological security in border areas: a case study of southwest China. Land 11, 892. doi:10.3390/land11060892
Huang, H., Chen, W., Zhang, Y., Qiao, L., and Du, Y. (2021). Analysis of ecological quality in lhasa metropolitan area during 1990–2017 based on remote sensing and google earth engine platform. J. Geogr. Sci. 31, 265–280. doi:10.1007/s11442-021-1846-8
Huang, L., and Li, X. (2022). Analysis of rural ecological governance and environmental risk assessment in a dual-carbon environment. Fresenius Environ. Bull. 31, 7949–7955.
Li, L., Fan, Z., Feng, W., Yuxin, C., and Keyu, Q. (2022a). Coupling coordination degree spatial analysis and driving factor between socio-economic and eco-environment in northern China. Ecol. Indic. 135, 108555. doi:10.1016/j.ecolind.2022.108555
Li, L., Ye, X., and Wang, X. (2022b). Evaluation of rural tourism carrying capacity based on ecological footprint model. Wirel. Commun. Mob. Comput. 2022, 1–10. doi:10.1155/2022/4796908
Li, Q., Wu, X., Zhang, Y., and Wang, Y. (2020). The effect of agricultural environmental total factor productivity on urban-rural income gap: integrated view from China. Sustainability 12, 3327. doi:10.3390/su12083327
Li, S., Zhang, L., Su, L., and Nie, Q. (2023b). Exploring the coupling coordination relationship between eco-environment and renewable energy development in rural areas: a case of China. Sci. Total Environ. 880, 163229. doi:10.1016/j.scitotenv.2023.163229
Li, T., Zhang, Q., Wang, G., Singh, V. P., Zhao, J., Sun, S., et al. (2023a). Ecological degradation in the inner Mongolia reach of the yellow river basin, China: spatiotemporal patterns and driving factors. Ecol. Indic. 154, 110498. doi:10.1016/j.ecolind.2023.110498
Li, W., and Yi, P. (2020). Assessment of city sustainability—coupling coordinated development among economy, society and environment. J. Clean. Prod. 256, 120453. doi:10.1016/j.jclepro.2020.120453
Li, X., and Luo, F. (2022). A dynamic econometric analysis of urbanization and ecological environment in silk road economic belt. Sci. Program. 2022, 1–8. doi:10.1155/2022/4895213
Liang, L. (2009). Study on the evolution temporal and spatial of rural ecological environment. Nanjing Agric. Univ.
Lin, J., Lei, J., Yang, Z., and Li, J. (2019). Differentiation of rural development driven by natural environment and urbanization: a case study of kashgar region, Northwest China. Sustainability 11, 6859. doi:10.3390/su11236859
Liu, L., Li, J., Wang, J., Liu, F., Cole, J., Sha, J., et al. (2022). The establishment of an eco-environmental evaluation model for southwest China and eastern South Africa based on the DPSIR framework. Ecol. Indic. 145, 109687. doi:10.1016/j.ecolind.2022.109687
Meier, M. A. (1997). Eco-efficiency evaluation of waste gas purification systems in the chemical industry. ETH Zurich.
Nunes, L. J. R., Meireles, C. I. R., Pinto Gomes, C. J., and de Almeida Ribeiro, N. M. C. (2019). Socioeconomic aspects of the forests in Portugal: recent evolution and perspectives of sustainability of the resource. Forests 10, 361. doi:10.3390/f10050361
Qian, L., Zhang, K., Song, J.-X., and Tang, W.-Y. (2022). Regional differences and convergence of urban-rural integration development from the perspective of factor flow. J. Environ. Public Health 2022, 1–15. doi:10.1155/2022/2695366
Qian, X. (2023). Research on the coordinated development model of marine ecological environment protection and economic sustainable development. J. Sea Res. 193, 102377. doi:10.1016/j.seares.2023.102377
Rao, J. (2022). Comprehensive land consolidation as a development policy for rural vitalisation: rural in situ Urbanisation through semi socio-economic restructuring in Huai Town. J. Rural Stud. 93, 386–397. doi:10.1016/j.jrurstud.2020.09.009
Rapport, D. J., Costanza, R., and McMichael, A. J. (1998). Assessing ecosystem health. Trends Ecol. Evol. 13, 397–402. doi:10.1016/s0169-5347(98)01449-9
Saaty, T. L. (1977). A scaling method for priorities in hierarchical structures. J. Math. Psychol. 15, 234–281. doi:10.1016/0022-2496(77)90033-5
Siche, R., Pereira, L., Agostinho, F., and Ortega, E. (2010). Convergence of ecological footprint and emergy analysis as a sustainability indicator of countries: Peru as case study. Commun. Nonlinear Sci. Numer. Simul. 15, 3182–3192. doi:10.1016/j.cnsns.2009.10.027
Song, J., Wang, H., and Wang, F. (2013). Research progress of ecological environment quality assessment and methods review. Environ. Sci. Technol., 448–453.
Sun, J., Miao, J., Mu, H., Xu, J., and Zhai, N. (2022). Sustainable development in marine economy: assessing carrying capacity of Shandong province in China. Ocean Coast. Manag. 216, 105981. doi:10.1016/j.ocecoaman.2021.105981
Sun, X., Li, Q., Kong, X., Cai, W., Zhang, B., and Lei, M. (2023). Spatial characteristics and obstacle factors of cultivated land quality in an intensive agricultural region of the North China plain. Land 12, 1552. doi:10.3390/land12081552
Tian, S., Zhang, Y., Xu, Y., Wang, Q., Yuan, X., Ma, Q., et al. (2022). Urban ecological security assessment and path regulation for ecological protection-A case study of Shenzhen, China. Ecol. Indic. 145, 109717. doi:10.1016/j.ecolind.2022.109717
Wang, F., Lu, Y., Li, J., and Ni, J. (2021). Evaluating environmentally sustainable development based on the PSR framework and variable weigh analytic hierarchy process. Int. J. Environ. Res. Public Health 18, 2836. doi:10.3390/ijerph18062836
Wang, H., He, J., Aziz, N., and Wang, Y. (2022b). Spatial distribution and driving forces of the vegetable industry in China. Land 11, 981. doi:10.3390/land11070981
Wang, J., Ding, X., Li, D., and Li, S. (2022a). The impact of organizational support, environmental health literacy on farmers’ willingness to participate in rural living environment improvement in China: exploratory analysis based on a PLS-SEM model. Agriculture 12, 1798. doi:10.3390/agriculture12111798
Wang, J., Liu, Y., and Li, Y. (2019). Ecological restoration under rural restructuring: a case study of Yan’an in China’s loess plateau. Land Use Policy 87, 104087. doi:10.1016/j.landusepol.2019.104087
Wei, L., Wang, Y., Zhou, Z., and Luo, J. (2023). Unlocking the effects and optimization path of financial support for improvement in environmental quality and rural revitalization development: an empirical analysis based on provincial data of Shaanxi province. Environ. Sci. Pollut. Res. 30, 46795–46812. doi:10.1007/s11356-023-25569-6
Wen, B., and Burley, J. B. (2020). Expert opinion dimensions of rural landscape quality in Xiangxi, Hunan, China: principal component analysis and factor analysis. Sustainability 12, 1316. doi:10.3390/su12041316
Xiang, M., Lin, X., Yang, X., and Zhang, S. (2020). Ecological environment evaluation of forest ecosystem nature reserves using an unweighted cloud model. Water 12, 1905. doi:10.3390/w12071905
Xie, B., Jones, P., Dwivedi, R., Bao, L., and Liang, R. (2023). Evaluation, comparison, and unique features of ecological security in southwest China: a case study of Yunnan Province. Ecol. Indic. 153, 110453. doi:10.1016/j.ecolind.2023.110453
Xu, W., and Sun, T. (2021). Evaluation of rural habitat environment in under-developed areas of Western China: a case study of Northern Shaanxi. Environ. Dev. Sustain. 24, 10503–10539. doi:10.1007/s10668-021-01881-4
Xu, W., Xu, F., Liu, Y., and Zhang, D. (2021). Assessment of rural ecological environment development in China’s moderately developed areas: a case study of Xinxiang, Henan province. Environ. Monit. Assess. 193, 801–825. doi:10.1007/s10661-021-09383-6
Xu, Y., Wang, M., Xu, Y., Li, X., Wu, Y., and Chi, F. a. (2023). Evaluation system creation and application of “zero-pollution village” based on combined FAHP-TOPSIS method: a case study of Zhejiang province. Sustainability 15, 12367. doi:10.3390/su151612367
Xue, J., Wang, Q., and Zhang, M. (2022). A review of non-point source water pollution modeling for the urban–rural transitional areas of China: research status and prospect. Sci. Total Environ. 826, 154146. doi:10.1016/j.scitotenv.2022.154146
Yang, Q., Li, J., and Tang, Y. (2022b). The dilemma of the great development of rural tourism from the sustainable environment perspective. J. Environ. public health 2022, 1–11. doi:10.1155/2022/7195813
Yang, X., Li, W., Zhang, P., Chen, H., Lai, M., and Zhao, S. (2023). The dynamics and driving mechanisms of rural revitalization in western China. Agriculture 13, 1448. doi:10.3390/agriculture13071448
Yang, X., Liu, S., Jia, C., Liu, Y., and Yu, C. (2021). Vulnerability assessment and management planning for the ecological environment in urban wetlands. J. Environ. Manag. 298, 113540. doi:10.1016/j.jenvman.2021.113540
Yang, Z., Liu, T., Shen, N., Guan, M., Zheng, Y., and Jiang, H. (2022a). Resource and environment constraints and promotion strategies of rural vitality: an empirical analysis of rural revitalization model towns. Front. Environ. Sci. 10, 956644. doi:10.3389/fenvs.2022.956644
Yin, Z. (2023). The pollution of microplastics in sediments: the ecological risk assessment and pollution source analysis. Sci. Total Environ. 859, 160323. doi:10.1016/j.scitotenv.2022.160323
Yu, D., Hu, S., Tong, L., Xia, C., and Ran, P. (2022). Dynamics and determinants of the grain yield gap in major grain-producing areas: a case study in Hunan Province, China. Foods 11, 1122. doi:10.3390/foods11081122
Yuan, K., Hu, B., Li, X., Niu, T., and Zhang, L. (2023). Exploration of coupling effects in the digital economy and eco-economic system resilience in urban areas: case study of the beijing-tianjin-hebei urban agglomeration. Sustainability 15, 7258. doi:10.3390/su15097258
Yurui, L., Luyin, Q., Qianyi, W., and Karácsonyi, D. (2020). Towards the evaluation of rural livability in China: theoretical framework and empirical case study. Habitat Int. 105, 102241. doi:10.1016/j.habitatint.2020.102241
Zhang, G., and Zeng, Z. (2022). Environmental quality optimization of sustainable rural revitalization strategy based on improved genetic algorithm. Mob. Inf. Syst. 2022 2022, 1–15. doi:10.1155/2022/3775515
Zhang, S., Chen, W., Li, Q., and Li, M. (2023). Evaluation and development strategy of urban–rural integration under ecological protection in the Yellow River Basin, China. Environ. Sci. Pollut. Res. 30, 92674–92691. doi:10.1007/s11356-023-28950-7
Zhu, C., Lin, Y., Zhang, J., Gan, M., Xu, H., Li, W., et al. (2021). Exploring the relationship between rural transition and agricultural eco-environment using a coupling analysis: a case study of Zhejiang Province, China. Ecol. Indic. 127, 107733. doi:10.1016/j.ecolind.2021.107733
Zhu, S., Huang, J., and Zhao, Y. (2022). Coupling coordination analysis of ecosystem services and urban development of resource-based cities: a case study of Tangshan city. Ecol. Indic. 136, 108706. doi:10.1016/j.ecolind.2022.108706
Keywords: rural ecological environment quality, PSR model, spatiotemporal characteristics, prediction, eastern coastal area of China
Citation: Ying C, Li Y, Chen Y, Zhong J, Ai S, Tian P, Huang Q, Cao L and Mouazen AM (2024) Evolution and prediction of rural ecological environment quality in eastern coastal area of China. Front. Environ. Sci. 12:1403342. doi: 10.3389/fenvs.2024.1403342
Received: 11 April 2024; Accepted: 27 June 2024;
Published: 15 July 2024.
Edited by:
Paul Mayer, United States Environmental Protection Agency (EPA), United StatesReviewed by:
Gnana Sanga Mithra S., Vinayaka Missions Research Foundation (DU), IndiaCopyright © 2024 Ying, Li, Chen, Zhong, Ai, Tian, Huang, Cao and Mouazen. This is an open-access article distributed under the terms of the Creative Commons Attribution License (CC BY). The use, distribution or reproduction in other forums is permitted, provided the original author(s) and the copyright owner(s) are credited and that the original publication in this journal is cited, in accordance with accepted academic practice. No use, distribution or reproduction is permitted which does not comply with these terms.
*Correspondence: Luodan Cao, Y2FvbHVvZGFuQG5idS5lZHUuY24=
Disclaimer: All claims expressed in this article are solely those of the authors and do not necessarily represent those of their affiliated organizations, or those of the publisher, the editors and the reviewers. Any product that may be evaluated in this article or claim that may be made by its manufacturer is not guaranteed or endorsed by the publisher.
Research integrity at Frontiers
Learn more about the work of our research integrity team to safeguard the quality of each article we publish.