 Xian Yang
 Yang Yu1*
 Panyu Peng
94% of researchers rate our articles as excellent or good
Learn more about the work of our research integrity team to safeguard the quality of each article we publish.
Find out more
ORIGINAL RESEARCH article
Front. Environ. Sci., 11 July 2024
Sec. Land Use Dynamics
Volume 12 - 2024 | https://doi.org/10.3389/fenvs.2024.1401310
With the rapid expansion of high-speed rail (HSR), the HSR station areas are often the key development areas of the cities and the gateways to display the cities’ image. However, the problem of lack of vitality in these areas has emerged. Limited studies have quantified the vitality of HSR station areas and examined the factors influencing it. The purpose of this study is to assess the impact of various factors on the vitality of HSR station areas. To accomplish this objective, we propose a method for measuring the vitality of HSR station areas using Baidu’s real-time user density data. We demonstrate the method through the case study of 91 HSR station areas in the Chengdu-Chongqing urban agglomeration in China. We construct structural equation models using a Bayesian approach to test the effects of intercity accessibility, intracity accessibility, surrounding area density, and local socio-economic development on the vitality of HSR station areas. The results show that (1) Intracity accessibility, surrounding area density, and local socioeconomic development have significant positive effects on the vitality density of HSR station areas. Intercity accessibility has a negative effect on the vitality density of HSR station areas. (2) Surrounding area density positively influences the stability of weekday and weekend vitality in HSR station areas. Local socio-economic development negatively impacts the stability of weekend vitality in HSR station areas. (3) High-vitality HSR station areas are mostly located in Chengdu and Chongqing, both megacities. Station areas with low vitality are primarily located in small cities. This study’s findings can be used to guide the planning and decision-making of HSR station areas aimed at enhancing their vitality.
As one of the most critical innovations in the railway system, high-speed rail is expanding rapidly worldwide. HSR’s high capacity and speed can facilitate rapid population movement and economic activity between cities. Not only are HSR stations important hubs for regional intercity transportation, but their surrounding areas also play a significant role in interpersonal exchanges and interactions. The areas surrounding HSR stations tend to be key development areas for cities. In particular, China is rapidly expanding its HSR network and has constructed many new HSR stations at the city fringes or periphery. The local governments believe that the HSR will stimulate development around the stations, so they have built numerous new zones around the stations in order to create a vibrant environment. Creating a vibrant HSR station area is expected to increase the area’s commercial value, improve public space efficiency, and enhance the city’s image (Jacobs, 1992).
In practice, however, HSR station areas are not always vibrant. For example, many of the new HSR zones planned around HSR stations in China have remained vacant for long periods and have become HSR ghost towns (Zhao and Ma, 2017; Dong L. et al., 2021). Additionally, several businesses near HSR stations have difficulty developing (Facchinetti-Mannone, 2009; Vickerman, 2015). Identifying the factors that influence the vitality of HSR station areas is essential to promoting their vitality. There are several uses for investigating the factors influencing the vitality of these areas: (1) It can be used as a guide for the regeneration of HSR station areas to increase their vibrancy; (2) It can be used as a basis to determine the locations of HSR stations; (3) It can be used to provide recommendations concerning commercial projects surrounding HSR stations.
However, research on this topic is scarce at present. Most studies of urban vitality have focused on entire cities or neighbourhoods, including streets, parks, communities, metro station areas, and more (Kang, 2020; Guo et al., 2021; Xiao et al., 2021). A limited number of studies have examined vitality at the local scale of HSR station areas. Wang et al. (2022a) investigated the vitality of the Yangtze River Delta’s HSR station areas and factors affecting it. However, the study quantified the vitality of HSR station areas using built environment and socioeconomic indicators. The vitality of population flow in HSR station areas and the factors affecting it were not assessed. Urban vitality is generally defined as the spatial distribution of people flows and activities (Jacobs, 1992). People flow and activity data with spatial and temporal dimensions can more accurately reflect the vitality of HSR station areas. Therefore, it is essential to quantify the vitality of HSR station areas and identify the factors that influence it from the perspective of population vitality. In addition, most current studies used traditional regression models to investigate urban vitality factors (Yu et al., 2022). However, this approach makes constructing complex causal relationships between multiple variables difficult. It cannot be utilised to examine the relationships between space vitality and unobservable variables, such as intercity and intracity accessibility (Liu et al., 2021). Several studies have shown a significant correlation between intercity accessibility, intracity accessibility, and the development of HSR station areas (Deng et al., 2020). Nevertheless, research has yet to investigate how these unobservable variables causally affect the vitality of HSR station areas.
In order to fill this research gap, this study employs structural equation modelling, which enables the analysis of complex causal relationships between multiple variables that cannot be directly observed and dependent variables (Hoyle, 1995). This method has been employed in recent years to study urban spaces and their vitality (Liu et al., 2021; van de Coevering et al., 2021; Prithviraj and Sundaram, 2023). The Chengdu-Chongqing agglomeration (CCUA) is employed as a case study in this study with the objective of examining the impact of intercity accessibility, intracity accessibility, surrounding area density, and local socio-economic development on population vitality in HSR station areas. The study will address three research questions: (1) How can the vitality of HSR station areas be quantified? (2) What factors affect the vitality of HSR station areas? (3) What is the relationship between the various factors affecting HSR station area vitality?
Furthermore, the following three contributions are made by this study. First, we quantified the population vitality of HSR station areas using real-time Baidu user density (RBUD) data. Second, we examined the causal relationships between the unobservable variables of intercity accessibility, intracity accessibility, surrounding area density, local socio-economic development, and the vitality of HSR station areas. Finally, we provided insights for planning and decision-making in HSR station areas to enhance vitality.
In this paper, following the introduction (Section 1), Section 2 reviews the research on urban vitality and the factors affecting the development and vitality of HSR station areas. Section 3 introduces the study area, methods, and data sources. Section 4 presents the results of the analysis. Section 5 discusses the conclusions of the analysis and practical applications. Section 6 concludes the study and discusses future directions for research.
Many researchers have examined how HSR affects host cities from various perspectives, including accessibility, economic development, and labour migration (Garmendia et al., 2012; Vickerman, 2018). However, only a few studies have been conducted at the local scale in HSR station areas (Yin et al., 2015). Research in HSR station areas focused on land use (Wenner and Thierstein, 2022), economic development (Kim et al., 2018), transportation and land use integration (Wei and Wang, 2022), quality of place (Du J. et al., 2021), and planning decision-making mechanisms (Dai, 2015). Few studies have been conducted on urban vitality in HSR station areas. Wang L. et al. (2022) measured the vitality of HSR station areas using several built environment and socio-economic indicators. According to their study, the vitality of HSR station areas was positively influenced by factors such as station-city connectivity and city administrative level. However, the urban vitality index used in the study was not constructed from the perspective of people flows and activities. As HSR station areas are considered to be important places for human interaction (Bertolini, 1999), it is essential to conduct vitality research from this perspective.
According to Jacobs (1992), urban vitality can be defined as the interaction between human activities and the environment. It has been demonstrated that a vibrant and high-quality area can spontaneously draw a variety of individuals to visit and engage in social activities during differing periods (Gehl, 2011). Consequently, the study defines the vitality of HSR station areas through the intensity and stability of population activities within each unit of the environment.
Currently, methods for measuring population vitality can be broadly categorised as field survey methods and big data methods. Field survey methods include interviews, questionnaires, on-site observation, instrumental monitoring, etc. These methods are time-consuming, require much human support, and are more appropriate for measuring urban vitality on a small scale and for a short period (Liu et al., 2023). Location-based services (LBS) data were mainly used in big data methods. There are several advantages to using this type of data. These include its large scale, large time span, ease of access, and ability to reflect spatial and temporal distribution patterns of population activities. This method is more appropriate for studies involving large geographical areas and local areas of multiple cities. The use of real-time LBS data has become increasingly popular in the study of urban vitality recently (Kang, 2020; Jiang et al., 2022), including Tencent user density data, mobile phone signalling data, and Sina Weibo data. For instance, Liu et al. (2021) investigated Huangpu River waterfront vitality in Shanghai based on Tencent user density data and analysed the factors that influence it. Xia et al. (2022) used mobile phone signal data to evaluate Changsha’s spatial vitality. However, a study that measures the vitality of HSR station areas in multiple cities has yet to be conducted using real-time LBS data. Therefore, appropriate technological methods are needed to measure population vitality in HSR station areas.
Few studies examined the factors influencing the vitality of HSR station areas. Nevertheless, some studies have investigated factors affecting the vitality of other types of public transportation station areas (Dong Y.-H. et al., 2021; Xu and Chen, 2021; Tu et al., 2022). These studies can provide insight into the selection of factors that influence the vitality of HSR station areas in the following section. For instance, Tu et al. (2022) found a significant relationship between local socio-economic development, transport facilities, the built environment, and the vitality of subway station areas. Xu and Chen (2021) also found a correlation between transport accessibility and underground space vitality in metro stations. Wang et al. (2022b) found that multiple POI types have a positive effect on population vitality in metro station areas.
In addition, there have been some studies on the effects of HSR on neighbouring areas and the development of HSR station areas. These studies mainly discussed the intercity accessibility (Wang et al., 2013; Moyano et al., 2019b; Huang and Zong, 2020), intracity accessibility (Wang et al., 2013; Moyano et al., 2018; Zhao et al., 2018; Moyano et al., 2019a; Moyano et al., 2019b; Yang et al., 2019), the built environment of the neighbouring areas (Du J. et al., 2021; Wenner and Thierstein, 2022), local socio-economic development (Pol, 2003; Kim et al., 2018; Deng et al., 2020; Zhao et al., 2023) and other factors (Sun, 2016; Wang et al., 2021) of HSR stations (Table 1). According to these literatures, several factors have been found to be positively correlated with the development of HSR station areas. These factors include the level of local socio-economic development, the frequency of station services, transport connections to the city, HSR station operating times, and city administration levels (Deng et al., 2020; Wang L. et al., 2022). A negative correlation exists between the development of HSR station areas and the distance between the station and the city center (Deng et al., 2020; Wang L. et al., 2022). The studies serve as the basis for selecting factors influencing the vitality of HSR station areas in the later section.
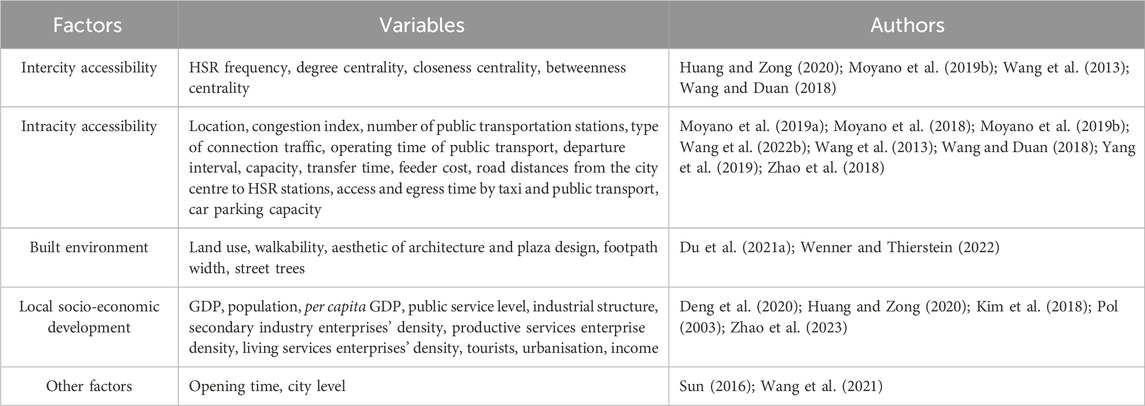
Table 1. Factors associated with the vitality of HSR station areas in theoretical and empirical studies.
Despite this, empirical research regarding how HSR station areas influence vitality remains contentious and insufficiently explored. First, according to Du Z. et al. (2021), the frequency of train service positively correlated with nightlight brightness in HSR station areas. However, the study by Wang L. et al. (2022) did not find that frequency of train service had a significant effect on HSR station areas’ vitality. There is a need to investigate the causal relationship between train service frequency and the vitality of HSR station areas. Second, the causal relationship between intercity accessibility, intracity accessibility, surrounding area density, local socio-economic development, and the vitality of HSR station areas has not yet been fully explored. Meanwhile, the LBS data has not yet been used in studies to quantify the population vitality of the HSR station areas. Lastly, many studies have used regression models to analyse factors affecting urban vitality but have not explored the impact of multiple unobservable variables on the vitality of HSR station areas.
The study used 91 HSR station areas in the CCUA in China as a case study. The urban agglomeration is the most densely populated area in western China. There are two megacities with a population of 10 million or more in the urban agglomeration, Chengdu and Chongqing, as well as six large cities with a population of one million or more and more than 20 small and medium-sized cities (Figure 1). In 2022, the urban agglomeration had a total area of 185,000 square kilometres, a population of 97 million residents, and a gross regional product of 770 million yuan, ranking fourth in China. In addition, the urban agglomeration has formed a radial HSR network structure with Chengdu and Chongqing as the core, operating 91 HSR stations.
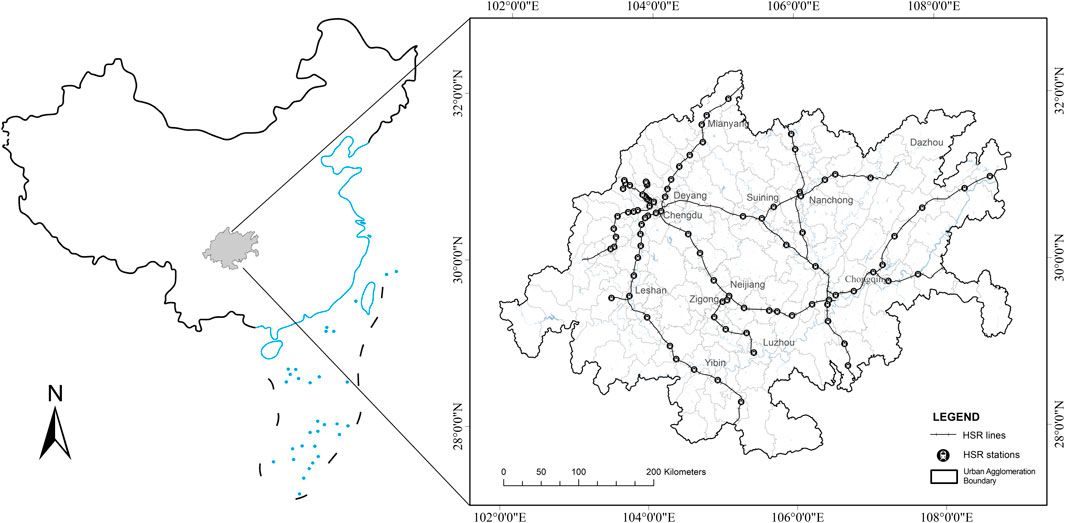
Figure 1. Location of the study area.
Notably, HSR station areas in the urban agglomeration are generally large and diverse in type, and spatial and temporal distributions of population activity are evident. These HSR stations consist of stations converted from old rail stations and newly built stations. There are HSR stations in the city centre and stations on the edge and periphery of cities. The cities in which they are located also have different economic and social conditions. Therefore, the case study of HSR station areas in the urban agglomeration represents the study of the vitality of HSR station areas. The study’s results can also provide a reference for the vitality-oriented regeneration of HSR station areas in other regions.
To quantify the vitality of the HSR station areas and explore the factors influencing the areas’ vitality, we defined the HSR station area as the area formed by the 1500-m road network surrounding the station from its entrance and exit. The reasons for this definition are as follows: (1) The area delineated by the extent of the road network is more precise than the circular extent delineated by previous studies (Yang et al., 2022). The area of the road network excludes areas such as water and mountains, which is a better depiction of what pedestrians can access. (2) Previous studies indicated that the 1500-m road network area was acceptable for most pedestrians travelling from an HSR station to nearby destinations. Based on a survey of 2,991 passengers at HSR stations, 84.05% of respondents were willing to walk less than 20 min to reach the vicinity of the HSR station (Lin, 2011). Assuming a walking speed of 4.5 km/h, the distance of the road network in 20 min would be 1,500 m (3) The 1500-m range is consistent with the range defined in other studies of HSR station areas (Wei and Wang, 2022; Wenner and Thierstein, 2022).
The data provide a new method for measuring population vitality in HSR station areas. The data are a type of LBS data obtained from the Baidu Huiyan interface (https://huiyan.baidu.com/). The data were generated by users who used Baidu Corporation products through active access or passively when parked or moving slowly. The Baidu Corporation is the largest internet search engine company in China. It has developed many Baidu products and services, with monthly active users of the Baidu app reaching 663 million in September 2023 (Baidu, 2023). The RBUD data are suitable for studying vitality at a number of HSR station areas across multiple cities because of their high quality, broad coverage, and extensive capacity. In addition, the data have gradually been used to study urban vitality and have been shown to reflect population activity patterns spatially and temporally (Zhao et al., 2022; Jiao and Bao, 2023). This study used RBUD data every hour between 6 a.m. and 11 p.m. from 10–16 April 2023 (1 week). Of the 7 days, April 15 and 16 are weekend days, and the rest are weekdays.
The data were obtained from the Gaode Open Platform (https://lbs.amap.com/) in April 2023. POI points have their name, latitude, longitude, and attribute classification information. In China, Gaode Open Platform is the leading LBS provider. POIs on the platform cover a wide range of categories, including business services and public facilities. We excluded broad categories of POIs that do not reflect the functions or facilities associated with the land, such as roadside facilities, place names and addresses, and event activities. In addition, we verified the road and railway data using the latest Google satellite imagery to ensure accuracy.
The data were collected from the Ctrip website (https://trains.ctrip.com/) between 17 and 23 December 2022 (1 week). Ctrip.com, one of China’s most extensive online travel services, provides train timetable information that corresponds with China’s official train ticket sales website.
The population data for HSR station areas were obtained from Worldpop (https://www.worldpop.org/). These data are raster data with a resolution of 100 m by 100 m. The data on feeder traffic near HSR stations were collected from the Baidu Encyclopedia (https://baike.baidu.com/) and Baidu Map (https://map.baidu.com). Data on economic development and population for the cities served by the HSR stations were obtained from the Sichuan Statistical Yearbook and the Chongqing Statistical Yearbook for 2022.
Structural equation modelling can establish, estimate, and test complex causal relationships between observable and latent variables (Bowen and Guo, 2011). This study has a limited sample size, which makes it difficult to apply generalised least squares or great likelihood estimates to determine the extent to which the attributes of the HSR stations affect the vitality of their areas. Therefore, we used a structural equation model based on Bayesian estimation. In contrast to traditional algorithms, the Bayesian method of estimation relies on the Markov chain Monte Carlo method rather than the asymptotic theory for sample generation. For small sample data, Bayesian structural equation modelling would provide more reliable parameter estimation (Rupp et al., 2004; Kruschke et al., 2012).
We constructed a structural equation model using Amos 26.0 to test the relationships between the vitality of HSR station areas and several variables, using the CCUA as the case study (Figure 2). The model is composed of a measurement model as well as a structural model. In this model, weekday and weekend vitality were used as endogenous variables. Based on existing studies (Table 1), we chose intercity accessibility, intracity accessibility, surrounding area density, and local socio-economic development as exogenous variables.
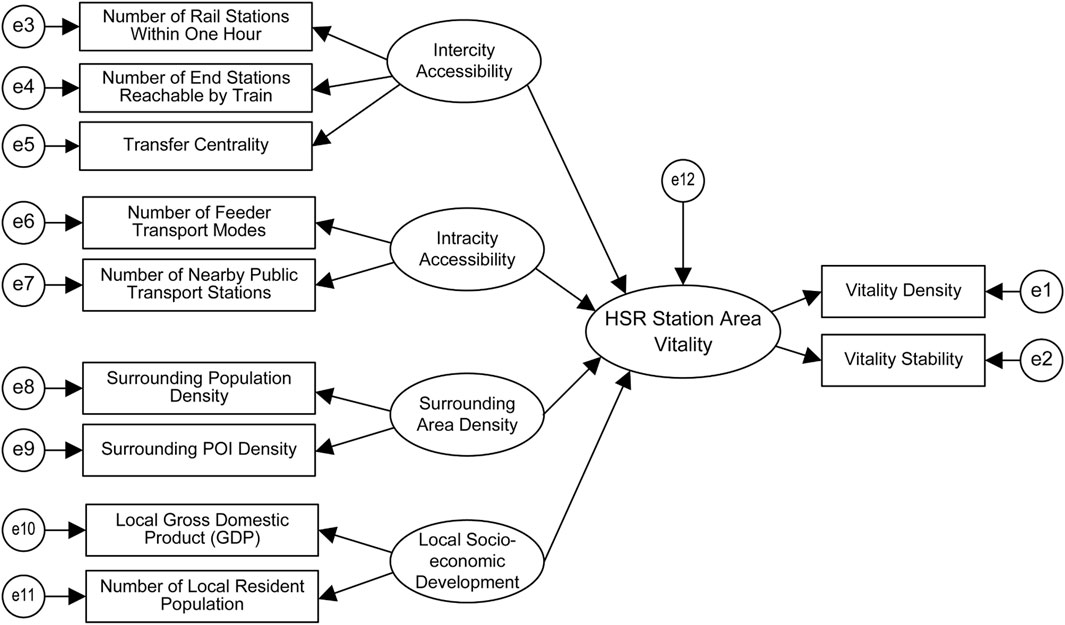
Figure 2. Conceptual structural equation model.
The study proposed four hypotheses based on existing research. In this study, intercity accessibility is defined as the ease of access to HSR stations via the rail network. According to an existing study on the night-time lighting of HSR station areas (Du Z. et al., 2021), the higher the intercity accessibility of an HSR station, the more dense and stable population activities may exist in the HSR station area. Therefore, the following hypothesis was proposed.
Hypothesis 1. The higher the intercity accessibility of an HSR station, the more vibrant the HSR station area.
Intracity accessibility refers to the ease of travelling between the HSR station and the destination within the host city. Several studies have demonstrated that the closer an HSR station is to the city centre and the better station-city transit connectivity it has, the better developed its surroundings will be (Deng et al., 2020; Wang L. et al., 2022). Therefore, the following hypothesis was proposed.
Hypothesis 2. The higher the intracity accessibility of an HSR station, the more vibrant the HSR station area.
The density of the surrounding area is indicative of the possibility of population activity in the area adjacent to the HSR station. Previous studies have found a significant positive correlation (Shi et al., 2023) and a positive causal relationship (Li and Zhao, 2023) between population density and urban vitality. The density of POIs has also been shown to affect urban vitality positively (Li et al., 2022; Li and Zhao, 2023). Furthermore, nearby POIs have also been found to be positively correlated with metro station vitality (Wang L. et al., 2022). Consequently, the following hypothesis was proposed.
Hypothesis 3. The higher the density of the area surrounding an HSR station, the more vibrant the HSR station area.
Local socio-economic development refers to the social and economic development level in the area served by the HSR station. Previous studies found that the more economically developed and populated the city where the HSR station is situated, the more developed the station area (Deng et al., 2020; Wang L. et al., 2022). Thus, the following hypothesis was proposed.
Hypothesis 4. The higher the level of local socio-economic development, the more vibrant the HSR station area.
In this study, the endogenous variable is the vitality of HSR station areas. Vitality refers to the continuity and intensity of population and activity presence over time. It can be measured by the density of population and activities per unit area, as well as the stability of their changes (Liu et al., 2021; Xia et al., 2022). As a result, we constructed two observable variables, vitality density and vitality stability, to measure the vitality of HSR station areas. The vitality density was used to estimate the static intensity of vitality per unit area. The vitality stability was used to assess vitality dynamics over time.
Moreover, vitality density was negatively associated with vitality stability in this study. A considerable portion of vitality studies constructs vitality variables separately for weekdays and weekends because vitality is generally different on weekdays and weekends. Therefore, we separately evaluated vitality density and vitality stability on weekdays and weekends (Table 2).
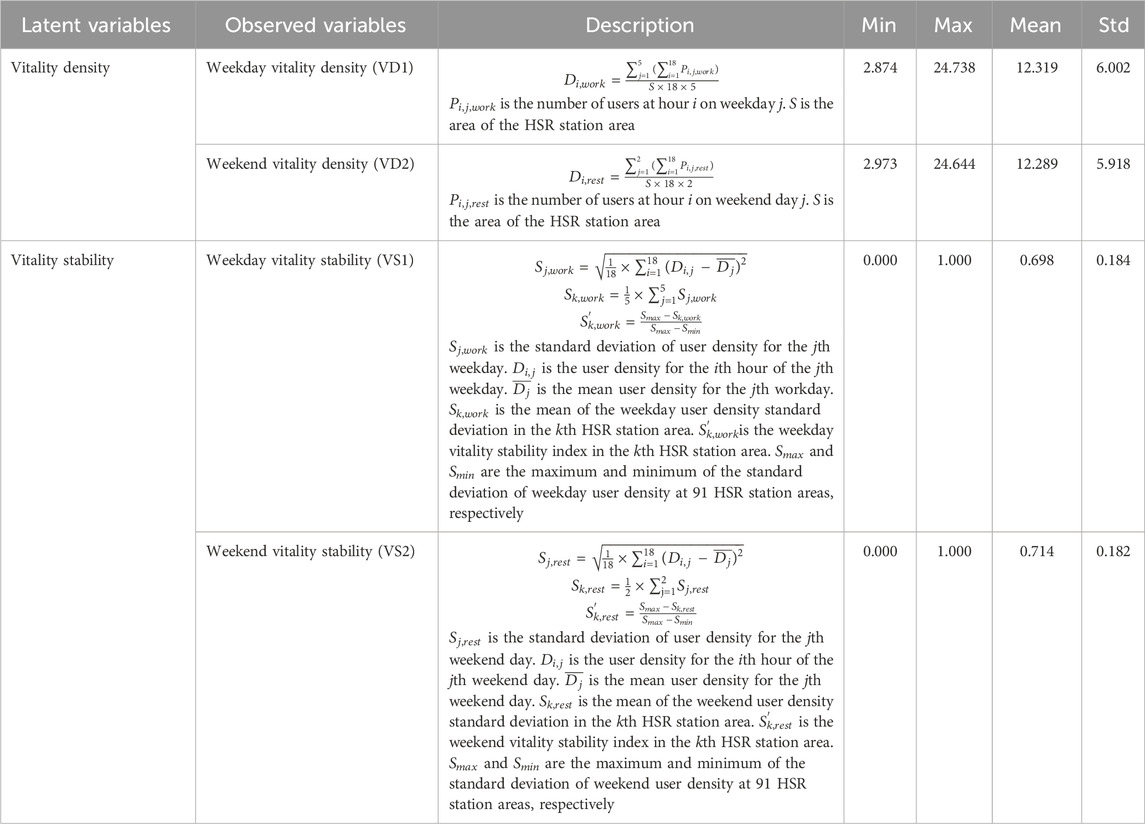
Table 2. Endogenous variables measure the vitality of HSR station areas.
The vitality density is the population density of the HSR station area at a given time. The variable was measured by the ratio of the average number of users per hour between 6 a.m. and 11 p.m. to the area of the HSR station area. A higher value of this variable indicates a higher vitality level in the HSR station area. Table 2 presents the calculation of vitality density.
Vitality stability refers to the dynamic change in population density over time. The standard deviation of user density from 6 a.m. to 11 p.m. was used to calculate this variable. The variable was normalised for the following research. The higher the value of this variable, the more stable the HSR station area’s vitality. The calculation of vitality stability is shown in Table 2.
In this study, intercity accessibility, intracity accessibility, surrounding area density, and local socio-economic development of the HSR station are exogenous variables.
An HSR station’s intercity accessibility refers to its ability to access other rail stations on the rail network. Therefore, we measured intercity accessibility using indicators of the number of stations within 1 hour, the number of end stations reachable by train, and transfer centrality. Table 3 shows descriptions of the indicators and their calculation methods.
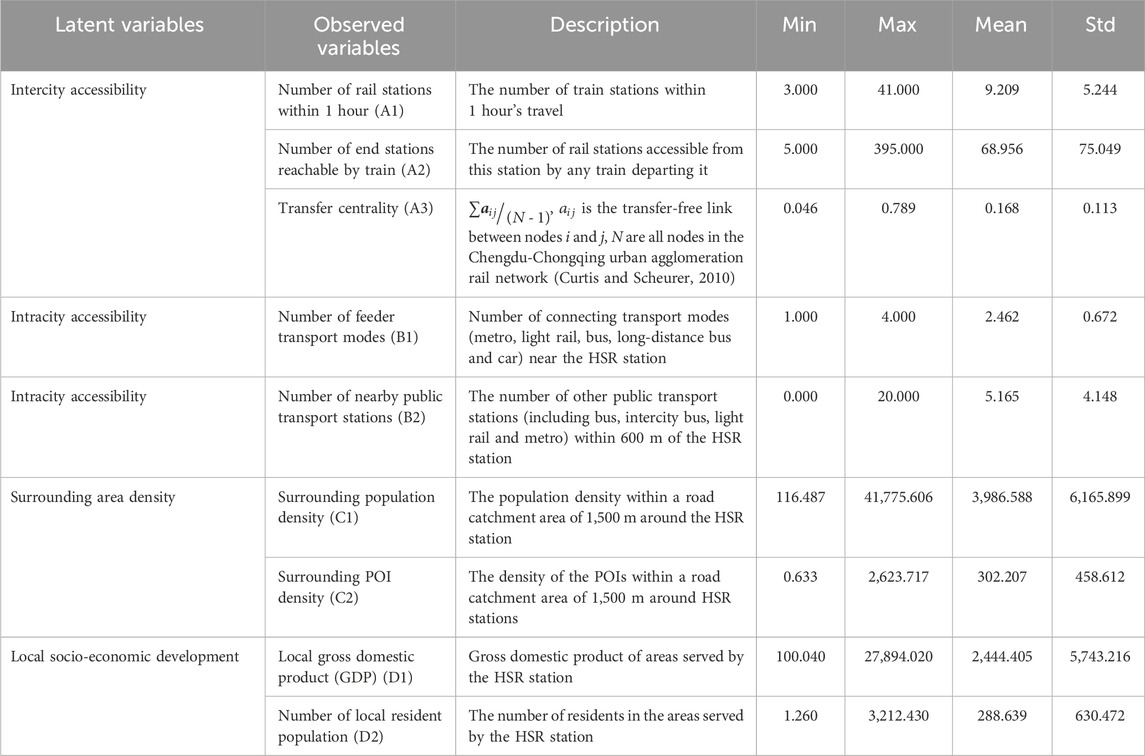
Table 3. Exogenous variables measure the attributes of HSR stations.
Intracity accessibility refers to how easily one can travel between the HSR station and various destinations within the host city. The study by Deng et al. (2020) found that the closer an HSR station is located in the city centre, the better developed the area surrounding the station will be. This study did not use the variable distance between the HSR station and the city centre since it has a factor loading of less than 0.5. We used the number of feeder transport modes and the number of nearby public transport stations to measure intracity accessibility. Table 3 describes the indicators and the calculation method.
The density of the surrounding area refers to the density of the built environment and population in an HSR station area. We utilised two variables to assess the area’s density around HSR stations—the surrounding POI density and the surrounding population density. Table 3 describes the indicators and their calculation.
Local socio-economic development refers to the degree of economic and social development in the areas served by the HSR station. We measured local economic and social development using the local gross domestic product (GDP) and the number of residents. A description of the indicators and their calculation method is shown in Table 3.
Since the distributions of the variables above deviate from normality, we referred to existing studies (Li et al., 2020) and used the natural logarithm of these variables for the subsequent analyses. Figure 3 shows the spatial distribution of the above-observed variables.
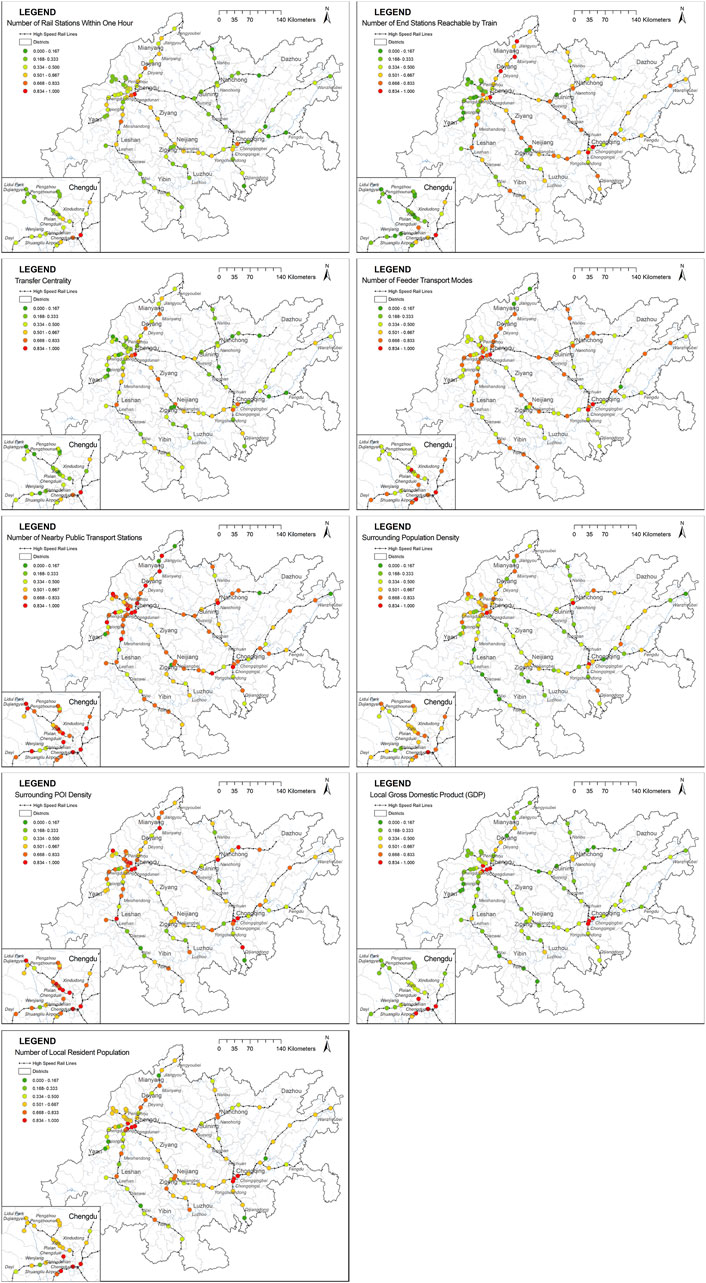
Figure 3. Spatial distribution of observed variables.
To compare vitality density differences between weekdays and weekends, we used the same interval classification method to categorise vitality density values in the HSR station areas into six levels. The vitality density is represented by levels 1–6 (Figure 4). Red indicates high vitality density values in the HSR station areas, whereas green indicates low vitality density values.
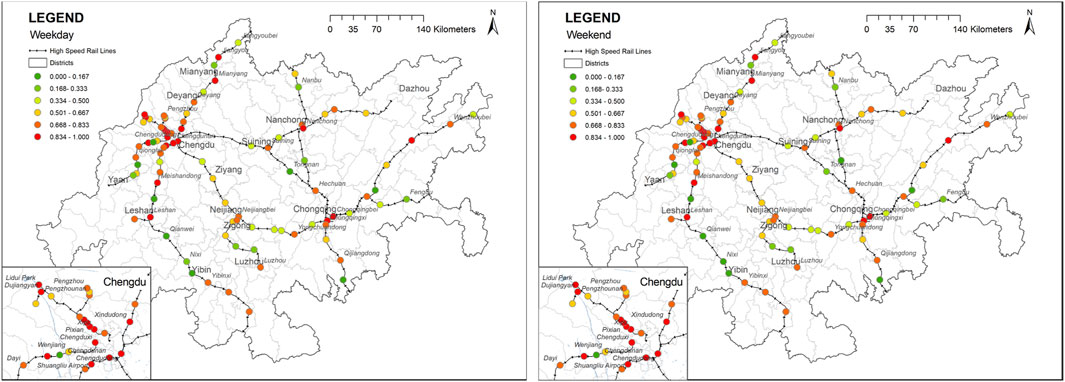
Figure 4. Weekday vitality density (left) and weekend vitality density (right) in the HSR station areas.
The spatial pattern of vitality density in the HSR station areas of the CCUA is similar during weekdays and weekends. HSR station areas with high vitality density values are primarily found in Chengdu and Chongqing, two megacities. Most HSR station areas with low vitality density values are in small cities, such as Qingshen County and Qianwei County. Regarding the time dimension, most HSR stations have the same level of vitality density on weekdays and weekends. A few HSR station areas differ in vitality density by one level. Among them, Jianyangnan Station and Tongnan Station have higher vitality densities on weekends. Wusheng Station and Nixi Station have higher vitality densities on weekdays. In general, vitality density in the HSR station areas varies little between the weekdays and weekends.
In addition, we classified vitality stability into six levels using the same interval classification method. There are six levels of vitality stability, ranging from low to high (Figure 5). Most HSR station areas have higher vitality stability levels on weekdays and weekends. Most HSR station areas with high vitality stability are in Chengdu and Chongqing, two megacities. Most areas with low vitality stability can be found at small HSR stations, such as Qing Shen Station, Buxingjie Station, and Ande Station.
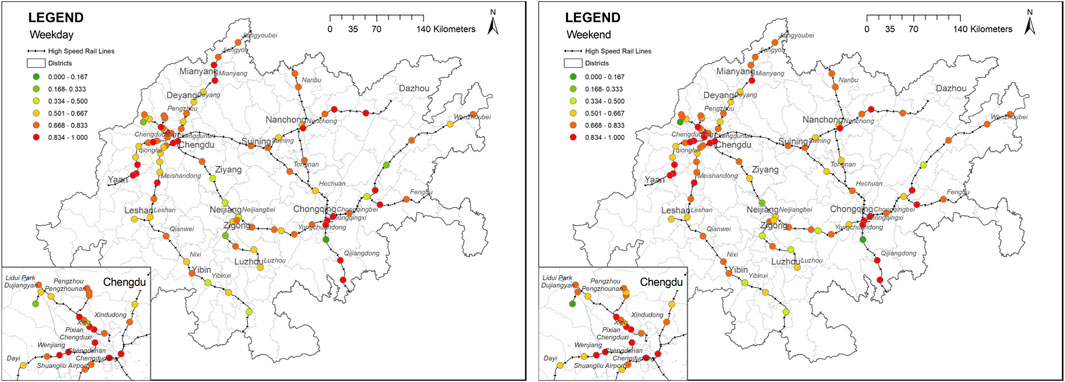
Figure 5. Weekday vitality stability (left) and weekend vitality stability (right) in the HSR station areas.
The vitality stability of most HSR station areas is at the same level on weekdays and weekends, with very little difference between them. In some HSR station areas, vitality stability differs by one level between weekdays and weekends. Among them, the weekend stability is more robust in HSR station areas such as Wanzhoubei Station, Dianjiang Station, and Changshoubei Station. The weekday stability is more excellent in HSR station areas such as Tongnan Station, Wusheng Station, and Tuxi Station.
To ensure the validity of the model fit assessment and hypothesis testing, we checked the reliability and validity of the models and variables. Cronbach’s coefficient alpha (CCA) tests the internal consistency of observed variables of the same dimension in the study. CCA values greater than 0.6 are generally considered to be acceptable. Table 4 illustrates that all latent variables have a CCA greater than 0.7, and the CCA value for all the observed variables is 0.831, which indicates good internal consistency.
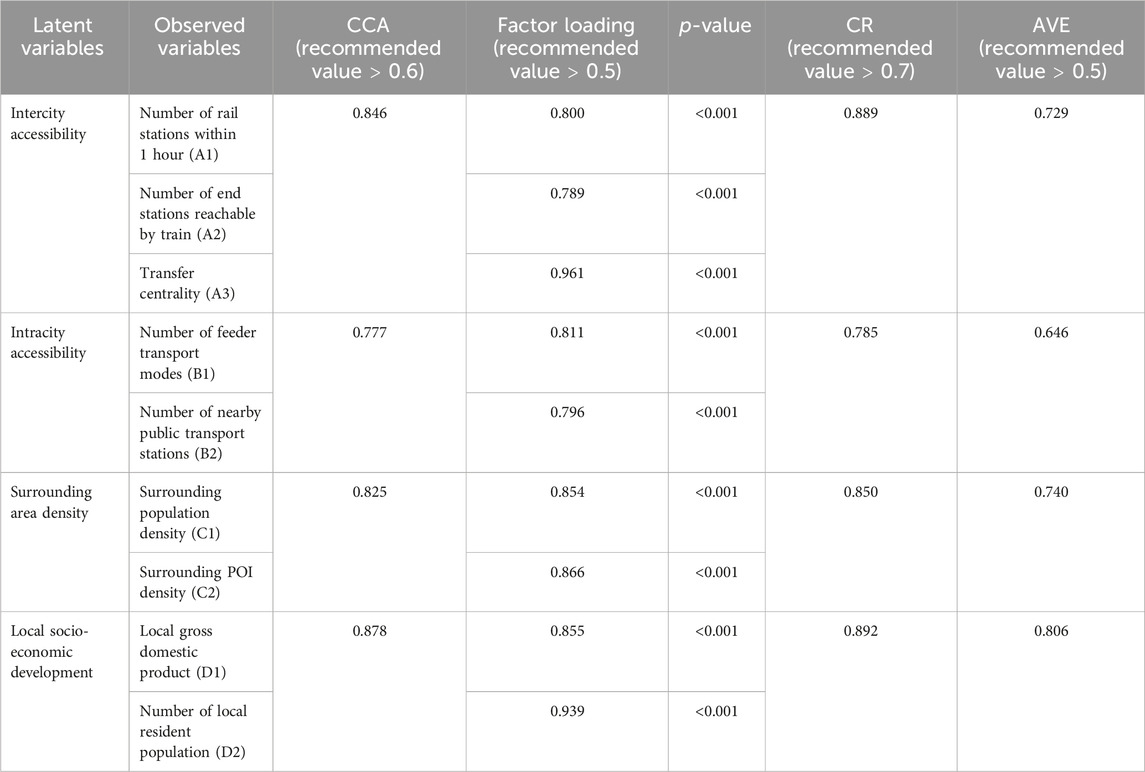
Table 4. Reliability and validity tests for all variables (N = 91).
Composite reliability (CR) measures the consistency between a group of observations to assess the reliability of a latent variable. The greater the CR value, the greater the correlation between observed variables within a group. There is generally good composite reliability when the latent variable has a CR value of 0.7 or higher. In Table 4, CR values for all latent variables greater than 0.7 indicate that internal consistency is good.
Average variance extracted (AVE) measures how well latent variables can be distinguished from each other. In order to determine this, the square root of each latent variable’s AVE was compared with its correlation coefficient with other latent variables. Moreover, the AVE value should be greater than 0.5. In Table 4, all AVE values are greater than 0.5. According to Table 5, the square root of each latent variable’s AVE is greater than its correlation coefficient with the other latent variables, indicating good discriminant validity.
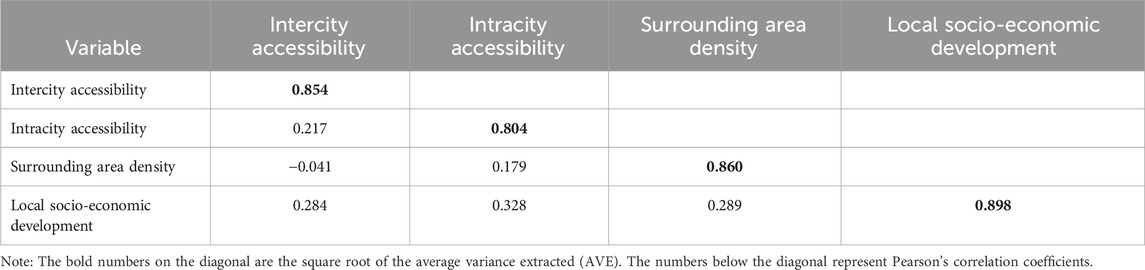
Table 5. Results of the discriminant validity test.
Factor loadings indicate the contribution of each observed variable in explaining the latent variable. Generally, a factor loading of greater than 0.5 is considered an acceptable value. A factor loading of greater than 0.7 indicates that the observed variable can effectively represent its corresponding latent variable. Table 4 shows that the factor loadings for all the observed variables are greater than 0.7 and significant (p < 0.001), indicating a strong association between the observed variables and their corresponding latent variables.
In this study, vitality density and vitality stability have an opposite spatial relationship. A significant strong correlation was observed between weekday vitality density and weekend vitality density (r > 0.9), as well as between weekday vitality stability and weekend vitality stability (r > 0.9). To ensure the accuracy of the model analysis, four independent models were constructed for weekday vitality density (Model 1), weekend vitality density (Model 2), weekday vitality stability (Model 3), and weekend vitality stability (Model 4), consistent with the study of Xia et al. (2022).
We analysed the model’s goodness of fit. The goodness of fit of a model is assessed using seven main indices (Ao et al., 2024). Table 6 shows the goodness of fit indices for the Models 1 to 4. Models 1 to 4 indices are within the SEM recommended thresholds, indicating a satisfactory fit between the models and the data.
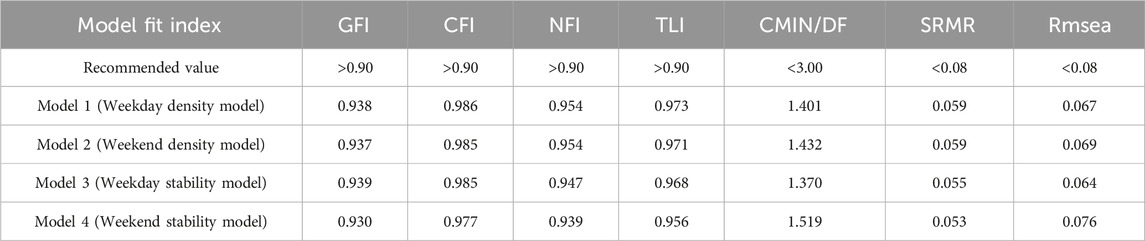
Table 6. Model fit indices.
Bayesian estimation can provide more robust model results when applied to structural equation modelling of small samples than great likelihood estimation or generalised least squares estimation (Rupp et al., 2004; Kruschke et al., 2012). For this reason, we employed Bayesian estimation of structural equation models. The results of Model 1 were calculated based on 9,127 simulated analysis samples with a convergence statistic 1.0001. The results of Model 2 were calculated based on 9,500 simulated analysis samples, and a convergence statistic of 1.0001 was obtained. The results of Model 3 were calculated based on 9,001 simulated analysis samples, and a convergence statistic of 1.0002 was obtained. The results of Model 4 were calculated based on 9,423 simulated analysis samples, and a convergence statistic of 1.0001 was obtained.
A convergence statistic equal to 1.0000 is the most perfect convergence criterion. Generally, a convergence statistic less than or equal to 1.10 generates sufficient samples (Gelman and Rubin, 1992). It can be assumed that the results of Models 1 to 4 converged to a satisfactory level (different initial values resulted in slightly different results for each run of the Bayesian structural equation model, but overall, it was very stable). The results of the analyses for Models 1 to 4 are presented in Table 7 and Figure 6.
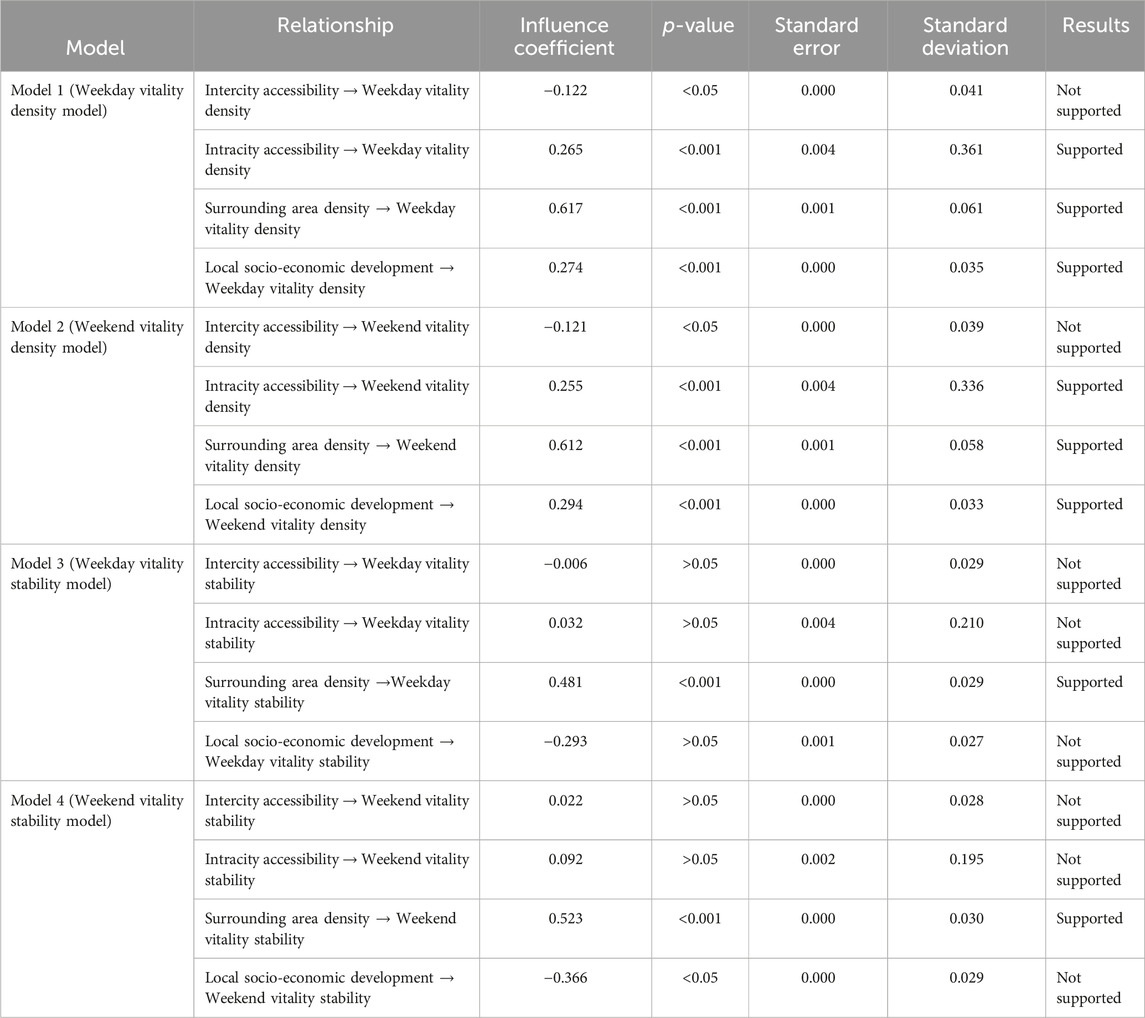
Table 7. The standardised path coefficients and results of the tested hypotheses.
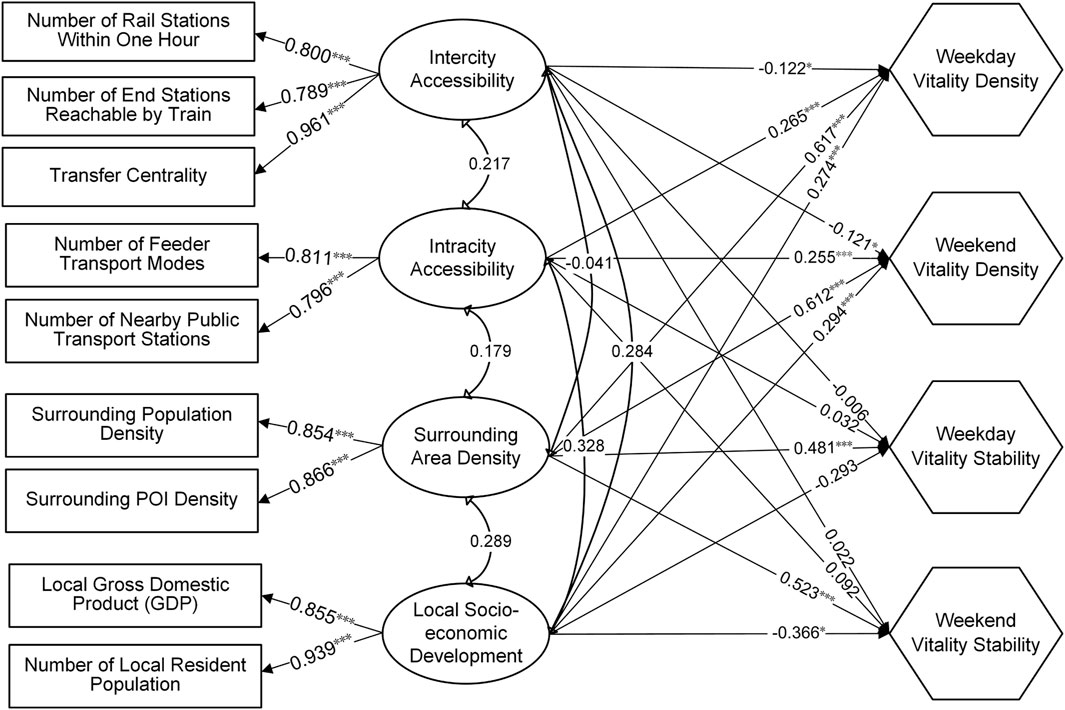
Figure 6. Graphical results of Bayesian structural equation models 1 to 4.
Based on the results of Models 1 to 4 (Table 7), the direct effect of intercity accessibility on weekday and weekend vitality density in the HSR station areas is −0.122 (p < 0.05) and −0.121 (p < 0.05), respectively. In other words, the greater the intercity accessibility of an HSR station, the lower the vitality density of the HSR station area. Moreover, there was no correlation between intercity accessibility and the vitality stability of HSR station areas (p > 0.05).
This phenomenon may be caused by following several factors. First, HSR stations with high intercity accessibility in the study areas function as large-scale transport hubs. In order to accommodate the emergency evacuation of large passenger flows, large plazas were constructed in front of these HSR stations. Due to the enormous size of these plazas and the lack of facilities designed to attract people, people rarely stay in them when not in an emergency. Second, to facilitate the rapid evacuation of vehicles, expressways were often built around HSR stations with high intercity accessibility. These expressways and large plazas isolate the HSR stations from the surrounding urban areas, making it difficult to attract people and activities from surrounding areas. Lastly, a high-capacity interchange facility, such as a metro, is available at HSR stations with high intercity accessibility. Passenger traffic can be dispersed quickly through these high-capacity interchange facilities, resulting in passengers spending less time at HSR stations. As a result, the greater the intercity accessibility, the lower the vitality density performance of HSR station areas. The existing study also supported this finding (Lu and Zhao, 2023). The existing study found that travellers frequently used other modes of transportation for quick transfers and stayed for a shorter period. In the HSR station areas, there was not a high level of vitality.
Based on the model results (Table 7), the direct effect of intracity accessibility on weekday and weekend vitality density of HSR station areas is 0.265 (p < 0.001) and 0.255 (p < 0.001), respectively. This means that the greater the accessibility to the HSR station within a city, the higher the vitality density in that area. Moreover, no correlation was found between intracity accessibility and the vitality stability of HSR station areas (p > 0.05).
Two variables related to intracity accessibility positively impact the vitality density of HSR station areas—the number of feeder transport modes and the number of nearby public transport stations. This may be because the more feeder transportation modes and nearby public transportation stations there are, the greater the number of available feeder transportation stations. Transportation station areas serve as places for interpersonal communication and interaction that are often attractive for population activities and vibrant (Xu and Chen, 2022). Furthermore, according to the traditional view of urban vitality, accessibility within a city facilitates the interaction between the urban population and the environment (Yang et al., 2021). Consequently, the greater the intracity accessibility, the higher the vitality density at the HSR station areas.
The results of the models (Table 7) show that the density of the surrounding area has the greatest influence on the weekday and weekend vitality density of the HSR station areas, with a direct effect of 0.617 (p < 0.001) and 0.612 (p < 0.001), respectively. The direct impact of surrounding area density on weekday and weekend vitality stability is 0.481 (p < 0.001) and 0.523 (p < 0.001), respectively. In other words, the higher the density of the surrounding area of the HSR stations, the higher the density and stability of vitality at the HSR station areas.
According to this study, two variables representing the density of the surrounding area positively affected the density and stability of vitality in the HSR station areas - the density of the surrounding population and the density of the surrounding POIs. Regarding the surrounding population density, this may be because areas with a high population density tend to have intensified activity. Additionally, HSR stations with a high surrounding population density tend to be less impacted by passenger traffic, which results in excellent vitality stability. As for the density of the surrounding POIs, this may be explained by the fact that denser businesses and amenities tend to attract more significant and stable populations (Liu et al., 2019). Population and POI density have been shown to positively affect urban vitality in other urban areas (Liu et al., 2021; Shi et al., 2023).
According to the results of the models (Table 7), local socio-economic development has a direct impact on HSR station areas’ weekday and weekend vitality density by 0.274 (p < 0.001) and 0.294 (p < 0.001), respectively. Put another way, the more economically and socially developed the local area is, the higher the vitality density in the HSR station area. Both Deng et al. (2020) and Wang L. et al. (2022) found similar results, concluding that local socio-economic development positively affects the development of HSR station areas. It may be because, on the one hand, the more economically and socially developed a city is, the more tax revenue the local government receives. More likely, substantial funding will be allocated to the construction and development of the HSR station area. On the other hand, a city with a higher level of economic and social development is generally more attractive in terms of population and resources. Its HSR station area is generally more vibrant and has greater development potential. Moreover, the finding is in line with a study on metro station area vitality, which found that more affluent urban areas have higher levels of metro station area vitality (Tu et al., 2022).
The results of the models (Table 7) indicate that local socio-economic development has a direct effect on weekend vitality stability of −0.366 (p < 0.05). There was no correlation between the local socio-economic development and the weekday vitality stability of the HSR station areas (p > 0.05). In other words, the higher the level of local socio-economic development, the less stable the vitality of HSR station areas on weekends. On the one hand, it may be explained by the fact that the higher the local socio-economic development level, the more passengers use the HSR during the weekend. In the meantime, a substantial portion of passengers travelling on the HSR show a relatively consistent schedule. Individuals traveling for purposes such as sightseeing or visiting relatives usually depart on Saturday mornings or middays and return on Sunday afternoons or evenings. A higher traffic flow may result during these times (Yue et al., 2023), resulting in a less stable vitality throughout the day. On the other hand, a higher level of local socio-economic development generally results in more visitor-attracting amenities in an HSR station area. Particularly on weekends, people may engage in a lot of commercial, social, and other activities in this area, causing its vitality to become more unstable.
The study found that intracity accessibility, surrounding area density, and local socio-economic development positively impact the vitality density of HSR station areas. In contrast, intercity accessibility is associated with a negative impact. The density of the surrounding area positively influences the stability of vitality in the HSR station areas. Local socio-economic development has a negative effect on the stability of weekend vitality. In light of these findings, we put forth the following planning strategies.
Firstly, it is recommended that priority be given to upgrading existing stations in or near the city centre to HSR stations rather than constructing new HSR stations on the city’s edges or periphery. This is because the areas surrounding these existing stations are often more developed, with a higher population and greater facility density. The higher population and facility density near HSR stations are conducive to commercial success, generating stable and dense vitality.
Secondly, developing new zones and large commercial projects around HSR stations should be carefully considered in cities with low economic and social development. It is evident that HSR station areas in these cities are experiencing difficulties attracting people and activities. In economically developing and more populous cities, especially those with upgraded HSR stations, the areas surrounding HSR stations should consider increasing building density and developing large-scale commercial and business projects to enhance their spatial vitality.
Furthermore, the station squares of the HSR stations in the study area are typically expansive yet fail to attract a considerable number of people or activities. In addition to its use for evacuation at special times, the station square should also be considered as a means of reflecting the city’s image during normal times and be developed into a vibrant public space. The installation of leisure and rest facilities, such as seating and pavilions, in the square could be considered, as well as implementing urban cultural and commercial activities on weekends. Moreover, constructing a large road encircling the station square should be avoided, as this would result in isolation from the surrounding urban areas. Enhancing the walkability between the station square and the surrounding areas would also be beneficial.
Lastly, HSR stations can accommodate a variety of transport interchanges, such as intercity bus stations and coach stations. Moreover, commercial and service facilities can be built in the areas, which have also been shown to attract more people and activities.
For the purpose of exploring the factors that affect HSR station areas’ vitality, the study uses the RBUD data to present the vitality density and stability, utilising 91 HSR stations within the CCUA for analysis. Through this method, spatial and temporal characteristics of HSR station area vitality can be represented. Furthermore, the method can identify HSR station areas exhibiting insufficient vitality. As the data are relatively accessible, the method can also be employed to quantify the vitality of HSR station areas in other regions.
Furthermore, the study fills a gap in the existing research. The study employs Bayesian structural equation modelling to comprehensively examine the causal relationships between unobservable variables: intercity accessibility, intracity accessibility, surrounding area density, local socio-economic development, and the vitality of HSR station areas. Consequently, the study can be classified as an explanatory study, with the objective of exploring the causal relationships between multiple factors that influence vitality. The study reveals that intracity accessibility, surrounding area density, and local socio-economic development positively influence the vitality density of HSR station areas. Conversely, intercity accessibility negatively impacts the vitality density of HSR station areas. Moreover, the surrounding area density exerts a positive effect on the stability of vitality in HSR station areas. Conversely, local socio-economic development has a negative effect on the stability of weekend vitality. The findings can be used as a basis for the location of HSR stations as well as for the planning and decision-making of HSR station areas with the objective of increasing vitality.
It should be noted that the study is not without limitations. The study selected the HSR station areas in the CCUA in China as a case study. It remains to be seen whether the conclusions of this study can be applied to HSR station areas in other city clusters or regions, given the different economic and social development conditions. Furthermore, Baidu’s real-time data on user density does not include infants, older people, and individuals not using Baidu’s mobile applications. This may result in a lack of vitality data for these groups.
Further studies should examine the spatial and temporal dynamics of different types of populations (e.g., travellers and residents) in HSR station areas, as well as the factors that influence their vitality. Moreover, future studies could employ nonlinear research methods to investigate potential causal relationships between micro-factors, such as the design and land use of HSR station areas, and their vitality.
The raw data supporting the conclusions of this article will be made available by the authors, without undue reservation.
XY: Conceptualization, Data curation, Formal Analysis, Methodology, Software, Visualization, Writing–original draft, Writing–review and editing. YY: Conceptualization, Funding acquisition, Project administration, Supervision, Validation, Writing–review and editing. PP: Methodology, Validation, Writing–review and editing. CL: Visualization, Writing–review and editing.
The author(s) declare that financial support was received for the research, authorship, and/or publication of this article. This study is supported by the National Natural Science Foundation of China (Grant Number 52178059) and the Soft Science Project of Sichuan Provincial Science and Technology (Grant Number 24RKX0585).
The authors declare that the research was conducted in the absence of any commercial or financial relationships that could be construed as a potential conflict of interest.
All claims expressed in this article are solely those of the authors and do not necessarily represent those of their affiliated organizations, or those of the publisher, the editors and the reviewers. Any product that may be evaluated in this article, or claim that may be made by its manufacturer, is not guaranteed or endorsed by the publisher.
Ao, Y., Peng, P., Li, M., Li, J., Wang, Y., and Martek, I. (2024). Empowering architecture, engineering and construction students through building information modeling competitions: a deep dive into behavioral motivation. Eng. Constr. Archit. Manage. ahead-of-print (ahead-of-print). doi:10.1108/ECAM-10-2023-1076
Baidu (2023). Baidu announces third quarter 2023 results. Available at: https://ir.baidu.com/static-files/f4006310-1a98-4d86-89a1-edfea1ef5d0e (Accessed January 28, 2024).
Bertolini, L. (1999). Spatial development patterns and public transport: the application of an analytical model in The Netherlands. Plan. Pract. Res. 14 (2), 199–210. doi:10.1080/02697459915724
Bowen, N. K., and Guo, S. (2011). Structural equation modeling. New York, NY, USA: Oxford University Press.
Curtis, C., and Scheurer, J. (2010). Planning for sustainable accessibility: developing tools to aid discussion and decision-making. Prog. Plan. 74 (2), 53–106. doi:10.1016/j.progress.2010.05.001
Dai, G. (2015). The impact of policy networks on the urbanisation around high-speed railway stations in China: the case of wuhan. Environ. Plan. C-Gov. Policy 33 (3), 533–551. doi:10.1177/0263774x15594016
Deng, T., Gan, C., Perl, A., and Wang, D. (2020). What caused differential impacts on high-speed railway station area development? Evidence from global nighttime light data. Cities 97, 102568. doi:10.1016/j.cities.2019.102568
Dong, L., Du, R., Kahn, M., Ratti, C., and Zheng, S. (2021a). “Ghost cities” versus boom towns: do China's high-speed rail new towns thrive? Reg. Sci. Urban Econ. 89, 103682. doi:10.1016/j.regsciurbeco.2021.103682
Dong, Y.-H., Peng, F.-L., and Guo, T.-F. (2021b). Quantitative assessment method on urban vitality of metro-led underground space based on multi-source data: a case study of shanghai inner ring area. Tunn. Undergr. Space Technol. 116, 104108. doi:10.1016/j.tust.2021.104108
Du, J., van Wesemael, P., and Druta, O. (2021a). Place quality in high-speed rail station areas: concept definition. J. Transp. Land Use 14 (1), 1165–1186. doi:10.5198/jtlu.2021.1820
Du, Z., Wu, W., Liu, Y., Zhi, W., and Lu, W. (2021b). Evaluation of China's high-speed rail station development and nearby human activity based on nighttime light images. Int. J. Environ. Res. Public Health 18 (2), 557. doi:10.3390/ijerph18020557
Facchinetti-Mannone, V. (2009). “Location of high speed rail stations in French medium-size city and their mobility and territorial implications,” in City futures 09. (Madrid, Spain: city futures 09) (Spain: Madrid).
Garmendia, M., Ribalaygua, C., and Ureña, J. M. (2012). High speed rail: implication for cities. Cities 29, S26–S31. doi:10.1016/j.cities.2012.06.005
Gelman, A., and Rubin, D. B. (1992). Inference from iterative simulation using multiple sequences. Stat. Sci. 7 (4), 457–472. doi:10.1214/ss/1177011136
Guo, X., Chen, H., and Yang, X. (2021). An evaluation of street dynamic vitality and its influential factors based on multi-source big data. ISPRS Int. J. Geo-Inf. 10 (3), 143. doi:10.3390/ijgi10030143
Hoyle, R. H. (1995). Structural equation modeling: concepts, issues, and applications. Thousand Oaks, CA, USA: Sage.
Huang, Y., and Zong, H. (2020). The spatial distribution and determinants of China’s high-speed train services. Transp. Res. Pt. A-Policy Pract. 142, 56–70. doi:10.1016/j.tra.2020.10.009
Jiang, Y., Han, Y., Liu, M., and Ye, Y. (2022). Street vitality and built environment features: a data-informed approach from fourteen Chinese cities. Sustain. Cities Soc. 79, 103724. doi:10.1016/j.scs.2022.103724
Jiao, H., and Bao, L. (2023). Optimization path of carbon offsetting in negative urban spaces under dual carbon goals. J. Comput. Methods Sci. Eng. 23 (6), 3055–3069. doi:10.3233/jcm-226997
Kang, C.-D. (2020). Effects of the human and built environment on neighborhood vitality: evidence from seoul, korea, using mobile phone data. J. Urban Plann. Dev. 146 (4), 05020024. doi:10.1061/(ASCE)UP.1943-5444.0000620
Kim, H., Sultana, S., and Weber, J. (2018). A geographic assessment of the economic development impact of Korean high-speed rail stations. Transp. Policy 66, 127–137. doi:10.1016/j.tranpol.2018.02.008
Kruschke, J. K., Aguinis, H., and Joo, H. (2012). The time has come:Bayesian methods for data analysis in the organizational sciences. Organ Res. Methods 15 (4), 722–752. doi:10.1177/1094428112457829
Li, J., Auchincloss, A. H., Yang, Y., Rodriguez, D. A., and Sanchez, B. N. (2020). Neighborhood characteristics and transport walking: exploring multiple pathways of influence using a structural equation modeling approach. J. Transp. Geogr. 85, 102703. doi:10.1016/j.jtrangeo.2020.102703
Li, Q., Cui, C., Liu, F., Wu, Q., Run, Y., and Han, Z. (2022). Multidimensional urban vitality on streets: spatial patterns and influence factor identification using multisource urban data. ISPRS Int. J. Geo-Inf. 11 (1), 2. doi:10.3390/ijgi11010002
Li, Z., and Zhao, G. (2023). Revealing the spatio-temporal heterogeneity of the association between the built environment and urban vitality in shenzhen. ISPRS Int. J. Geo-Inf. 12 (10), 433. doi:10.3390/ijgi12100433
Lin, C. (2011). Research of impact factors of high-speed railways hub area development in China. Urban Plann.Int. 26 (06), 72–77.
Liu, S., Ge, J., Ye, X., Wu, C., and Bai, M. (2023). Urban vitality assessment at the neighborhood scale with geo-data: a review toward implementation. J. Geog. Sci. 33 (7), 1482–1504. doi:10.1007/s11442-023-2139-1
Liu, S., Lai, S.-Q., Liu, C., and Jiang, L. (2021). What influenced the vitality of the waterfront open space? A case study of huangpu river in shanghai, China. Cities 114, 103197. doi:10.1016/j.cities.2021.103197
Liu, S., Zhang, L., and Long, Y. (2019). Urban vitality area identification and pattern analysis from the perspective of time and space fusion. Sustainability 11 (15), 4032. doi:10.3390/su11154032
Lu, Y., and Zhao, Z. (2023). On the spatial development characteristics and optimization strategies of high-speed rail station area in northeast China. Low. Temp. Archit. Technol. 45 (02), 1–6. doi:10.13905/j.cnki.dwjz.2023.2.001
Moyano, A., Coronado, J. M., Ruiz, R., and Romero, V. (2019a). Station avenue: high-speed rail’s missing link. Assessing pedestrian city-station routes for edge stations in Spanish small cities. J. Hous. Built Environ. 34, 175–193. doi:10.1007/s10901-018-9621-6
Moyano, A., Moya-Gómez, B., and Gutiérrez, J. (2018). Access and egress times to high-speed rail stations: a spatiotemporal accessibility analysis. J. Transp. Geogr. 73, 84–93. doi:10.1016/j.jtrangeo.2018.10.010
Moyano, A., Rivas, A., and Coronado, J. M. (2019b). Business and tourism high-speed rail same-day trips: factors influencing the efficiency of high-speed rail links for Spanish cities. Eur. Plan. Stud. 27 (3), 533–554. doi:10.1080/09654313.2018.1562657
Pol, P. M. (2003). “The economic impact of the high-speed train on urban regions,” in 43rd congress of the European regional science association: "peripheries, centres, and spatial development in the new europe (Belgium: Louvain-la-Neuve).
Prithviraj, D., and Sundaram, L. (2023). Exploring the walkability of senior citizens in a densely populated neighborhood of Chennai, India—a structural equation modeling approach. Sustainability 15 (18), 13868. doi:10.3390/su151813868
Rupp, A. A., Dey, D. K., and Zumbo, B. D. (2004). To bayes or not to bayes, from whether to when: applications of bayesian methodology to modeling. Struct. Equ. Model. A Multidiscip. J. 11 (3), 424–451. doi:10.1207/s15328007sem1103_7
Shi, Y., Zheng, J., and Pei, X. (2023). Measurement method and influencing mechanism of urban subdistrict vitality in shanghai based on multisource data. Remote Sens. 15 (4), 932. doi:10.3390/rs15040932
Sun, H. (2016). Study on the correlation between the hierarchical urban system and high-speed railway network planning in China. Front. Archit. Res. 5 (3), 301–318. doi:10.1016/j.foar.2016.04.003
Tu, W., Zhu, T., Zhong, C., Zhang, X., Xu, Y., and Li, Q. (2022). Exploring metro vibrancy and its relationship with built environment: a cross-city comparison using multi-source urban data. Geo-spatial Inf. Sci. 25 (2), 182–196. doi:10.1080/10095020.2021.1996212
van de Coevering, P., Maat, K., and van Wee, B. (2021). Causes and effects between attitudes, the built environment and car kilometres: a longitudinal analysis. J. Transp. Geogr. 91, 102982. doi:10.1016/j.jtrangeo.2021.102982
Vickerman, R. (2015). High-speed rail and regional development: the case of intermediate stations. J. Transp. Geogr. 42, 157–165. doi:10.1016/j.jtrangeo.2014.06.008
Vickerman, R. (2018). Can high-speed rail have a transformative effect on the economy? Transp. Policy 62, 31–37. doi:10.1016/j.tranpol.2017.03.008
Wang, D., Dewancker, B., Duan, Y., and Zhao, M. (2022a). Exploring spatial features of population activities and functional facilities in rail transit station realm based on real-time positioning data: a case of xi’an metro line 2. ISPRS Int. J. Geo-Inf 11, 485. doi:10.3390/ijgi11090485
Wang, D., Wei, Y. D., and Deng, T. (2021). Transportation development, spatiotemporal convergence, and urban land use: study of the opening of high-speed rails in the yangtze river delta, China. J. Urban Plann. Dev. 147 (3), 05021023. doi:10.1061/(asce)up.1943-5444.0000732
Wang, D., Xu, Y., and Zhao, M. (2022b). Spatial differentiation and influence mechanism of the connection-distribution performance of urban high-speed railway hub in the yangtze river economic belt. J. Geog. Sci. 32 (12), 2475–2502. doi:10.1007/s11442-022-2057-7
Wang, J. J., Xu, J., and He, J. (2013). Spatial impacts of high-speed railways in China: a total-travel-time approach. Environ. Plan. A 45 (9), 2261–2280. doi:10.1068/a45289
Wang, L., and Duan, X. (2018). High-speed rail network development and winner and loser cities in megaregions: the case study of yangtze river delta, China. Cities 83, 71–82. doi:10.1016/j.cities.2018.06.010
Wang, L., Zheng, W., He, S., and Wei, S. (2022c). Assessing urban vitality and its determinants in high-speed rail station areas in the yangtze river delta, China. J. Transp. Land Use 15 (1), 333–354. doi:10.5198/jtlu.2022.2010
Wei, S., and Wang, L. (2022). Classifying high-speed rail stations in the yangtze river delta, China: the node-place modelling approach. Appl. Spat. Anal. Policy 16 (2), 625–646. doi:10.1007/s12061-022-09492-w
Wenner, F., and Thierstein, A. (2022). High speed rail as urban generator? An analysis of land use change around european stations. Eur. Plan. Stud. 30 (2), 227–250. doi:10.1080/09654313.2021.1946485
Xia, X., Zhang, Y., Zhang, Y., and Rao, T. (2022). The spatial pattern and influence mechanism of urban vitality: a case study of changsha, China. Front. Environ. Sci. 10, 942577. doi:10.3389/fenvs.2022.942577
Xiao, L., Lo, S., Liu, J., Zhou, J., and Li, Q. (2021). Nonlinear and synergistic effects of tod on urban vibrancy: applying local explanations for gradient boosting decision tree. Sustain. Cities Soc. 72, 103063. doi:10.1016/j.scs.2021.103063
Xu, Y., and Chen, X. (2021). Quantitative analysis of spatial vitality and spatial characteristics of urban underground space (uus) in metro area. Tunn. Undergr. Space Technol. 111, 103875. doi:10.1016/j.tust.2021.103875
Xu, Y., and Chen, X. (2022). The spatial vitality and spatial environments of urban underground space (uus) in metro area based on the spatiotemporal analysis. Tunn. Undergr. Space Technol. 123, 104401. doi:10.1016/j.tust.2022.104401
Yang, H., Dijst, M., Feng, J., and Ettema, D. (2019). Mode choice in access and egress stages of high-speed railway travelers in China. J. Transp. Land Use 12 (1), 701–721. doi:10.5198/jtlu.2019.1420
Yang, X., Yang, Y., and Zhou, R. (2022). Research progress of the node-place model abroad and its enlightenments: applications, extensions and systematic development. Urban Plann.Int., 1–17. doi:10.19830/j.upi.2022.013
Yang, Y., Ma, Y., and Jiao, H. (2021). Exploring the correlation between block vitality and block environment based on multisource big data: taking wuhan city as an example. Land 10 (9), 984. doi:10.3390/land10090984
Yin, M., Bertolini, L., and Duan, J. (2015). The effects of the high-speed railway on urban development: international experience and potential implications for China. Prog. Plan. 98, 1–52. doi:10.1016/j.progress.2013.11.001
Yu, B., Cui, X., Liu, R., Luo, P., Tian, F., and Yang, T. (2022). Intergenerational differences in the urban vibrancy of tod: impacts of the built environment on the activities of different age groups. Front. Public Health 10, 994835. doi:10.3389/fpubh.2022.994835
Yue, Y., Chen, J., Feng, T., Wang, W., Wang, C., and Ma, X. (2023). New classification scheme and evolution characteristics analysis of high-speed railway stations using large-scale mobile phone data: a case study in jiangsu, China. J. Transp. Eng. Pt A-Syst. 149 (11), 04023108. doi:10.1061/jtepbs.Teeng-7855
Zhao, C., Bai, Y., and Guo, D. (2023). How does the opening of China's high-speed rail affect the spatial mismatch of haze pollution and economic growth? Environ. Sci. Pollut. Res. Int. 30 (38), 88387–88405. doi:10.1007/s11356-023-28525-6
Zhao, L., Tang, X., Xing, X., and Cai, C. (2022). Big data analysis of park and green space serviceability for elderly population--case study of core area of beijing. Sens. Mater. 34, 4369–4380. doi:10.18494/SAM4127
Zhao, S., and Ma, D. (2017). Ghost city phenomenon along China's high-speed railway grid. Int. J. Sustain. Soc. 9 (3), 210–225. doi:10.1504/ijssoc.2017.088307
Keywords: vibrancy, station area, high-speed rail, environmental impact, big data, urban planning
Citation: Yang X, Yu Y, Peng P and Liu C (2024) What affected the vitality of high-speed rail station areas? A case study of Chengdu-Chongqing urban agglomeration, China. Front. Environ. Sci. 12:1401310. doi: 10.3389/fenvs.2024.1401310
Received: 15 March 2024; Accepted: 21 June 2024;
Published: 11 July 2024.
Edited by:
Salvador García-Ayllón Veintimilla, Polytechnic University of Cartagena, SpainReviewed by:
You Peng, Eindhoven University of Technology, NetherlandsCopyright © 2024 Yang, Yu, Peng and Liu. This is an open-access article distributed under the terms of the Creative Commons Attribution License (CC BY). The use, distribution or reproduction in other forums is permitted, provided the original author(s) and the copyright owner(s) are credited and that the original publication in this journal is cited, in accordance with accepted academic practice. No use, distribution or reproduction is permitted which does not comply with these terms.
*Correspondence: Yang Yu, eXV5YW5nQHN3anR1LmVkdS5jbg==
Disclaimer: All claims expressed in this article are solely those of the authors and do not necessarily represent those of their affiliated organizations, or those of the publisher, the editors and the reviewers. Any product that may be evaluated in this article or claim that may be made by its manufacturer is not guaranteed or endorsed by the publisher.
Research integrity at Frontiers
Learn more about the work of our research integrity team to safeguard the quality of each article we publish.