 Xiuqin Yin*
 Ke Lin
- School of Civil and Transportation Engineering, Guangdong University of Technology, Guangzhou, China
To promote sustainable economic development in the Belt and Road region of China, reducing carbon emissions is essential. The construction industry is a major contributor to carbon emissions in China. Therefore, studying the dynamic evolution of carbon emissions from the construction industry in this region and its driving factors is of great significance for effectively controlling emissions and achieving China’s carbon peak and carbon neutrality targets. This paper first employs the Slope model, Moran’s I index, and standard deviation ellipse to reveal the spatial-temporal characteristics of carbon emissions from the construction industry, and then applies the geographical detector model to identify the main driving factors of carbon emissions. The results indicate that: (1) From 2006 to 2021, the total carbon emissions showed a fluctuating growth trend, and there were significant differences in emissions among different regions. (2) Carbon emissions in most provinces exhibited a moderate growth trend, and there was significant spatial correlation and aggregation of inter-provincial emissions. Regional carbon emissions from 2006 to 2021 showed a spatial distribution pattern from northeast to southwest, with a weakening trend, and the center of gravity mainly distributed in the east of the region. (3) Labor input, urbanization rate, total output value of the construction industry, degree of opening up, and energy intensity are the main factors influencing the spatial heterogeneity of carbon emissions from the construction industry, and the majority of the interaction types between factors were bivariate enhancement. This study aims to provide theoretical support for policymakers to formulate appropriate policies for building energy conservation and emission reduction.
1 Introduction
The Sixth Assessment Report of the United Nations Intergovernmental Panel on Climate Change (IPCC, 2021) states that there is a nearly linear relationship between cumulative anthropogenic CO2 emissions and global warming, with each 1000 Gt CO2 cumulative emissions leading to a global surface temperature increase of approximately 0.45°C (IPCC, 2021). The source of carbon dioxide is closely related to the use of energy (Ali et al., 2012), the excessive use of fossil energy in the pursuit of development in developing countries has resulted in the emission of large quantities of carbon dioxide, which further aggravates global warming (Ali et al., 2019). According to the latest Greenhouse Gas Bulletin, in 2022, CO2 accounted for about 64% of the warming effect, with its global average concentration approximately 50% higher than pre-industrial levels (WMO, 2023). Therefore, limiting CO2 emissions is crucial for mitigating global climate change. China has taken proactive measures to mitigate global climate change and reduce CO2 emissions. In 2020, China formally proposed the “dual carbon” goals of peaking CO2 emissions by 2030 and achieving carbon neutrality by 2060 at the 75th session of the United Nations General Assembly. In 2023, at the National Ecological and Environmental Protection Conference, it was emphasized to accelerate the promotion of green and low-carbon development patterns, forming green production and lifestyle. These measures demonstrate China’s determination to accelerate green and low-carbon development and strengthen energy conservation and emission reduction efforts.
The construction industry is a pillar industry of China’s national economy, characterized by high energy consumption and significant carbon emissions (Hu et al., 2022). According to the “2022 Global Construction Industry Status Report,” the energy demand for buildings reached 135 EJ in 2021, representing an increase of approximately 4% compared to the previous year (UNEP, 2022). The carbon emissions generated from building operations reached approximately 10 billion tons, reaching a historical peak (UNEP, 2022). According to the “China Building Energy Consumption and Carbon Emissions Research Report (2022),” the total energy consumption and carbon emissions of the entire construction process in 2020 accounted for 45.5% and 50.9% of the total national energy consumption and carbon emissions, respectively (CABEE, 2022). Therefore, promoting energy conservation and emissions reduction in the construction industry is crucial for achieving the “dual carbon” goals as scheduled.
In 2013, China proposed the Belt and Road Initiative, which has garnered widespread attention from the international community. The implementation of the “Belt and Road” strategy has not only promoted regional economic development in China but has also resulted in a significant amount of carbon emissions. The construction industry is the primary contributor to carbon emissions in China, making it essential to study carbon emissions from the construction industry in this region to effectively control emissions. Additionally, the uneven economic development along the “Belt and Road” route has led to spatial differences in carbon emissions. In this context, clarifying the spatial-temporal characteristics of carbon emissions from the construction industry in provinces along the Belt and Road and conducting in-depth analysis of their influencing factors is necessary. This not only provides a scientific basis for the government to formulate differentiated policies for reducing carbon emissions in the construction sector but also helps further advance China’s efforts in building energy conservation and emission reduction.
Currently, scholars have conducted relevant research on the spatial distribution and differences of carbon emissions, yielding certain research outcomes. Regarding the research areas, studies have primarily focused on Chinese provincial-level areas (Wang and Zheng, 2021), municipal-level areas (Liu et al., 2022), the Yellow River Basin (Wang et al., 2022), the Yangtze River Delta region (Wei et al., 2022) and the Beijing-Tianjin-Hebei region (Zhang et al., 2023). From a spatial geography perspective, research has validated that inter-provincial carbon emissions in China exhibit significant spatial dependence and clustering (Tong et al., 2018). In terms of research subjects, the focus has mainly been on industries such as industrial (Wang et al., 2023), agricultural (Ke et al., 2023), construction (Zhou et al., 2023), power (Liao et al., 2022), land use (Gao and Yuan, 2019), and energy consumption (Zhang and Li, 2022). For the construction industry specifically, Chen and Bi. (2022) analyzed the dynamic evolution of carbon emissions during the operational phase of Chinese buildings and found uneven spatial distribution of building carbon emissions, with significant differences between different regions. Ma et al. (2022) analyzed the spatial-temporal characteristics and regional differences in carbon emissions from commercial buildings in eight economic zones from 2006 to 2019. The study indicated significant differences in the contribution rates of carbon emission increments among different economic regions, with inter-regional differences far exceeding intra-regional differences.
In terms of the influencing factors of carbon emissions, most scholars have utilized methods such as Index Decomposition Analysis (IDA), Structural Decomposition Analysis (SDA), and spatial econometric models. The IDA method primarily involves constructing models such as the LMDI model (He et al., 2022; Wu et al., 2022), the Kaya Identity (Yang et al., 2020; Zeng and He, 2023), and the STIRPAT model (Pan and Zhang, 2020; Fan and Lu, 2022) to thoroughly analyze various influencing factors. The SDA method, based on the input-output model, has also been widely applied in the field of carbon emissions. Cao et al. (2019) explored the driving factors of regional carbon emission intensity in China based on an extended structural decomposition model, revealing significant differences in the driving effects of carbon emission intensity across different regions. Cai et al. (2020) utilized the SDA method to analyze the driving factors behind the changes in China’s carbon footprint from 2009 to 2016, finding that the emission intensity effect and primary input effect played a crucial role in reducing the carbon footprint. With the development of spatial econometrics, some scholars have begun to apply spatial econometric models to the study of factors influencing carbon emissions. Wang et al. (2018) used the Geographically Weighted Regression (GWR) model to analyze the effects of urbanization, industrial structure, and energy intensity on inter-provincial carbon emissions in China, while Li et al. (2022a) employed the Geographically and Temporally Weighted Regression (GTWR) model to analyze the spatial-temporal heterogeneity of the impacts of different factors on carbon emissions in the Chinese construction industry. Sun et al. (2023) utilized the Spatial Durbin Model (SDM) to analyze the effects of different factors on carbon emissions in the construction industry.
In summary, there is relatively limited research on the spatial distribution and differences of carbon emissions in China’s Belt and Road region. Most studies on the influencing factors of carbon emissions have mainly considered the temporal aspect, neglecting spatial differences in the research area. Moreover, many studies have been confined to examining the impact of single factors on the dependent variable, making it challenging to reveal the interactions between different variables. To address these research gaps, this study applies spatial analysis methods to analyze the spatial-temporal characteristics of carbon emissions in the construction industry. This research contributes to further enriching the study outcomes regarding the spatial-temporal heterogeneity of regional carbon emissions and introduces the geographic detector model. This model helps reveal the driving factors behind the spatial-temporal differences in carbon emissions from the construction industry and their interactive effects from the perspective of spatial heterogeneity.
The rest of the article is organized as follows. Section 2 describes the research area, data sources, and research methods. The results and analyzes are presented in Section 3. Section 4 discusses the results of the study. Section 5 summarizes this study and puts forward policy recommendations.
2 Materials and methods
2.1 Research area
According to the “Vision and Actions on Jointly Building Silk Road Economic Belt and 21st-Century Maritime Silk Road” (National Development and Reform Commission, 2015), the final blueprint of the Belt and Road Initiative (BRI) delineates five key areas within China, covering a total of 18 provinces, as detailed in Figure 1. The implementation of the BRI provides China with more opportunities for international cooperation, promoting increased cross-border trade and investment activities and enhancing economic exchanges in the regions along the routes. The construction industry, as one of the pillar industries of China’s national economy, is one of the largest energy consumers and plays a significant role in carbon emissions. Due to differences in development levels and technological innovation capabilities among the provinces along the Belt and Road, the construction industry consumes a considerable amount of energy, resulting in substantial carbon emissions. Therefore, achieving carbon reduction in the construction industry is of great significance for promoting the development of a green Belt and Road.

Figure 1. Research area.
2.2 Data sources
Due to the severe lack of energy consumption data for Tibet in the statistical yearbook, Tibet was not included in this study. Therefore, the research was conducted only on the 17 provinces along the Belt and Road. The data required for carbon emissions accounting and analysis of carbon emission influencing factors for the remaining provinces from 2006 to 2021 were obtained from the “China Construction Industry Statistical Yearbook,” “China Energy Statistical Yearbook,” “China Statistical Yearbook” and various regional statistical yearbooks. For missing values in some original data, linear interpolation was used to complete them.
Based on previous studies on the driving factors of carbon emissions in the construction industry (Du et al., 2017; Wu et al., 2019; Li et al., 2022b; Chen and Bi, 2022; Huo et al., 2022; Zhu et al., 2022; Guo and Fang, 2023; Huo et al., 2023; Li et al., 2023; Shi et al., 2023), and considering data availability and the characteristics of the research area, this study selected nine factors from four aspects: population, economy, technology, and the construction industry as independent variables to explore the driving factors of carbon emissions in the construction industry (see Table 1).
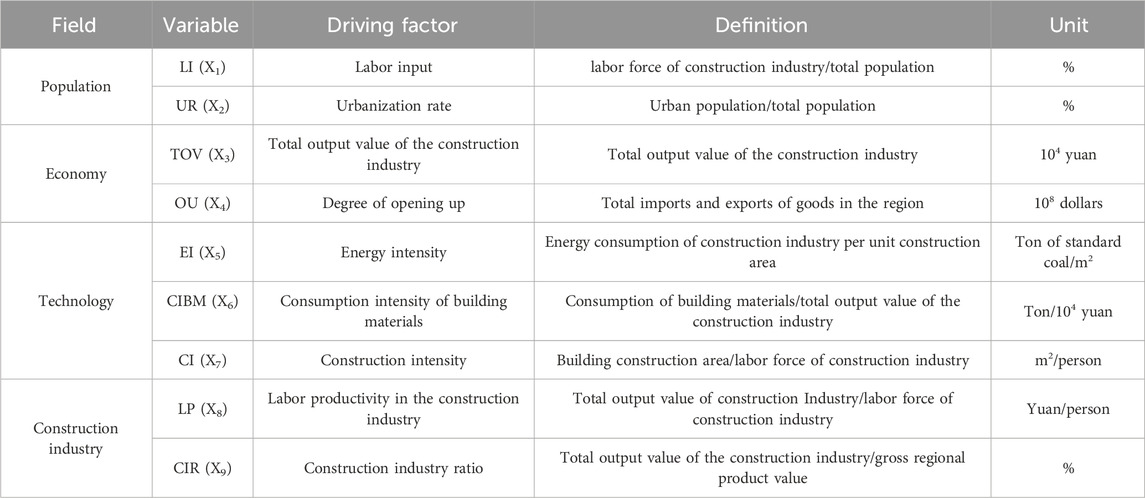
Table 1. Descriptions of the driving factors.
2.3 Research methods
2.3.1 Carbon emissions accounting
This article adopts the carbon emission factor method to account for carbon emissions in the construction industry. The total carbon emissions from the construction industry are divided into three stages: building materials production and transportation, building construction and demolition, and building operation, as shown in Eqs 1–4. The carbon emission coefficients for various building materials and energy sources, as well as their calculation methods and formulas, are sourced from the “China Construction Industry Statistical Yearbook,” “China Energy Statistical Yearbook,” “General Rules for Calculation of the Comprehensive Energy Consumption GB/T 2589-2020,” “Standard for Building Carbon Emission Calculation GB/T 51366-2019” and IPCC.
Where
It is worth noting that although the carbon emissions calculation formula for the building operation phase is the same as that for the building construction and demolition phase, the sources of various energy consumption are different. The energy consumption of the building operation stage comes from three categories in the energy balance sheet of the “Wholesale, Retail Trade and Hotel, Restaurants,” “Others,” and “Residential Consumption” in the “China Energy Statistical Yearbook.” The energy consumption of the building construction and demolition stage comes from the “Construction” category in the energy balance sheet of the “China Energy Statistical Yearbook.”
2.3.2 Temporal trends of carbon emissions
To reveal the temporal trend of carbon emissions in the construction industry, this study established a simple linear regression model between construction industry carbon emissions and time, and calculated the variation in slope value (Slope) from 2006 to 2021. The calculation formula is shown in Eq. 5:
where n represents the total number of years from 2006 to 2021, which is equal to 16;
To further classify the growth rate of carbon emissions, this study adopts standard difference levels to classify the growth trend of carbon emissions from the construction industry into four types as Table 2.

Table 2. Classification criteria for change trend types.
2.3.3 Global spatial autocorrelation analysis
Global Moran’s I can be used to test for the global correlation of spatial data. The calculation formula is shown in Eq. 6:
where I represents Global Moran’s I; n represents the total number of regions;
2.3.4 Local spatial autocorrelation analysis
Global spatial autocorrelation analysis mainly reflects the overall spatial correlation of the study area, while local spatial autocorrelation analysis can test the spatial correlation between individual local units. The calculation formula is shown in Eq. 7:
The interpretation of the variables in the formula is the same as in Eq. 6.
The local Moran’s I results can be used to generate the Moran scatter plot. The Moran scatter plot is divided into four quadrants. Quadrants I and III represent high-high and low-low clustering, indicating positive spatial correlation. Quadrants II and IV represent low-high and high-low clustering, indicating negative spatial correlation.
2.3.5 Standard deviation ellipse
Standard deviation ellipse can be used to describe the overall spatial distribution characteristics and spatial-temporal evolution process of the research object. Its basic parameters include the mean center (spatial center of gravity), long axis, short axis, and azimuth.
The coordinate formula of the mean center is shown in Eq. 8:
The azimuth is calculated as shown in Eq. 9:
Where
Axis standard deviation is calculated as shown in Eqs 10–11:
Where
2.3.6 Geographical detector model
The geographical detector model is a statistical method used to detect spatial heterogeneity and uncover its underlying drivers (Wang et al., 2016). There are four types of detectors in geographic detectors, namely factor detector, interaction detector, ecological detector, and risk detector (Wang et al., 2010). In recent years, an increasing number of scholars have applied geographical detectors to the field of carbon emissions (Zhang and Zhao, 2018; Xu et al., 2021; Chen and Bi, 2022). This study utilizes factor detector and interaction detector. Since the geographic detector model requires explanatory variables to be categorical variables, this paper employs the optimal discretization method to discretize continuous variables into continuous categories (Song et al., 2020).
The factor detector is used to analyze the explanatory power of a certain influencing factor on the spatial heterogeneity of carbon emissions in the construction industry. The degree of explanation is measured by q-value. The formula of the q-value is shown in Eq. 12:
where h = 1, 2, … , L is the layer of explanatory variable X;
The interaction detector can be used to identify the interaction between the two factors. By comparing the q-value of factor Xm and Xn with the interaction q-value of (Xm∩Xn), the interaction relationship between Xm and Xn can be determined, thus assessing the strength of the interaction between the two factors. There are five types of interaction relationships between factors, as shown in Table 3.
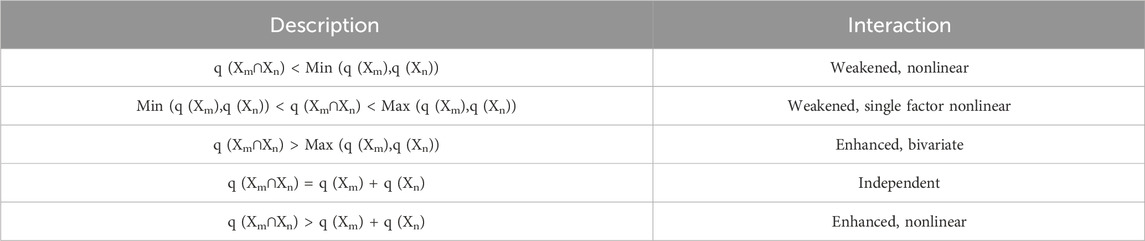
Table 3. Types of interaction.
3 Results
3.1 Analysis of carbon emissions from construction industry
Figure 2 illustrates the trend of total carbon emissions from regional construction industry from 2006 to 2021. There was a steady increase from 2006 to 2011, followed by a sharp rise to its peak in 2012. From 2012 to 2016, carbon emissions were controlled, leading to a decrease and subsequent stabilization in total emissions. However, from 2016 to 2021, carbon emissions gradually increased again. Additionally, it is evident from Figure 2 that the carbon emissions from the stages of building material production and transportation and building operation are much higher than those from the construction and demolition stages.
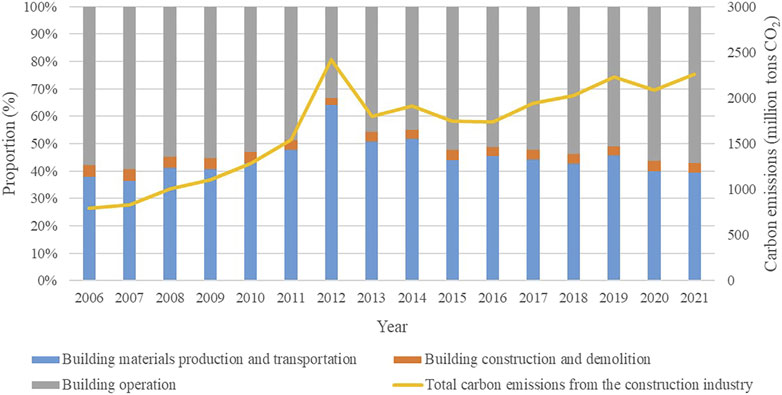
Figure 2. Total carbon emissions from the construction industry in “Belt and Road” provinces from 2006 to 2021.
Figure 3 displays the average carbon emissions from the construction industry in various provinces within the region from 2006 to 2021. In the southeastern coastal areas such as Zhejiang, Fujian, Guangdong, and Liaoning, carbon emissions are relatively high. In contrast, in the northwestern inland regions such as Gansu, Qinghai, and Ningxia, carbon emissions are lower, significantly smaller than those in the eastern coastal areas.
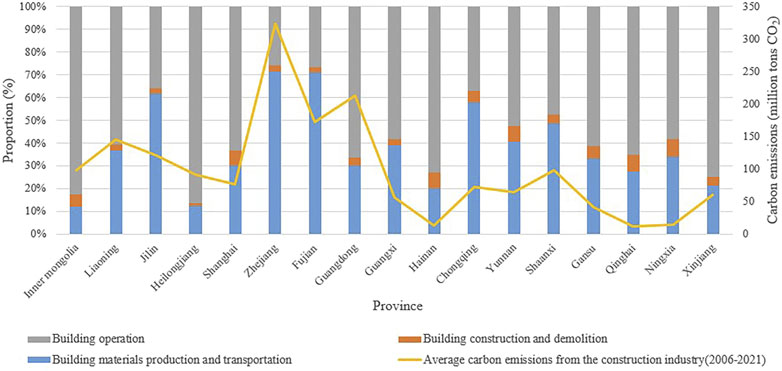
Figure 3. Average carbon emissions from the construction industry in “Belt and Road” provinces from 2006 to 2021.
In summary, from 2006 to 2021, total carbon emissions showed a fluctuating growth trend, reaching its peak in 2012. There are significant differences in carbon emissions from the construction industry in different regions, with higher emissions in the southeastern coastal areas and lower emissions in the northwestern inland areas. Additionally, the carbon emissions from the construction and demolition stages are relatively low.
3.2 Temporal characteristics of carbon emissions
Further utilizing the Slope model to calculate the growth trends in carbon emissions, the results indicate that carbon emissions in most provinces are showing a moderate growth trend, while the carbon emissions in the southeastern coastal areas are rapidly increasing, and those in the northwestern inland regions are growing slowly, as shown in Figure 4. From 2006 to 2021, carbon emissions from the construction industry in Guangdong, Fujian, and Zhejiang provinces have grown rapidly, while those in Gansu, Qinghai, Ningxia, Hainan, and Jilin have increased slowly. Carbon emissions in the remaining provinces have grown at a moderate pace. Moreover, the number of provinces with moderate growth rates exceeds half of the total number of provinces in the region, indicating that overall, the growth rate of carbon emissions from the construction industry in the region has been somewhat controlled, and the effectiveness of energy conservation and carbon reduction in the construction industry within the region is evident.
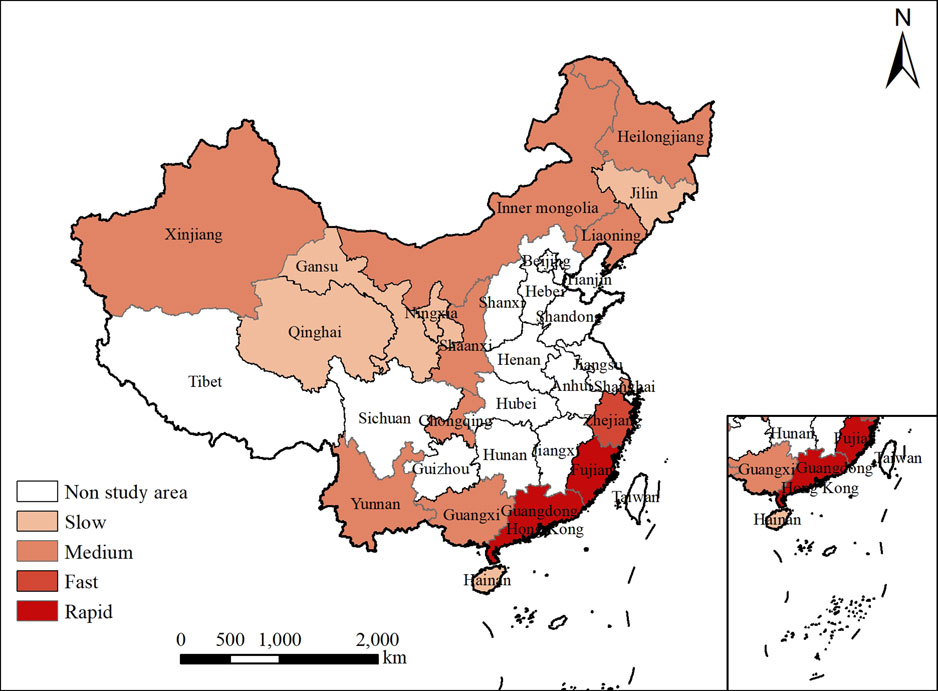
Figure 4. The growth trends in carbon emissions from the construction industry in provinces along the Belt and Road Initiative.
3.3 Characteristics of the spatial evolution of carbon emissions
3.3.1 Characteristics of global spatial autocorrelation
The results of Global Moran’s I are presented in Table 4. From Table 4, we can observe that in the selected 16 sample years, the majority of the years’ global Moran’s I indices pass the significance level test at the 95% confidence interval (p < 0.05), and each year’s Global Moran’s I is greater than 0, indicating a significant positive spatial correlation in carbon emissions across the region during the study period. Looking at the time series, the Global Moran’s I remained relatively stable from 2006 to 2016, with a fluctuating growth trend from 2016 to 2021, indicating that the spatial clustering of carbon emissions increased over time.
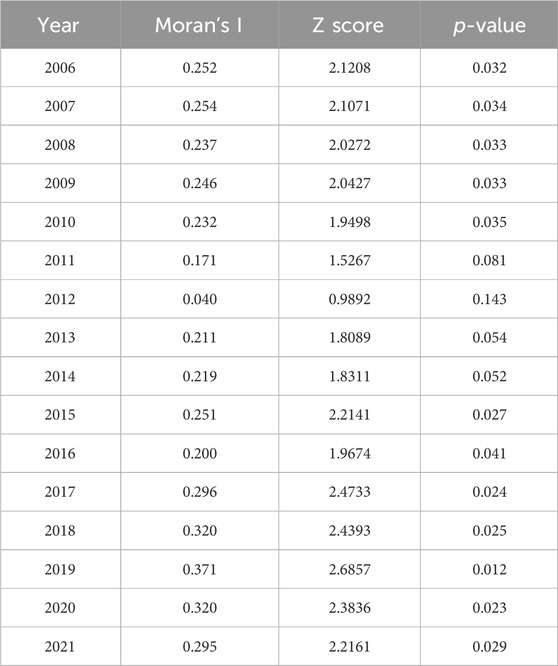
Table 4. Global Moran’s I and its test of the carbon emissions from construction industry.
3.3.2 Characteristics of local spatial autocorrelation
To examine the local spatial autocorrelation, Moran scatter plot analysis was conducted in this study. Due to the large timespan of the research, Moran scatter plots for the years 2006, 2011, 2016, and 2021 were selected for analysis. The distribution of points in the Moran scatter plots is shown in Table 5. The majority of provinces were located in the high-high and low-low clustering areas, accounting for about two-thirds of all provinces. Conversely, the number of provinces in the low-high and high-low clustering areas was relatively small, indicating significant spatial clustering characteristics of carbon emissions across provinces. The number of provinces in the high-high clustering area remained relatively stable over time, with Zhejiang, Fujian, and Guangdong consistently located in this region. Meanwhile, the number of provinces in the low-low clustering area showed an increasing trend, with Yunnan, Gansu, Qinghai, Ningxia, and Xinjiang consistently situated in this region. Compared to 2006 and 2011, the number of provinces in the low-low clustering area increased by one in both 2016 and 2021, indicating a growing trend in the spatial clustering of low-carbon emission provinces.
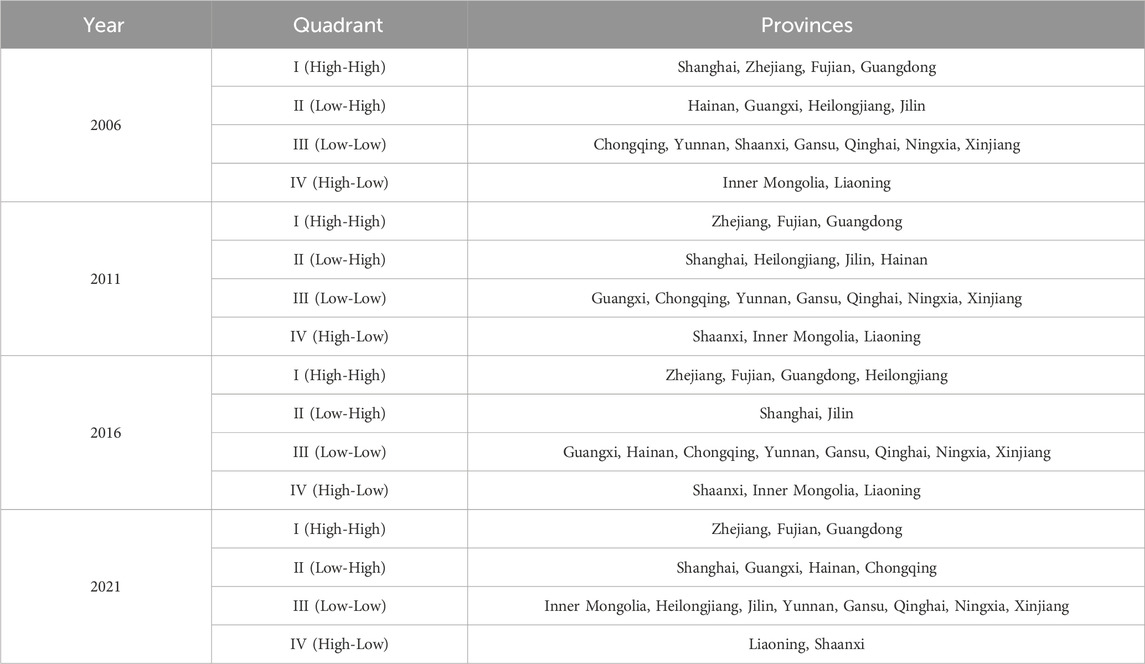
Table 5. Scatter distribution of carbon emissions in the construction industry over time.
3.3.3 Standard deviation ellipse analysis of carbon emissions
To explore the dynamic evolution characteristics of carbon emissions from the construction industry, this study utilized standard deviation ellipse to describe the spatial distribution and variation characteristics of carbon emissions. The results are shown in Figure 5, with the main parameters summarized in Table 6. To ensure the clarity of the trajectories of the standard deviation ellipses, this study selected the six interval years, namely 2006, 2009, 2013, 2016, 2019, and 2021, to intuitively demonstrate the spatial evolution of carbon emissions. From 2006 to 2021, the overall spatial pattern of regional carbon emissions showed a northeast-southwest pattern, with a weakening trend. The center of gravity mainly distributed in the east of the region. The trajectories of the standard deviation ellipses rotated clockwise from 2006 to 2013, gradually shifting towards the northeast. From 2013 to 2021, the trajectories of the standard deviation ellipses rotated counterclockwise, shifting from northeast to southwest. The trajectory of gravity center of the standard deviation ellipses changed significantly from 2006 to 2021, with the longest displacement observed between 2016 and 2019, indicating the fastest movement of the gravity center during this period. From 2006 to 2021, the azimuth increased from 11.102° to 175.026°, indicating a transition in the spatial pattern of carbon emissions from northeast-southwest to northwest-southeast. The length of the major axis decreased from 1,289.296 km in 2006 to 1,127.375 km in 2021, suggesting a contraction trend of carbon emissions in the northeast-southwest direction during this period. The length of the minor axis increased from 1,085.374 km in 2006 to 1,271.403 km in 2021, indicating a dispersion trend of carbon emissions in the northwest-southeast direction over this period.
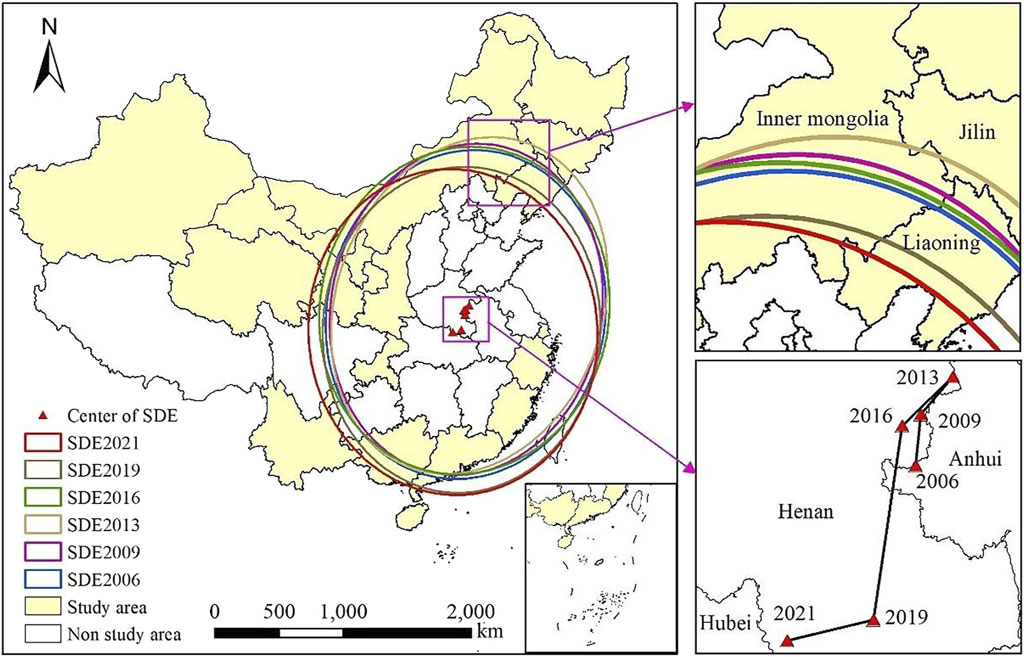
Figure 5. Ellipse distribution of carbon emission standard deviation and the movement trajectory of gravity center in the Belt and Road region.

Table 6. The main parameters of carbon emission standard deviation ellipse.
3.4 Analysis of driving factors of carbon emission
3.4.1 Factor analysis
Using the factor detector, the impact of driving factors on the spatial heterogeneity of regional carbon emissions was examined, and the results are presented in Table 7. Under the premise of passing the significance test (p < 0.05), a higher q-value indicates a stronger influence of driving factors on the spatial heterogeneity of regional carbon emissions. From a time-series perspective, in 2006, the driving factors were ranked in the order of intensity depending on the q-value as TOV (X3)>UR (X2)>OU (X4)>EI (X5). In 2014, the driving factors were ranked in the order of intensity depending on the q-value as TOV (X3)>UR (X2)>OU (X4). In 2021, the driving factors were ranked in the order of intensity depending on the q-value as TOV (X3)>OU (X4)>LI (X1)>UR (X2). According to the average q-value of the five factors that passed the significance test, the driving factors were ranked in the order of intensity as TOV (X3)>OU (X4)>UR (X2)>LI (X1)>EI (X5). Looking at the trend of single driving factor intensity, LI (X1), TOV (X3), and OU (X4) showed an overall increasing trend, while UR (X2) and EI (X5) showed a decreasing trend year by year. In summary, LI (X1), UR (X2), TOV (X3), OU (X4), and EI (X5) are the main factors affecting carbon emission changes, among which UR (X2), TOV (X3), and OU (X4) are the key factors influencing carbon emission changes.
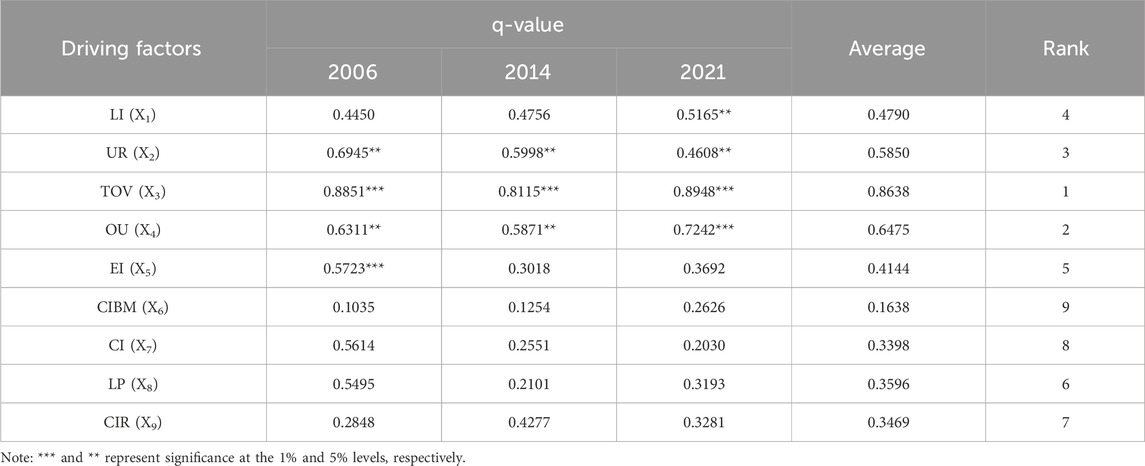
Table 7. Detection results of driving factors of carbon emissions from construction industry.
3.4.2 Interaction analysis
This study only analyzed the interaction effects of the five main factors in 2021, and the results are shown in Table 8. The results indicate that the majority of the interaction types are bivariate enhancement, meaning that the combined effect of two driving factors on carbon emissions in the construction industry is greater than the effect of a single factor, indicating that the impact of interactions on spatial heterogeneity is significant. This indirectly suggests that the spatial distribution of carbon emissions is the result of the combined effects of multiple factors. Significantly, in the interaction factor pairs, the interactions between TOV (X3) and OU (X4), UR (X2) and TOV (X3), LI (X1) and TOV (X3), TOV (X3) and EI (X5) in 2021 were all very high, reaching 0.9505, 0.9280, 0.9110, and 0.9063, respectively. It is evident that the interaction effect of TOV(X3) with other factors is very significant.
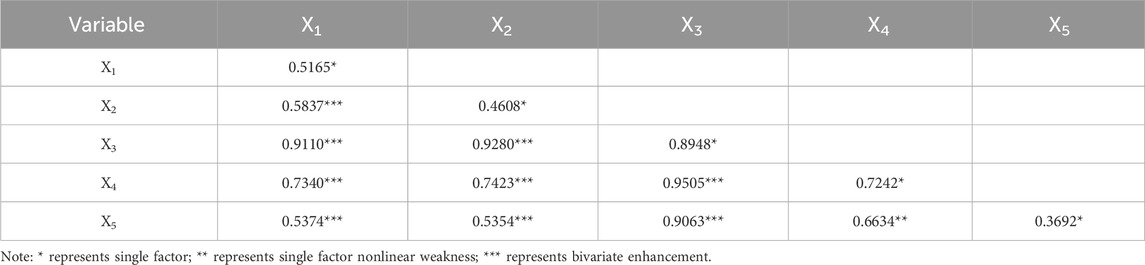
Table 8. Interaction between driving factors of carbon emissions from construction industry.
4 Discussion
In response to the 2008 global financial crisis, the Chinese government implemented a 4 trillion-yuan comprehensive economic stimulus package to further boost domestic demand and promote economic growth. This stimulus plan led to rapid development of infrastructure construction across various regions of China, with provinces engaging in extensive infrastructure and construction projects. Consequently, a significant amount of energy was consumed, leading to a continuous increase in carbon emissions from the construction industry, peaking in 2012. The Global Moran’s I reached its lowest value of 0.040 in 2012, failing to pass the significance test, possibly due to a significant surge in construction material consumption in Jilin Province in 2012, which led to a sudden increase in carbon emissions and shifted the gravity center of carbon emission towards the northeast, thereby weakening the spatial clustering characteristics of carbon emissions. Local spatial autocorrelation analysis revealed that Zhejiang, Fujian, and Guangdong remained consistently in the high-high clustering area. These provinces are economically developed coastal provinces with favorable geographical locations and high levels of openness, facilitating the development of the construction industry. As these provinces rapidly developed their construction industries, they also drove the development of the construction industry in adjacent provinces, leading to increased carbon emissions in both their own provinces and neighboring ones. Conversely, Yunnan, Gansu, Qinghai, Ningxia, and Xinjiang consistently remained in the low-low clustering area due to their relatively underdeveloped economies, limited talent, technology, and funding, resulting in slower development of the construction industry and lower carbon emissions in both their own provinces and neighboring ones. The increasing number of provinces with low-low clustering indicates the continuous implementation of China’s energy-saving and emission-reduction policies and the widespread application of building energy-saving technologies in the construction industry. From 2006 to 2013, carbon emissions exhibited a spatial distribution pattern from northeast to southwest with a strengthening trend, mainly due to the more developed economy in the eastern coastal areas, which exerted a more significant pull on carbon emissions in the western regions. From 2013 to 2021, the spatial distribution pattern of carbon emissions from northeast to southwest gradually weakened. On one hand, this was influenced by national macroeconomic policy adjustments, resulting in a decrease in investment intensity in the construction industry and a slowdown in its development pace, along with the gradual implementation of energy-saving and emission-reduction policies. On the other hand, the spillover effect of construction technology in the eastern regions drove carbon emissions reduction in the northeast and southwest regions.
In the analysis of influencing factors, the q-value of TOV consistently ranks first and passes the significance test of 1%. An increase in TOV implies more construction projects and activities, leading to greater consumption of building materials and energy. Consequently, the completion of construction will inevitably result in a significant increase in carbon emissions during the later operational stages. Openness can promote economic development and trade activities, attracting more capital flow into the construction industry. The fluctuating increase in the q-value of OU indicates that the cooperation between the regional construction industry and the international market is becoming increasingly close. On one hand, the regional construction industry can obtain international financial support to expand its scale, leading to increased energy consumption and higher carbon emissions. On the other hand, local construction enterprises can introduce advanced construction techniques and management experience to improve building energy efficiency and environmental performance, thereby reducing carbon emissions. As a labor-intensive industry, the demand for labor in the construction industry is significant. The q-value of LI increases annually, indicating its increasing impact on carbon emissions. The q-value of UR peaked in 2006, reaching 0.6945, and then gradually declined. In 2006, China entered a period of rapid urbanization, with dense urban populations and increasing demand for urban construction. The intensified construction of infrastructure and the rising demand for residential housing undoubtedly led to a significant increase in energy consumption and carbon emissions. However, during the rapid urbanization process, the government continuously introduced new low-carbon policies and energy-saving plans, emphasizing green and low-carbon development, resulting in a continuous weakening of the impact of UR on carbon emissions. The q-value of EI shows a downward trend, indicating that construction enterprises may have introduced advanced building energy-saving technologies and environmentally friendly building materials, resulting in reduced carbon emissions and thus a diminished impact of EI on carbon emissions. The interaction detector indicates that the interaction between TOV and other factors significantly influences the variation in carbon emissions. Regions with high total output value in the construction industry often have well-developed urban infrastructure, high degree of opening up, and high demand for labor and energy. Therefore, the interaction between TOV and other factors significantly influences the spatial differentiation pattern of carbon emissions.
5 Conclusion and policy recommendations
In this paper, the Slope model, Moran’s I index, and standard deviation ellipse are firstly used to analyze the spatial-temporal characteristics of carbon emissions from the construction industry in the Belt and Road region of China from 2006 to 2021. Then, we applied the geographical detector model to explain the spatial heterogeneity of regional carbon emissions. The main conclusions are as follows.
(1) From 2006 to 2021, the total carbon emissions showed a fluctuating growth trend, peaking in 2012. There were significant differences in carbon emissions from the construction industry among different regions, with higher emissions in the southeastern coastal areas and lower emissions in the northwestern inland areas. Additionally, carbon emissions during the production and transportation of building materials and during the operation phase of buildings were much higher than those during construction and demolition.
(2) Carbon emissions in most provinces exhibited a moderate growth trend. Regional carbon emissions exhibited significant spatial autocorrelation. The results of global spatial autocorrelation demonstrated that regional carbon emissions showed a significant positive correlation in space. In terms of local spatial autocorrelation, the majority of the provinces were located in the high-high and low-low clustering areas, which indicates there was a strong spatial clustering in carbon emissions among the provinces. The spatial pattern of regional carbon emissions from 2006 to 2021 showed a northeast-southwest pattern, with a weakening trend. The center of gravity mainly distributed in the east of the region.
(3) Labor input (X1), urbanization rate (X2), total output value of the construction industry (X3), degree of opening up (X4), and energy intensity (X5) were the main driving factors affecting the spatial heterogeneity of carbon emissions from the construction industry in the region, among which the urbanization rate (X2), total output value of the construction industry (X3), and degree of opening up (X4) were key factors. The effects of urbanization rate (X2) and energy intensity (X5) on carbon emissions gradually weakened, while the effects of labor input (X1), total output value of the construction industry (X3), and degree of opening up (X4) showed an increasing trend. The results of the interaction detector showed that the majority of the interaction types were bivariate enhancement, indicating that the spatial distribution of carbon emissions is the result of the combined effects of multiple factors.
Based on the above findings, the paper proposed some policy recommendations as follows.
(1) Governments should formulate carbon reduction policies tailored to local conditions. The northeastern and southeastern coastal areas with high carbon emissions should be the focus areas for controlling building energy conservation and emission reduction. On one hand, higher carbon reduction targets should be set, and government supervision and law enforcement of carbon reduction policies should be strengthened. On the other hand, efforts should be made to promote the application of building energy conservation technologies. In the northwest inland regions, efforts should focus on increasing the development and utilization of clean energy to reduce the use of fossil fuels.
(2) The construction industry has a significant demand for labor and energy. Governments should increase investment in the training of construction industry professionals and encourage construction enterprises to introduce advanced foreign building technologies and construction management experience.
Data availability statement
Publicly available datasets were analyzed in this study. This data can be found here: http://www.stats.gov.cn/.
Author contributions
XY: Conceptualization, Funding acquisition, Resources, Supervision, Validation, Writing–review and editing. KL: Data curation, Formal Analysis, Methodology, Software, Writing–original draft.
Funding
The author(s) declare that financial support was received for the research, authorship, and/or publication of this article. This study was supported by Research on Carbon Emission Calculation of Building Demolition Stage Based on BIM (Grant No. xj202111845376), and Study on the Spatial-Temporal Characteristics of Carbon Emissions from the Construction Industry in the Guangdong-Hong Kong-Macao Greater Bay Area (Grant No. xj2024118450511).
Conflict of interest
The authors declare that the research was conducted in the absence of any commercial or financial relationships that could be construed as a potential conflict of interest.
Publisher’s note
All claims expressed in this article are solely those of the authors and do not necessarily represent those of their affiliated organizations, or those of the publisher, the editors and the reviewers. Any product that may be evaluated in this article, or claim that may be made by its manufacturer, is not guaranteed or endorsed by the publisher.
References
Ali, G., Abbas, S., Pan, Y., Chen, Z., Hussain, J., Sajjad, M., et al. (2019). Urban environment dynamics and low carbon society: multi-criteria decision analysis modeling for policy makers. Sust. Cities Soc. 51, 101763. doi:10.1016/j.scs.2019.101763
Ali, G., Nitivattananon, V., Mehmood, H., Sabir, M., Sheikh, S.-u.-R., and Abbas, S. (2012). A synthesis approach to investigate and validate carbon sources and sinks of a mega city of developing country. Environ. Dev. 4, 54–72. doi:10.1016/j.envdev.2012.09.001
CABEE (2022). 2022 research Report of China building energy consumption and carbon emissions. Available at: https://mp.weixin.qq.com/s/7Hr__rkhS70owqTbYI_XuA.
Cai, H., Qu, S., and Wang, M. (2020). Changes in China’s carbon footprint and driving factors based on newly constructed time series input–output tables from 2009 to 2016. Sci. Total Environ. 711, 134555. doi:10.1016/j.scitotenv.2019.134555
Cao, Y., Zhao, Y., Wang, H., Li, H., Wang, S., Liu, Y., et al. (2019). Driving forces of national and regional carbon intensity changes in China: temporal and spatial multiplicative structural decomposition analysis. J. Clean. Prod. 213, 1380–1410. doi:10.1016/j.jclepro.2018.12.155
Chen, C., and Bi, L. (2022). Study on spatio-temporal changes and driving factors of carbon emissions at the building operation stage- A case study of China. Build. Environ. 219, 109147. doi:10.1016/j.buildenv.2022.109147
Du, Q., Wu, M., Wang, N., and Bai, L. (2017). Spatiotemporal characteristics and influencing factors of China’s construction industry carbon intensity. Pol. J. Environ. Stud. 26, 2507–2521. doi:10.15244/pjoes/70894
Fan, S., and Lu, Z. (2022). Research on the peak carbon dioxide emission strategy of Chinese port based on carbon emission estimation. Front. Environ. Sci. 9, 789970. doi:10.3389/fenvs.2021.789970
Gao, W., and Yuan, X. (2019). Region-county characteristic of spatial-temporal evolution and influencing factor on land use-related CO2 emissions in Chongqing of China, 1997–2015. J. Clean. Prod. 231, 619–632. doi:10.1016/j.jclepro.2019.05.248
Guo, X., and Fang, C. (2023). Spatio-temporal interaction heterogeneity and driving factors of carbon emissions from the construction industry in China. Environ. Sci. Pollut. Res. 30, 81966–81983. doi:10.1007/s11356-022-24200-4
He, Y., Xing, Y., Zeng, X., Ji, Y., Hou, H., Zhang, Y., et al. (2022). Factors influencing carbon emissions from China's electricity industry: analysis using the combination of LMDI and K-means clustering. Environ. Impact Assess. Rev. 93, 106724. doi:10.1016/j.eiar.2021.106724
Hu, S., Zhang, Y., Yang, Z., Yan, D., and Jiang, Y. (2022). Challenges and opportunities for carbon neutrality in China’s building sec-tor—modelling and data. Build. Simul. 15, 1899–1921. doi:10.1007/s12273-022-0912-1
Huo, T., Cao, R., Xia, N., Hu, X., Cai, W., and Liu, B. (2022). Spatial correlation network structure of China’s building carbon emissions and its driving factors: a social network analysis method. J. Environ. Manage. 320, 115808. doi:10.1016/j.jenvman.2022.115808
Huo, T., Cong, X., Cheng, C., Cai, W., and Zuo, J. (2023). What is the driving mechanism for the carbon emissions in the building sector? An integrated DEMATEL-ISM model. Energy 274, 127399. doi:10.1016/j.energy.2023.127399
IPCC (2021). “Climate change 2021: the physical science basis,” in Contribution of working group I to the Sixth assessment Report of the intergovernmental Panel on climate change. Editors V. Masson-Delmotte, P. Zhai, A. Pirani, S. L. Connors, C. Péan, S. Bergeret al. (Cambridge: Cambridge University Press). Available at: https://www.ipcc.ch/report/sixth-assessment-report-working-group-i/.
Ke, S., Wu, Y., Cui, H., and Lu, X. (2023). The mechanisms and spatial-temporal effects of farmland spatial transition on agricultural carbon emission: based on 2018 counties in China. Environ. Sci. Pollut. Res. 30, 107716–107732. doi:10.1007/s11356-023-29860-4
Li, K., Ma, M., Xiang, X., Feng, W., Ma, Z., Cai, W., et al. (2022b). Carbon reduction in commercial building operations: a provincial retrospection in China. Appl. Energy 306, 118098. doi:10.1016/j.apenergy.2021.118098
Li, L., Li, J., Wang, X., and Sun, S. (2023). Spatio-temporal evolution and gravity center change of carbon emissions in the Guangdong-Hong Kong-Macao greater bay area and the influencing factors. Heliyon 9, e16596. doi:10.1016/j.heliyon.2023.e16596
Li, T., Gao, H., and Yu, J. (2022a). Analysis of the spatial and temporal heterogeneity of factors influencing CO2 emissions in China’s construction industry based on the geographically and temporally weighted regression model: evidence from 30 provinces in China. Front. Environ. Sci. 10, 1057387. doi:10.3389/fenvs.2022.1057387
Liao, M., Zhang, Z., Jia, J., Xiong, J., and Han, M. (2022). Mapping China's photovoltaic power geographies: spatial-temporal evolution, provincial competition and low-carbon transition. Renew. Energy 191, 251–260. doi:10.1016/j.renene.2022.03.068
Liu, K., Ni, Z., Ren, M., and Zhang, X. (2022). Spatial differences and influential factors of urban carbon emissions in China under the target of carbon neutrality. Int. J. Environ. Res. Public Health 19, 6427. doi:10.3390/ijerph19116427
Ma, T., Liu, Y., and Yang, M. (2022). Spatial-temporal heterogeneity for commercial building carbon emissions in China: based the dagum gini coefficient. Sustainability 14, 5243. doi:10.3390/su14095243
National Development and Reform Commission (2015). Vision and Actions on jointly building Silk Road economic Belt and 21st-century Maritime Silk Road. Available at: https://www.ndrc.gov.cn/xwdt/xwfb/201503/t20150328_956036.html.
Pan, B., and Zhang, Y. (2020). Impact of affluence, nuclear and alternative energy on US carbon emissions from 1960 to 2014. Energy Strategy Rev. 32, 100581. doi:10.1016/j.esr.2020.100581
Shi, Q., Liang, Q., Wang, J., Huo, T., Gao, J., You, K., et al. (2023). Dynamic scenario simulations of phased carbon peaking in China's building sector through 2030–2050. Sustain. Prod. Consump. 35, 724–734. doi:10.1016/j.spc.2022.12.003
Song, Y., Wang, J., Ge, Y., and Xu, C. (2020). An optimal parameters-based geographical detector model enhances geographic characteristics of explanatory variables for spatial heterogeneity analysis: cases with different types of spatial data. GIScience Remote Sens. 57, 593–610. doi:10.1080/15481603.2020.1760434
Sun, Y., Hao, S., and Long, X. (2023). A study on the measurement and influencing factors of carbon emissions in China's construction sector. Build. Environ. 229, 109912. doi:10.1016/j.buildenv.2022.109912
Tong, X., Li, X., Tong, L., and Jiang, X. (2018). Spatial spillover and the influencing factors relating to provincial carbon emissions in China based on the spatial Panel data model. Sustainability 10, 4739. doi:10.3390/su10124739
UNEP (2022). 2022 global Status Report for buildings and construction. Available at: https://www.unep.org/resources/publication/2022-global-status-report-buildings-and-construction.
Wang, J., Li, X., Christakos, G., Liao, Y., Zhang, T., Gu, X., et al. (2010). Geographical detectors-based health risk assessment and its application in the neural tube defects study of the heshun region, China. Int. J. Geogr. Inf. Sci. 24, 107–127. doi:10.1080/13658810802443457
Wang, J., Zhang, T., and Fu, B. (2016). A measure of spatial stratified heterogeneity. Ecol. Indic. 67, 250–256. doi:10.1016/j.ecolind.2016.02.052
Wang, R., Ci, H., Zhang, T., Tang, Y., Wei, J., Yang, H., et al. (2023). Spatial-temporal evolution characteristics of industrial carbon emissions in China’s most developed provinces from 1998–2013: the case of Guangdong. Energies 16, 2249. doi:10.3390/en16052249
Wang, S., Sun, P., Sun, H., Liu, Q., Liu, S., and Lu, D. (2022). Spatiotemporal variations of carbon emissions and their driving factors in the Yellow River Basin. Int. J. Environ. Res. Public Health 19, 12884. doi:10.3390/ijerph191912884
Wang, Y., Chen, W., Kang, Y., Li, W., and Guo, F. (2018). Spatial correlation of factors affecting CO2 emission at provincial level in China: a geographically weighted regression approach. J. Clean. Prod. 184, 929–937. doi:10.1016/j.jclepro.2018.03.002
Wang, Y., and Zheng, Y. (2021). Spatial effects of carbon emission intensity and regional development in China. Environ. Sci. Pollut. Res. 28, 14131–14143. doi:10.1007/s11356-020-11557-7
Wei, Z., Li, J., Wang, Z., Zhou, A., and Li, M. (2022). County carbon emissions in the Yangtze River Delta region: spatial layout, dynamic evolution and spatial spillover effects. Front. Environ. Sci. 10, 977198. doi:10.3389/fenvs.2022.977198
WMO (2023). Greenhouse Gas concentrations hit record high. Again. Available at: https://public-old.wmo.int/en/media/press-release/greenhouse-gas-concentrations-hit-record-high-again.
Wu, P., Song, Y., Zhu, J., and Chang, R. (2019). Analyzing the influence factors of the carbon emissions from China's building and construction industry from 2000 to 2015. J. Clean. Prod. 221, 552–566. doi:10.1016/j.jclepro.2019.02.200
Wu, X., Xu, C., Ma, T., Xu, J., and Zhang, C. (2022). Carbon emission of China’s power industry: driving factors and emission reduction path. Environ. Sci. Pollut. Res. 29, 78345–78360. doi:10.1007/s11356-022-21297-5
Xu, L., Du, H., and Zhang, X. (2021). Driving forces of carbon dioxide emissions in China's cities: an empirical analysis based on the geodetector method. J. Clean. Prod. 287, 125169. doi:10.1016/j.jclepro.2020.125169
Yang, J., Cai, W., Ma, M., Li, L., Liu, C., Ma, X., et al. (2020). Driving forces of China’s CO2 emissions from energy consumption based on Kaya-LMDI methods. Sci. Total Environ. 711, 134569. doi:10.1016/j.scitotenv.2019.134569
Zeng, Q., and He, L. (2023). Study on the synergistic effect of air pollution prevention and carbon emission reduction in the context of "dual carbon": evidence from China's transport sector. Energy Policy 173, 113370. doi:10.1016/j.enpol.2022.113370
Zhang, H., and Li, S. (2022). Carbon emissions' spatial-temporal heterogeneity and identification from rural energy consumption in China. J. Environ. Manage. 304, 114286. doi:10.1016/j.jenvman.2021.114286
Zhang, X., Cai, Z., Song, W., and Yang, D. (2023). Mapping the spatial-temporal changes in energy consumption-related carbon emissions in the Beijing-Tianjin-Hebei region via nighttime light data. Sustain. Cities Soc. 94, 104476. doi:10.1016/j.scs.2023.104476
Zhang, X., and Zhao, Y. (2018). Identification of the driving factors’ influences on regional energy-related carbon emissions in China based on geographical detector method. Environ. Sci. Pollut. Res. 25, 9626–9635. doi:10.1007/s11356-018-1237-6
Zhou, Y., Hu, D., Wang, T., Tian, H., and Gan, L. (2023). Decoupling effect and spatial-temporal characteristics of carbon emissions from construction industry in China. J. Clean. Prod. 419, 138243. doi:10.1016/j.jclepro.2023.138243
Keywords: Belt and Road, carbon emissions, spatial-temporal characteristics, driving factors, geographical detector model
Citation: Yin X and Lin K (2024) Spatial-temporal characteristics and driving factors of carbon emissions from the construction industry in the Belt and Road region of China. Front. Environ. Sci. 12:1398328. doi: 10.3389/fenvs.2024.1398328
Received: 09 March 2024; Accepted: 03 June 2024;
Published: 26 June 2024.
Edited by:
Ghaffar Ali, Shenzhen University, ChinaReviewed by:
Peipei Tian, Shandong University, ChinaNatasha Murtaza, University of Agriculture, Faisalabad, Pakistan
Copyright © 2024 Yin and Lin. This is an open-access article distributed under the terms of the Creative Commons Attribution License (CC BY). The use, distribution or reproduction in other forums is permitted, provided the original author(s) and the copyright owner(s) are credited and that the original publication in this journal is cited, in accordance with accepted academic practice. No use, distribution or reproduction is permitted which does not comply with these terms.
*Correspondence: Xiuqin Yin, eWlueHFAZ2R1dC5lZHUuY24=