 Hanan F. Al-Harbi1
 Zubairul Islam
 Habes Ghrefat
94% of researchers rate our articles as excellent or good
Learn more about the work of our research integrity team to safeguard the quality of each article we publish.
Find out more
ORIGINAL RESEARCH article
Front. Environ. Sci., 15 May 2024
Sec. Environmental Informatics and Remote Sensing
Volume 12 - 2024 | https://doi.org/10.3389/fenvs.2024.1397825
This research analyses the long-term vegetation trends in Shada Mountain across six elevation zones, utilizing Landsat 5, 7, 8, and 9 imageries processed via Google Earth Engine and R. The study managed differences in images resolution through meticulous calibration and image processing techniques. The study is structured around two objectives: examining the relationship between vegetation and its proximity to streams and land surface temperature and analyzing trends in the Normalized Difference Vegetation Index (NDVI). Regression analysis revealed a negative correlation between vegetation and proximity to streams in lower zones (1–3), with no significant effect in higher zones (4–6). NDVI trend analysis indicated an overall increase in vegetation across most zones, with the exception of zone 5, which displayed a negative trend (slope −0.0025). The findings reveal that the decline is particularly pronounced among key tree species such as Ficus cordata subsp. salicifolia and Acacia asak, suggesting potential impacts from climate change and land use alterations. These zone-specific insights deepen our understanding of the dynamic ecological processes in semi-arid environments and guide targeted environmental management and conservation efforts.
According to the United Nations Food and Agriculture Organization (FAO, 2021), forests cover about 0.5% of Saudi Arabia, totaling approximately 977,000 hectares. The forests of Saudi Arabia store around 6 million metric tons of carbon in living biomass, and the nation is home to at least 2,028 species of vascular plants (World Rainforests, 2010). For conservation, about 2.0% of the country’s land falls under IUCN protected area categories I-V (Saudi Arabia Forest Information and Data, 2024). In recent years, the focus on forested areas within Saudi Arabia has intensified, recognizing their critical ecological, economic, and social roles, especially within arid to hyper-arid environments. The Saudi government, under initiatives like the Saudi Vision 2024 and the National Transformation Program, has committed to expanding its network of protected areas. The goal is to cover more than 10% of its total land area to ensure the conservation of its natural environment and biodiversity (Saudi Vision, 2024; Saudi Vision, 2024).
The ecological dynamics of vegetation in arid and semi-arid regions (Shi et al., 2023; Zhang et al., 2023), particularly in protected areas like Shada Mountain in Southern Saudi Arabia (UNESCO, 2018; El-Seedi et al., 2022), represent a critical area of study within environmental and earth sciences. Understanding these dynamics is pivotal, as vegetation plays a crucial role in maintaining ecological balance (Tian et al., 2016), supporting biodiversity, and mitigating the impacts of climate change (Pecl et al., 2017).
Saudi Arabia’s flora primarily comprises xerophytic species adapted to the harsh desert environment (Abbas et al., 2020), interspersed with seasonal and more verdant areas in the highlands and along the coastal regions (El-Ghanim et al., 2010). Recent studies have indicated a noticeable shift in vegetation patterns due to factors like climate change (Tarawneh and Chowdhury, 2018), land-use alteration (Alqurashi and Kumar, 2019), desert locust upsurge (Wang et al., 2021) and conservation efforts. In recent years, Saudi Arabia has witnessed a notable increase in vegetation, a trend contrary to the expectations for an arid region (Bindajam et al., 2020).
The relevance of understanding the interplay between climatic factors, such as coastal fog, and plant life cannot be overstated, as evidenced by Valjarević et al. (2023), who shed light on the ecological balance maintained in the Jizan region’s vegetation. Furthermore, the innovative use of satellite tracking in environmental studies, as demonstrated by Al-Mansi et al. (2021), Soria et al. (2024) underscores the potential of remote sensing technologies, like those employed in our study through Google Earth Engine, in capturing and analyzing long-term ecological trends.
This research contributes to the growing body of knowledge by mapping and analyzing the distribution and health of vegetation within the Shada Mountain’s protected areas, employing long-term NDVI data to unveil patterns and shifts in plant dynamics over the past decades. This study is set against the backdrop of Saudi Arabia’s unique climatic zones, each hosting a distinct array of plant species adapted to varying degrees of aridity. Specifically, the Shada Mountain region, characterized by its distinctive geographical and physiographical features, presents an intriguing case study for examining vegetation dynamics in response to environmental stressors.
So, this study aims to analyze the trends of vegetation change within the Shada Mountain’s protected areas using long term NDVI data in Google Earth Platform. Google Earth Engine was utilized in this study for its comprehensive satellite imagery archive and powerful computing capabilities, enabling the efficient analysis of long-term vegetation trends through NDVI data across Shada Mountain’s protected areas.
The current state of research underscores a growing interest in the study of vegetation dynamics in arid regions. Previous studies have focused on plant types and species diversity along an altitudinal gradient (Alaklabi et al., 2016; Al-Robai, 2023), Endemics and endangered plant species in Shada Mountains (Thomas et al., 2016), Floristic composition of Jandaf Mountain (Al-Namazi et al., 2022). However, there remains a need for more focused research of vegetation long term trend on specific protected areas like Shada Mountain, which has unique ecological characteristics.
Controversies exist in the field, particularly concerning whether changes in vegetation in arid regions like Saudi Arabia are predominantly positive or negative. These controversies stem from differing interpretations of data and the complex interplay of factors influencing vegetation dynamics.
The objectives of this study are methodically delineated to provide a comprehensive understanding of vegetation dynamics in the targeted region. The first objective is focused on exploring the relationship between vegetation and its proximity to streams and Land surface temperature. This aspect of the study endeavours to determine the extent to which the distance from streams and temperature affects vegetation abundance and diversity. The second objective is dedicated to examining the trend in NDVI from 1984 to 2023, with an emphasis on its impact on plant species diversity and health. By analyzing long-term NDVI data, this study aims to reveal the temporal dynamics of vegetation and infer the implications of these changes on the local flora.
Shada Mountain’s Protected Areas is situated in Al Baha, with coordinates ranging from approximately 15°41′–15°42′N and 47°19′–55°19′E, this 68.62 km2 reserve extends up to 2,222 m above sea level (Figure 1). It was designated as a protected reserve in 2002, emphasizing its ecological importance in Southern Saudi Arabia.
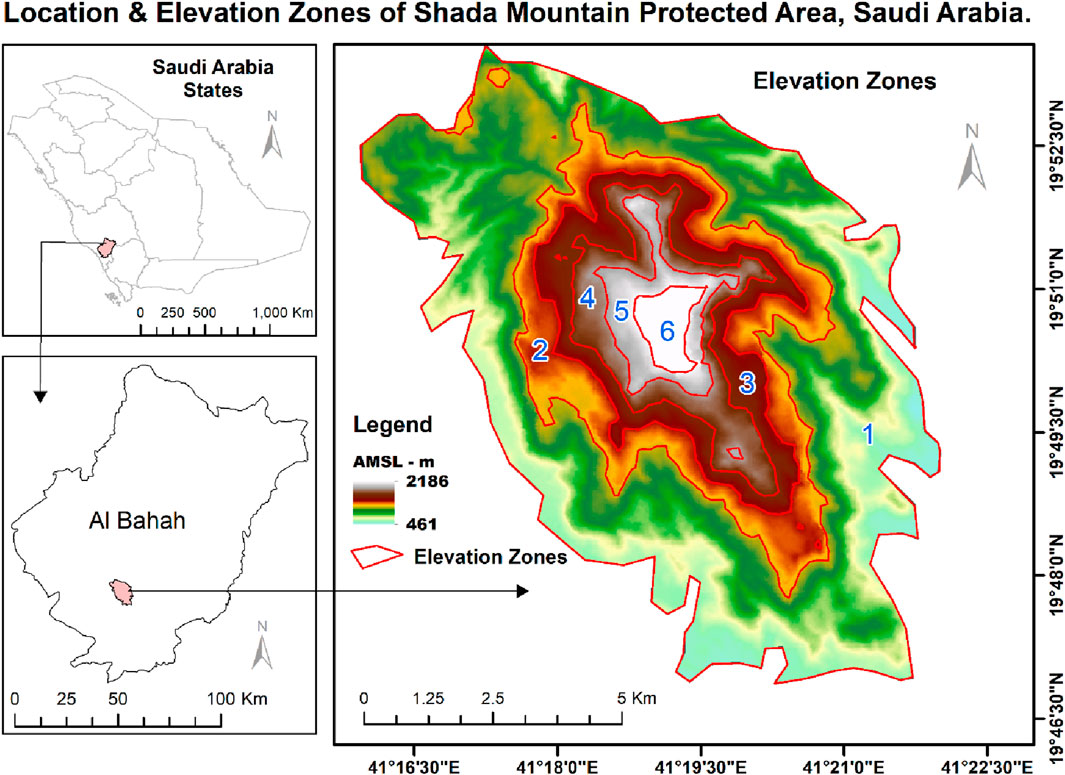
Figure 1. Study area.
This reserve is known for its rich biodiversity, housing around 500 plant species (Thomas et al., 2016) and serving as a habitat for the endangered Arabian leopard (Piccolo, 2024). The Shada Mountains range includes Shada Alalah (2,215 m above sea level) and Shada Asfal (1,472 m above sea level), separated by Wadi Meleel valley (Abdulmnam Samakie, 2020).
The climate varies with altitude; higher elevations experience cooler and wetter conditions than the lowlands. Annual precipitation averages 148.7 mm, with monthly variation. Temperature ranges from 9.0°C in January to 36.5°C in August, and humidity fluctuates from 59% in January to 24% in June (Protected Areas, 2021). The park’s diverse vegetation includes juniper and opacity trees, along with various bushes, herbs, and weeds. Wildlife in the area includes the Arab tiger, striped hyena, Arab wolf, foxes, and lynx.
Table 1 and Figure 1 shows the division of the study area into six elevation zones (EZ) is based on a combination of elevation, vegetation composition, and the presence of endemic and endangered species (Thomas et al., 2016):

Table 1. Elevation zones (EZ).
The work was initiated by setting up the Google Earth Engine environment, which served as the primary platform for data analysis. The study area was carefully selected, and the timeframe defined. Relevant data from the Landsat 5, 7, 8, and 9 satellite series was then selected and collected. This data was refined by filtering based on the study area criteria, cloud cover, and additional parameters such as sun elevation, sun azimuth, and sensor viewing angle to ensure optimal image quality and consistency for analysis.
Subsequent processing included masking out clouds, water bodies, and saturated pixels to isolate the vegetation signal. Key analytical steps included calculating the NDVI and Land Surface Temperature (LST) from the processed satellite imagery. The Land Surface Temperature (LST) was derived from thermal infrared bands of Landsat satellite imagery. Initially, digital numbers (DN) were converted into spectral radiance, and then into brightness temperature using the calibration constants provided with the Landsat data. Subsequently, we applied an emissivity correction, estimated from the NDVI, to account for the varying emissivity of different land surfaces. This method allowed for the accurate determination of LST across various land cover types within the study area, providing crucial data for analyzing vegetation health and climate interactions. These data sets were then imported into R Studio, where we conducted regression and trend analyses to explore the relationships between vegetation, topography, and environmental factors. This workflow facilitated a comprehensive and accurate analysis of long-term vegetation trends in the selected region (Figure 2).
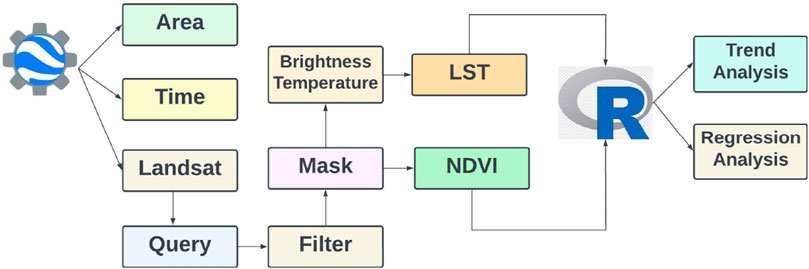
Figure 2. Work flow chart.
In order to map and monitor the distribution of NDVI, satellite images from Landsat 5 TM, 7 ETM+, and 8 OLI were utilized for the years 1984–2023 (Landsat Collections in Earth Engine, 2024). The presence of cloud cover posed a challenge in generating accurate data. To address this issue, an algorithm was implemented on the USGS database, which selected the optimal pixel value with cloud cover, and other collection errors below 5%. The Normalized Vegetation Index (NDVI) was calculated using RED and NIR bands in the dataset, each with a spatial resolution of 30 m. (GEE).
The Plants species samples were collected from 100 locations at various elevations zones as shown in Figure 1. The spectral signatures as well as NDVI values were matched with USGS plants species spectral library (https://www.usgs.gov/labs/spectroscopy-lab/science/vegetation-species).
In our research, we employ a detailed and multifaceted approach, focusing primarily on the use of remote sensing and Google Earth Engine (GEE) technologies to scrutinize the NDVI. By effectively mitigating the adverse effects of cloud cover and cloud shadows, we ensure the integrity of our spectral analyses. Specifically, this involves the utilization of the “QA_PIXEL” band from Landsat satellite imagery to systematically classify and eliminate cloud-contaminated pixels, thereby refining our data quality.
Brightness Temperature (Tb) and Land Surface Temperature (LST) were calculated, employing established formulas that account for atmospheric and emissivity factors. Furthermore, we validate our data through comparative analyses with field measurements and higher resolution datasets, ensuring the reliability of our findings.
The brightness temperature is calculated from the thermal band data (Ermida et al., 2020). The raw digital number (DN) values are first converted to top-of-atmosphere (TOA) radiance and then to brightness temperature using the following Eq. 1.
where:
ML and AL are the multiplicative and additive rescaling factors from the metadata.
K1 and K2 are calibration constants also obtained from the metadata.
DN is the digital number of the thermal band.
Tb is the brightness temperature in Kelvin.
Finally, LST is calculated using the brightness temperature and emissivity (Aliihsan Sekertekin and Bonafoni, 2020) using the following Eq. 2:
where:
Tb is the brightness temperature in Kelvin.
λ is the wavelength of emitted radiance (which depends on the thermal band used).
ρ is a constant (approximately ℎ × h × c/σ, where ℎh is Planck’s constant, c is the speed of light, and σ is Stefan-Boltzmann constant).
ϵ is the surface emissivity.
Data validation was achieved by conducting a comparative analysis between the mean Land Surface Temperature (LST) values across the study region, and the temperature measured at the field (Hachem et al., 2012). This high degree of correlation substantiates the reliability of the LST derived from Landsat satellite data for representing temperature variations within the study area.
The validation of the NDVI data was performed by conducting a comparative analysis with higher-resolution NDVI datasets obtained from the Sentinel-2 Multispectral Instrument (MSI) via the Google Earth Engine (GEE) platform (GEE). The analysis involved correlating NDVI values derived from Landsat series with those from Sentinel-2, which provides data with a finer spatial resolution of 10 m. This comparison utilized the temporal overlap and spectral similarity between the sensors on the two-satellite series to ensure a valid assessment. The high correlation coefficient (r) of 0.94 obtained from these comparisons underscores a strong linear relationship and validates the NDVI data from the Landsat series. The alignment between the NDVI trends observed in both datasets attests to the robustness of the data derived from Landsat satellite sources. Additionally, field data from systematic ground truthing exercises were utilized to further validate the satellite-based NDVI readings, offering a reliable base for the subsequent analyses of vegetation dynamics.
Sen’s Slope, was calculated by first computing the slope (Alavi and King, 2020) Figure 3.
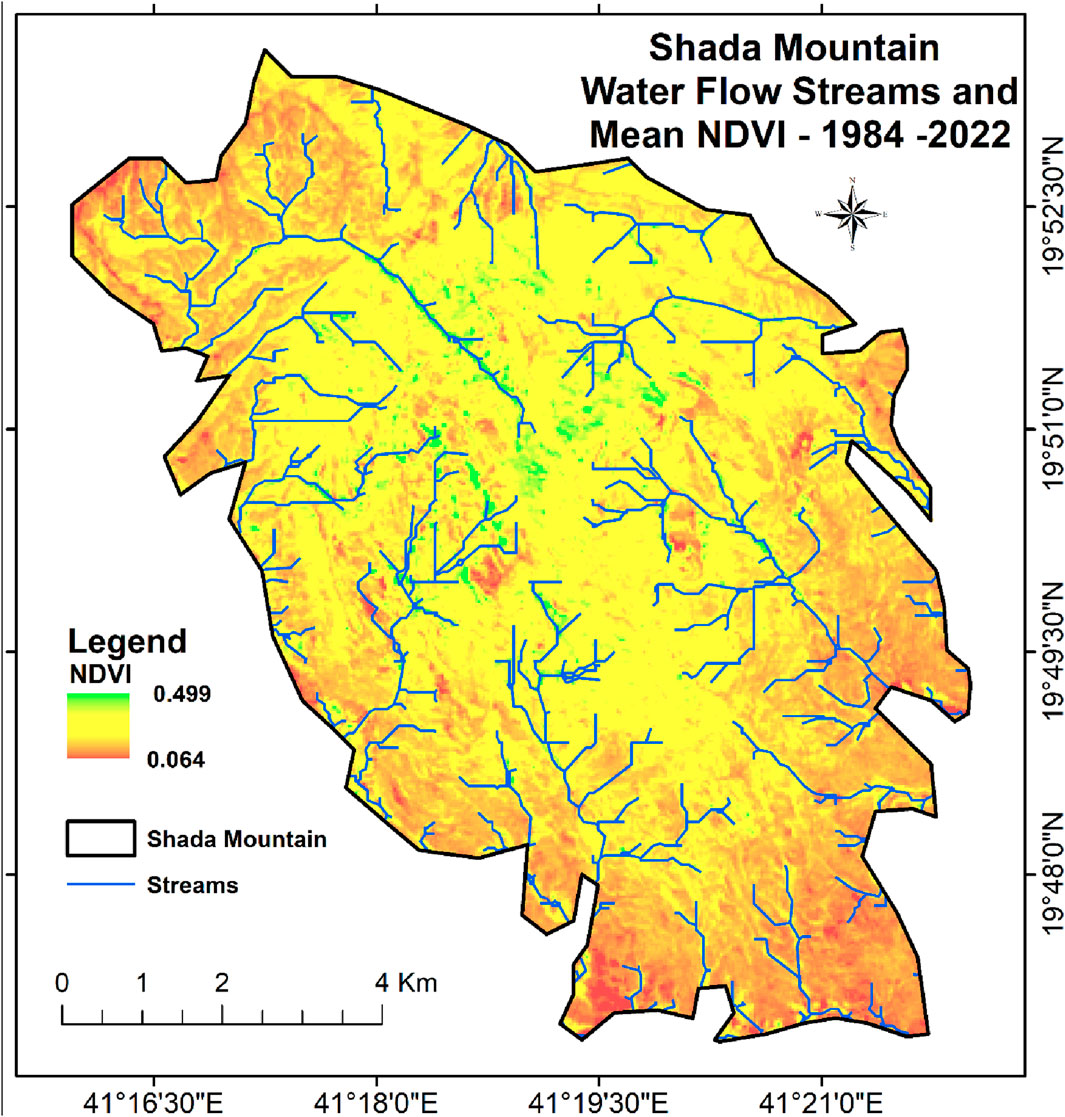
Figure 3. Distribution of NDVI and streams.
In Eq. 3, ρ is the trend degree. If ρ < 0, this means that FVC shows a downward trend. When ρ > 0, this means that FVC shows an upward trend. FVCj and FVCi represent the vegetation coverage values in the year j or i.
The Mann–Kendall test is a non-parametric trend test method not affected by missing values and outliers, which is suitable for use with Theil–Sen slope estimation. The equations could be represented as Figures 4–7:
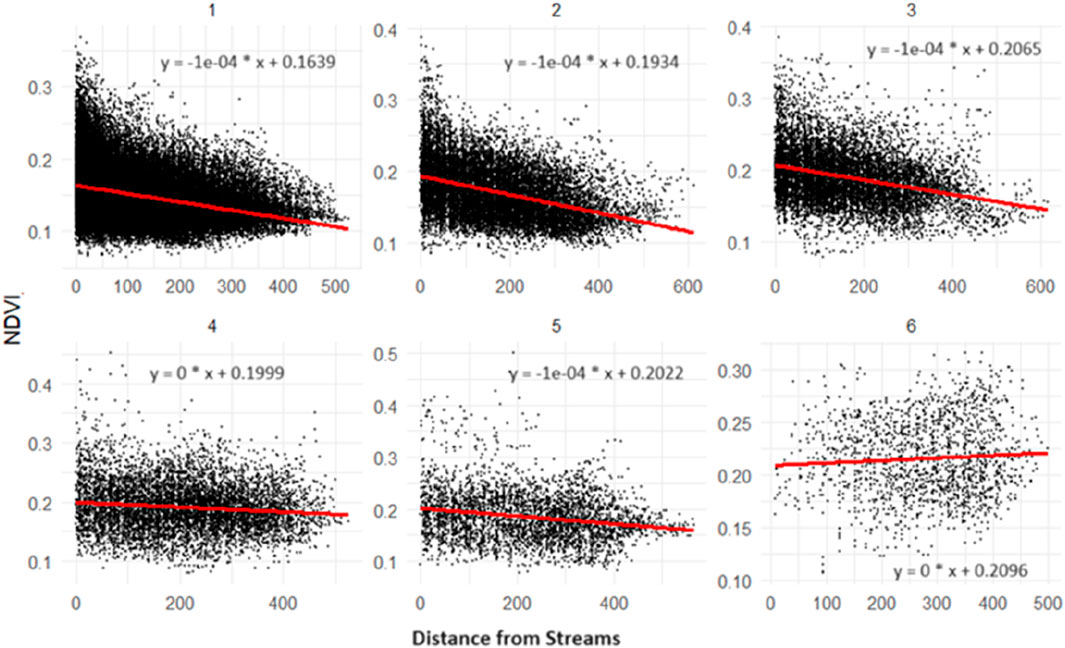
Figure 4. Elevation zone-wise regression analysis of NDVI against distance from streams.
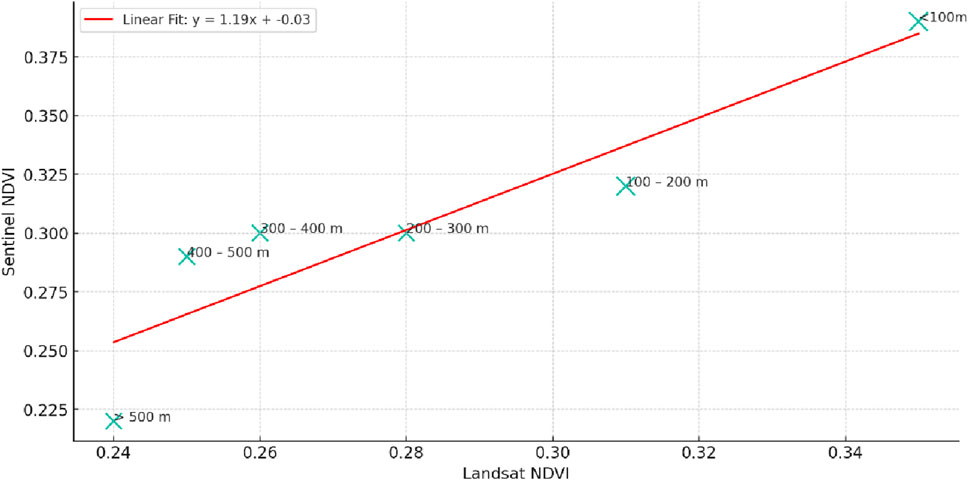
Figure 5. Linear regression analysis of NDVI measurements between landsat and sentinel across distance classes.

Figure 6. Mean LST.
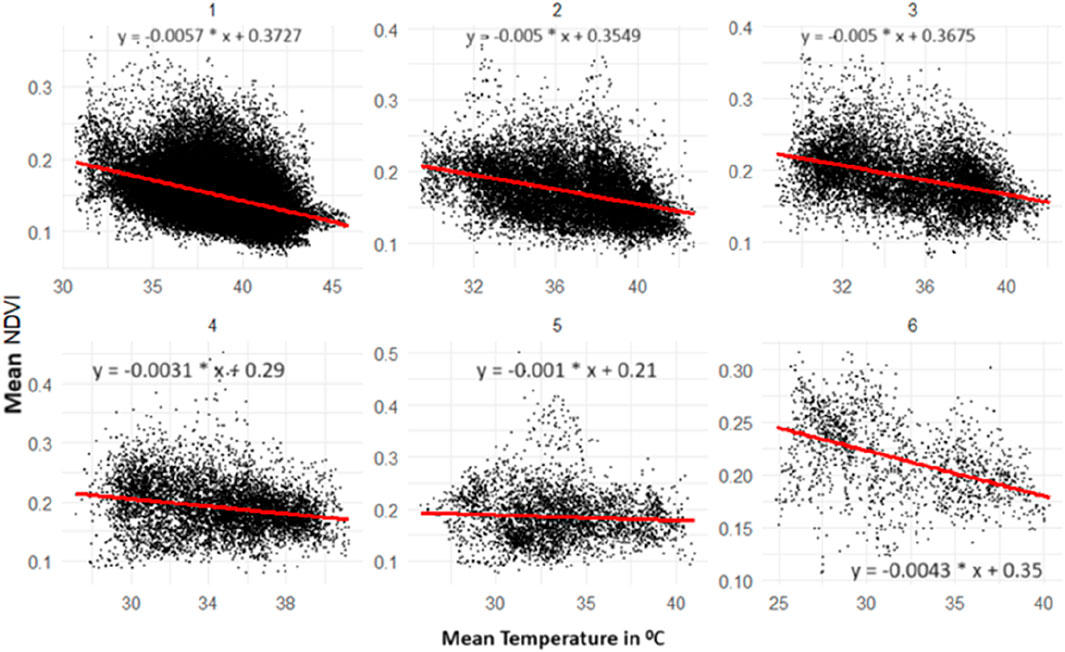
Figure 7. Elevation zone-wise regression analysis of NDVI against temperature.
Where
Furthermore
And
Among Eqs 5–7, Z is the standardized test statistic, Var (b) is the variance, and the value of b in this study is the result of the Theil–Sen slope estimation. The given significance level is 0.05, and a two-sided test is used. If |Z| > Z1-α/2, the significance test is passed.
In this study, the term “trend” refers to the long-term change in vegetation coverage, quantified using Sen’s Slope (ρ). This statistic represents the median of all possible pairwise slopes (differences in vegetation coverage over time) in the dataset, making it resistant to outliers and missing data. Positive values of ρ indicate an upward trend (increase in vegetation coverage over time), while negative values indicate a downward trend. Alongside, the Mann–Kendall test determines the statistical significance of this trend. By integrating Sen’s Slope with the Mann–Kendall test, we obtain a robust estimation of vegetation trends over time, which is crucial for understanding vegetation changes. This methodological approach ensures that the trends we report are not only statistically significant but also represent real changes in vegetation coverage, providing a clear and comprehensive understanding of the ecological dynamics in the study area.
Figure 3 shows the distribution of NDVI and streams across the study area. Stream networks were derived from a Digital Elevation Model (DEM). We employed the “Fill,” “Flow Direction,” and “Flow Accumulation” functions to preprocess the DEM and identify potential water flow paths, then defined streams based on a specified flow accumulation threshold, creating a vector layer representing the stream network relative to the terrain.
The regression analysis conducted in our study uncovered a complex relationship between NDVI and proximity to streams, as depicted in Figure 4. The scatter plots, one for each zone, were generated using R’s comprehensive data visualization libraries “ggplot2” package due to its versatility and advanced graphical capabilities. As a result, in Zones 1, 2, 3, and 5, we observed a distinct pattern where NDVI values tended to decrease as the distance from streams increased, a relationship underscored by the negative coefficients derived from our regression equations. This suggests that vegetation in these areas is lusher and denser closer to water sources, potentially due to better water availability. Conversely, Zones 4 and 6 presented a divergent trend; here, NDVI values appeared to remain consistent regardless of the distance from streams. This indicates that factors other than water proximity, such as soil type, land use, or perhaps even microclimatic conditions, might be influencing vegetation cover in these specific zones. This variability underscores the heterogeneity within the study area and highlights the importance of considering local environmental conditions when analyzing NDVI patterns.
The validation involved a statistical comparison of NDVI values from both Landsat and Sentinel imageries across different distance classes from streams as shown in Table 2. Figure 4 shows correlation coefficient of approximately 0.90, indicating a strong positive correlation between the NDVI values from the two sources.
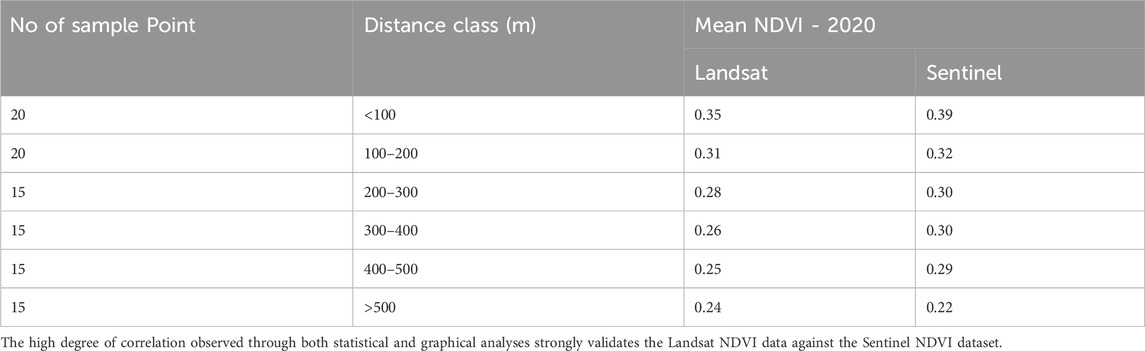
Table 2. Data validation of mean NDVI for 2020: Comparison between landsat and sentinel imagery across various distance classes.
Figure 6 shows the distribution of land surface temperature across the study area. Regression analysis between NDVI and mean temperature across different ecological zones revealed a consistent negative correlation, indicating that higher temperatures generally lead to lower vegetation (Figure 7).
The statistical analysis and visual representation depicted in Figure 7 were facilitated by the use of R programming, The “ggplot2” package, renowned for its capability to create complex and highly customizable plots, was instrumental in generating the scatter plots and fitting the regression lines. Each plot represents a different ecological zone, with the regression line illustrating the relationship between mean temperature and NDVI. The regression analysis across different ecological zones explains a consistent negative correlation between the NDVI and mean temperature. This inverse relationship, indicated by the negative slope coefficients in all zones, suggests that as temperatures increase, vegetation density tends to decrease. Specifically, in zones 1, 2, and 3, despite variations in temperature ranges, the clear downward trend in NDVI with rising temperatures underscores the thermal sensitivity of vegetation in these regions. Similarly, zones 4, 5, and 6 exhibit this negative correlation, although the data spread indicates differing degrees of sensitivity to temperature changes among the zones. This pattern highlights the potential impact of higher temperatures on vegetation health and distribution, suggesting that warmer conditions contribute to reduced vegetation cover across the ecological zones examined.
Table 3; Figure 8 show the Landsat data consistently compared to the ground measurements across all elevation zones. Specifically, the Landsat-derived minimum LSTs were generally higher by approximately 1.5°C–2.5°C, while the maximum LSTs recorded by Landsat were about 3.5°C–4.5°C higher than those measured on the ground.
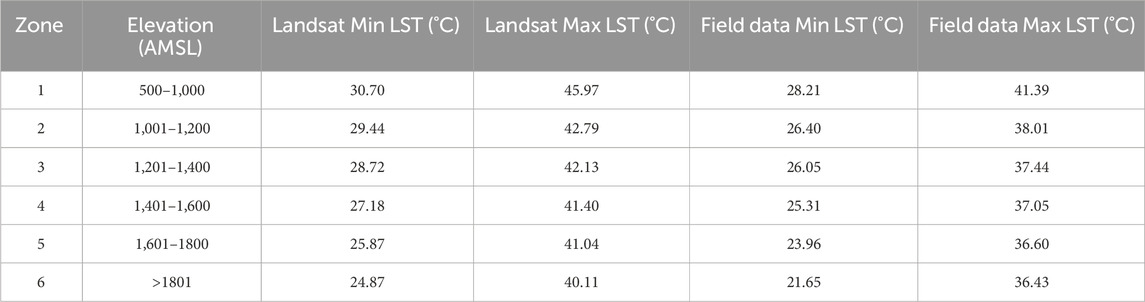
Table 3. Comparison of landsat and field data for land surface temperature (LST) across various elevation zones in shada Mountain’s protected areas.
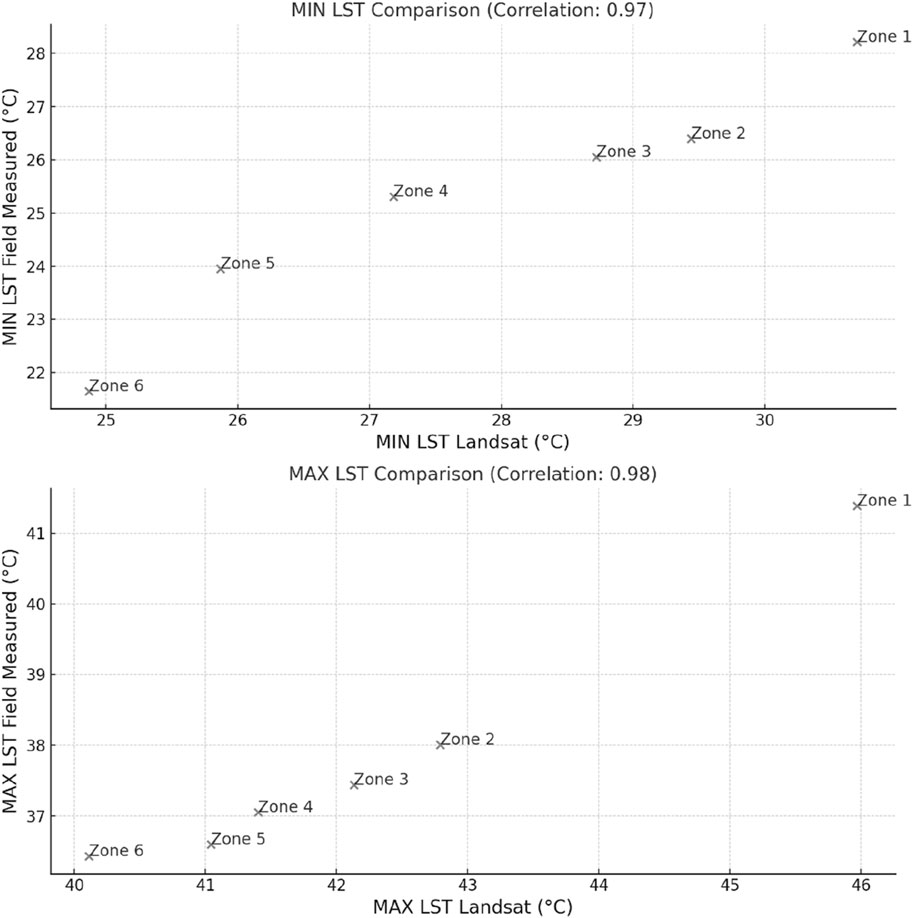
Figure 8. Correlation of minimum and maximum LST measurements between landsat data and field observations across different zones.
This consistent variance suggests a systematic difference in temperature readings between the two methods. While both datasets displayed a similar trend of decreasing temperature with increasing elevation, the Landsat data tended to estimate higher temperatures. This disparity might be attributed to factors such as the satellite’s sensor calibration, atmospheric conditions during satellite overpass, or the inherent difference between surface and air temperatures.
The positive slope (0.0084) indicates that NDVI has been increasing over the years in this zone, suggesting that vegetation density or health might be improving. The R2 value of 0.21 suggests that approximately 21% of the variation in NDVI can be explained by the time variable in this model (Figure 9).
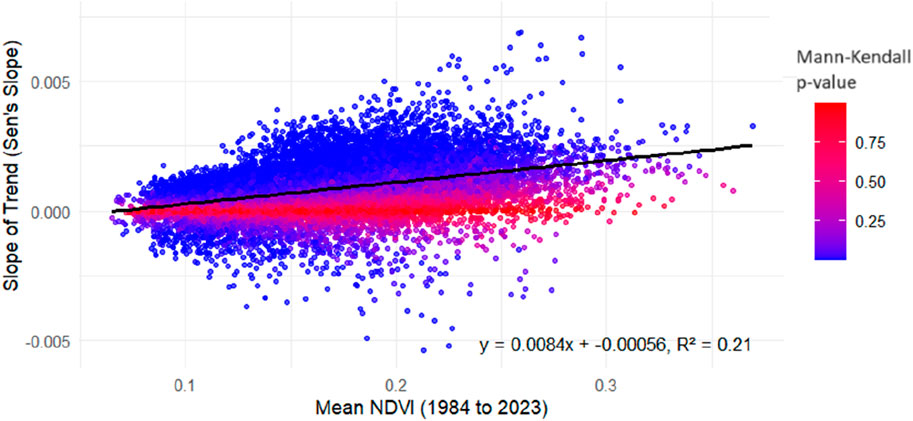
Figure 9. Regression analysis of NDVI against slope of trend, zone 1.
In Zone 2 a positive slope of 0.0046 in NDVI indicates an upward trend in vegetation health and density, albeit at a slower rate compared to Zone 1. This change in NDVI, as illustrated in Figure 10, offers insights into the region’s ecological dynamics.
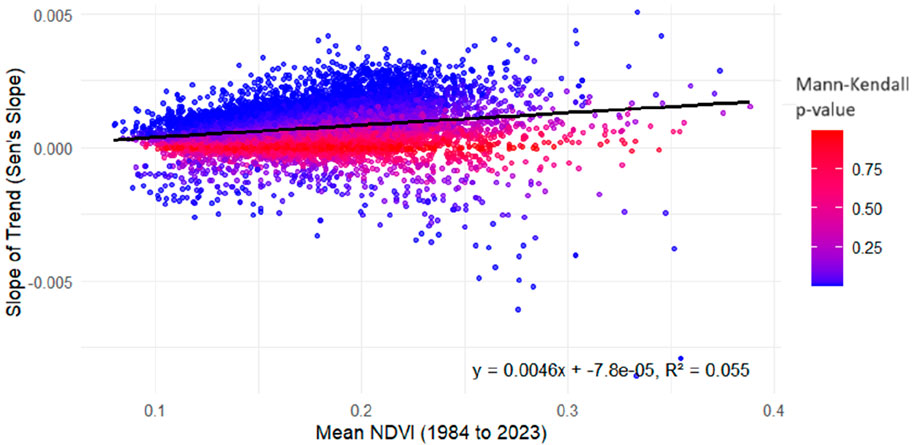
Figure 10. Regression analysis of NDVI against slope of trend, zone 2.
In this zone, the NDVI data exhibits a positive slope of 0.0053, reflecting an increase in vegetation health and density. However, the relatively low R2 value of 0.062 indicates that only a small fraction (6.2%) of the NDVI variation is explained by time in this model, as shown in Figure 11.
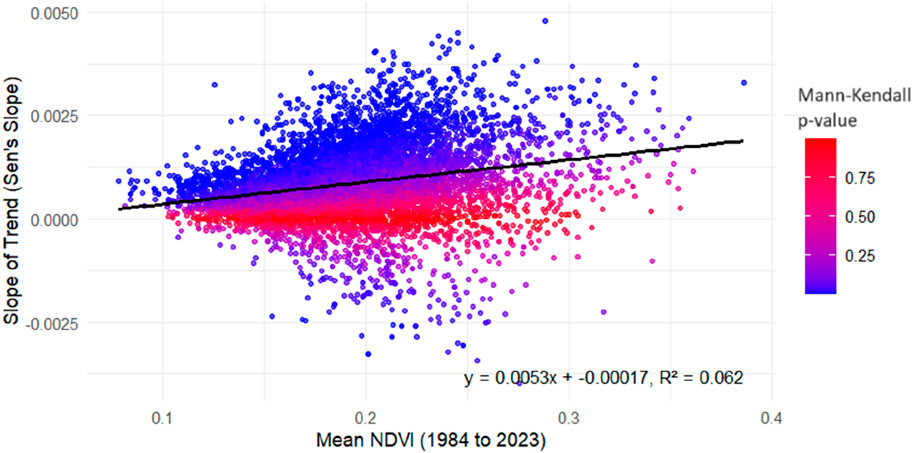
Figure 11. Regression analysis of NDVI against slope of trend, zone 3.
NDVI exhibits a positive slope of 0.0041 with a positive intercept of 0.00025 in this zone. This suggests that vegetation in this zone starts from a higher baseline compared to Zones 1 to 3, as shown in Figure 12. However, the low R2 value of 0.039 indicates that the time variable explains a smaller proportion of the variation in NDVI in this zone.
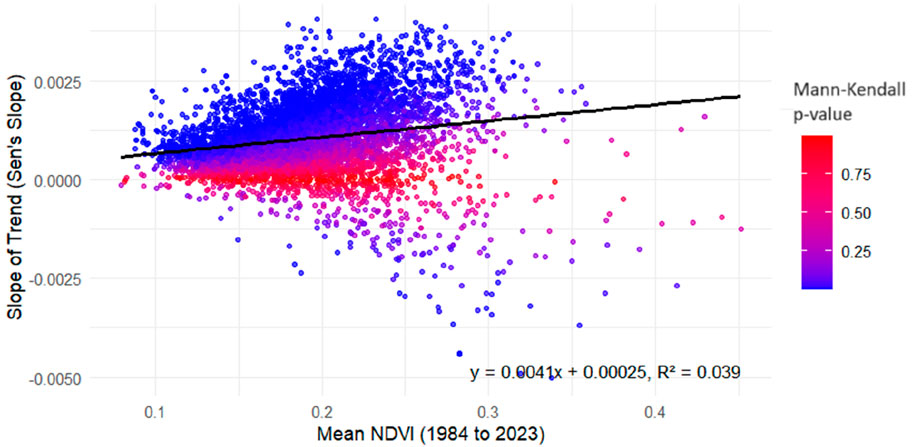
Figure 12. Regression analysis of NDVI against slope of trend, zone 4.
In this zone, a distinct shift in vegetation health is observed, with a negative slope of −0.0025 in NDVI, as indicated in Figure 13. This trend suggests a decrease in vegetation health or density over time, despite starting with a higher NDVI value in 1985. This decline could be indicative of various environmental stressors or changes impacting the region’s flora.
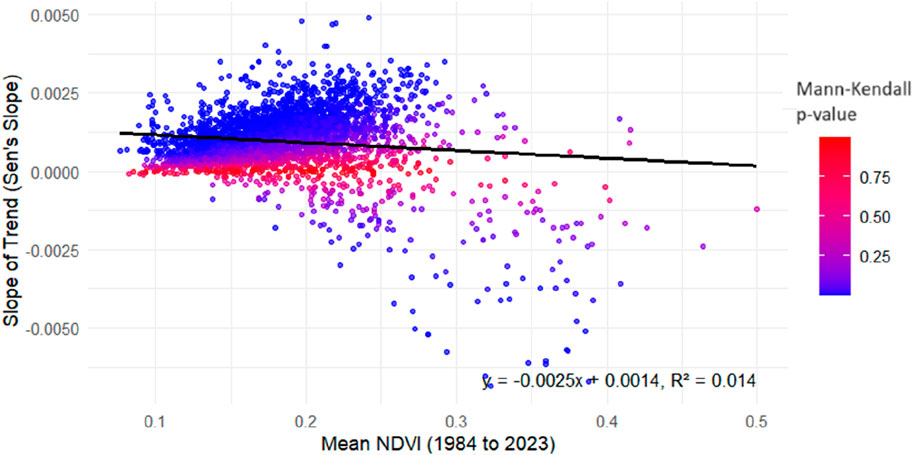
Figure 13. Regression analysis of NDVI against slope of trend, zone 5.
There is a positive trajectory with a slope of 0.0074, as seen in Figure 14. The negative intercept (−0.00034) suggests a slight adjustment in the baseline NDVI value. Notably, the R2 value of 0.1 indicates that time accounts for 10% of the variation in NDVI, which is a more significant explanatory factor compared to Zones 2, 3, 4, and 5.
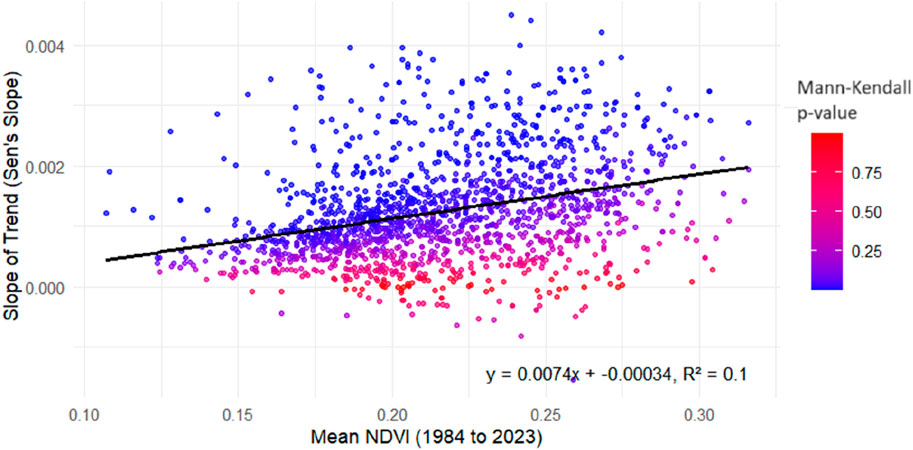
Figure 14. Regression analysis of NDVI against slope of trend, zone 6.
Shada Mountain is characterized by a unique environmental diversity and its role as a habitat for animals and migratory birds that feed from its vegetation. In order to preserve the environmental components of Shadda Al-Aala and its animal wealth that extend over its estimated area of 62 km, the Saudi Wildlife Authority included the mountain to the list of natural reserves in the Kingdom in 2002. Shada Al-Baha Reserve, like other reserves and forests in the southwest of Saudi Arabia, is exposed to many factors that affect the diversity and density of its vegetation. Many of disturbances in the vegetation are caused by human activities which were extended widely during the last two decades. Examples of this can be seen between the cities of Mandaqe and Al-Baha (Ghazal, 2015). However, the results of this research indicate that there is an improvement in the vegetation coverage of the Shada Al-Baha Reserve in 2018. This is due to several reasons, the most important of which is that Saudi Arabia has initiated significant initiatives. The initiatives include modifications in land use and vegetation as the government executed exhaustive domestic development 30 years ago (Alqurashi and Kumar, 2014).
Vegetation decreases with increasing distance from streams is because of water availability near the streams. This is consistent with previous studies conducted in arid and semi-arid regions (Shaw and Cooper, 2008), where water availability significantly influences vegetation patterns. The exception observed in zones 4 and 6, where NDVI appeared independent of stream proximity, is particularly intriguing. It suggests that topographical features, play a more significant role in these zones. Stream channels significantly influence the distribution of plant species (Hupp and Osterkamp, 1985), yet they are often misunderstood due to a lack of detailed study and frequent overgeneralization (Manning et al., 2020). In this study field observations suggest that certain species are significantly associated with specific fluvial landforms.
The relationship between vegetation dynamics and temperature is crucial for comprehending current conditions and forecasting future developments (Lamchin et al., 2020). The consistent negative correlation between NDVI and temperature across different ecological zones is a critical observation in the Shada mountains. It supports the hypothesis that higher temperatures generally reduce vegetation density in semi-arid conditions (Duncan et al., 2019). The zone-specific responses to temperature changes are particularly noteworthy. For example, the pronounced sensitivity in zone 1 and similar trends in zone 2 underscore the vulnerability of semi-aquatic vegetation and potentially endemic species to rising temperatures. This finding contributes to the growing body of evidence highlighting the impact of temperature on biodiversity, particularly in sensitive and unique ecosystems like the Shada Mountains. Understanding the specific vulnerabilities of different zones to environmental stressors like temperature and water availability can guide targeted conservation strategies.
Zone 1, characterized by its arboreal diversity, showcases a strong positive NDVI trend among tree species such as Acacia ehrenbergiana, Acacia tortilis, Hyphaene thebaica, and Delonix elata from the Fabaceae and Arecaceae families, signaling healthy growth in riverbed habitats. Herbs and shrubs, including Bacopa monnieri and Calendula arvensis from the Plantaginaceae and Asteraceae families, respectively, show positive growth trends, suggesting good conditions for semi-aquatic herbs. Shrubs like Calotropis procera and Opuntia dellenii, along with undershrubs such as Solanum incanum and Nicotiana glauca, indicate ecological adaptability across different microhabitats. Grass species, exemplified by Hyparrhenia hirta, demonstrate a stable NDVI, reflecting the resilience of grasslands in maintaining ecological balance. These observations underscore the importance of continuous ecological monitoring and highlight the need for further research to understand the underlying causes of these positive trends and their implications for conservation.
In Zone 2, diverse species from families like Fabaceae, Moraceae, and Malvaceae, including Acacia asak, Ficus vasta, and Grewia tembensis, alongside endemic and endangered species such as Acacia abyssinica, Adenium obesum, and Ochna inermis, underscore the area’s rich biodiversity. Trees in this zone exhibit positive NDVI trends between 0.2 and 0.35, with endemic and endangered trees showing a mean NDVI slope of 0.00102, indicating a flourishing tree community essential for conservation. Herbs and shrubs, with NDVI values from 0.1 to 0.2, display significant positive trends, highlighting the resilience of species like Kickxia pseudoscoparia and Plectranthus asirensis, and shrubs such as Barleria bispinosa and Ehretia obtusifolia. This vitality is crucial for the ecosystem’s structure. Undershrubs like Indigofera trita subsp. subulata and Commicarpus ambiguus, showing diverse adaptive strategies with a mean NDVI slope of 0.000670, and grasses, with a slight but significant increase in NDVI (Sen’s Slope of 0.000352), suggest a positive shift in grassland health.
In Zone 3, trees like Acacia asak, Acacia abyssinica, and Acacia etbaica show dense growth with NDVI ranges from 0.2 to 0.35, indicating healthy canopies. Their mean NDVI slope is notably high (0.00104), reflecting strong vegetation health, especially in lower areas and on rocky slopes, with high reliability (0.238 probability). Herbaceous plants, such as Portulaca kermisiana, exhibit a slight NDVI increase (0.000505), suggesting adaptation to varied habitats with a reliable trend (0.239 probability). Shrubs, including Barleria bispinosa and A. obesum, show NDVI values of 0.15–0.2, with a positive slope (0.000765) indicating their potential growth in challenging conditions, supported by a 0.228 probability. Grasses like Cenchrus ciliaris, Setaria viridis, and H. hirta, with the lowest NDVI range (0–0.1), reveal a modest increase in health over time (Sen’s Slope of 0.000707), suggesting gradual improvements in photosynthetic activity. These diverse vegetation trends highlight the complex ecological dynamics in this zone, showcasing the resilience of tree, shrub, herb, and grass species to environmental changes. This robustness and gradual enhancement of grass species underline the ecological integrity and the need for continued research and conservation in Shada Mountain’s Protected Areas.
In Zone 4, trees like Acacia asak and Breonadia salicina exhibit a positive NDVI range of 0.2–0.4, with an increase in mean NDVI slope suggesting growing arboreal density. This positive trend implies the thriving of these species, likely due to conservation efforts. Shrubs and small trees, including Barbeya oleoides and Capparis tomentosa, show a stable NDVI of 0.15, with a slight increase indicating consistent density. Succulent shrubs such as A. obesum and succulents like Angolluma commutata also display stable or slightly positive trends. Climbing shrubs, represented by Sarcostemma arabicum, are presumed to have similar stability based on their structure. These findings in Zone 4 suggest a unique ecological balance, with a stable presence of shrubs and small trees alongside increasing tree density, highlighting the importance of understanding these dynamics for conservation and future research on vegetation response to environmental changes.
In the 5th zone, trees species like Ficus cordata subsp. salicifolia and Acacia asak, noted for dense canopies, show negative NDVI trend, hinting at climate change effects. This reduction in tree cover risks biodiversity and habitat quality. Grass species like C. ciliaris, experiencing similar declines, may suffer from land use changes, degradation, or overlooked seasonal impacts. Despite some shrubs and small trees, such as Indigofera spinosa and B. oleoides, showing stable or positive NDVI trends, the overall health of shrub ecosystems may still be declining. Succulents and climbers like A. obesum and S. arabicum, adapted to aridity, face long-term declines due to ecological stresses. The overall negative NDVI trend across plant types in Zone 5 calls for detailed research into causes and countermeasures, essential for the area’s biodiversity and ecological management.
In the 6th zone up to 2000 AMSL, dense vegetation is evidenced by higher NDVI values, with shrubs like Dodonaea angustifolia and trees such as Olea europaea indicating positive change. This trend, suggesting improved plant health, is vital for regional ecological balance and biodiversity. Higher elevations (2001–2,200 m) show similar positive NDVI patterns for Juniperus procera and O. europaea, implying strong tree health and potential growth. At the highest elevations (2,201–2,215 m), sub-shrubs and grasses like Alyssum desertorum and Themeda triandra also display positive NDVI trends. These findings across different elevations in Zone 6 signify positive ecological shifts, emphasizing the importance of ongoing monitoring and research to safeguard biodiversity and manage environmental conservation effectively.
The study faced several limitations, including technical challenges associated with handling the 16-bit radiometric resolution of Landsat 8 and 9 imageries, as opposed to the 8-bit resolution of earlier Landsat images. This difference in image resolution required careful calibration to ensure consistency across datasets. Additionally, the limited body of literature on Shada Mountain’s ecology and the difficult terrain complicated the comprehensive field survey efforts, potentially affecting the granularity of the analysis.
The practical implications of this study are particularly significant given the sparse green areas within Saudi Arabia. The Shada Mountain region represents a critical area of vegetation, making the conservation of its forests and significant plant species, especially in Zone 5, essential for sustainable development. These ecosystems not only support biodiversity but also offer ecological services that contribute to the wellbeing of local communities.
Given these considerations, we recommend that the area be managed with heightened care to minimize human activities that adversely affect vegetation cover. This includes implementing strategies to control invasive plant species, conducting reforestation with native flora, promoting rainwater harvesting to enhance water availability, and constructing terraces to prevent soil erosion and facilitate plant growth. These actions are aimed at preserving the unique ecological characteristics of Shada Mountain and ensuring the longevity and resilience of its natural habitats.
This study boarded on a comprehensive investigation of vegetation dynamics within the Shada Mountain’s Protected Areas, using the analytical power of Google Earth Engine and R. This research is imperative as it contributes to the body of knowledge necessary for the preservation and sustainable management of these critical habitats. By examining the intricate relationships between vegetation patterns, stream proximity, land surface temperature, and topographical factors, this study provides insights that are instrumental for the development of targeted conservation strategies and sustainable development plans in the region.
Key findings from this research include:
• A discernible negative correlation between vegetation density and proximity to streams in lower elevation areas, suggesting that water availability significantly influences vegetation health in these regions. Conversely, this relationship appears negligible in higher elevations, indicating different ecological dynamics at play.
• A generally negative association between land surface temperature and vegetation across different ecological zones, underscoring the potential impacts of climate change on regional vegetation health and distribution.
• A notable increase in vegetation on the windward sides of mountains with medium slopes (15–45°), highlighting the influence of microclimatic conditions on vegetation patterns.
• An overall rise in vegetation coverage across most zones, with the exception of zone 5, pointing towards varying environmental and human factors influencing these areas.
These findings elucidate the multifaceted interactions between environmental factors and vegetation. The utilization of advanced remote sensing techniques and statistical analyses has allowed for a more nuanced understanding of these dynamics. The implications of this research extend beyond academic circles, providing practical insights for environmentalists, policymakers, and local communities engaged in the conservation and sustainable development of Shada Mountain’s Protected Areas. Furthermore, this study sets a precedent for future research in similar ecological settings, highlighting the importance of integrated approaches to environmental monitoring and management.
The original contributions presented in the study are included in the article/Supplementary material, further inquiries can be directed to the corresponding author.
HA-H: Conceptualization, Data curation, Investigation, Visualization, Writing–review and editing. AA: Conceptualization, Data curation, Investigation, Visualization, Supervision, Writing–review and editing. ZI: Data curation, Formal Analysis, Methodology Writing–original draft, Software, Validation, Writing–review and editing. HG: Data curation, Resources, Writing–review and editing.
The author(s) declare that financial support was received for the research, authorship, and/or publication of this article. This research was funded by the Deanship of Scientific Research, King Saud University, through Vice Deanship of Scientific Research Chairs: Chair of Climate Change, Environmental Development and Vegetation Cover.
The authors are grateful to the Deanship of Scientific Research, King Saud University for funding through Vice Deanship of Scientific Research Chairs: Chair of Climate Change, Environmental Development and Vegetation Cover.
The authors declare that the research was conducted in the absence of any commercial or financial relationships that could be construed as a potential conflict of interest.
All claims expressed in this article are solely those of the authors and do not necessarily represent those of their affiliated organizations, or those of the publisher, the editors and the reviewers. Any product that may be evaluated in this article, or claim that may be made by its manufacturer, is not guaranteed or endorsed by the publisher.
NDVI, Normalized Difference Vegetation Index; LST, Land Surface Temperature; GEE, Google Earth Engine; NIR, Near-Infrared; RED, Red Band (Spectral Band); USGS, United States Geological Survey; TM, Thematic Mapper (for Landsat 5); ETM+, Enhanced Thematic Mapper Plus (for Landsat 7); OLI, Operational Land Imager (for Landsat 8 and 9); QA_PIXEL, Quality Assurance Pixel (used for cloud and shadow detection); FVC, Fractional Vegetation Cover; DN, Digital Number (raw satellite data).
Abbas, A. M., Al-Kahtani, M. A., Alfaifi, M. Y., Elbehairi, S. E. I., and Badry, M. O. (2020). Floristic diversity and phytogeography of Jabal Fayfa: a subtropical dry zone, south-west Saudi Arabia. Diversity 12 (9), 345. doi:10.3390/d12090345
Abdulmnam Samakie (2020). Shada Mountain reserve | archiqoo. Archiqoo.com. Available at: https://archiqoo.com/categories/nature_reserves_sub_lists.php?subsite=shada_mountain_reserve.
Alaklabi, A., Al-Khulaidi, A. W., Hussain, A., and Al-Sagheer, N. A. (2016). Main vegetation types and plant species diversity along an altitudinal gradient of Al Baha region, Saudi Arabia. Saudi J. Biol. Sci. 23 (6), 687–697. doi:10.1016/j.sjbs.2016.02.007
Alavi, N., and King, D. (2020). Evaluating the relationships of inter-annual farmland vegetation dynamics with biodiversity using multi-spatial and multi-temporal remote sensing data. Remote Sens. 12, 1479. doi:10.3390/rs12091479
Aliihsan Sekertekin, , and Bonafoni, S. (2020). Land surface temperature retrieval from Landsat 5, 7, and 8 over rural areas: assessment of different retrieval algorithms and emissivity models and toolbox implementation. Remote Sens. 12, 294. doi:10.3390/rs12020294
Al-Mansi, A. M., Sambas, A. Z., Abukaboos, B. A., Al Zahrani, A. H., Abdulaziz, A. S., Almasabi, A. A., et al. (2021). Satellite tracking of post-nesting green sea turtles (Chelonia mydas) from ras baridi, red sea. Front. Mar. Sci. 8, 758592. doi:10.3389/fmars.2021.758592
Al-Namazi, A. A., Saeed Algarni, J., Mosallam, A., and Alotaibi, F. S. (2022). Floristic composition of Jandaf Mountain as biodiversity hotspot area in southwestern Saudi Arabia. Saudi J. Biol. Sci. 29 (5), 3654–3660. doi:10.1016/j.sjbs.2022.03.003
Alqurashi, A. F., and Kumar, L. (2014). Land use and land cover change detection in the Saudi arabian desert cities of makkah and Al-taif using satellite data. Adv. Remote Sens. 3 (3), 106–119. doi:10.4236/ars.2014.33009
Alqurashi, A. F., and Kumar, L. (2019). An assessment of the impact of urbanization and land use changes in the fast-growing cities of Saudi Arabia. Geocarto Int. 34 (1), 78–97. doi:10.1080/10106049.2017.1367423
Al-Robai, S. A. (2023). Ecology and diversity of angiosperm parasites and their host plants along elevation gradient in Al-Baha region, Saudi Arabia. Diversity 15, 1065. doi:10.3390/d15101065
Bindajam, A. A., Mallick, J., AlQadhi, S., Singh, C. K., and Hang, H. T. (2020). Impacts of vegetation and topography on land surface temperature variability over the semi-arid mountain cities of Saudi Arabia. Atmosphere 11, 762. doi:10.3390/atmos11070762
Duncan, J. M. A., Boruff, B., Saunders, A., Sun, Q., Hurley, J., and Amati, M. (2019). Turning down the heat: an enhanced understanding of the relationship between urban vegetation and surface temperature at the city scale. Sci. Total Environ. 656, 118–128. doi:10.1016/j.scitotenv.2018.11.223
El-Ghanim, W. M., Hassan, L. M., Galal, T. M., and Badr, A. (2010). Floristic composition and vegetation analysis in Hail region north of central Saudi Arabia. Saudi J. Biol. Sci. 17 (2), 119–128. doi:10.1016/j.sjbs.2010.02.004
El-Seedi, H. R., Kotb, S. M., Musharraf, S. G., Shehata, A. A., Guo, Z., Alsharif, S. M., et al. (2022). Saudi arabian plants: a powerful weapon against a plethora of diseases. Plants 11, 3436. doi:10.3390/plants11243436
Ermida, S. L., Soares, P., Mantas, V., Göttsche, F.-M., and Trigo, I. F. (2020). Google earth engine open-source code for land surface temperature estimation from the Landsat series. Remote Sens. 12, 1471. doi:10.3390/rs12091471
FAO. (2021). Food and Agriculture Organization of the United Nations. https://www.fao.org/countryprofiles/index/en/?iso3=SAU
Ghazal, A. M. F. (2015). Vegetation patterns and plant communities distribution along an altitudinal gradient at Asir Mountain, southwest Saudi Arabia. Pak. J. Bot. 47 (4), 1377–1389. .
Hachem, S., Duguay, C. R., and Allard, M. (2012). Comparison of MODIS-derived land surface temperatures with ground surface and air temperature measurements in continuous permafrost terrain. Cryosphere 6 (1), 51–69. doi:10.5194/tc-6-51-2012
Hupp, C. R., and Osterkamp, W. R. (1985). Bottomland vegetation distribution along passage creek, Virginia, in relation to fluvial landforms. Ecology 66 (3), 670–681. doi:10.2307/1940528
Lamchin, M., Wang, S. W., Lim, C. H., Ochir, A., Pavel, U., Gebru, B. M., et al. (2020). Understanding global spatio-temporal trends and the relationship between vegetation greenness and climate factors by land cover during 1982–2014. Glob. Ecol. Conservation 24, e01299. doi:10.1016/j.gecco.2020.e01299
Landsat Collections in Earth Engine (2024). Google for developers. Available at: https://developers.google.com/earth-engine/datasets/catalog/landsat.
Manning, A., Julian, J. P., and Doyle, M. W. (2020). Riparian vegetation as an indicator of stream channel presence and connectivity in arid environments. J. Arid Environ. 178, 104167. doi:10.1016/j.jaridenv.2020.104167
Pecl, G. T., Araújo, M. B., Bell, J. D., Blanchard, J., Bonebrake, T. C., Chen, I. C., et al. (2017). Biodiversity redistribution under climate change: impacts on ecosystems and human well-being. Science 355 (6332), eaai9214. doi:10.1126/science.aai9214
Piccolo, C. (2024). Wildlife in Saudi Arabia. Available at: https://www.hziegler.com/articles/wildlife-in-saudi-arabia.html.
Protected Areas (2021). Ncw.gov.sa. Available at: https://www.ncw.gov.sa/en/centers.html.
Saudi Arabia Forest Information and Data (2024). Worldrainforests.com. Available at: https://worldrainforests.com/deforestation/2000/Saudi_Arabia.htm#:∼:text=According%20to%20the%20U.N.,carbon%20in%20living%20forest%20biomass.
Saudi Vision (2024). Vision2030.Gov.sa. Available at: https://www.vision2030.gov.sa/en/.
Shaw, J. R., and Cooper, D. J. (2008). Linkages among watersheds, stream reaches, and riparian vegetation in dryland ephemeral stream networks. J. Hydrology 350 (1-2), 68–82. doi:10.1016/j.jhydrol.2007.11.030
Shi, Z., Bai, Z., Guo, D., Li, S., and Chen, M. (2023). Species diversity and soil interconstraints exert significant influences on plant survival during ecological restoration in semi-arid mining areas. Diversity 15, 1100. doi:10.3390/d15101100
Soria, J. M., Molner, J. V., Pérez-González, R., Alvado, B., Vera-Herrera, L., and Romo, S. (2024). Monitoring the extraordinary ephemeral emergence of Myriophyllum spicatum L. In the coastal lagoon albufera of valencia (Spain) and assessing the impact of environmental variables using a remote sensing approach. J. Mar. Sci. Eng. 12, 260. doi:10.3390/jmse12020260
Tarawneh, Q. Y., and Chowdhury, S. (2018). Trends of climate change in Saudi Arabia: implications on water Resources. Climate 6, 8. doi:10.3390/cli6010008
Thomas, J., El-Sheikh, M. A., and Alatar, A. A. (2016). Endemics and endangered species in the biodiversity hotspot of the Shada Mountains, Saudi Arabia. J. Arid Land 9 (1), 109–121. doi:10.1007/s40333-016-0025-8
Tian, F., Lü, Y. H., Fu, B. J., Yang, Y. H., Qiu, G., Zang, C., et al. (2016). Effects of ecological engineering on water balance under two different vegetation scenarios in the Qilian Mountain, northwestern China. J. Hydrology Regional Stud. 5, 324–335. doi:10.1016/j.ejrh.2015.11.015
UNESCO (2018). Bioclimatic refugia of western Arabia - UNESCO world heritage centre. Available at: https://whc.unesco.org/en/tentativelists/6638/.
Valjarević, A., Algarni, S., Morar, C., Grama, V., Stupariu, M., Tiba, A., et al. (2023). The coastal fog and ecological balance for plants in the Jizan region, Saudi Arabia. Saudi J. Biol. Sci. 30 (1), 103494. doi:10.1016/j.sjbs.2022.103494
Wang, L., Zhuo, W., Pei, Z., Tong, X., Han, W., and Fang, S. (2021). Using long-term earth observation data to reveal the factors contributing to the early 2020 desert locust upsurge and the resulting vegetation loss. Remote Sens. 13, 680. doi:10.3390/rs13040680
World Rainforests (2010). Deforestation in Saudi Arabia. Available at: https://worldrainforests.com/deforestation/2000/Saudi_Arabia.htm.
Keywords: NDVI, LST, trend analysis, Sen’s slope, plants species, protected areas
Citation: Al-Harbi HF, Alhuqail AA, Islam Z and Ghrefat H (2024) Vegetation trends and dynamics in Shada Mountain, Saudi Arabia, (1984–2023): insights from Google Earth Engine and R analysis. Front. Environ. Sci. 12:1397825. doi: 10.3389/fenvs.2024.1397825
Received: 08 March 2024; Accepted: 30 April 2024;
Published: 15 May 2024.
Edited by:
Sawaid Abbas, University of the Punjab, PakistanReviewed by:
Aleksandar Valjarević, University of Belgrade, SerbiaCopyright © 2024 Al-Harbi, Alhuqail, Islam and Ghrefat. This is an open-access article distributed under the terms of the Creative Commons Attribution License (CC BY). The use, distribution or reproduction in other forums is permitted, provided the original author(s) and the copyright owner(s) are credited and that the original publication in this journal is cited, in accordance with accepted academic practice. No use, distribution or reproduction is permitted which does not comply with these terms.
*Correspondence: Zubairul Islam, enViYWlydWxAZ21haWwuY29t
Disclaimer: All claims expressed in this article are solely those of the authors and do not necessarily represent those of their affiliated organizations, or those of the publisher, the editors and the reviewers. Any product that may be evaluated in this article or claim that may be made by its manufacturer is not guaranteed or endorsed by the publisher.
Research integrity at Frontiers
Learn more about the work of our research integrity team to safeguard the quality of each article we publish.