 Basanta Kumar Das*
 Ajoy Saha
 Archan Kanti DasPurna ChandraKausik MondalTania KayalSangeeta Chakraborty
 Shreya Bhattacharya
 Bigan Kumar Sahoo
 Chayna Jana
- Central Inland Fisheries Research Institute (ICAR), Kolkata, West Bengal, India
Introduction: Bottom sediments play a pivotal role in wetland productivity, and here, eight Gangetic floodplain wetlands of India were studied to assess the sediment physicochemical characteristics and textural analysis.
Methods: Sediment samples that were collected from each wetland in monsoon and non-monsoon seasons were analysed. ANOVA, Principal component analysis and multiple correlation analysis were used for statistical analysis.
Results and Discussion: Throughout the study period, pH (6.90–8.04), EC (0.20–1.64 dS/m), CaCO3 (1.75%–14.50%), available nitrogen (10.22–22.23 mg/100 g sediment), total nitrogen (80.4–333.8 mg/100 g sediment), available phosphorus (0.20–5.61 mg/100 g sediment), and total phosphorus (19.63–173.33 mg/100 g sediment) were recorded. The sediment quality parameters differ significantly (p > 0.05) among the wetlands. Seasonal variation was only observed on total nitrogen and total phosphorus contents. Sediments were dominated by sand. Sediment nutrient (C, N, and P) stoichiometry of wetlands depicted a comparatively little higher C/P (5.96–66.32) ratio and lower C/N (3.34–22.76) and N/P (1.12–9.25) ratios, which revealed that the physicochemical characteristics of the sediments are influenced by anthropogenic sources. Principal component analysis showed the influence of both natural and anthropogenic causes on wetland ecosystems. The geographic information system (GIS) interpolation approach was used in combination with laboratory analysis methods to give a complete spatial resolution of the sediment quality of each wetland. The study suggests that these wetlands’ sediment quality is favorable for fish culture but requires proper management practices to achieve sustainable production. As it is the first time where monitoring physicochemical properties of sediments of these wetlands are presented, this study can be used as a baseline data for comparison in future environmental assessments of the wetlands.
1 Introduction
Wetlands are the transient aquatic ecosystems between terrestrial and aquatic environments (Byomkesh et al., 2009). Due to this unique characteristic, they provide multiple ecosystem services through various goods and services like irrigation and drinking water (Belyaev et al., 2022), food crops (Ayyad et al., 2022), fisheries (Sarkar and Borah, 2018), timber and non-timber products (Datta and Kumar Ghosh, 2015), regulation and control of soil erosion and flood (Pal and Paul, 2020), nutrient cycling (Wolf et al., 2013), attenuated nutrient runoff (Mitsch and Gosselink, 1993), carbon sequestration (Nag et al., 2023), microclimate regulation (Simioni et al., 2017), groundwater recharge (Acharya and Barbier, 2000), and wastewater treatment (Brinson et al., 1984), ensuring livelihood security (Borah et al., 2022), and, most importantly, conservation of biodiversity (Kuiper et al., 2014). In addition, they have recreational, spiritual, and esthetic values, and it is a life support system for the human mass, particularly rural populations (Sarkar and Karnatak, 2016). Wetlands constitute approximately 12 million square kilometers of the earth’s surface and are home to 40% of the world’s species diversity (Ramsar Convention on Wetlands, 2018). Wetland constitutes approximately 15 million ha area of India, of which 69% comprises inland wetlands, followed by coastal wetlands (27%) and others (4%) (SAC, 2011). The state of West Bengal of India comprises 42,082 ha area of floodplain wetland, of which 50% is under culture-based fisheries activities (DoF West Bengal, 2016). Due to rich sources of biodiversity, millions of rural people of West Bengal are engaged in earning their livelihood in the floodplain wetlands of river Ganga and its tributaries/distributaries’ interfluves for hundreds of years (Debanshi and Pal, 2023). Along with culture-based fisheries, these floodplain wetlands are also used for aquaculture practice (Sarkar et al., 2020) to cope up with the other fastest growing aquaculture practices in India. Thus, it has potential in creating jobs, reducing poverty, mitigating malnutrition, and, more importantly, offering women an excellent chance for their social–economic improvement (Sarkar et al., 2020). However, siltation, loss of river connectivity, increasing population growth, industrialization, and other anthropogenic activities like the release of effluents from sewage and agricultural runoff lead to the destruction of aquatic and fisheries resources of wetlands (Álvarez-Cobelas et al., 2010; Saha and Pal, 2019).
Sediment is one of the most active components of nutrient biogeochemistry (Jiménez-Ballesta et al., 2017; Jiménez-Ballesta et al., 2018; Diodato et al., 2020), and it also acts as a source of nutrient enrichment in overlying water. Hence, Kumary et al. (2007) suggested that the environmental health of any aquatic body can be measured more reliably through the analysis of the sediment quality parameters. Moreover, the current input of the status of water may not provide relevant information about the long-term behavior of the sediment and water, which can only be possible through sediment sample analysis (Haslam, 1990; Jiménez-Ballesta et al., 2017; Jiménez-Ballesta et al., 2018). Because the sediment is a repository of aquatic life’s functional and biological processes, a thorough assessment is required (Saha et al., 2020). Furthermore, for developing a possible restoration solution to wetlands and understanding the process of changes occurring in the wetland ecosystem over time, it is crucial to assess the physicochemical component of wetland sediment (Newman and Pietro, 2001; Aslam et al., 2023). By degradation of organic matter, sediment helps in nutrient cycling (Hopkinson et al., 1999; Braskerud, 2002; Craft et al., 2018), thus eventually enhancing the biological activity (Cao et al., 2015) in the natural medium and supporting plant growth. In addition to nutrient content analysis, it is more important to study the nutrient stoichiometry (elemental ratio of C, N, and P), which helps in understanding the limitation and repercussions of mass balance of multiple chemical elements in the ecological functioning/interaction (Cao et al., 2015). Nutrient stoichiometric determination in wetland sediment is critical since it helps in establishing comprehensive strategies to develop programs for evaluating the level of anthropogenic stresses.
Since sediment quality analysis is crucial for the aquatic ecosystem, studies have been carried out in several aquatic bodies like lakes (Upadhyay et al., 2012), reservoirs (Merina et al., 2019), rivers (Kumari and Paul, 2019; Saha et al., 2020), channels (Mandol et al., 2023), estuaries (Ramachandra et al., 1984; Saha et al., 2023), and aquaculture ponds (Karmakar et al., 2022). However, despite the importance of wetlands in uplifting poor communities, studies are lacking on the dynamics of the nutrients and physical features of wetland sediment. Investigation of the sediment’s physical and chemical characteristics from a wetland facilitates the management of the wetland and similar water bodies (Fisher and Acreman, 2004). It also provides baseline data for further studies. Unfortunately, limited research has been conducted on the sediment quality of these wetlands. In addition, any thorough sediment quality study for these wetland sediments in the recent past is not available. Although water quality monitoring at some of the wetlands has started, it is not sufficient to manage the ecosystem. In addition to water quality monitoring, monitoring the sediment quality is becoming increasingly important for evaluating the environmental quality of the aquatic ecosystem. The environmental quality of the water and the associated components of an aquatic ecosystem cannot be evaluated without the study of the bottom sediment characteristics. No comprehensive information exists regarding the physicochemical characteristics of the sediments of these wetlands. Despite the importance of its ecosystem and the existence of birds, aquatic organisms, and plants, these wetlands have received little attention. Owing to the importance of floodplain wetlands in India, an initiative was taken to monitor the physicochemical characteristics of the sediment and their seasonal changes in eight wetlands located in West Bengal, India. With the limited data, remote sensing and GIS-based interpolation techniques can help in predicting the complete spatio-temporal variation in the physicochemical properties of the sediment of aquatic bodies. Hence, in this study, we have used the GIS technique to interpolate major nutrients parameters of sediments for their spatio-temporal representation (Nagalakshmi et al., 2016; Vasistha and Ganguly, 2022; Hussain et al., 2023). The present study aimed to determine the status of wetland sediment in terms of sediment nutrient content and their stoichiometry and relation with key sediment parameters. The findings of this investigation will generate a key database for future studies to understand the interplay between human activities and natural processes in these floodplain wetlands. Finally, the information will help in managing these rich and important water resources.
2 Materials and method
2.1 Study site and sampling protocol
As a consequence of the extremely meandering river channel and avulsion of the channel in the Ganga–Ichamati river system, several permanent and semi-permanent cut-offs, different shallow seasonal wetlands, and oxbow-lakes are formed in the deltaic region of West Bengal, India (Datta and Kumar Ghosh, 2015). Here, eight different floodplain wetlands, viz., Beledanga, Chamardaha, Chamta, Duma, Sindrani, and Panchita located in the North 24 Parganas district and Khalsi and Kumli in the Nadia district of West Bengal (Figures 1, 2; Table 1), were studied. These wetlands have a high ecological value since they are enriched in finfish, benthic biota, floating vegetation (weeds and important food plants), sedges, and reeds. They are also important for improving the livelihood of rural masses. In addition, these wetlands are habitats for a large number of avifaunal diversity (Mandal et al., 2022). All these wetlands receive allochthonous inputs, particularly in the rainy season, from agricultural runoff, jute retting, livestock rearing, and domestic effluent, but they are not receiving any industrial or city wastes. The studied wetlands are degrading daily due to agricultural washouts, human settlement, indiscriminate fishing, and other related developmental activities. Table 1 comprises the general information on the studied wetlands. The location and sampling sites of different wetlands are given in Figure 1. Samples were collected in monsoon (June–September) and non-monsoon months (November–February) during the year 2020 and 2021.
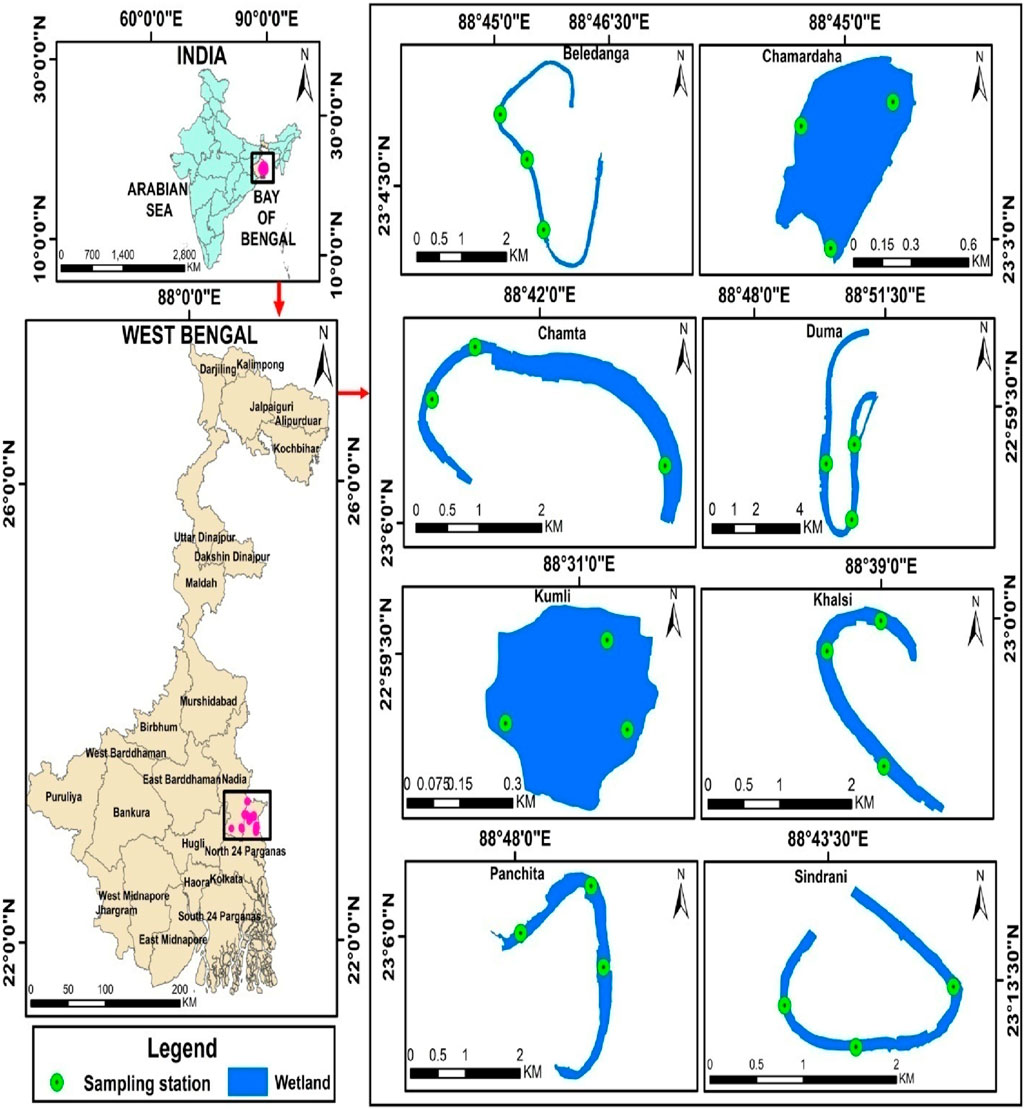
Figure 1. Map portraying the location of different floodplain wetlands in West Bengal, India, along with sampling sites.
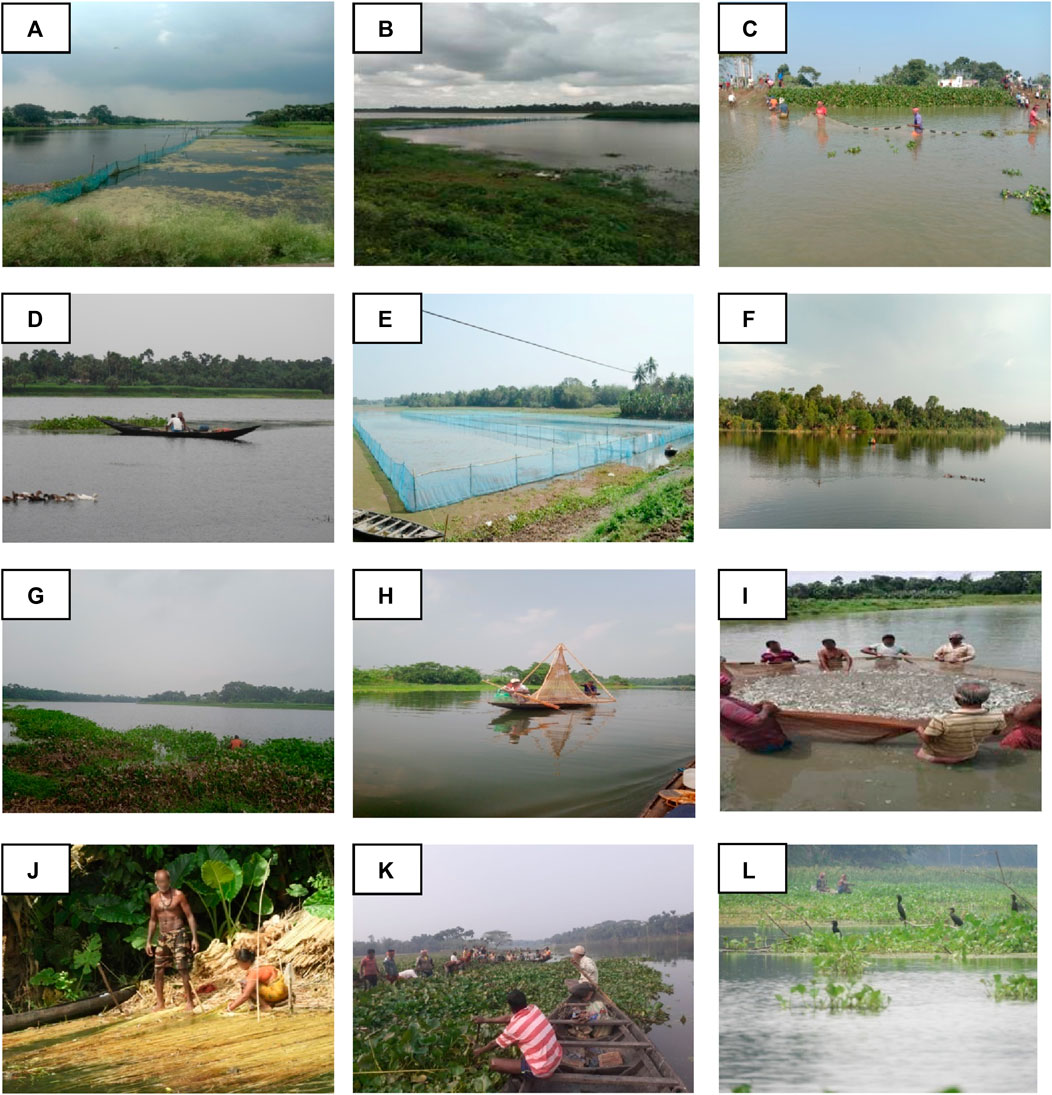
Figure 2. Scenic views of the studied wetlands. (A) Beledanga, (B) Chamardaha, (C) Kumli, (D) Panchita, (E) Chamta, (F) Khalsi, (G) Duma, (H) Sindrani, (I) fishing activities at Chamardaha wetland, (J) jute retting activities in the Beledanga wetland, (K) weed removal in the Beledanga wetland, and (L) avifauna assemblage in the Beledanga wetland.
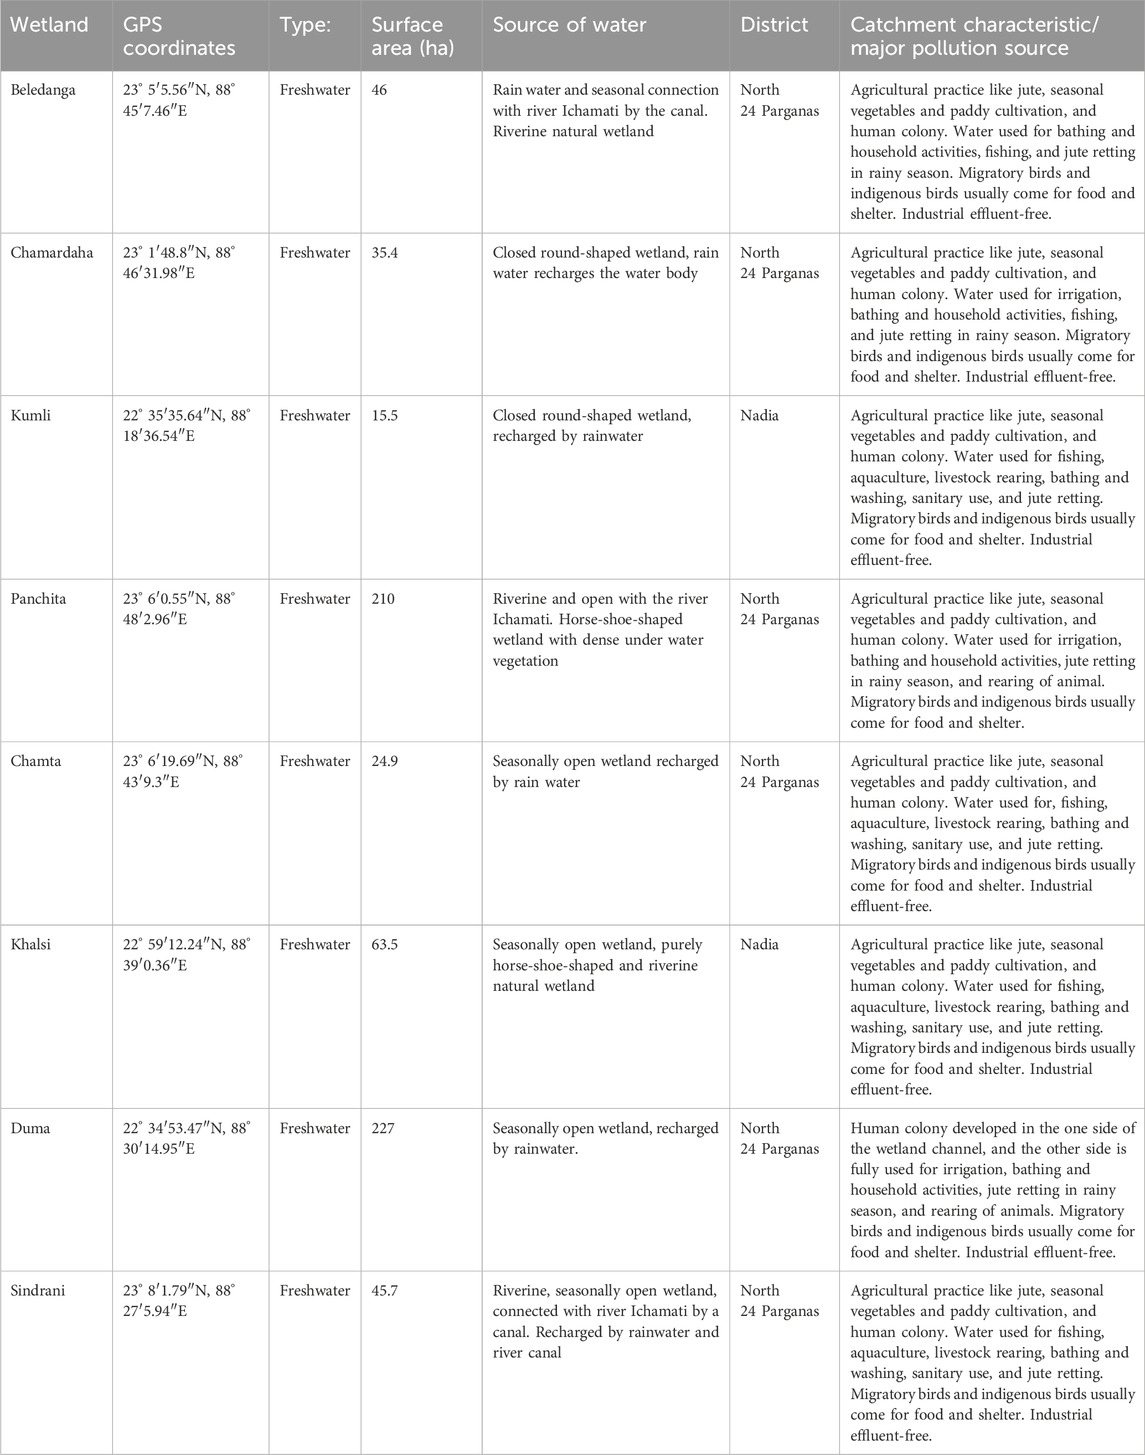
Table 1. Geographical location and other important details about the studied floodplain wetlands of West Bengal, India.
2.2 Bottom sediment sampling
Sampling locations in different wetlands were selected based on various characteristics such as water availability, the presence of aquatic plants, agricultural practices, and the anthropogenically vulnerable area. The sampling points were marked using a handheld GPS. Three sites were initially marked in each wetland to collect sediment samples, making 24 sampling sites per season. A Peterson grab sampler was used for sampling. Approximately 2.0 kg of the sediment sample was collected from each sampling site, sub-sampled, transferred to a polythene bag, and placed in an icebox before being transported to the laboratory. The collected samples were shade-dried, crushed, passed through a 2-mm sieve, re-packed in labeled polythene bags, and stored in an airtight bottle at 4°C before being used.
2.3 Physicochemical characterization of sediment samples
Sediment pH and electrical conductivity were estimated with the help of portable meters (Eutech) by mixing the sediment and water in a 1:2.5 ratio. The sediment–water mixture was agitated thoroughly and left to rest for half an hour before taking the readings [American Public Health Association (APHA, 2017)]. Calcium carbonate (% CaCO3) was determined by the titrimetric method (Jackson, 1967). Particle size analysis was determined using the hydrometer method, with sodium oxalate as the dispersing agent. Textural composition was determined based on the percentage occurrence of the three main sediment particles (sand, silt, and clay) using the triangular graph method.
The wet oxidation method (Walkley and Black, 1934) was used to determine the sediment organic carbon (SOC) content. For this, SOC was determined by potassium dichromate oxidation and titration of the remaining dichromate with ammonium ferrous sulfate. The alkaline-permanganate method was used to determine the available nitrogen in the sediment (Sahrawat and Burford, 1982). Available phosphorus in the sediment was extracted with 0.002 N H2SO4 (Millar et al., 1935) and measured by a molybdate-blue color method using a UV-vis-spectrophotometer at 880 nm. For the determination of total nitrogen, sediment samples were digested in a Kjeldahl digestion block using H2SO4 and a catalytic mixture (CuSO4:K2SO4 in a 1:5 ratio) at 420°C until the appearance of green color (Bremner, 1965). Following the digestion, the distillation of samples was carried out for 9 min. Finally, the samples were titrated with 0.1 (N) H2SO4 until color change, and the endpoint was recorded. For the estimation of total P, sediment samples (0.5 g) were sequentially digested with 40 mL of 30% H2O2 and a tri-acid mixture (HNO3:HClO4:H2SO4 in a 10:4:1 ratio) for two consecutive days; then, the digested samples were solubilized in water and filtered, and following filtration, total phosphorus was determined by the molybdate-blue color method. To ensure accurate results and reliability of the study, data were gathered using acceptable standard methods and procedures that are adequate, and proper quality control and quality assurance (QA/QC) measures were followed both at the field site and during the laboratory analysis. Samples from each site were analyzed in duplicates, and the mean values are represented.
2.4 Statistical analysis
To understand the nature of the observed data and the overall findings of the study, descriptive statistics were used (Table 2). The fluctuation of the sediment physicochemical properties with seasons and their variation among the wetlands was analyzed by a two-way ANOVA test. Pearson’s correlation analysis was carried out to determine the interrelationship among the various sediment physicochemical properties. Principal component analysis was used to determine the parameters that significantly influence the wetland sediment quality. In order to grouping, the sediment quality parameters and wetlands data were subjected to cluster analysis. Software package SPSS 20 was used for data analysis and to better understand the association of the parameters. Based on the USDA soil textural classification triangle, the sediment sand, silt, and clay content values were transformed into sediment textural class using the R package “soil texture” (Moeys, 2018).
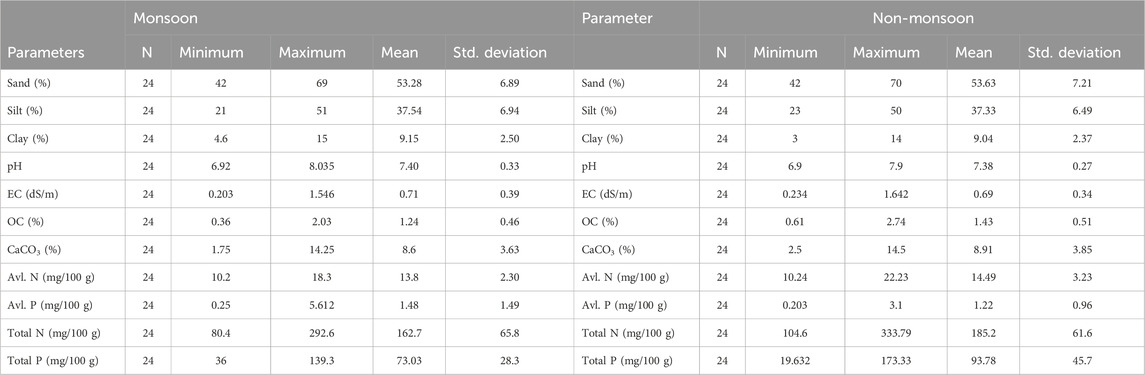
Table 2. Descriptive statistics of the physiochemical parameters of sediments in different seasons.
2.5 GIS data collection and processing
The GIS platform captured, stored, analyzed, and represented data with spatial references. This study digitized the outer boundaries of different wetlands using Google Earth Pro software. The digitized file was converted into a shape file in ESRI ArcGIS software. The GPS coordinates of the sampling sites in different wetlands were imported into ArcGIS. The study area map was prepared using ArcGIS software (9.3 versions). Maps were scanned and georeferenced to the Universal Transverse Mercator (UTM) projection system and WGS-1984 datum to Northern Hemisphere Zone 45. The spatial interpolation techniques were used to estimate the unknown values of a location using the known sampling point to find the spatial distribution of the bottom characteristics. From the geostatistical analysis tool in ArcGIS, the IDW (inverse distance weighted) interpolation method was used to represent the season-wise sediment parameters of different wetlands. IDW is a simple and intuitive method that requires no complex mathematical calculations. IDW performs well when the sample points are evenly distributed and the data are smooth. It can capture the local variability of the data and produce accurate interpolated values. The sediment sampling sites and the attribute data of different wetlands were used as input files for the IDW method. IDW interpolation assumes the value of the unknown points by calculating the distances between the measured points to the other points (Abdulwadood et al., 2021).
3 Results
3.1 Physicochemical properties of the surface sediment of the floodplain wetlands
The study parameters such as sediment pH, electrical conductivity (EC), CaCO3 content, sediment organic carbon (SOC), sediment nutrients (nitrogen and phosphorus), and sediment texture (sand, silt, and clay) and their fluctuations over the seasons in different wetlands were analyzed.
Sediment pH is an important parameter as, at a certain point of time, it indicates the biogeochemical process occurring in the wetland, which controls the primary productivity, respiration, mineralization, and organic matter decomposition (Oppenheimer et al., 1978; Saha, 2003; Sayeed et al., 2015), and thus, it influences the overall ecosystem health of the wetland. Anything either highly acidic or alkaline would kill aquatic life. Aquatic organisms are sensitive to pH changes and biological treatment; hence, it is important to control pH or its regular monitoring. The sediment pH of different wetlands was neutral to slightly alkaline (Tables 2, 3) with significant variations (Table 4). It varied from 6.92–8.04 with an average of 7.40 ± 0.33 during monsoon and 6.90–7.90 with an average of 7.38 ± 0.27 during non-monsoon season. The maximum average pH of 7.98 ± 0.07 was recorded at Khalsi during monsoon, and the minimum of 7.01 ± 0.10 was recorded at Kumli during non-monsoon season (Table 3). Therefore, the average sediment pH value of these wetlands is slightly acidic to alkaline in nature. Organic matter and organic carbon runoff from the catchment significantly influence the sediment pH.
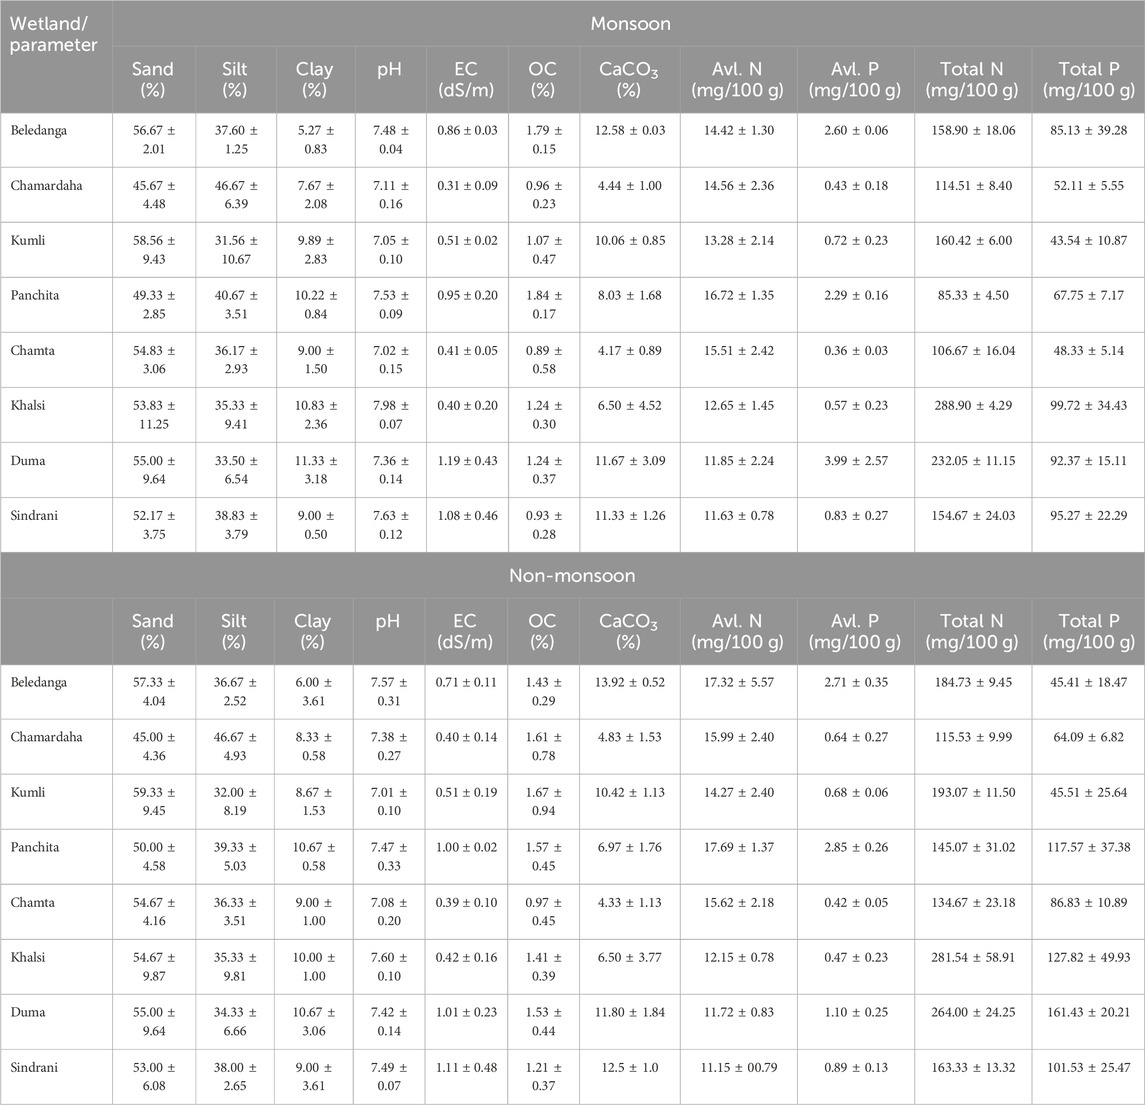
Table 3. Physicochemical parameters of sediments in different seasons.
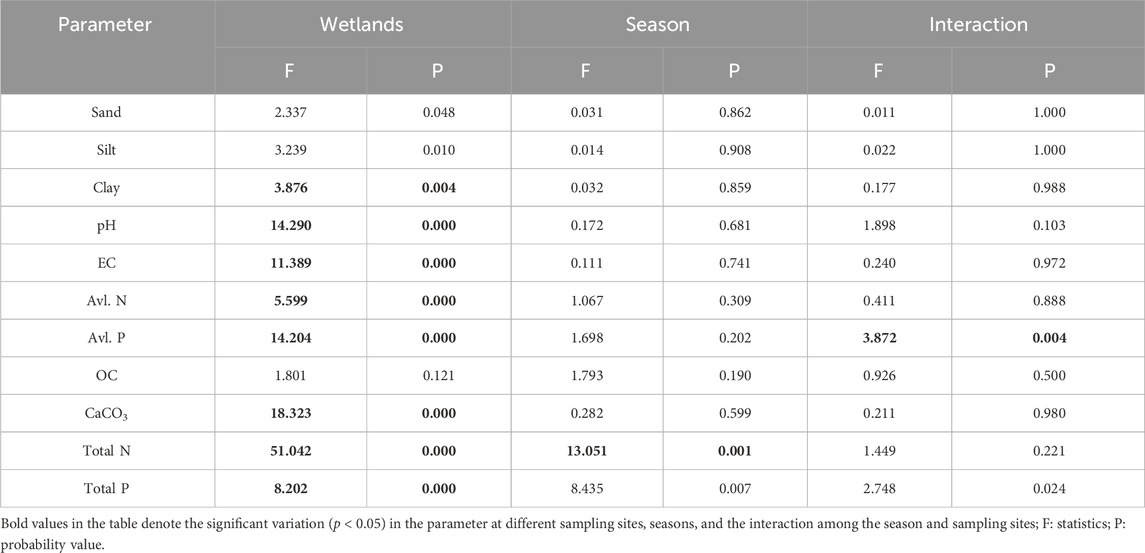
Table 4. Two-way ANOVA on individual sediment quality parameters among different wetlands during different seasons and their interaction.
Total salt load in a water body is measured through electrical conductivity (EC) (Delince, 1992), and thus, it provides important information about the dynamics of dissolved ions, salts, availability of nutrients, and, hence, the overall chemical make-up of the sediment and ecosystem functioning. The value of EC varied from 0.203–1.546 dS/m (average 0.715 ± 0.39 dS/m) in monsoon and 0.234–1.642 dS/m (average 0.693 ± 0.343 dS/m) in non-monsoon season. The highest mean EC value was at the Duma wetland during monsoon (Table 3), while the lowest was at Chamardaha during non-monsoon season. The content of CaCO3 in the sediment indicates the provenance and dispersal of terrigenous material (Ilayaraja and Krishnamurthy, 2010). Other than pollution, this is an important factor that influences the distribution of metals in sediments (Windom et al., 1989). The mean CaCO3 concentration ranged from 1.75% to 14.25% during monsoon and 2.5%–14.5% during non-monsoon season (Table 3). The highest mean CaCO3 content was 13.92% in Beledanga during the non-monsoon season, and the lowest was 4.2% in the Chamta wetland during the monsoon season. Results revealed that the sediment with higher sand percentage contains more CaCO3. The broken shell fragments in sandy sediment might have contributed more CaCO3 to the sediment (Saha et al., 2023). The content of CaCO3 varied significantly among the wetlands (Table 4). The variation in the sediment CaCO3 content may be due to the dilution of it with buried organic matter since CaCO3 has an inverse relation with the sediment organic matter content (Zhang et al., 2004). Nevertheless, this type of association was not observed here. Gaspar et al. (2013) also found a positive association between the carbonate content and organic matter. Furthermore, the CaCO3 content in most studied wetlands indicates that the wetland sediment supports biogenic activity (Jonathan et al., 2004).
Sediment is a product that results from erosion processes where soil disintegrates into sand, silt, clay, and organic matter, which, upon transport, settles in water bodies (Aslam et al., 2023). Sediment deposition is quite evident in water bodies, and it is known to be composed of many combinations of different particle classes that range from fine to coarse material. In this regard, textural analysis is arguably an important procedure that helps us clearly understand the provenance of sediment transport history and depositional environments. Sediment grain size distribution is the proportional composition of sand, silt, and clay based on the size of the particles, and it has various uses in geology and archeology. Clay particles are the smallest in size. This fraction, along with the organic matter contents of the sediment, influences the water-holding capacity, exchange of nutrients, and fertility status of the soil (Kome et al., 2019). Sand and silt particles are not very important from the nutritional point of view but perform a significant role in gas exchange and nutrient movement through the sediment phase to the solution phase by providing the required passage (Hamamoto et al., 2009).
The mean sand, silt, and clay contents were recorded as 53.3 ± 4.2%, 37.5 ± 4.7%, and 9.2% ± 1.95%, respectively, in monsoon season, and the corresponding values during the non-monsoon season were 53.6 ± 4.4, 37.3 ± 4.4, and 9.0% ± 1.5%, respectively (Table 3; Figure 3). The maximum concentration of sand was recorded at Kumli wetland (59.3%), and the minimum was recorded at Chamrdaha (45.0%), both in the non-monsoon season. Furthermore, the highest amount of silt (46.67%) was recorded at Chamrdaha wetland in both seasons, and the lowest (31.56%) was recorded at Kumli wetland during the monsoon season. Likewise, the highest value of clay was recorded at Duma wetland (11.3%), and the least was found at Beledanga wetland (5.27%). In the present investigation, Chamardaha and Panchita wetland sediments were loam in nature in both seasons. However, the sediment of Kumli wetland was sandy clay loam in nature during the non-monsoon season. Other than these wetlands, all the other wetland sediment texture was sandy loam in nature in both seasons, indicating the sediment’s suitability for fish culture.
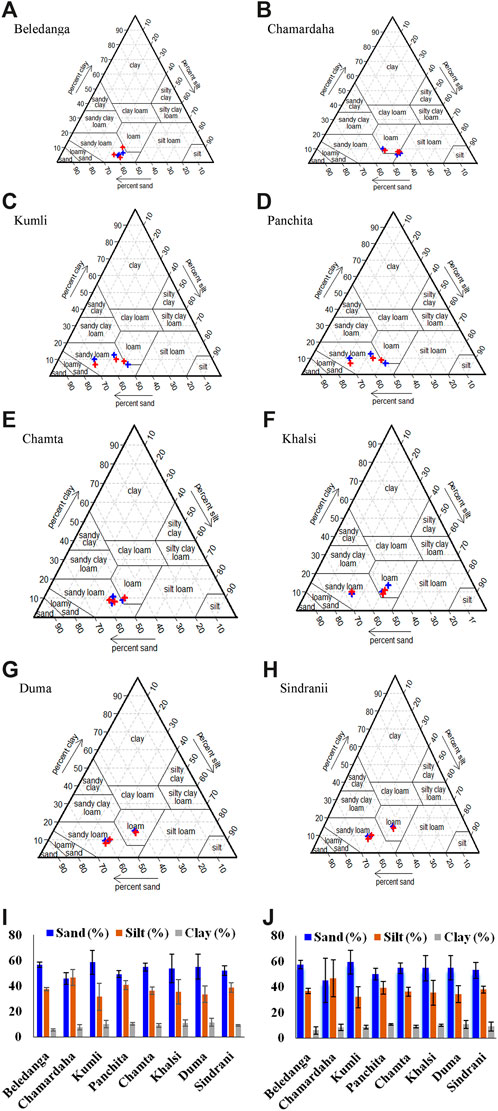
Figure 3. Ternary diagram showing sediment grain size distribution (A–H) along with histogram of % grain size content of studied wetlands during monsoon (I) and (J) non-monsoon periods. Ternary plot monsoon and non-monsoon samples are represented in blue and red colours, respectively.
Sediment is the main basis of carbon sequestration in wetland ecosystems and plays a vital role worldwide for carbon sequestration. Sediment organic carbon (SOC) has potential significance for wetland productivity, overlying water fertility status and eutrophication status (Alagarsamy, 1991). SOC content also indicates the pollution status of aquatic ecosystems as it is directly associated with organic pollution (Carroll et al., 2003). The SOC content influences sediment physicochemical and biological productivity and improves sediment physical conditions like water holding capacity, porosity, etc. (Das, 2015; Karmakar et al., 2022). This also influences the nutrient availability through various biogeochemical activities, thus maintaining long-term wetland productivity (Karmakar et al., 2022) and acting as a constant food source for benthic-feeding fishes and invertebrates. Hence, it is a reliable indicator for nutrient cycling and water productivity. Due to autochthonous and allochthonous material accumulation, a floodplain wetland contains more organic matter than terrestrial systems (Hupp et al., 2019). Spatio-temporal variations in SOC (%) at different wetlands are shown in Figure 4. The concentration of SOC (%) varied among the wetlands from 0.36%–2.03% (1.24% ± 0.46%) and 0.61%–2.74% (1.43% ± 0.51%) in monsoon and non-monsoon seasons, respectively (Table 3; Figure 3). The mean SOC in non-monsoon was 1.43%, while it was 1.25% in monsoon. This difference was non-significant (Table 4), which may be due to the absence of any industrial or city waste inflow having variability in its content. The slightly lower value of OC content in the rainy season may be associated with flooding. The comparative rise of OC content in non-monsoon seasons may be due to the gradual accumulation of organic matter from the terrestrial system during the monsoon period (Mandol et al., 2023; Saha et al., 2023). This may also be due to the organic debris generated through the decomposition of leaves, roots, dead aquatic wetland macrophytes, and animals. During the monsoon season, the highest mean value of OC was recorded from Panchita (1.84%) wetland, whereas Chamta wetland showed the lowest SOC values (0.89%). During the non-monsoon season, SOC was found highest in Kumli (1.67%) and lowest in Chamta (0.97%) wetland.
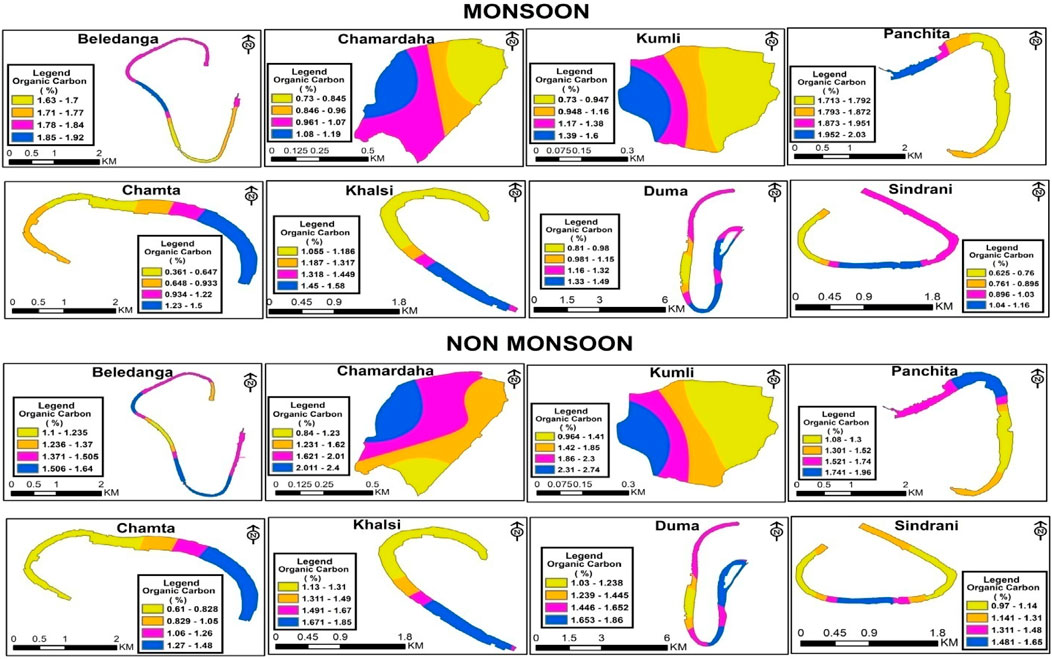
Figure 4. Spatio-temporal distributions of sediment organic carbon (%) in the studied floodplain wetlands of West Bengal, India.
Since nitrogen is a building-block molecule of protein, its presence is crucial for aquatic productivity and developing living materials. Nitrogen is present in the sediment as ammonia, nitrate, nitrite, or organic nitrogen (Kumari and Paul, 2019). Although aquatic productivity, fertility, and biodiversity depend on nitrogen, it is a critical factor in controlling eutrophication (Krishnanandan and Srikantaswamy, 2013). Several factors like organic matter built-up, decomposition and mineralization, atmospheric nitrogen deposition, and its fixation and denitrification influence the nitrogen content in the sediment (Chen and Twilley, 1999). Spatiotemporal dynamics of nitrogen help in gaining insights into wetland biogeochemistry. Sediment available nitrogen (ammoniacal and nitrate) is an important parameter for wetland productivity (Pandion et al., 2023a) and is highly influenced by the content of sediment organic carbon (Sugunan and Bhattachariya, 2000). During the study period, available nitrogen content was lowest in Sindrani wetland (11.15–11.63 mg/100 g sediment) and highest in Panchita wetland (16.72–17.69 mg/100 g sediment), with a comparatively higher value in the non-monsoon season than in monsoon (Table 3; Figure 5). However, the seasonal variations were non-significant (Table 4).
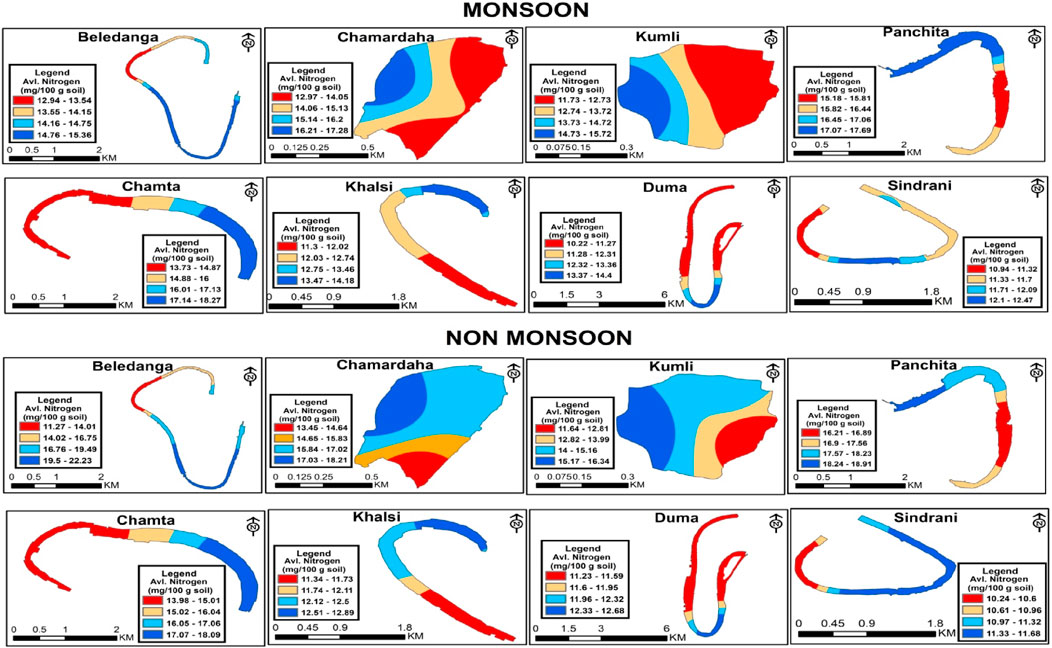
Figure 5. Spatio-temporal distribution of available N (mg/100 g) in the studied floodplain wetlands of West Bengal, India.
The total nitrogen content in the sediment was higher in the non-monsoon season than in the monsoon season (Table 3; Figure 6), and the variation was significant. This seasonal variation in the total N content indicates the dynamic nitrogen cycle in the system. This seasonal disparity may be due to rainfall-induced runoff during the monsoon season and by the mineralization and consumption process (Adeyemo et al., 2008; Jayachandran et al., 2012). In the monsoon season, the maximum and minimum contents of total nitrogen were recorded in Khalsi (288.9 mg/100 g sediment) and Panchita (85.3 mg/100 g sediment), respectively.
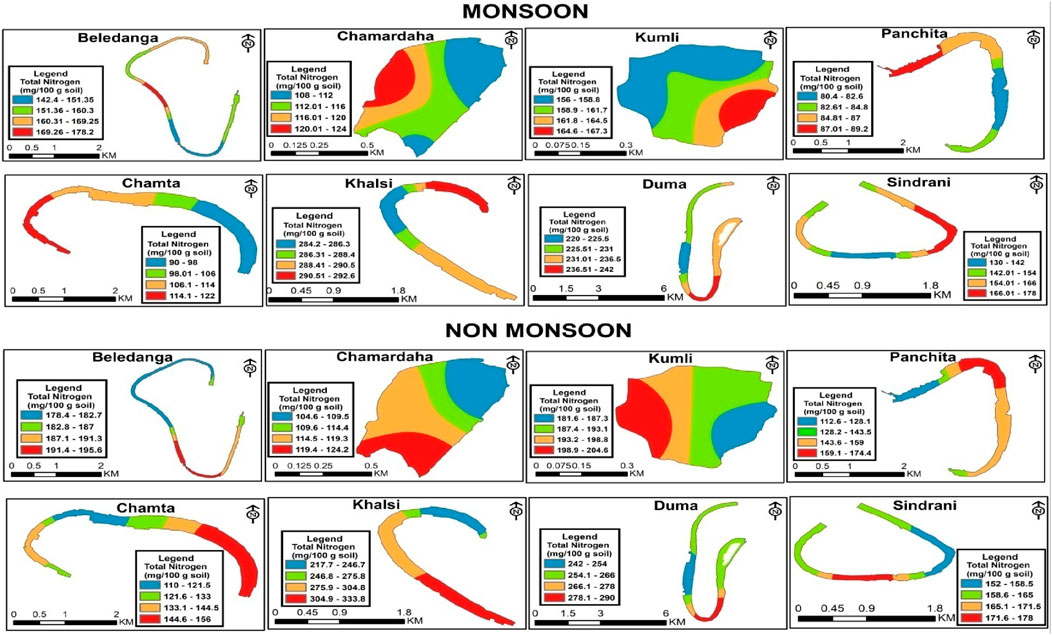
Figure 6. Spatio-temporal distribution of total N (mg/100 g) in the studied floodplain wetlands of West Bengal, India.
Phosphorus (P) plays an important role in metabolic activity. P is the least abundant element (compared to nitrogen and potassium) and is a limiting nutrient for biological productivity as its low concentration results in low productivity. In contrast, slight increments may cause algal bloom and eutrophication (Saluja and Garg, 2016). The geochemical forms and distribution of P determine the status and preservation of P in the sediment (Saha et al., 2020; Saha et al., 2022). Moreover, the sediment provides a necessary base of P for supporting the wetland primary creation depending on the P speciation. The sediment’s phosphorus content depends on factors like topography, vegetation, pollution level, and phosphorus exchange between the sediment and water. Consequently, this also depends on the phosphorus-retaining capacity of the sediment and the fauna, which influences the interaction of phosphorus between the sediment and water (Weibezahn et al., 1990). In the sediment, phosphorus occurs in both inorganic and organic forms; however, the organic form is of little significance in supplying phosphorus to primary producers because of its slower liberation rate under anaerobic conditions. Moreover, phosphorus in the inorganic form quickly becomes unavailable due to the formation of ferric, aluminum, or calcium phosphate depending upon the alkaline or acidic condition of the aquatic body. In general, phosphorus is never readily available, with its highest availability centering on pH 6.5 (Brady and Weil, 1984).
There was significant variation in the available P content in the studied wetlands (Table 4). Available P was in line with the results reported from the Damodar River (Kumari and Paul, 2019). The highest amount of available P was found in Panchita (2.85 mg/100 g sediment) in non-monsoon season and Duma (3.99 mg/100 g sediment) in monsoon (Table 3; Figure 7) season. The lowest concentration of available P was found in Chamta in both seasons. Standard deviation values indicate that wetlands possess similarity in their variability, which means they have similar sources. The available P content exhibited fewer fluctuations in the non-monsoon months. The concentration of the average available phosphorus was comparatively higher in monsoon season than in non-monsoon season, which is similar to that reported in the previous reports (Kumari and Paul, 2019).
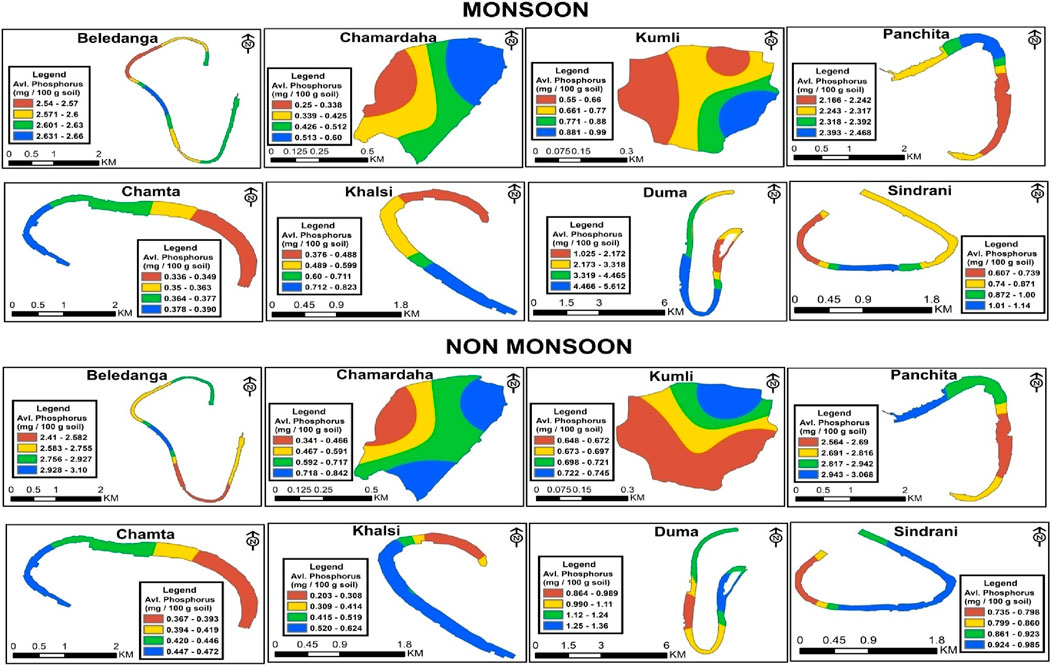
Figure 7. Spatio-temporal distribution of available P (mg/100 g) in the studied floodplain wetlands of West Bengal, India.
Variations in the total sediment phosphorus (total P) content in different wetlands are shown in Table 3 and Figure 8. The TP content was higher in non-monsoon seasons than in monsoon. During monsoon, the total phosphorus concentration varied from 43.54 mg/100 g of sediment (Kumli) to 99.72 mg/100 g of sediment (Khalsi). During the non-monsoon period, the lowest concentration of TP was in Beledanga (45.41 mg/100 g of sediment), and the highest concentration was in Duma (161.4 mg/100 g of sediment). Our findings reflect the conditions prevailing in these wetlands, which are integral parts of agricultural activities in the area.
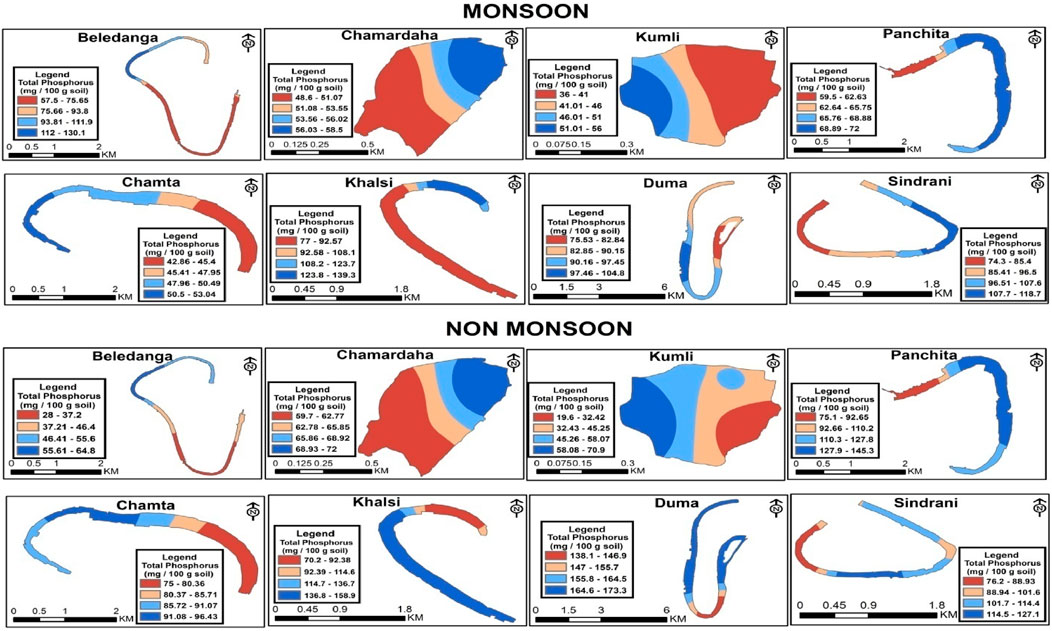
Figure 8. Spatio-temporal distribution of total P (mg/100 g) in the studied floodplain wetlands of West Bengal, India.
3.2 Stoichiometry of C, N, and P
Nutrient (C, N, and P) stoichiometry of wetlands helps in source apportionment of organic matter in wetlands, the inflow of external nutrients, and the mineralization/decomposition and various other nutrient biogeochemical processes operating in the aquatic water bodies (Avramidis et al., 2015). The C/N ratio indicates whether the source of deposited organic matter is allochthonous or autochthonous. Since wetlands are complex transition bodies between aquatic and terrestrial land, they have a more complex sediment elemental component ratio than other water bodies. The ratio of C/N indicates the sediment quality and productivity of the aquatic body, and it is also an indicator of pollution (Venkatesh and Anshumali, 2020). C/N also indicates the nitrogen mineralization process as a high C/N ratio states lower organic matter mineralization, whereas low C/N is due to microbial decomposition of organic matter (Lu et al., 2018).
In all the wetlands, the C/N ratio was comparatively low, and a smaller range was observed (Figure 9). In general, the C/N ratio ranges from 5 to 6 in phytoplankton and zooplankton, mainly composed of protein, which are generally nitrogenous compounds (Song, 2011; Ramachandra et al., 2020). Since freshly deposited organic matter is derived from planktonic organisms, their C/N ratio is 6–9 (Carnero-Bravo et al., 2015). Meanwhile, terrestrial vascular plants have a C/N ratio of 15 or more, and organic matter obtained from them has a C/N ratio of >20 (Cardoso-Silva et al., 2018). This indicates that the carbon in the studied wetlands is mainly from the phytoplankton community (Holligan et al., 1984). The catchment area of these wetlands is agricultural land, and the fertilizer used in this agricultural land may reach the wetlands, thus lowering the C/N ratio (Balakrishna and Probst, 2005). Marine organic matter generally has a higher C/N ratio, and the ratio is low in freshwater (Andrews et al., 1998). Datta et al. (1999) also reported a low C/N ratio (5.45–8.81) of sediments from the Ganges, Brahmaputra, and Meghna rivers, which may be due to the enrichment of inorganic nitrogen. Dhanakumar et al. (2015) reported a lower C/N ratio in the Cauvery river sediment due to organic matter decomposition.
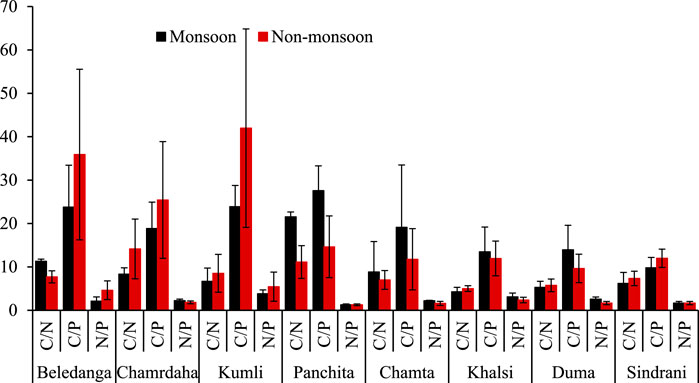
Figure 9. Stoichiometry of C, N, and P in the surface sediment of the studied wetlands.
The C/P ratio indicates the mineralization capacity of organic P (Paul, 2014). In the present study, the C/P ratio of wetland sediments varied from 9.81 to 27.6 during monsoon and 9.6 to 42.0 during the non-monsoon period (Figure 9). Except for Beledanga and Kumli, the C/P ratio was comparatively lower concerning the literature reports (Saha et al., 2020; Zhang et al., 2012; Zhang et al., 2013). A low C/P ratio indicates net N mineralization (Wu et al., 2023). In general, a lower C/P ratio leads to the release of nutrients by organic matter decomposition and, thus, increases the available phosphorus in soil (Lu et al., 2018). Like the C/P ratio, the N/P ratio was also low, except for Beledanga and Kumli wetlands. This lower value indicates that nitrogen is a limiting factor. However, a comparatively slightly higher C/P ratio and lower C/N and N/P ratios indicate that biogeochemical processes in wetlands are limited by N and P (Cao et al., 2015). The lower N/P ratio may be due to P enrichment/retention in wetland sediment. Moreover, a low N/P ratio also indicates that higher recycling of benthic N and denitrification processes, along with benthic N release, may play an important role in the primary productivity of the wetland ecosystem. The sediment nutrient ratio in the wetland indicates that there may be carbon exchange between the wetland and the external environment (Cauwet and Mackenzie, 1993). Hence, these data may help to identify freshwater wetlands’ global carbon and nutrient stock. However, detailed information and studies are required regarding the biogeochemical processes and hydrological dynamics that influence the storage and distribution of SOC, TN, and TP.
3.3 Statistical analysis
3.3.1 Pearson correlation analysis
Pearson correlation analysis is a bivariate analysis that indicates the possible association between the various sediment quality parameters. It indicates the interaction among various nutrient parameters, whether they originated from the same or diverse sources. Table 5 represents the correlation analysis results of various physicochemical properties of the sediment. CaCO3 exhibited a strong positive correlation with % sand content. This indicates that a higher sand content enhances the level of CaCO3 in the sediment samples. Higher CaCO3 in the sandy sediment may be related to the shell fragments attached to the sand fraction (Saha et al., 2023). The strong negative correlation of silt with sand, clay with sand, and clay and silt with calcium carbonates indicate their differential provenance sources. EC is strongly associated with OC, CaCO3, available P, and total P. Sediment pH showed a positive relation with total nitrogen. A non-significant but positive association was also observed between SOC and total N and P. Mandal and Islam (1978) showed a strong relation of phosphorus with pH, clay content, total nitrogen, and organic matter content. Total N was positively correlated with total P. This indicates their common sources, like terrestrial plants and animals and agricultural practices (Kulari and Paul, 2019; Reddy et al., 2021). However, available N was inversely related to total N and total P, while the available P content was not associated with sediment total N and total P. Limitations in the bioavailability of sediment nitrogen are associated with environmental factors like organic matter decomposition, temperature, sediment pH, oxic/anoxic bottom sediment, and the extent of anthropogenic stresses (Reddy et al., 2021). This also indicates the differential natural and anthropogenic pressure, which regulates the biogeochemistry of available nutrients in different wetlands. The composition of microorganisms is also different in different wetlands, which may also plays a decisive role in nutrient bioavailability (Wang et al., 2021). Wetland sediment texture plays an important role in controlling sediment biophysical conditions. Clay particles with a smaller pore size retain more nutrients than sand and silt (Ashman and Puri, 2002). An unexpectedly significant positive relation was obtained between total N and sand content. This may be due to anthropogenic impacts like agricultural runoff from adjacent fields, which requires further investigation.
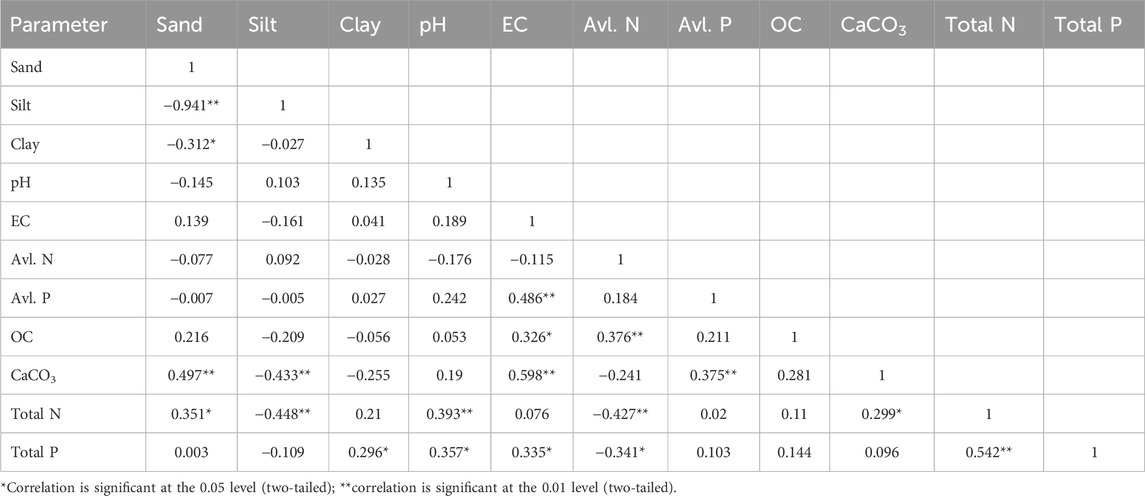
Table 5. Pearson correlation of the physiochemical parameters of sediments.
3.3.2 Principal component analysis
Data were subjected to principal component analysis (PCA) to determine possible sources, viz. natural or human, point or non-point sources, which influences the overall quality and health of the aquatic ecosystems (Pandion et al., 2023b) and also synthesize and consolidate the pattern of influence of sediment quality parameters (Murthuza et al., 2022) on the biogeochemical process of wetlands (Pustry et al., 2010). PCA was used to recognize crucial and meaningful information by extracting important information from the raw data using established correlations of different sediment quality parameters.
PCA analysis generated four different PCs that explained 74.35% of the total variance. Table 6 and Figure 10 provide the PC loading of the originally studied variables and four PCs generated by the PCA, which helps in understanding and interpreting these components. PC1 accounted for 28.3% of the variance and was highly correlated with sediment TN and sand content. This indicates the anthropogenic influences, as already seen in the Pearson correlation analysis. This also suggests the influence of organic matter on wetland sediment nutrients. PC2 accounted for 18.8% of total variance and was correlated with clay, pH, and TP. This indicates the association of fine-grained sediment with nutrients due to its higher binding ability. This also indicates natural and man-made causes that influence the wetland sediment quality. PC3 accounted for 16.4% of the total variance and was associated with sediment available N and P, indicating slight influence on the biogeochemistry of bio-available nutrients in wetland sediments. PC4 accounted for 10.9% of the total variance but indicated a weak influence of clay and available N and OC. Thus, the four PCs can be categorized as “anthropogenic influences,” “textural influences,” “the limiting available nutrients N and P,” and “influence of nutrients.”
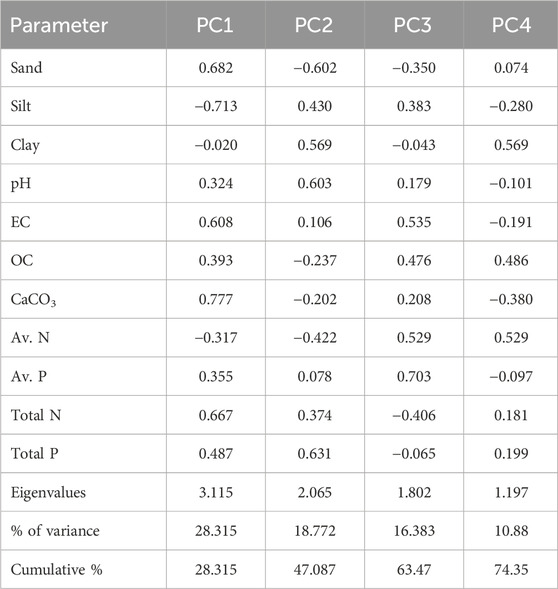
Table 6. PCA applied to the results of the physiochemical parameters of the sediment.
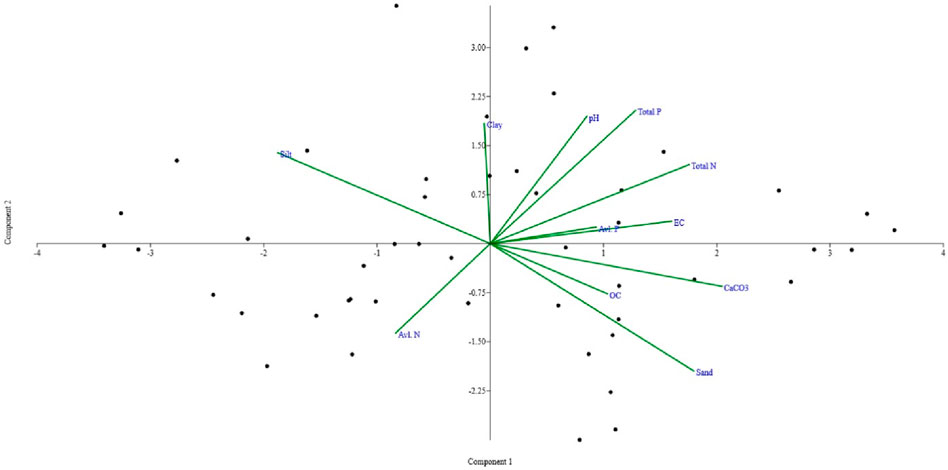
Figure 10. Principal component analysis plot drawn for the correlation among various sediment quality variables recorded in the studied wetlands.
3.3.3 Cluster analysis
Cluster analysis was conducted to determine the similarity of different physicochemical properties and the similarities within the different wetlands (Figure 11). The cluster was generated based on the Ward method and cluster distances. Based on the physicochemical properties, four different clusters were generated. Cluster 1 consists of pH, clay, and CaCO3 and is considered the least contaminated site, while cluster II consists of EC, OC, and avl. P and is considered a less contaminated site. Cluster III consists of avl. N, sand, and silt and is considered to be moderately contaminated. The most contaminated area corresponds to cluster IV and was associated with total N and total P. Similar to the physicochemical properties, wetland clustering also indicates that the most anthropogenically stressed wetlands were Khalsi and Duma as these wetlands contain the maximum total N and total P.

Figure 11. Clustering of physiochemical variables of the sediment (A) and wetlands (B).
4 Discussion
Sediment pH is the prime factor that controls the chemical reactions, thus regulating the availability of nutrients and metal in aquatic ecosystems (Das, 2015). Therefore, sediment pH heavily impacts the growth and survival of different biotic communities of aquatic water bodies (Pandion et al., 2023b). Most of the micronutrients are available at the sediment pH value of 6.9–7.8, with an average of 7.5 (Donahue et al., 1983). Aquatic life would be hampered with slight pH variations as most microbial metabolic activities depend on pH. Significant variation in sediment pH among the different wetlands is attributed to differences in geology, sediment composition, and local hydrological conditions (Li et al., 2022). The observed variations may influence the biogeochemistry of nutrient and trace metal contents of different wetlands and, thus, may influence the general well-being of sediment-dwelling organisms (Andersson and Gledhill, 2013; Pandion et al., 2023a). Nag et al. (2023) reported a slightly higher sediment pH of 7.89–9.44 (mean 8.57 ± 0.41) for Khalsi wetland. Alam et al. (2003a) registered acidic pH (4.42–6.65) for the sediment of freshwater wetlands of Dhaka, Bangladesh. A productive aquatic body should have a sediment pH value of 6.5–7.5 (Jhingran, 1992), while a permissible level is 5.5–8.5 (Banerjea, 1967). For the healthy and quick growth of freshwater species, a sediment pH of 6.5–9.0 is ideal (Boyd and Tucker, 1998), while Murdoch et al. (2001) reported that the optimum pH for sustaining aquatic life is 6.5–8.2. The results of this study indicate that the wetlands are productive to support aquatic life and very suitable for fisheries. In general, heavy rainfall and subsequent dilution resulted in lower sediment pH in the monsoon. However, the seasonal variation was non-significant. Moreover, the average sediment pH value of Beledanga, Chamardaha, Chamta, and Duma was higher in monsoon, whereas for the rest of the wetlands, the higher value was in non-monsoon season. This unpredicted differentiation finding warrants further investigation into the underlying factors contributing to this contrasting trend.
EC values were significantly different among the wetlands (Table 4). These fluctuations could be due to different rates of effluents received by the wetlands, existing operating practices, and the individual wetlands’ physiographic and hydrographic characteristics (Gerla, 2013). Nag et al. (2023) reported a value of 0.34–0.951 dS/m in the Khalsi wetland, which is higher than in the present study (0.203–0.605 dS/m). Even if some aquatic species have mechanisms to regulate EC and vice-versa, EC can also influence the physiology of different aquatic species (Tapader et al., 2017). According to Gul et al. (2015), the EC value in the current study is favorable. Factors like the evaporation rate, rainfall pattern, input of terrigenous materials, and intrusion of groundwater influence the EC values (Nouri et al., 2010). Heavy freshwater discharge and monsoonal episodes may cause low EC due to dilution (Prasad and Rishideo 2021; Aslam et al., 2023). Here, in some wetlands, EC values were quite high, which may be due to the content of higher amounts of ions, while the low values in some wetlands may be due to silicate materials in the sediment. Although the seasonal variation in sediment EC was non-significant, monsoon values were higher than non-monsoon values. This trend was opposite to higher EC values in the dry season and lower values in the monsoon season. The reason may be the influx of more rainwater during monsoon months, which carries land-driven ions, sediments, and other dissolved ions and thus increases the sediment EC value during monsoon season. Moreover, anthropogenic influences might have also increased the sediment EC content by contributing additional ions and contaminants. Furthermore, several factors like weathering and erosion of land-driven materials, temperature, and hydrography of wetlands also influence the sediment EC content.
In general, sandy or clayey sediments are unsuitable for fisheries as in the former, there are chances of heavy nutrient losses, whereas later adsorb the nutrients, leading to the nutrient-poor overlying water (CIFRI, 2000). Loamy sediments with a balanced composition of sand, silt, and clay are considered the most productive because they are not too adsorptive to impoverish water from nutrients and, at the same time, do not permit excess loss of nutrients (Shafi et al., 2021). Various local factors, like hydrodynamics, river channel opening or closing, and terrestrial sediment input, influence the sediment composition of different wetlands. The variation in sediment texture in various wetlands influences the wetland processes and habitats. All the wetland sediment texture was generally dominated by sand, followed by silt and clay. This sandy-loam nature of the sediment may help in providing a habitat for bottom-dwellers, and bottom-oriented organisms may burrow into the sediment under adverse conditions (Pandion et al., 2023a). Finer sediments help in sediment stability with nutrient retention and thus play an important role in the distribution and abundance of sediment-dwelling organisms. On average, the sand content was higher in the monsoon season, possibly due to rain-induced sandy sediment development. During the non-monsoon season, the sediment bed comprised little more silt and clay fractions, except for a few cases. Banerjea (1967) reported wide variations in the sand content (11–62%) in freshwater ponds. Islam et al. (2017) reported 1.04–4.36% silt in the sediment of the Rajakhali canal, Bangladesh, whereas Islam et al. (2016) recorded 32.73–51.47% silt in a shrimp culture pond in Cox’s Bazar, Bangladesh. Alam et al. (2003a) reported the clay–loam nature of the sediment of freshwater wetlands of the greater Dhaka district, Bangladesh. These comparative reports also indicate the higher value of sand in different stagnant water bodies. This indicates the dominance of surface erosion and sand-size particles from this erosion process (Rienzi et al., 2013; Savic et al., 2021). The distribution of calcium carbonates in the sediments displays a rich percentage in all the wetlands. The primary source of carbonate sediments along such sites is attributed to the calcareous nature of the bottom of the Himalayan rivers, as river Ganga originates from here, and partly from weathering and subsequent erosion. These calcareous sediments find their way into the wetland bottom through the water column upon settlement.
The variations in the SOC content were non-significant among the different wetlands. Similar SOC content in all wetlands indicates similar anthropogenic influences (Kumari and Paul, 2019). Alam et al. (2003b) found that SOC (%) content in various freshwater wetlands of Bangladesh was up to 3%, which is the standard for different tropical freshwater wetlands of Asia (Neue, 1985). Various factors like the nature and type of vegetation, rate of accumulation of dead and decayed materials, sediment texture, water depth, and temperature influence the organic carbon content in the sediments. Jhingran (1992) categorized the sediments as high, medium, and low productive when the organic carbon content is <0.5%, 0.5–1.5%, and 1.5–2.5%, respectively, and according to this, all the studied wetlands are medium productive. The amounts of organic matter found from the different wetlands in the present study are highly related to the optimum level of organic matter (%) for aquaculture development (Karmakar et al., 2022). USEPA recommended the following assessment categories for total organic carbon in sediments: low impact: ≤1%, intermediate impact: 1%–3%, and high impact: >3% (Nelson, 2020). According to this recommendation, the organic carbon concentration in the analyzed sediments was in the intermediate impact level, which may affect benthic communities. Aquatic flora and weeds growing within the wetland and terrestrial vegetation present along the wetland catchment area and along the margin of the wetlands are the principal sources that control the quantity and quality of organic material delivered to the wetland system. The moderate content of OC in the wetland floor sediments is attributed to the mixed contributions from both in situ wetland flora and fauna and terrigenous detrital sources present along the wetland catchment. Pearson and Rosenberg (1978) proposed a model suggesting that increasing organic matter content decreases the species diversity and increases the individual number of macrobenthic communities. Since wetland sediment has a higher tendency to accumulate SOC than its terrestrial counterpart, a regular assessment of SOC is necessary for maintaining the long-term productivity of wetlands (Nag et al., 2023).
The available nitrogen content was low in monsoon, which may be due to the biological consumption and sorption by suspended particles (Saha et al., 2020). Non-monsoon season contains higher values, which may be due to the steady accumulation of nitrogen received through the inflow water during the monsoon season (Saha et al., 2023). The results corroborate the observations of various previous studies (Saunders and Kalff, 2001; Kumari and Paul, 2019). Variations in the total nitrogen content across the wetland may be due to various local factors like sources of pollution, freshwater inputs, floodplain geomorphology, human settlement, and agricultural and industrial development. Alam et al. (2003a) reported 0.04%–0.63% total nitrogen in the wetland of Dhaka, Bangladesh. Sediment total nitrogen in all the studied wetlands was higher than the value observed in north Bihar wetlands in India (0.001%–0.47%) (Mandal et al., 2003). Nag et al. (2023) reported a slightly lower value for total nitrogen (0.74%–0.82%) in the Khalsi wetland. Availability of nitrogen influences the algal bloom, distribution of benthic species, and primary productivity. Hence, an increase in the sediment nitrogen content in the non-monsoon season may enhance the algal bloom and, subsequently, eutrophication and oxygen depletion. Information related to sediment quality based on total nitrogen is not available in India. However, Ontario sediment quality guidelines state that if the total nitrogen content in bulk sediment is ≥4,800 mg/kg, the sediment will be considered heavily polluted and may adversely affect sediment-dwelling organisms (Persaud et al., 1993). However, sediment total nitrogen contents in all the studied wetlands were below the prescribed value.
The available P content in the studied wetlands was higher than the values (0.45–19.675 μg/g) reported for wetland sediment of the Greater Dhaka district, Bangladesh (Alam et al., 2003a). The higher value in the present study may be due to the entrapment of agricultural runoff of the phosphatic fertilizer and their subsequent deposition. The lower value in non-monsoon season may be due to biological consumption (Seralathan and Seetaramaswamy, 1979). Lakshmi et al. (2002) also reported similar observations for the sediment of Thalassery River, India. The total P content in the studied wetlands was higher than the value reported for the Keoladio National Park (0.001%–0.034%) (Anjan Kumar Prusty et al., 2010) and north Bihar wetlands (0.001%–0.423%), India (Mandal et al., 2003). A slightly higher value in the present study was due to the agricultural runoff of chemical fertilizers, as already mentioned. However, the values are far lower than those of floodplain wetlands of West Bengal, India (Samanta et al. (2015), where exceedingly high levels of total phosphorus (Bhomra wetland: mean value: 6,040 ± 344 mg/kg; Akaipur: mean value: 5,470 ± 363 mg/kg) were observed. Factors like fertilizer runoff, industrial and sewage effluents, freshwater inflow, and catchment activities influence the P concentration in the wetland sediment. Moreover, sediment compositions like P-binding minerals, organic matter content, and sediment pH reactions also influence the retention/release of sediment P. Seasonal variation in water input may be an important factor in sediment total P content variation. The gradual accumulation of agricultural discharge might have increased the phosphorus concentration in the non-monsoon sediment.
Phosphorus from inorganic sources from the agricultural area in the form of fertilizers and detergents from domestic households is relatively low compared to the organic sources. Unlike nitrogen and carbon, phosphorus has no gaseous form. Therefore, phosphorus does not cycle out of the system like nitrogen by way of denitrification or carbon by respiration. Thus, phosphorus tends to accumulate in the sediments. Once in the sediments, phosphorus is slowly released into the interstitial water as organic material is oxidized. The influx of sediment might have resulted in a lower concentration of P in the monsoon season. The maximum content of total P in non-monsoon months is a general observation in various aquatic water bodies (Sankaranarayanan and Panampunnayil, 1979; Saha et al., 2022; Saha et al., 2023). Phosphorus distribution is similar to nitrogen as most aquatic bodies maintain a specific ratio between nitrogen and phosphorus.
5 Conclusion
The present study highlighted the less documented sedimentological profile of important floodplain wetland systems of India. Moreover, the use of a GIS interpolation approach in collaboration with traditional laboratory analysis methods can be the best alternative and less expensive tool for providing a complete spatial resolution of the study sites. The sediment pH of most wetlands was neutral to alkaline, indicating their suitability for the growth and survival of highly diverse organisms and, hence, favorability for the growth of fish fauna. Sediments’ grain size distribution suggests the dominance of sand, followed by silt and clay. The study indicates that local factors were more influential than seasonal factors as there were non-significant differences in sediment quality parameters in two distinctly different hydrological periods. Most of the nutrient parameters peaked in non-monsoon months; however, other than total N and P, none showed any seasonal variation. The low C/N ratio in the studied wetland indicates the influence of autochthonous deposited materials rather than allochthonous deposited materials due to the higher growth rate of wetland plants. Based on the results of the present study, it could be inferred that these wetlands are comparatively less impacted by anthropogenic stress, but the rise in the nutrient level observed in this study is alarming; thus, periodic monitoring and preventative measures are required to save the aquatic system from eutrophication. The findings also have important implications for the development of effective potable water management and strategies for the control of point and diffuse-source pollution within the waterbody. A significant correlation was found between some of the physicochemical characteristics in the sediment. Hence, further investigation should be extended to validate the authenticity of the obtained significant correlation between different sediment quality parameters and assess the heavy metal content in the sediment for better management of the studied wetlands. The results of the principal and cluster analyses indicate contamination from both natural and anthropogenic sources. This study will also help identify suitable wetland areas for enclosure culture, particularly for constructing pens. The baseline information generated in this study for the wetland sediment can be used for monitoring floodplain wetlands for their ecological assessment. Finally, it is important to develop an ecosystem-based management tool by incorporating inputs from all stakeholders, including scientists, policymakers, resource managers, and other government and non-government organizations, to build a strategy for enhancing wetland productivity and maintaining biodiversity in a sustainable manner for the livelihood improvement of marginalized fishermen who entirely depend on these important aquatic resources of the Gangetic belt of India.
Data availability statement
The raw data supporting the conclusions of this article will be made available by the authors, without undue reservation.
Ethics statement
In accordance with the national legislation and institutional requirements, written informed consent from the participants was not required to participate in this study.
Author contributions
BD: conceptualization and writing–original draft. AS: conceptualization and writing–original draft. AD: methodology and writing–review and editing. PC: data curation and writing–review and editing. KM: data curation and writing–review and editing. TK: methodology, software, and writing–review and editing. SC: formal analysis, resources, and writing–review and editing. SB: investigation, methodology, and writing–original draft. BS: data curation and writing–review and editing. CJ: investigation, software, supervision, and writing–review and editing.
Funding
The author(s) declare that financial support was received for the research, authorship, and/or publication of this article. The National Mission for Clean Ganga, Ministry of Jal Shakti, Government of India, supported this work.
Acknowledgments
The authors thank the Director, ICAR-Central Inland Fisheries Research Institute, Barrackpore, Kolkata-700120, West Bengal, India, for providing research facilities.
Conflict of interest
The authors declare that the research was conducted in the absence of any commercial or financial relationships that could be construed as a potential conflict of interest.
Publisher’s note
All claims expressed in this article are solely those of the authors and do not necessarily represent those of their affiliated organizations, or those of the publisher, the editors, and the reviewers. Any product that may be evaluated in this article, or claim that may be made by its manufacturer, is not guaranteed or endorsed by the publisher.
References
Abdulwadood, H. W., Al-Hassany, G. S., and Mustafa, R. I. (2021). IDW interpolation of soil moisture retention curve utilizing GIS IOP conference series: earth and environmental science. IOP Publ. 856 (1), 012040. doi:10.1088/1755-1315/856/1/012040
Acharya, G., and Barbier, E. B. (2000). Valuing groundwater recharge through agricultural production in the Hadejia-Nguru wetlands in northern Nigeria. Agric. Econ. 22 (3), 247–259. doi:10.1111/j.1574-0862.2000.tb00073.x
Adeyemo, O. K., Adedokun, O. A., Yusuf, R. K., and andAbeleye, E. A. (2008). Seasonal changes in physico-chemical parameters and nutrient load of river sediments in Ibadan city, Nigeria. Global nest. Int. J. 10 (3), 326–336. doi:10.30955/gnj.000458
Alagarsamy, R. (1991). Organic carbon in the sediments of Mandovi estuary, Goa. Indian J. Mar. Sci. 20, 221–222.
Alam, A. K. M. R., Hossain, A. B. M. E., and Hoque, S. (2003b). Carbon content of humus in some freshwater wetland soil, of Bangladesh. Bangladesh J. Bot. 32, 5–9.
Alam, A. K. M. R., Hossain, A. B. M. E., Hoque, S., and Rahman, M. M. (2003a). Major physicochenical properties of soil of some freshwater wetlands of greater of Dhaka district. J. Asiat. Soc. Bangladesh, Sci. 29 (1), 53–60.
Álvarez-Cobelas, M., Sánchez-Carrillo, S., Cirujano, S., and Angeler, D. G. (2010). “A story of the wetland water quality deterioration: salinization, pollution, eutrophication and siltation,” in Ecology of threatened semi-arid wetlands (Springer Science and Business Media), 109–133.
Andersson, A. J., and Gledhill, D. (2013). Ocean acidification and coral reefs: effects on breakdown, dissolution, and net ecosystem calcification. Annu. Rev. Mar. Sci. 5, 321–348. doi:10.1146/annurev-marine-121211-172241
Andrews, J. E., Greenaway, A. M., and Dennis, P. F. (1998). Combined carbon isotope and C/N ratios as indicators of source and fate of organic matter in a poorly flushed, tropical estuary: hunts Bay, Kingston Harbour, Jamaica. Estuar. Coast. Shelf Sci. 46 (5), 743–756. doi:10.1006/ecss.1997.0305
Anjan Kumar Prusty, B., Chandra, R., and Azeez, P. A. (2010). Macronutrients along the sediment profile in a subtropical monsoonal wetland in India. Wetlands Ecol. Manage 18, 91–105. doi:10.1007/s11273-009-9151-9
APHA (2017). Standard Methods for examination of water and wastewater. American Public Health Association.
Ashman, M. R., and Puri, G. (2002). Essential Soil Science: a clear and concise introduction to soil science. Oxford: Wiley Blackwell Science.
Aslam, A., Ahmad, T., and Ranjan, R. K. (2023). Differential responses of hydrochemical factors and LULC changes on the spatial and temporal hydrogeochemistry of the eco-sensitive Baraila wetland, Bihar, India. Environ. Sci. Pollut. Res. 30, 39223–39245. doi:10.1007/s11356-022-25005-1
Avramidis, P., Nikolaou, K., and Bekiari, V. (2015). Total organic carbon and total nitrogen in sediments and soils: a comparison of the wet oxidation–titration method with the combustion-infrared method. Agric. Agric. Sci. Procedia 4, 425–430. doi:10.1016/j.aaspro.2015.03.048
Ayyad, S., Karimi, P., Langensiepen, M., Ribbe, L., Rebelo, L.M., and Becker, M. (2022). Remote sensing assessment of available green water to increase crop production in seasonal floodplain wetlands of sub-Saharan Africa. Agric. Water Manag. 269, 107712. doi:10.1016/j.agwat.2022.107712
Balakrishna, K., and Probst, J. L. (2005). Organic carbon transport and C/N ratio variations in a large tropical river: Godavari as a case study, India. Biogeochemistry 73 (3), 457–473. doi:10.1007/s10533-004-0879-2
Banerjea, S. M. (1967). Water quality and soil condition of fish ponds in some states of India in relation to fish production. Indian J. Fish. 14, 115–144.
Belyaev, A. I., Pugacheva, A. M., and Korneeva, E. A. (2022). Assessment of ecosystem services of wetlands of the volga–akhtuba floodplain. Sustainability 14 (18), 11240. doi:10.3390/su141811240
Borah, S., Sarkar, U. K., Das, P., Yadav, A. K., Puthiyottil, M., Pame, D., et al. (2022). Managing floodplain wetlands through culture-based fisheries (CBF) for livelihood security and sustainable development: a study from a biodiversity hotspot region of India. Arabian J. Geosciences 15 (14), 1245. doi:10.1007/s12517-022-10524-5
Boyd, C. E., and Tucker, C. S. (1998). Pond aquaculture water quality management. Boston, MA, USA: Kluwer Academic Publishers.
Brady, N. C., and Weil, R. R. (1984). The nature and properties of soils. 9th Edn. New York: McMillan Publishing Company. London: Collier Macmillan Publishers, 750.
Braskerud, B. C. (2002). Factors affecting nitrogen retention in small constructed wetlands treating agricultural non-point source pollution. Ecol. Eng. 18, 351–370. doi:10.1016/s0925-8574(01)00099-4
Bremner, J. M. (1965). “Total nitrogen,” in Methods of soil analysis: part 2 chemical and microbiological properties (Madison, Wisconsin: American Society of Agronomy), 1149–1178.
Brinson, M. M., Bradshaw, H. D., and Kane, E. S. (1984). Nutrient assimilative capacity of an alluvial floodplain swamp. J. Appl. Ecol. 21, 1041–1057. doi:10.2307/2405066
Byomkesh, T., Nakagoshi, N., and Md. Shahedur, R. (2009). State and management of wetlands in Bangladesh. Landsc. Ecol. Eng. 5, 81–90. doi:10.1007/s11355-008-0052-5
Cao, L., Song, J., Li, X., Yuan, H., Li, N., Duan, L., et al. (2015). Geochemical characteristics of soil C, N, P, and their stoichiometrical significance in the coastal wetlands of Laizhou Bay, Bohai Sea. Clean–Soil, Air, Water 43 (2), 260–270. doi:10.1002/clen.201300752
Cardoso-Silva, S., Ferreira, P. A. D. L., Figueira, R. C. L., da Silva, D. C. V. R., Moschini-Carlos, V., and Pompêo, M. L. (2018). Factors that control the spatial and temporal distributions of phosphorus, nitrogen, and carbon in the sediments of a tropical reservoir. Environ. Sci. Pollut. Res. 25 (31), 31776–31789. doi:10.1007/s11356-018-2923-0
Carnero-Bravo, V., Merino-Ibarra, M., Ruiz-Fernández, A. C., Sanchez-Cabeza, J. A., and Ghaleb, B. (2015). Sedimentary record of water column trophic conditions and sediment carbon fluxes in a tropical water reservoir (Valle de Bravo, Mexico). Environ. Sci. Pollut. Res. 22 (6), 4680–4694. doi:10.1007/s11356-014-3703-0
Carroll, M. L., Cochrane, S., Fieler, R., Velvin, R., and White, P. (2003). Organic enrichment of sediments from salmon farming in Norway: environmental factors, management practices, and monitoring techniques. Aquaculture 226 (1–4), 165–180. doi:10.1016/s0044-8486(03)00475-7
Cauwet, G., and Mackenzie, F. T. (1993). Carbon inputs and distribution in estuaries of turbid rivers: the Yang Tze and Yellow rivers (China). Mar. Chem. 43 (1-4), 235–246. doi:10.1016/0304-4203(93)90229-h
Chen, R., and Twilley, R. A. (1999). A simulation model of organic matter and nutrient accumulation in mangrove wetland soils. Biogeochemistry 44, 93–118. doi:10.1007/bf00993000
CIFRI (2000). Ecology and fisheries in beels of Assam, Bulletin No. 104. Barrackpore, India: Central Inland Fisheries Research Institute.
Craft, C., Vymazal, J., and Kröpfelová, L. (2018). Carbon sequestration and nutrient accumulation in floodplain and depressional wetlands. Ecol. Eng. 114, 137–145. doi:10.1016/j.ecoleng.2017.06.034
Datta, D., and Kumar Ghosh, P. (2015). Evaluating sustainability of community endeavours in an Indian floodplain wetland using multi-criteria decision analysis. Singap. J. Trop. Geogr. 36 (1), 38–56. doi:10.1111/sjtg.12092
Datta, D. K., Gupta, L. P., and Subramanian, V. (1999). Distribution of C, N and P in the sediments of the ganges–brahmaputra–meghna river system in the bengal basin. Org. Geochem. 30 (1), 75–82. doi:10.1016/s0146-6380(98)00203-4
Debanshi, S., and Pal, S. (2023). How far the types and wetland hydrological conditions influence its provisioning services in the Indian mature Ganges delta. J. Environ. Manag. 326, 116739. doi:10.1016/j.jenvman.2022.116739
Delince, G. (1992). The ecology of fish and ecosystem with special reference to Africa. Academic Publishers, 230.
Dhanakumar, S., Rutharvel Murthy, K., Mohanraj, R., Kumaraswamy, K., and Pattabhi, S. (2015). “Phosphorous fractionation in surface sediments of the Cauvery delta region, Southeast India,” in Environmental management of river basin ecosystems (Cham: Springer), 477–489.
Diodato, S., González Garraza, G., Mansilla, R., Moretto, A., Escobar, J., Méndez-López, M., et al. (2020). Quality changes of fluvial sediments impacted by urban effluents in Ushuaia, Tierra del Fuego, southernmost Patagonia. Environ. Earth Sci. 79 (20), 481. doi:10.1007/s12665-020-09236-4
DoF West Bengal (2016). Handbook of fsheries statistics. Salt Lake City: Department of fsheries, Government of West Bengal, MeenBhavan.
Donahue, R. L., Miller, R. W., and Schickluna, J. C. (1983). An introduction to soils and plant growth. 5th Edition. New Jersey, Englewood Cliffs: Prentice-Hall Inc, 667.
Fisher, J., and Acreman, M. C. (2004). Wetland nutrient removal: a review of the evidence. Hydrol. Earth Syst. Sci. 8 (4), 673–685. doi:10.5194/hess-8-673-2004
Gaspar, F., Flores-Montes, M., Alves, G., Lins, I., Paulo, J., and Longo, A. (2013). Spatial and seasonal sediment phosphorus species and its relation with granulometry, organic matter and CaCO3 in a tropical estuary. J. Coast. Res. 65, 1134–1139. doi:10.2112/si65-192.1
Gerla, P. J. (2013). Can pH and electrical conductivity monitoring reveal spatial and temporal patterns in wetland geochemical processes? Hydrology Earth Syst. Sci. Discuss. 10 (1), 699–728. doi:10.5194/hessd-10-699-2013
Gul, N., Mussaa, B., Masood, Z., Rehman, H., Ullah, A., and Majeed, A. (2015). Study of some physiochemical properties of soil in fish pond at circuit house; district Sibi of province Balochistan, Pakistan. Glob. Veterinaria 14, 362–365. doi:10.5829/idosi.gv.2015.14.03.9323
Hamamoto, S., Moldrup, P., Kawamoto, K., and Komatsu, T. (2009). Effect of particle size and soil compaction on gas transport parameters in variably saturated, sandy soils. Vadose Zone J. 8 (4), 986–995. doi:10.2136/vzj2008.0157
Holligan, P. M., Williams, P. J. L., Purdie, D., and Harris, R. P. (1984). Photosynthesis, respiration and nitrogen supply of plankton populations in stratified, frontal and tidally mixed shelf waters. Mar. Ecol. Prog. Ser. 17, 201–213. doi:10.3354/meps017201
Hopkinson, C. S., Giblin, A. E., Tucker, J., and Garritt, R. H. (1999). Benthic metabolism and nutrient cycling along an estuarine salinity gradient. Estuaries 22, 863–881. doi:10.2307/1353067
Hupp, C. R., Kroes, D. E., Noe, G. B., Schenk, E. R., and Day, R. H. (2019). Sediment trapping and carbon sequestration in floodplains of the lower Atchafalaya Basin, LA: allochthonous versus autochthonous carbon sources. J. Geophys. Res. 124 (3), 663–677. doi:10.1029/2018jg004533
Hussain, J., Zhang, J., Saleem, A., Luo, Y., Afaq Hussain, M., Hussain, J., et al. (2023). Suitability assessment constraints of potential aggregate resources using an integrated GIS approach. J. Mater. Civ. Eng. 35 (9), 04023307. doi:10.1061/jmcee7.mteng-14684
Ilayaraja, K., and Krishnamurthy, R. R. (2010). Sediment characterisation of the 26 December 2004 Indian ocean tsunami in Andaman group of islands, bay of Bengal, India. J. Coast. Conserv. 14 (3), 215–230. doi:10.1007/s11852-010-0087-2
Islam, M. R., Das, N. G., Barua, P., Hossain, M. B., Venkatramanan, S., and Chung, S. Y. (2017). Environmental assessment of water and soil contamination in Rajakhali Canal of Karnaphuli River (Bangladesh) impacted by anthropogenic influences: a preliminary case study. Appl. Water Sci. 7 (2), 997–1010. doi:10.1007/s13201-015-0310-2
Islam, M. S., Tarek, M. H., Bhuyan, M. S., and Zamal, H. (2016). Assessment of soil quality of coastal shrimp culture pond at Chakaria, Cox s Bazar. J. Asiat. Soc. Bangladesh, Sci. 42 (1), 21–27. doi:10.3329/jasbs.v42i1.31747
Jayachandran, P. R., Nandan, S. B., and andSreedevi, O. K. (2012). Water quality variation and nutrient characteristics of Kodungallur-Azhikode Estuary, Kerala, India. Indian J. Geo-Mar. Sci. 41 (2), 180–187.
Jhingran, A. G. (1992). “Recent advances in reservoir fisheries management in India,” in Reservoir fisheries of Asia, proceedings of the 2nd asian reservoir fisheries workshop (Ontario, OA, Canada: IDRC-Ottawa), 158–175.
Jiménez-Ballesta, R., García-Navarro, F. J., Bravo, S., Amorós, J. A., Pérez-de-Los-Reyes, C., and Mejías, M. (2017). Environmental assessment of potential toxic trace element contents in the inundated floodplain area of Tablas de Daimiel wetland (Spain). Environ. Geochem. Health 39, 1159–1177. doi:10.1007/s10653-016-9884-3
Jiménez-Ballesta, R., García-Navarro, F. J., Bravo Martín-Consuegra, S., Perez de los Reyes, C., Amoros Ortíz-Villajos, J. Á., and Fernández San Miguel, M. (2018). The impact of the storage of nutrients and other trace elements on the degradation of a wetland. Int. J. Environ. Res. 12, 87–100. doi:10.1007/s41742-018-0072-4
Jonathan, M. P., Rammohan, V., and Srinivasalu, S. (2004). Geochemical variations of major and trace elements in recent sediments, off the Gulf of Mannar, the southeast coast of India. Environ. Geol. 45, 466–480. doi:10.1007/s00254-003-0898-7
Karmakar, A. R., Ullah, M. A., Hasan, M. M., Akter, L., Sarker, M. M., Arai, T., et al. (2022). Sedimentary nutrient dynamics in homestead fishpond systems from a subtropical coastal area. Agriculture 12 (12), 2077. doi:10.3390/agriculture12122077
Kome, G. K., Enang, R. K., Tabi, F. O., and Yerima, B. P. K. (2019). Influence of clay minerals on some soil fertility attributes: a review. Open J. Soil Sci. 9 (9), 155–188. doi:10.4236/ojss.2019.99010
Krishnanandan, V., and Srikantaswamy, S. (2013). Assessment of impacts by industries on sediments of Kabini river around Nanjangud Industrial area, Karnataka, India. Int. J. Sci. Eng. Res. 4 (11), 2229–5518.
Kuiper, J. J., Janse, J. H., Teurlincx, S., Verhoeven, J. T., and Alkemade, R. (2014). The impact of river regulation on the biodiversity intactness of floodplain wetlands. Wetl. Ecol. Manag. 22 (6), 647–658. doi:10.1007/s11273-014-9360-8
Kumari, J., and Paul, B. (2019). Spatiotemporal variation in primary nutrients amassing in peninsular river sediment: India. Environ. Earth Sci. 78 (10), 326. doi:10.1007/s12665-019-8322-0
Kumary, K. A., Azis, P. A., and Natarajan, P. (2007). Water quality of the Adimalathura estuary, southwest coast of India. J. Mar. Biol. Ass. India. 49, 1–6.
Lakshmi, K., Unni, P. N., and Neelakantan, N. (2002). Spatial and temporal variation in organic carbon, nitrogen and phosphorus in mangrove sediments of two riverine ecosystems of Kerala. Asian Journal of Microbiology, Biotechnology and Environmental Sciences 4 (2), 259–263.
Li, J., Liu, Y., Liu, Y., Guo, H., Chen, G., Fu, Z., et al. (2022). Effects of Sediment types on the distribution and diversity of plant communities in the Poyang Lake wetlands. Diversity 14 (6), 491. doi:10.3390/d14060491
Lu, Q., Bai, J., Zhang, G., Zhao, Q., and Wu, J. (2018). Spatial and seasonal distribution of carbon, nitrogen, phosphorus, and sulfur and their ecological stoichiometry in wetland soils along a water and salt gradient in the Yellow River Delta, China. Phys. Chem. Earth. Parts A/B/C 104, 9–17. doi:10.1016/j.pce.2018.04.001
Mandal, M. H., Yasmin, B., Roy, A., Ghosh, S., and Siddique, G. (2022). Investigating present status of floodplain wetlands as habitat of water birds and its determinants: an experience from lower part of Deltaic West Bengal, India. Wetlands 42 (7), 70. doi:10.1007/s13157-022-01591-1
Mandal, O. P., Bandana Singh, B. K., Mandal, T. N., and Sinha, K. M. P. (2003). Monthly variation in physico-chemical characteristics of a wetland of North Bihar (India). Pollut. Res. 22 (1), 139–142.
Mandal, R., and Islam, A. (1978). Vertical distribution of phosphate in some sub-humid tropical soils of Bangladesh. Dacca University Studies, 39–51. B, XXVI (2).
Mandol, S., Bhuyan, M. S., Islam, M. N., Altrin, J. A., Al-Imran, M., Islam, M. T., et al. (2023). Granulometric and geomorphological characteristics of RezuKhal canal, Bangladesh: inferences for sustainable ecosystem and management. Acta Ecol. Sin. 43 (1), 209–222. doi:10.1016/j.chnaes.2022.10.001
Merina, R. N., Sashikkumar, M. C., Danesh, A., and Rizvana, N. (2019). Modelling technique for sediment evaluation at reservoir (South India). Water Resour. 46 (4), 553–562. doi:10.1134/s0097807819040158
Millar, H. C., Smith, F. B., and Brown, P. E. (1935). The relative solubility of soil phosphorus in different solvents. Proc. Iowa Acad. Sci. 42 (1), 99–102.
Mitsch, W. J., and Gosselink, J. G. (1993). Northern peatlands. Wetlands. Second Edition. New York: Van Nostrand Reinhold, 367–411.
Moeys, J. (2018). The soil texture wizard: R functions for plotting, classifying, transforming and exploring soil texture data. CRAN. R-Project, 1–104. Available at: https://cran.r-project.org/web/packages/soiltexture/vignettes/soiltexture_vignette.pdf.
Murdoch, T., Cheo, M., and O'Laughlin, K. (2001). Streamkeeper's Field Guide: watershed inventory and stream monitoring methods. Everett, WA: Adopt-A-Stream Foundation, 297.
Murthuza, K. M., Surumbarkuzhali, N., Lakshmi Narasimhan, C., Thirukumaran, V., Chandrasekaran, A., Ganesh, D., et al. (2022). Magnetic and soil parameters as a potential indicator of soil pollution in the district of Tiruvannamalai, Tamil Nadu, India. Environ. Earth Sci. 81 (3), 75–12. doi:10.1007/s12665-022-10196-0
Nag, S. K., Das Ghosh, B., Nandy, S., Aftabuddin, M., Sarkar, U. K., and Das, B. K. (2023). Comparative assessment of carbon sequestration potential of different types of wetlands in lower Gangetic basin of West Bengal, India. Environ. Monit. Assess. 195 (1), 154. doi:10.1007/s10661-022-10729-x
Nagalakshmi, R., Prasanna, K., and andChandar, S. P. (2016). Water quality analysis using gis interpolation method in serthalaikadu Lagoon, east coast of India. Rasayan J. Chem. 9 (4), 634–640.
Nelson, W. G. (2020). A quantitative assessment of organic carbon content as a regional sediment-condition indicator. Ecol. Indic. 114, 106318. doi:10.1016/j.ecolind.2020.106318
Neue, H. U. (1985). “Organic matter dynamics in wetland soils,” in Wetlands soils: characterization, classification and utilization (Philippines: International Rice research Institute), 109–122.
Newman, S., and Pietro, K. (2001). Phosphorus storage and release in response to flooding: implications for Everglades stormwater treatment areas. Ecol. Eng. 18 (1), 23–38. doi:10.1016/s0925-8574(01)00063-5
Nouri, J., Mirbagheri, S. A., Farrokhian, F., Jaafarzadeh, N., and Alesheikh, A. A. (2010). Water quality variability and eutrophic state in wet and dry years in wetlands of the semiarid and arid regions. Environ. Earth Sci. 59, 1397–1407. doi:10.1007/s12665-009-0126-1
Oppenheimer, J. R., Ahmed, M. G., Huq, A., Haque, K. A., Alam, A. K. M. A., Aziz, K. M. S., et al. (1978). Limnological studies of three ponds in Dhaka. Bangladesh J. Fish. Res. 1 (1), 1–28.
Pal, S., and Paul, S. (2020). Assessing wetland habitat vulnerability in moribund Ganges delta using bivariate models and machine learning algorithms. Ecol. Indic. 119, 106866. doi:10.1016/j.ecolind.2020.106866
Pandion, K., Arunachalam, K. D., Dowlath, M. J. H., Chinnapan, S., Chang, S. W., Chang, W., et al. (2023a). The spatial distribution of physicochemical parameters in coastal sediments along the Bay of Bengal Coastal Zone with statistical analysis. Environ. Monit. Assess. 195 (1), 126. doi:10.1007/s10661-022-10568-w
Pandion, K., Dowlath, M. J. H., Arunachalam, K. D., Abd-Elkader, O. H., Yadav, K. K., Nazir, N., et al. (2023b). Seasonal influence on physicochemical properties of the sediments from Bay of Bengal coast with statistical approach. Environ. Res. 235, 116611. doi:10.1016/j.envres.2023.116611
Pearson, T. H., and Rosenberg, R. (1978). Macrobenthic succession in relation to organic enrichment and pollution of the marine environment. Oceanogr. Mar. Biol. 16, 229–311.
Persaud, D., Jaagumagi, R., and Hayton, A. (1993). Guidelines for the protection and management of aquatic sediment quality in Ontario.
Prasad, R., and Rishideo, J. (2021). Analysis of sediment load and its concentration in the lower Gandak Flood plain, North Bihar. International Journal of Emerging Technologies and Innovative Research 8 (11), 92e108.
Pustry, K. B. A., Chandra, R., and Azeez, P. A. (2010). Macronutrients along the sediment profile in a subtropical monsoonal wetland in India. Wetl. Ecol. Manag. 18 (1), 91–105. doi:10.1007/s11273-009-9151-9
Ramachandra, T. V., Sudarshan, P., Vinay, S., Asulabha, K. S., and Varghese, S. (2020). Nutrient and heavy metal composition in select biotic and abiotic components of Varthur wetlands, Bangalore, India. SN Appl. Sci. 2 (8), 1449. doi:10.1007/s42452-020-03228-6
Ramachandra, U., Gupta, T. R. C., and andKatti, R. J. (1984). Macrobenthos and sediment characteristics of Mulki estuary, west coast of India. Indian J. Mar. Sci. 13, 109–112.
Ramsar Convention on Wetlands (2018). Global wetland outlook: state of the world’s wetlands and their services to people. Gland, Switzerland: Ramsar Convention Secretariat.
Reddy, Y., Ganguly, D., Singh, G., Prasad, M. H., Arumughan, P. S., Banerjee, K., et al. (2021). Assessment of bioavailable nitrogen and phosphorus content in the sediments of Indian mangroves. Environ. Sci. Pollut. Res. 28 (31), 42051–42069. doi:10.1007/s11356-021-13638-7
Rienzi, E. A., Fox, J. F., Grove, J. H., and Matocha, C. J. (2013). Interrill erosion in soils with different land uses: the kinetic energy wetting effect on temporal particle size distribution. Catena 107, 130–138. doi:10.1016/j.catena.2013.02.007
Saha, A., Jesna, P. K., Ramya, V. L., Mol, S. S., Panikkar, P., Vijaykumar, M. E., et al. (2022). Phosphorus fractions in the sediment of a tropical reservoir, India: implications for pollution source identification and eutrophication. Environ. Geochem. Health 44 (3), 749–769. doi:10.1007/s10653-021-00985-0
Saha, A., Salim, S. M., Sudheesan, D., Suresh, V. R., Nag, S. K., Panikkar, P., et al. (2020). Geochemistry, mineralogy and nutrient concentrations of sediment of River Pampa in India during a massive flood event. Arab. J. Geosci. 13 (20), 1086. doi:10.1007/s12517-020-06053-8
Saha, A., Vijaykumar, M. E., Das, B. K., Samanta, S., Khan, M. F., Kayal, T., et al. (2023). Geochemical distribution and forms of phosphorus in the surface sediment of Netravathi-Gurupur estuary, southwestern coast of India. Mar. Pollut. Bull. 187, 114543. doi:10.1016/j.marpolbul.2022.114543
Saha, P. K. (2003). “Soil characteristics of importance in aquatic ecosystem in relation to fish health,” in Methods of assessment of aquatic ecosystem for fish health care. Bull. No. 115. Editors V. V. Sugunan, M. K. Das, G. K. Vinci, and U. Bhaumik (India: Central Inland Capture Fisheries Research Institute, Barrackpore), 66–69.
Saha, T. K., and Pal, S. (2019). Exploring physical wetland vulnerability of Atreyee river basin in India and Bangladesh using logistic regression and fuzzy logic approaches. Ecol. Indic. 98, 251–265. doi:10.1016/j.ecolind.2018.11.009
Sahrawat, K. L., and Burford, J. R. (1982). Modification of the alkaline permanganate method for assessing the availability of soil nitrogen in upland soils. Soil Sci. 133 (1), 53–57. doi:10.1097/00010694-198201000-00009
Saluja, R., and Garg, J. K. (2016). Spatio-temporal variability in soil macronutrients and their relation with other soil properties in a man-made wetland of India. . Asian J. Water Environ. Pollut. 13 (2), 83–95. doi:10.3233/ajw-160019
Samanta, S., Debnath, D., Maitra, N., Banerjee, M., Chowdhury, A. N., Sharma, A. P., et al. (2015). Sediment phosphorus forms and levels in two tropical floodplain wetlands. Aquat. Ecosyst. Health Manag. 18 (4), 467–474. doi:10.1080/14634988.2015.1114343
Sankaranarayanan, V. N., and Panampunnayil, S. U. (1979). Studies on organic carbon nitrogen and phosphorus in sediments of the Cochin Backwater. Indian J. Mar. Sci. 8, 27–30.
Sarkar, U. K., and Borah, B. C. (2018). Flood plain wetland fisheries of India: with special reference to impact of climate change. Wetl. Ecol. Manag. 26 (1), 1–15. doi:10.1007/s11273-017-9559-6
Sarkar, U. K., and Karnatak, G. (2016). Importance of conserving wetlands in the context of climate change and adaptation strategies. Souvenir. Mainstreaming Biodiversity. International day for biological diversity. Lucknow, Uttar Pradesh: U.P State Biodiversity Board. Biodiversity for sustainable development. UPSBB, 1–10.
Sarkar, U. K., Mishal, P., Borah, S., Karnatak, G., Chandra, G., Kumari, S., et al. (2020). Status, potential, prospects, and issues of floodplain wetland fisheries in India: synthesis and review for sustainable management. Rev. Fish. Sci. Aquac. 29, 1–32. doi:10.1080/23308249.2020.1779650
Saunders, D. L., and Kalff, J. (2001). Denitrification rates in the sediments of lake memphremagog, Canada–USA. Wat. Res. 35 (8), 1897–1904. doi:10.1016/s0043-1354(00)00479-6
Savic, R., Ondrasek, G., Zemunac, R., Kovacic, M. B., Kranjcec, F., Jokanovic, V. N., et al. (2021). Longitudinal distribution of macronutrients in the sediments of Jegricka watercourse in Vojvodina, Serbia. Sci. Total Environ. 754, 142138. doi:10.1016/j.scitotenv.2020.142138
Sayeed, M. A., Hossain, M. A. R., Wahab, M. A., Hasan, M. T., Simon, K. D., and Mazumder, S. K. (2015). Water and sediment quality parameters in the Chalan Beel, the largest wetland of Bangladesh. Chin. J. Oceanol. Limnol. 33, 895–904. doi:10.1007/s00343-015-4176-9
Seralathan, P., and Seetaramaswamy, A. (1979). Phosphorus distribution in modern deltaic sediments of the Cauvery river. Indian J. Mar. Sci. 8, 130–136.
Shafi, J., Waheed, K. N., Mirza, Z. S., and Zafarullah, M. (2021). A method for soil samples collection during site assessment for aquaculture: sampling method to assess soil for aquaculture. Proc. Pak. Acad. Sci. B. Life Environ. Sci. 58 (1), 99–110. doi:10.53560/ppasb(58-1)639
Simioni, J. P. D., Guasselli, L. A., and Etchelar, C. B. (2017). Connectivity among wetlands of EPA of Banhado Grande, RS. RBRH 22. doi:10.1590/2318-0331.011716096
Song, J. (2011). Biogeochemical processes of biogenic elements in China marginal seas. Springer Science and Business Media.
Sugunan, V. V., and Bhattachariya, B. K. (2000). “Ecology and fisheries of beak in assian,” in Central inland capture fisheries research Institute. West Bengal, India: Barrackpore, 65pp.
Tapader, M. M. A., Hasan, M. M., Sarker, B. S., Rana, M. E. U., and Bhowmik, S. (2017). Comparison of soil nutrients, pH and electrical conductivity among fish ponds of different ages in Noakhali, Bangladesh. Korean J. Agric. Sci. 44, 16–22. doi:10.7744/kjoas.20170002
Upadhyay, R., Pandey, A. K., Upadhyay, S. K., Bassin, J. K., and Misra, S. M. (2012). Limnochemistry and nutrient dynamics in upper lake, bhopal, India. Environ. Monit. Assess. 184, 7065–7077. doi:10.1007/s10661-011-2480-1
Vasistha, P., and Ganguly, R. (2022). Water quality assessment in two lakes of Panchkula, Haryana, using GIS: case study on seasonal and depth wise variations. Environ. Sci. Pollut. Res. 29 (28), 43212–43236. doi:10.1007/s11356-022-18635-y
Venkatesh, M., and Anshumali, (2020). Appraisal of the carbon to nitrogen (C/N) ratio in the bed sediment of the Betwa River, Peninsular India. Int. J. Sediment. Res. 35 (1), 69–78. doi:10.1016/j.ijsrc.2019.07.003
Walkley, A., and Black, I. A. (1934). An examination of the Degtjareff method for determining soil organic matter, and a proposed modification of the chromic acid titration method. Soil Sci. 37 (1), 29–38. doi:10.1097/00010694-193401000-00003
Wang, B., Zheng, X., Zhang, H., Yu, X., Lian, Y., Yang, X., et al. (2021). Metagenomic insights into the effects of submerged plants on functional potential of microbial communities in wetland sediments. Mar. Life Sci. Technol. 3 (4), 405–415. doi:10.1007/s42995-021-00100-3
Weibezahn, F. H., Alvarez, H., and Lewis, W. (1990). Hidroquímica y sólidossuspendidosenel alto y medio Orinoco. The Orinoco River as an Ecosystem, 151–210.
Windom, H. L., Schropp, S. J., Calder, F. O., Ryan, J. D., Smith, R. G., Burney, L. C., et al. (1989). Natural trace metal concentrations in estuarine and coastal marine sediments of the southeastern United States. Environ. Sci. Technol. 23, 314–320. doi:10.1021/es00180a008
Wolf, K. L., Noe, G. B., and Ahn, C. (2013). Hydrologic connectivity to streams increases nitrogen and phosphorus inputs and cycling in soils of created and natural floodplain wetlands. J. Environ. Qual. 42 (4), 1245–1255. doi:10.2134/jeq2012.0466
Wu, G., Gao, J., Li, H., Ren, F., Liang, D., and Li, X. (2023). Shifts in plant and soil C, N, and P concentrations and C: N: P stoichiometry associated with environmental factors in alpine marshy wetlands in West China. Catena 221, 106801. doi:10.1016/j.catena.2022.106801
Zhang, J. Z., Fischer, C. J., and Ortner, P. B. (2004). Potential availability of sedimentary phosphorus to sediment resuspension in Florida Bay. Glob. Biogeochem. Cycles 18 (4). doi:10.1029/2004gb002255
Zhang, Z., Lu, X., Song, X., Guo, Y., and Xue, Z. (2012). Soil C, N and P stoichiometry of deyeuxiaangustifolia and carexlasiocarpa wetlands in sanjiang plain, northeast China. J. Soils Sediments 12 (9), 1309–1315. doi:10.1007/s11368-012-0551-8
Zhang, Z. S., Song, X. L., Lu, X. G., and Xue, Z. S. (2013). Ecological stoichiometry of carbon, nitrogen, and phosphorus in estuarine wetland soils: influences of vegetation coverage, plant communities, geomorphology, and seawalls. J. Soils Sediments 13 (6), 1043–1051. doi:10.1007/s11368-013-0693-3
Keywords: wetland sediments, organic carbon, primary nutrients, geographic information system, ecological stoichiometry
Citation: Das BK, Saha A, Das AK, Chandra P, Mondal K, Kayal T, Chakraborty S, Bhattacharya S, Sahoo BK and Jana C (2024) Assessment of the physicochemical properties of the sediment from the Gangetic floodplain wetlands of West Bengal, India, with GIS and a statistical approach. Front. Environ. Sci. 12:1397715. doi: 10.3389/fenvs.2024.1397715
Received: 11 March 2024; Accepted: 13 August 2024;
Published: 29 August 2024.
Edited by:
Chamindra L. Vithana, Southern Cross University, AustraliaReviewed by:
Raimundo Jimenez Ballesta, Autonomous University of Madrid, SpainItzel Arroyo Ortega, Instituto de Ecología (INECOL), Mexico
Copyright © 2024 Das, Saha, Das, Chandra, Mondal, Kayal, Chakraborty, Bhattacharya, Sahoo and Jana. This is an open-access article distributed under the terms of the Creative Commons Attribution License (CC BY). The use, distribution or reproduction in other forums is permitted, provided the original author(s) and the copyright owner(s) are credited and that the original publication in this journal is cited, in accordance with accepted academic practice. No use, distribution or reproduction is permitted which does not comply with these terms.
*Correspondence: Basanta Kumar Das, YmFzYW50YWt1bWFyZEBnbWFpbC5jb20=