 He Dong1,2
 Xueting Zeng
95% of researchers rate our articles as excellent or good
Learn more about the work of our research integrity team to safeguard the quality of each article we publish.
Find out more
ORIGINAL RESEARCH article
Front. Environ. Sci. , 15 July 2024
Sec. Interdisciplinary Climate Studies
Volume 12 - 2024 | https://doi.org/10.3389/fenvs.2024.1395118
This article is part of the Research Topic Climate Change Vulnerability, Adaptation, and Human Settlements View all 11 articles
In this study, a coupla risk combinations and coping strategies have been developed for confronting conflicts between population–economy development and water resource management (PEWM) due to population–industry transformation (PIT) into a floodplain of the economic belt under climate change. A location-entropy-based PVAR (Panel Vector Autoregression) model coupla-risk analysis (LPCR) can be introduced into PEWM to reflect the adverse effects of population–industry transformation on a special function area (e.g., floodplain) of the economic belt, where the coupla risk map has been addressed. Meanwhile, an adaptive scenario analysis-based stochastic–fuzzy method (ASSF) can be joined to deal with multiple uncertainties and their interactions due to subjective and artificial factors. The proposed LPCR and ASSF can be integrated into a risk-based stochastic–fuzzy scenario method framework (RASF) to apply for a practical PEWM case study of the Yongding River floodplain in the context of the coordinative development of the Beijing–Tianjin–Hebei economic belt, China. The results can be presented as follows: 1) the PIT was accelerated into the floodplain due to the fact that it can require more water resources, where each additional unit can promote the regional gross domestic product (GDP) by 0.019 units, increasing the water demand by 0.046 units. It can strengthen various risks such as water shortage, soil loss, and flood control investment in a floodplain of the economic belt; 2) the farmland returning to wetland (CFW) can decrease the water demand and shortage ratio (would be 0% at highest) for irrigation in the long run, but this would reduce the direct economic income of irrigation in the short run; 3) backward irrigative schemes and low water utilization efficiency require a cleaner production mode, which could reduce water shortages by 77.23 × 10^3 m3 at the highest; and 4) the combined policy (S12) can reduce coupla risks (including the risk of water shortage, soil loss, and flood) compared to other individual policies (S2, S4, S6, and S8). The findings can assist local decision-makers to gain insights into adjusting interegional strategies not only for remitting population–resource stress in core cities but also for improving the resilience against drought and flood in a floodplain area, which is conducive of the special function of the floodplain to support an integrated sustainable development of the economic belt.
The development of urbanization agglomeration based on new function design for a reginal collaborated goal can accelerate industrial relayout and population movement in an economic belt, which has accelerated populations and industries concentrated in core areas (such as key cities) and also radiation-driving population and economy into the specialized function areas (such as flood storage areas) surrounding central cities (White et al., 2007; Halkos et al., 2016). It could cause siphonic effects (such as urban disease, resource crisis, and environmental pressure) for core areas and surrounding special function areas (such as the floodplain area surrounding key cities in an economic belt), which would increase the drought–flood challenge under climatic changes. On the one hand, excessive human activities due to population–industry transformation (PIT) into the floodplain from the core cities need more resource supply (e.g., water or land), which causes great pressure due to limited natural capacity. On the other hand, the urbanization process can disturb the surface circulation characteristics of precipitation and destroy soil storage capacity, which would damage the source function of the floodplain. In addition, climate change can enhance population–economy exposure by the drought–flood risk due to extreme events (Yu et al., 2016; Kumar et al., 2017; Li et al., 2019; Park et al., 2023). All the above issues can potentially increase the risk of disaster, drought, and loss of flood control investment. Therefore, how to identify the anthroponatural influence on the floodplain due to PIT and climate changes is an important issue in the sustainable development of the economic belt.
Previously, various researchers have focused on the effects of excessive human activities and climate changes in some special function location areas. For example, Prokop and Ploskonka (2014) analyzed historical reports, combined topographic maps, and satellite images to study the effect of excessive human activities on land use and soil properties. Zhang et al. (2020) used ecological risk assessment methods to reflect the adverse influence of high population density and urban expansion on ecological properties, land use structure, and environment in Chinese coastal areas. Guo et al. (2023) used Pearson’s correlation and a fixed-effects model to analyze the impact of climate variations and unreasonable human activities on grassland productivity. In general, previous research has focused on the simulation method, risk assessment, and statistical analysis model for reflecting drought and flood stress due to population–economy development, which indicated that population–economy development would cause a great challenge for population–economy development and water resource management (PEWM). Therefore, a number of research works have displayed effective ways (e.g., optimization method, adaptive management mode, and policy analysis) to balance the relationship between population–economy development and water resource management. For instance, Viljoen and Booysen (2006) introduced a strategic approach to flood damage assessment and control, integrated into the disaster management policy framework, with the aim of addressing the risks arising from large-scale urbanization and population growth enabling large numbers of people settling and living in urban areas and their surrounding floodplain areas. Zhang and Song (2014) proposed a site-specific model combined with nine scenarios to optimize the spatial distribution and functional areas so as to maximize the risk of high population density and large economic outputs and improve the benefits while improving the ecologic environment. Zeng et al. (2021) designed a wetland reallocation (WR) plan to remit conflict among human activities, flood control, and ecological protection. Previous research presents various engineering methods (such as withdrawn farmland project, wetland construction, and water diversion) and policy regulations to confront the negative effects of excessive human activities.
However, a number of uncertainties and their interactions in a PEWM issue can enhance the difficulty of generating effective and adaptive policies in a floodplain of the economic belt. For instance, PIT into the floodplain can generate new water use structures, leading to changed water demands. Meanwhile, the process of urbanization can have destructive effects on the floodplain, which would reduce the played function, leading to flood risks and water shortage. Under climate change, random precipitation (such as extreme rainfall), regarded as stochastic factors, can drive floods and droughts, which would result in net system benefit fluctuation due to spatial and temporal variations. Based on these situations, multiple uncertainties and their interactions can enhance the complexity of PEWM in a floodplain area of the economic belt, which requires more robust methods. Therefore, two-stage stochastic programing (TSP) has been joined to build a linkage between changed water need (due to population–industry transformation) and random water flow on a floodplain of the economic belt, which can generate a comprehensive plan based on recourse actions if the pre-regulated targets are violated (Zeng et al., 2019; Nematian, 2023). However, TSP cannot handle fuzziness in response to limited data (such as data error and deficiency). Thus, fuzzy programing (FP) can be introduced to increase the expression of ambiguity (Huang and Loucks, 2000; Inuiguchi, 2012; Zeng, et al., 2021; Nematian, 2023). In addition, a scenario analysis is embedded to reflect the potential future outcomes with the aim of supporting the generation of effective and adaptive policies (Peterson, et al., 2003; Swarta, et al., 2004; Kumar et al., 2016; Kumar et al., 2017; Liu et al., 2023). Nevertheless, few research works have proposed hybrid methods (e.g., TDSP, FCP, and SA) into a framework to deal with multiple uncertainties for confronting adverse effects of excessive human activities and climate change on a floodplain of the economic belt.
Therefore, the objective of this study is developing a coupla risk combinations and coping strategies for confronting conflicts between PEWM due to population–industry transformation of an economic belt under climate change. A coupla risk-based stochastic–fuzzy scenario method framework (RASF) has been proposed to reflect anthroponatural impacts and optimize the relationship of PEWM under uncertainties, which integrates a location-entropy-based PVRA model coupla-risk analysis (LPCR) and an adaptive scenario analysis-based stochastic–fuzzy method (ASSF) into the RASF framework. Among them, RASF can be introduced to reflect the adverse effects of PIT and climatic changes in a human–water system (HWS), where coupla risks have been shown in the risk maps of the floodplain in the processes of urban agglomeration. Meanwhile, the ASSF is transformed into the RASF to deal with multiple uncertainties. The proposed RASF is applied to a practical case study of the Yongding floodplain, China. The results were obtained to contemporarily reflect the negative effects of PIT in the context of the coordination of Beijing–Tianjin–Hebei urban agglomeration and corresponding damages, function degradation, and its risks. Meanwhile, the results obtained under various policy scenarios (such as farmland returning to wetland (CFW), improvement in water resource utilization efficiency, water diversion, and flood control) can be designed to recover the source function of the floodplain, which is effective in adjusting current population–economy strategies and water management patterns in a risk-averse and sustainable manner.
The Beijing–Tianjin–Hebei economic belt (BTHEB) is located in the heart of the Bohai Sea, which is the largest and most vigorous region in northern China. It entered the high-speed development channel from 2015 due to the implementation of the Beijing–Tianjin–Hebei coordinated development strategy (Wang, 2023). The new function design of each cities based on a comprehensive function for a cross-reginal collaborated goal can accelerate industrial relayout and population movement. Central cities can distribute labor-intensive industries to backward areas for optimizing their industrial structure and release resource–environment stress, but this would cause new ecological challenges for some backward areas. In particular, in some special function location areas (e.g., stored floodwater district) of backward areas, excessive human activities due to the mitigation of the population and industry can damage the source function to reduce the resource–environment-carrying capacity, leading to various negative effects. For instance, the Yongding River floodplain in Hebei Province has undertaken the responsibility of protecting the flood control safety of Beijing, Tianjin, and Hebei areas (as shown in Figure 1). In the past half century, it has always been considered an effective measure to enhance the flood storage capacity of water conservancy projects and reduce the flood disaster in the Beijing–Tianjin–Hebei (BTH) region. Meanwhile, since it is seated in the semi-arid climate zone and warm temperate zone, the weather condition is suitable for irrigation. Thus, more land resources have been exploited as irrigative land in recent decades, which can support the pillar position of agriculture in Hebei Province.
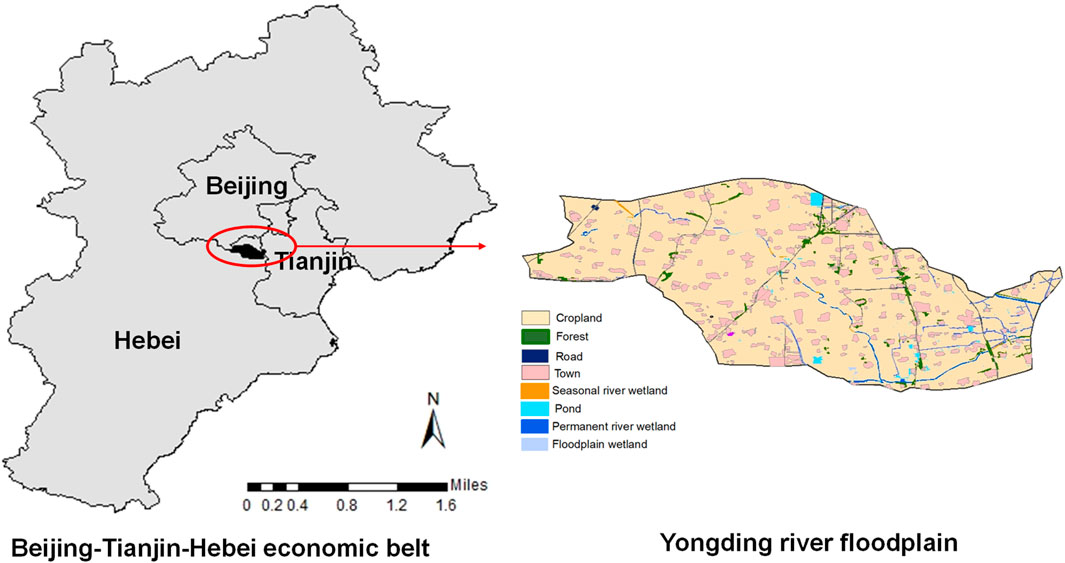
Figure 1. Study area.
However, in the context of the coordination of the BTHEB, a number of backward industries have been transferred to Hebei Province due to the new function design of the BTHEB. Under these situations, more populations can be driven by industrial transformation, which would have negative impacts on the Yongding River floodplain (Men, et al., 2017): 1) driven population due to industrial transformation into the floodplain can change water demand scales and structures, which would not only enhance water stress in dry seasons but also accelerate excessive water utilization and exploitation, leading to the reduction in ecological water and water resource conservation capacity; 2) dense population–economic distribution in the function of flood storage and detention areas can increase the exposure risk of drought and flood, leading to potential disaster and losses in flood control investments. Meanwhile, it is quite difficult to move out populations and disperse related industries, which would intensify the destruction of soil storage and storage capacity; 3) excessive water-resource exploitation and irrational irrigative schemes can accelerate soil erosion as the rain is washed away, which would not only result in land function generation but also lead to increased water shortages; and 4) the randomness of rainfall and available water resources due to climate change can increase the difficulty of water resource management. Therefore, identifying the negative effects and corresponding risks due to PIT would be an important step to remit conflict between the human–water interaction in the Yongding River floodplain; meanwhile, various coping strategies (such as withdrawn farmland project, wetland construction, and water diversion) and uncertain programming should be designed to improve decision-making in a risk-averse and robust manner.
In this study, a RASF has been developed to reflect the anthroponatural impact and optimize a PEWM issue in the context of the coordinative development of the BTHEB (as shown in Figure 2).
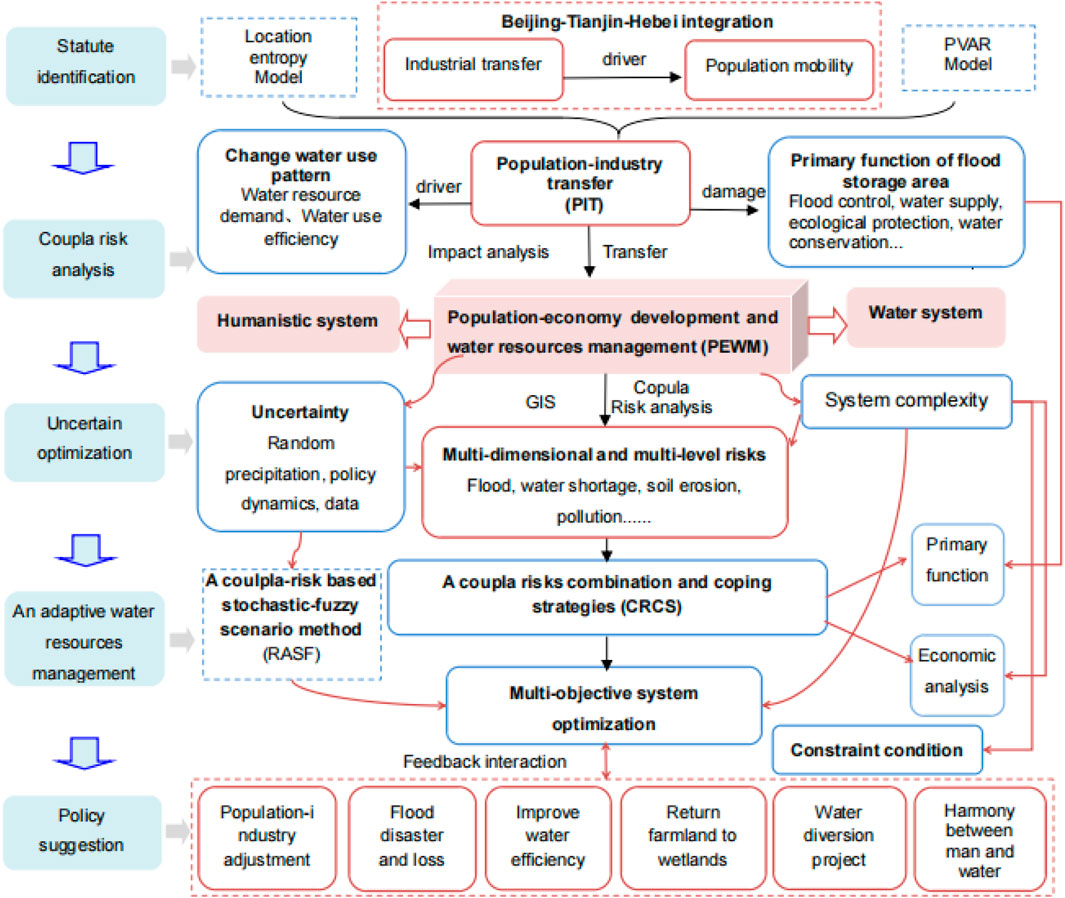
Figure 2. Framework of coupla risk-based stochastic–fuzzy scenario method (RASF) for optimizing a population–economy development and water resource management (PEWM) issue.
In this RASF, the tendency of PIT and mitigation based on the aggregation extent of the population industry can be reflected by the location entropy method according to the coordination of the BTHEB. Location entropy is generally used to measure the spatial distribution of factors in a region and the status and role of a region in the country. Among them, the industrial location entropy value can be modulated as shown in Eq. 1.
where E denotes the industrial location entropy value;
The population location entropy value can be modulated as shown in Eq. 2.
where
Then, the effects on water resources due to PIT can be responded by the PVRA model. Under these situations, water-need scales and use patterns can be changed by PIT, which would consume more water resources, damage the capacity of soil conservation, and increase potential flood loss, enhancing various risk levels in the long term (Johannes and Leeuwen, 2017). Therefore, a risk assessment combining the geographic information system (RG) can be used for reflecting various risks (including water and soil erosion, flooding risk, and water shortage), where the soil loss risk can be calculated by the empirical model Revised Universal Soil Loss Equation (RUSLE) according to the land use in the Yongding River basin as shown in Eq. 3.
where A denotes the annual soil loss; R denotes the rainfall erosivity factor; K denotes the soil erosion factor; L denotes the slope length; S denotes the slope factor; C denotes the ground cover management; and P denotes the soil and water conservation measure factor. Meanwhile, flood risk can be measured by precipitation, topography, surface water resources, and land use types as shown in Eq. 4.
where F is the flood risk value; R is the rainfall erosivity factor; SW is the amount of surface water resources; and
However, the above individual risk regarded as uncertainties can be influenced by both objective and subjective factors; meanwhile, the correlation among various risks would increase their complexity. In general, the traditional risk calculation system cannot deal with these complexities, which require an effective way. Thus, a coupla function can be introduced to measure the dependence of multidimensional variables (or indicators), as shown in Figure 3. Based on coupla risk analysis, a comprehensive plan with policy scenarios should be designed to confront the drought–flood challenge due to PIT into a floodplain of the economic belt. However, in the conflicts between PEWM, multiple uncertainties (such as random precipitation due to climate change, changed water utilization due to PIT, dynamic policy due to the coordination of the BTH belt, and fuzzy engineering effects and benefits) can enhance the complexity of the PEWM issue. Thus, an ASSF can be proposed for handling uncertainties (as shown in Supplementary Appendix SA1).
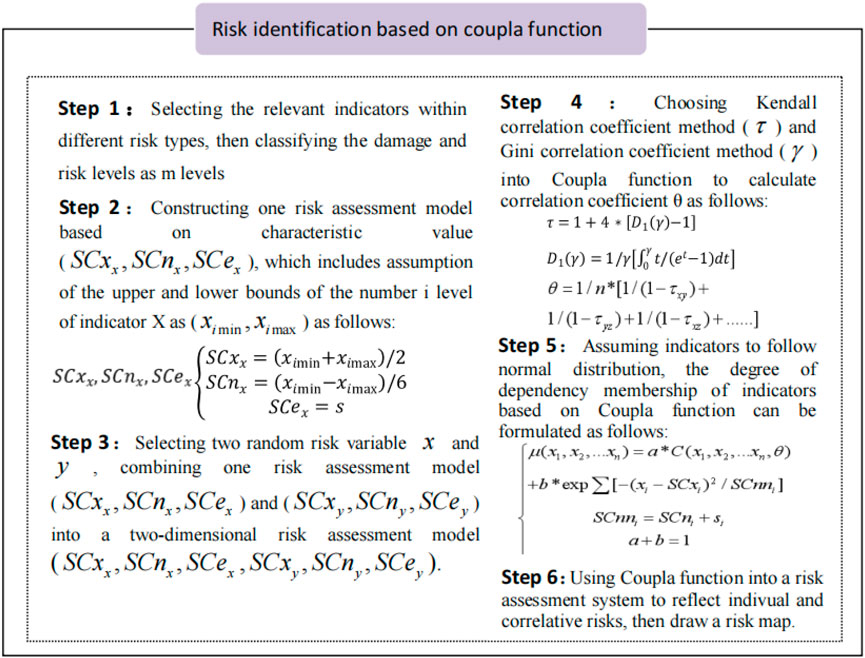
Figure 3. Risk identification based on the coupla function.
In the study region, decision-makers in a floodplain of the economic belt strive to allocate water resources to meet increasing water needs due to PIT in the dry season; meanwhile, they propose to control flood damage and risk in the flooding season. Under the background of coordination strategies in the BTHEB, the expected water demand was increasing because PIT may exceed what the natural system can afford in the dry season, leading to water shortage losses. Meanwhile, excessive and irrational water use patterns (such as irrigative schemes) may damage the water/soil conservation capacity of the floodplain, which would result in indirect environmental penalties. Moreover, flood event occurrence can cause economic loss in the flooding season. To cope with these problems, an optimal PEWM model with various scenarios (such as withdrawn farmland project, wetland construction and water diversion, population–economy policy, and water management pattern) can be designed, which could not only recover the source function of the floodplain but also maximize benefits with the consideration of risks as shown in Eq. 5.
In Eq. 5,
The data contain both natural and economic aspects, which include human living, agriculture, industry, service, landscape, and wetland. Among them, since random rainfall can impact available water resources, five water availability levels (i.e., very low, low, medium, high, and very high levels) are considered, of which the corresponding probabilities would be 0.1, 0.2, 0.4, 0.2, and 0.1 simulated by previous precipitation from 2005 to 2018 (SYH, 2006–2016; WRH, 2006–2016). Meanwhile, the economic data (as shown in Table 1) can be calculated by the expert evaluation method according to regional statistical yearbooks (SYH, 2006–2016; WRH, 2006–2016) as fuzzy sets.
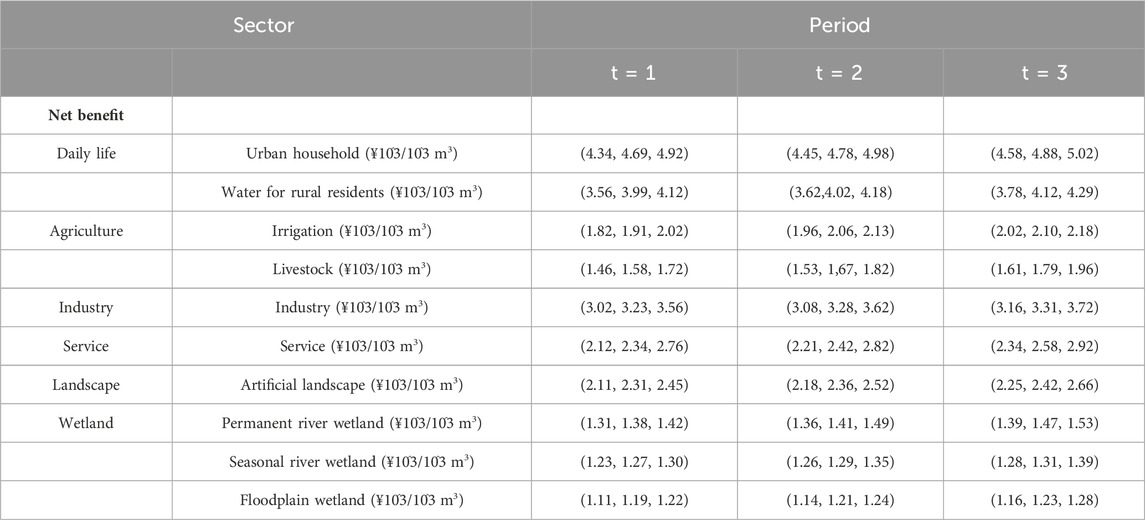
Table 1. Fuzzy sets of economic data.
In addition, in order to reduce water shortage in the dry season and flood risk in the flooding season, various policy scenarios can be designed as follows: 1) scenario 0 (S0) is the basic scenario presenting current population–industry development and water resource management; 2) various individual policies (including improvement in water resource utilization efficiency, water diversion, and farmland returning to wetland) can be considered. Among them, scenarios 1–4 (S1–S4) display the policies with the improvement in water-use efficiency by prompting water saving and recycling ratios (0%, 5%, and 15%). Scenarios 5–6 (S5–S6) show that farmland returning to wetland, where the constructed wetland would be 2 and 4 times the area under S0. Scenarios 7–8 (S7–S8) present policies associated with water diversion to remit water shortages; and 3) scenarios 9–12 present mixed policies based on S1–S8.
In order to reflect the adverse impact of PIT on specific functional areas (such as the floodplain), the location entropy method can be used for reflecting the aggregation extent of the population and industry in the given location, which would indicate the tendency of PIT and mitigation based on the strategy of the BTHEB. The results (as shown in Figure 4) present that the location entropy of agriculture in Beijing and Tianjin decreases continuously, but the agriculture in Hebei is better than that in Beijing and Tianjin due to the function of the BTHEB. Meanwhile, the location entropy of the industry in Tianjin and Hebei provinces would increase, but it would decrease in Beijing, which indicated the industrial transformation from Beijing to Tianjin and Hebei provinces. Moreover, the location entropy of the tertiary industry in Beijing is still much higher than that in Hebei and Tianjin. Based on industrial transformation, the population concentration in Beijing and Tianjin would be higher than that in Hebei Province from 2002 to 2014. However, the entropy of population in Hebei Province was increased from 2015, which indicates that the driven effect of industrial transformation would increase the population concentration in Hebei Province.
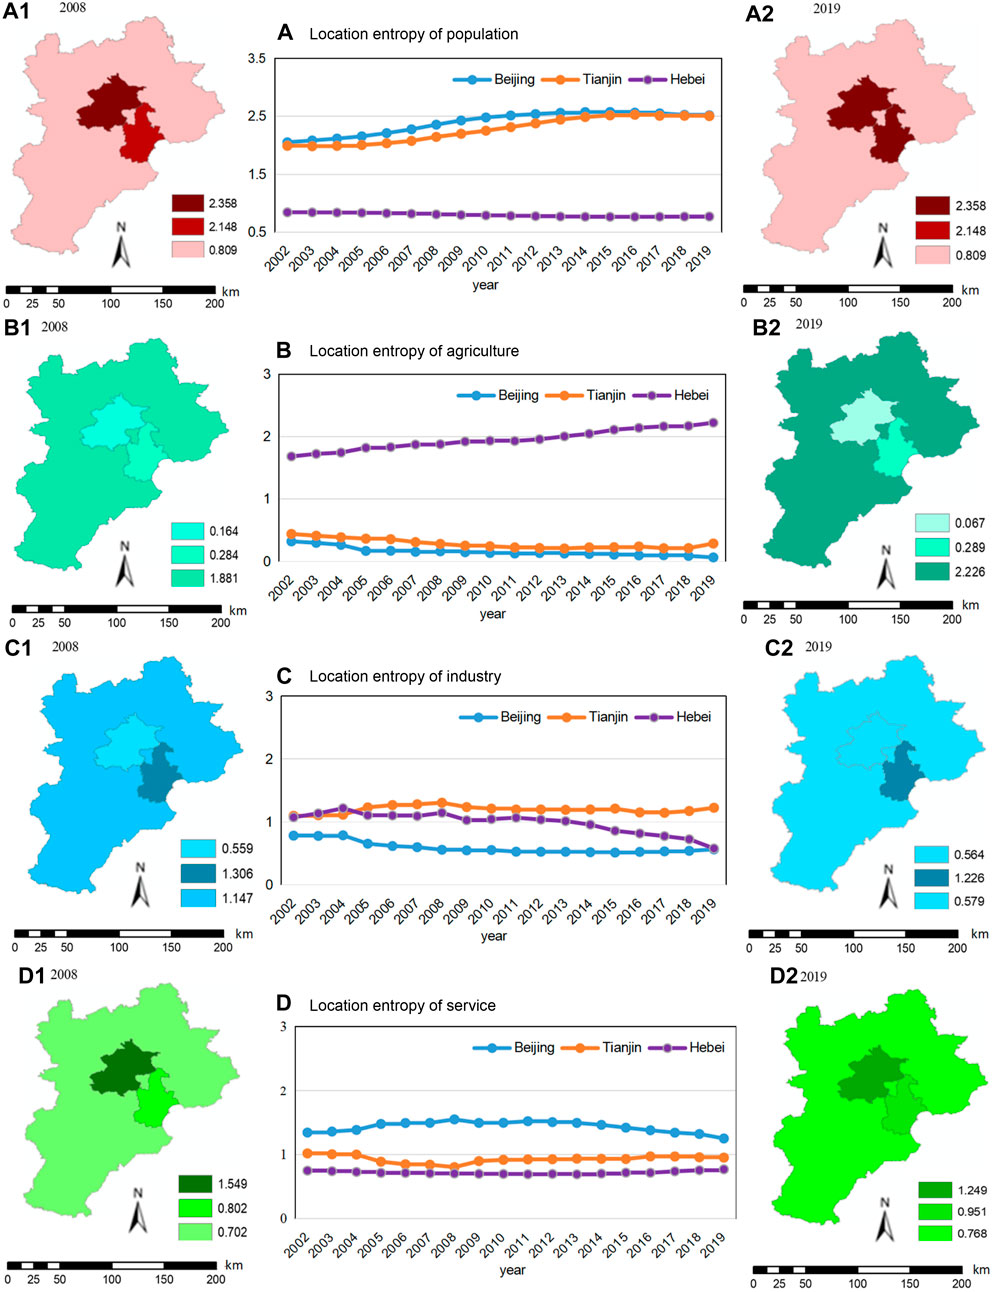
Figure 4. Location entropy of population–industry transformation in the Beijing–Tianjin–Hebei economic belt (BTHEB) from 2002 to 2019.
Under the situations of PIT, the effects of PIT on water resource management in the Yongding River floodplain of Hebei Province were tested by the PVRA model. Table 2 displays the stability of the data by the ADF test, which indicated that all the indicators would be stationary time-series data, meeting the preconditions of model estimation, impulse response, and variance decomposition, where C, T, and P, represent whether there is a constant term, a trend term, and a lag and the lag order, respectively. Meanwhile, according to the test results of AIC, SBIC, and HQIC under different lag orders, when each variable lags for three periods, it is consistent with the result that AIC, SBIC, and HQIC have the smallest amount of information. Therefore, the optimal lag period of the model is determined as three periods.
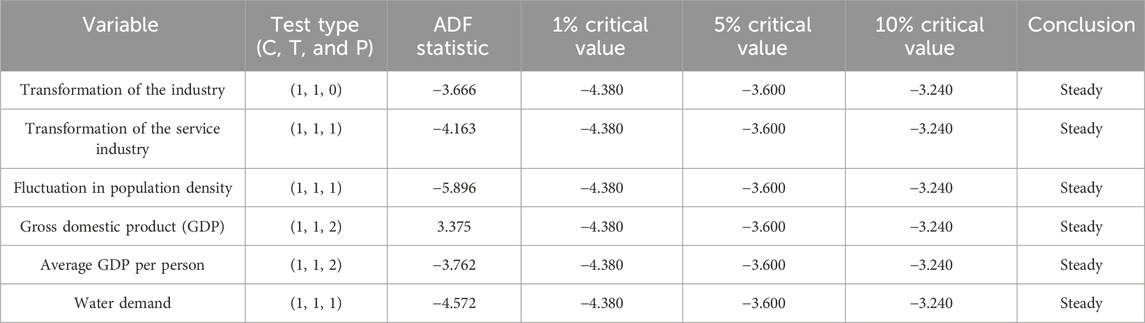
Table 2. Test data stability results by the ADF test.
Table 3 shows that industrial transformation into the floodplain can promote the gross regional product (GDP) and average GDP per person significantly at the level of 5% and also increase the water demand at the level of 1%. Each additional unit can promote the regional GDP by 0.019 units and increase the water demand by 0.046 units, which should drive the improvement in water-saving technology. However, service transformation has a positive impact on regional economic growth but increases the water demand than the industry.
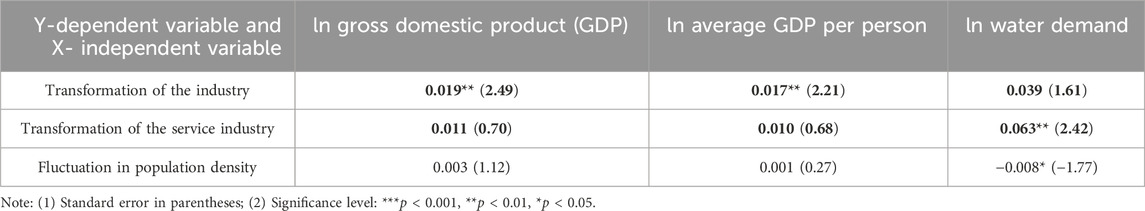
Table 3. Empirical test results of the impact of population–industry transition on water resources.
Since PIT into a floodplain would increase the water demand for various water sectors (such as daily life, industrial use, and agriculture), it causes great stress on water resources, leading to corresponding risks. Figure 5 presents the risks of water shortage, soil loss, and loss of flood control based on the current population–industry scale in period 1 under S0 when α is 0.6. Based on the basic scenario (under S0), water shortage would occur since the expected water demand for the current population–industry scale cannot be satisfied in dry seasons when α is 0.6 and vice versa. Among various sectors, the irrigation has the highest water shortage, which indirectly influences the water availability in the landscape and wetland protection. For example, the water-deficit area for irrigation would be 9.36 × 10³ ha when water flow is low. Nevertheless, excessive human activities would increase the risk of flood in flooding seasons.
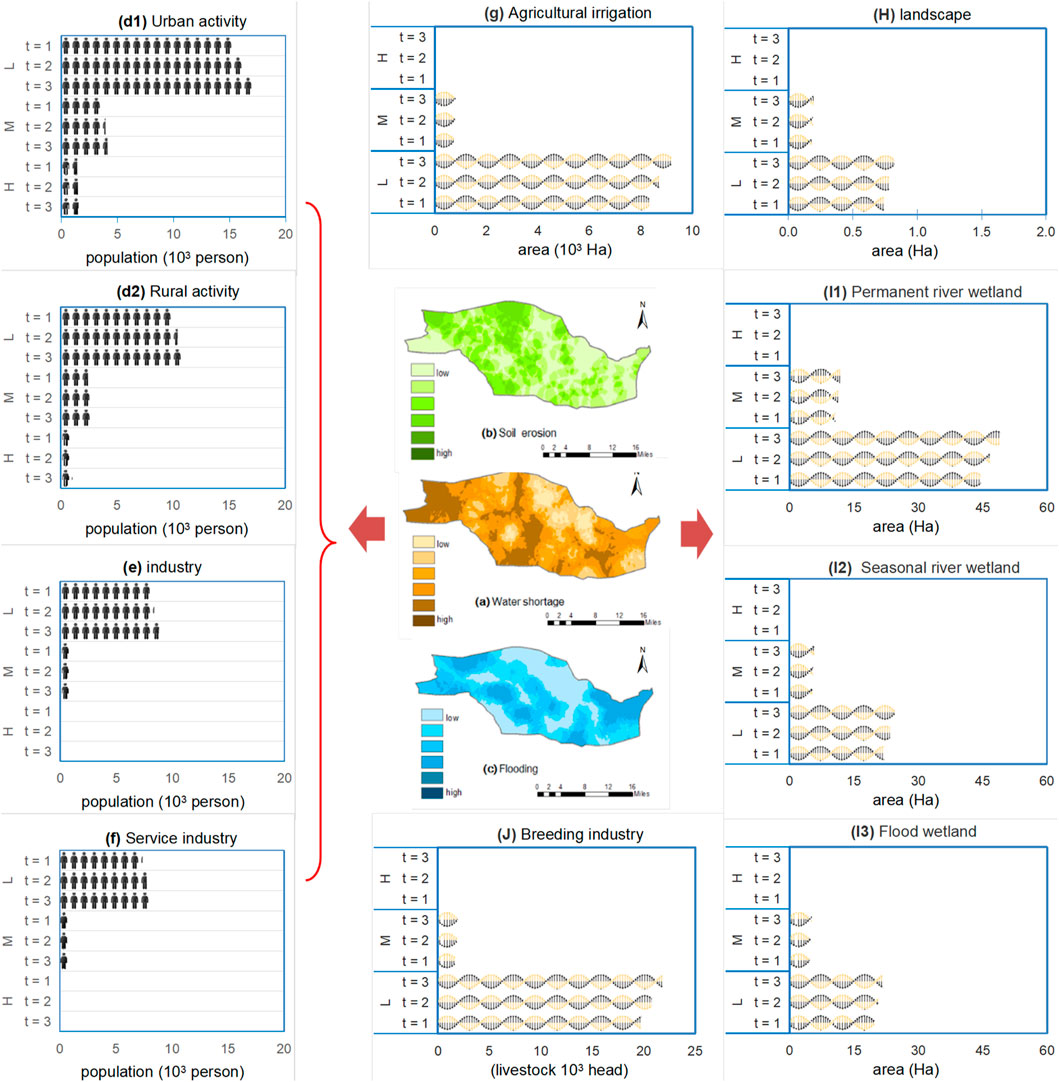
Figure 5. Risks of water shortage, soil loss, and flood control based on the current population–industry scale in period 1 under scenario 0 (S0) when α is 0.6.
In order to reduce water shortage, technique improvement (water saving and recycling) can be designed under S1–S4, which can present the total water shortage among various water use sectors when α is 0.6 (as shown in Figure 6). The results show that improvements in water saving and recycling could prompt water utilization efficiencies, which would reduce water shortages, particularly in the wet season. For example, the water shortages would be 77.23 × 10³ m3 and 48.34 × 10³ m3 under S1 and S4, respectively, when water flow is low. Although technique improvement can be deemed as an effective method to reduce water shortage, the high cost of generalization would be a big challenge for policymakers on the Yongding River floodplain of the BTHEB.
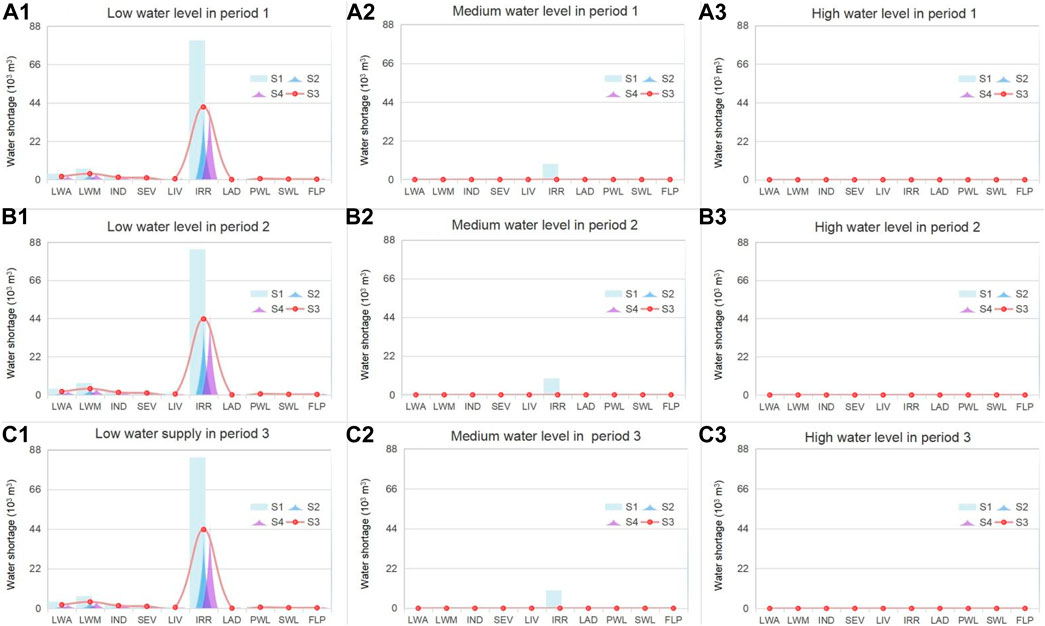
Figure 6. Total water shortage under various water levels among various industrial sectors with the consideration of technique improvement (S1–S4) when α is 0.6.
The CFW project can be deemed as an effective method to encourage the improvement in source functions (i.e., flood control, remit shortage, and mitigation of pollution) in a floodplain area, which can remit pressure due to overdeveloped irrigation. Figure 7 displays water shortages and corresponding shortage ratios between irrigation and wetland with CFW (S5–S6) when α is between 0.6 and 0.99. In this region, CFW can decrease the water demand and shortage ratio for irrigation in the long run, but this requires water resources to guard CFW. Meanwhile, CFW can prompt the risk control in the flooding season, but this would reduce the direct economic income of irrigation in the short run. Therefore, how to balance the tradeoff between short-term losses for output reduction in irrigation and long-term benefits for flood damage reduction can be an important issue for policymakers in floodplains.
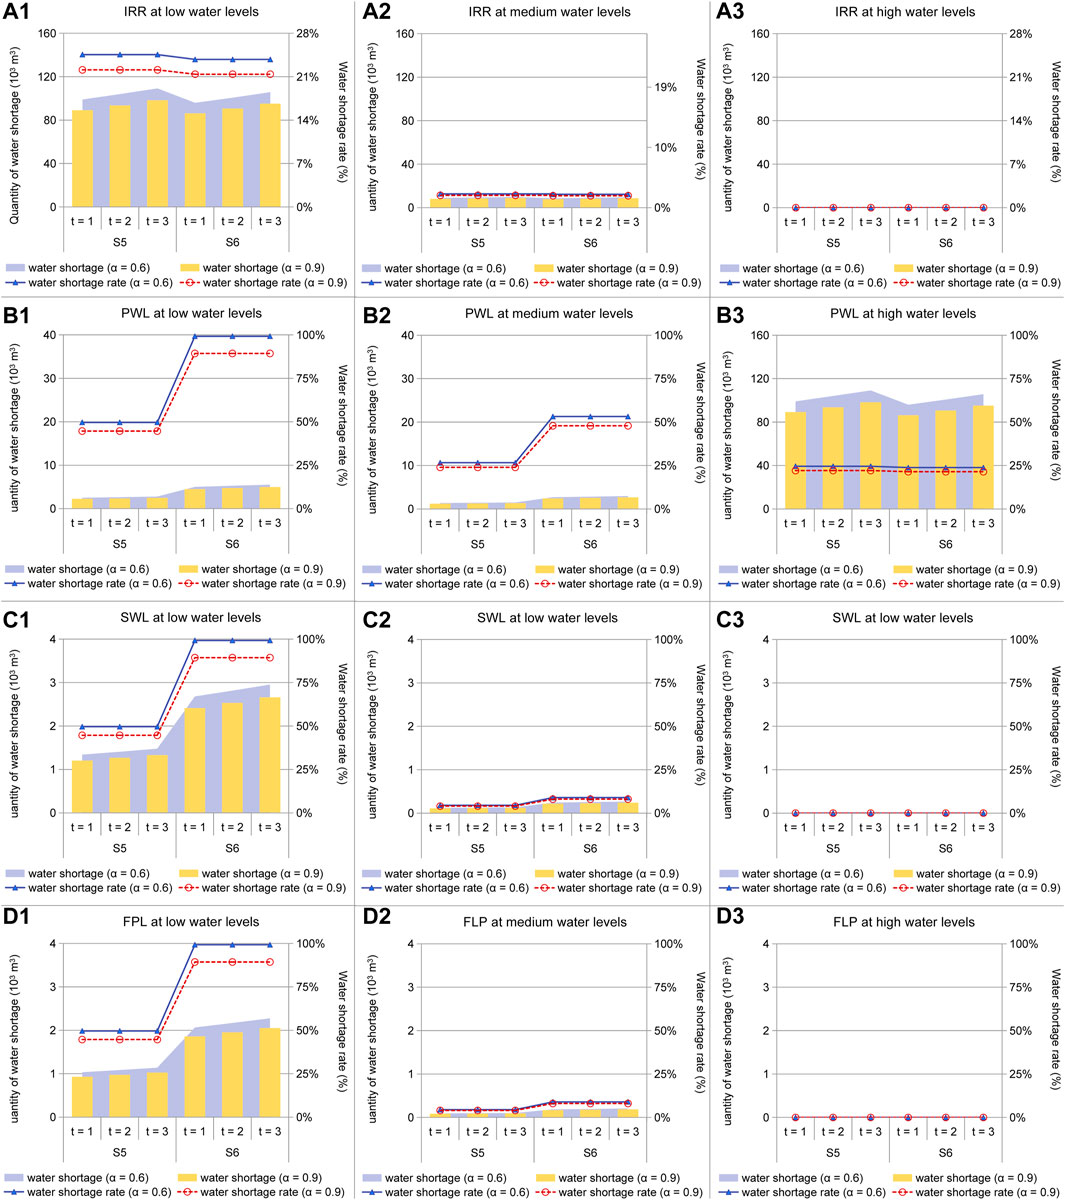
Figure 7. Water shortage and corresponding shortage ratios between irrigation and wetland with the consideration of withdrawn farmland to wetland (S5–S6) when α is between 0.6 and 0.99.
Figure 8 displays optimal water allocations with the consideration of water diversion (S7–S8) when α is between 0.6 and 0.9. In the comparison of various water use sectors, water allocation in irrigation can be highest to indicate its key role in the study region. However, the backward irrigative scheme can be deemed as an obstacle, which results in higher water shortage in the dry season. Water diversion (e.g., south–north water transfer project) can solve water deficiency to improve the satisfaction rate of optimal water allocation. For example, the optimal water allocation would be 315.43 × 10³ m3 and 378.25 × 10³ m3 under S7 and S8, respectively, when water flow is low in period 1, which would be better than the situation under S1. In addition, several α levels can reflect various credibility satisfaction levels by different combinations of fuzzy sets, which indicated that a lower credibility satisfaction level would correspond to higher water availability, leading to higher water allocation and vice versa.
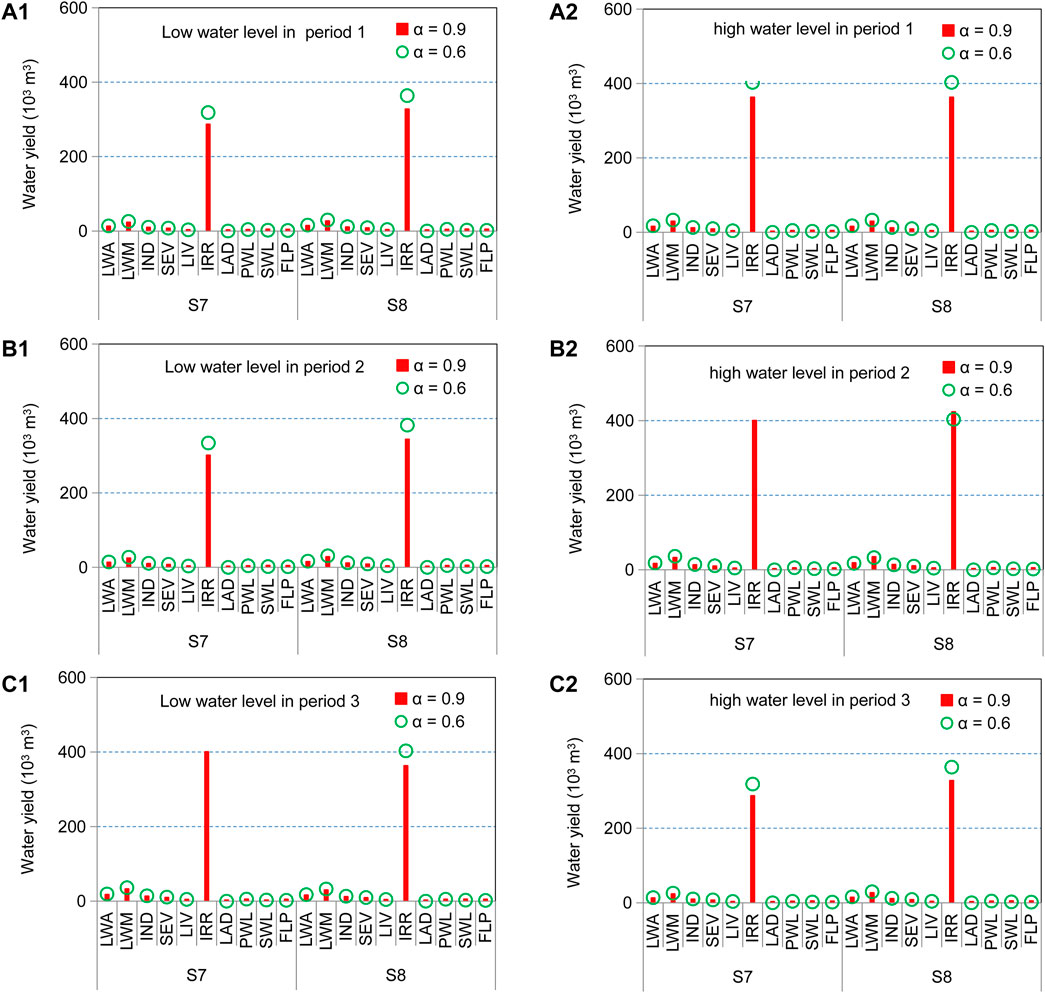
Figure 8. Optimal water allocations with the consideration of water diversion (S7–S8) when α is between 0.6 and 0.9.
In the study region, the concurrence of water deficiency due to PIT into the floodplain in the dry season and flood risk due to functional degeneration of the floodplain would increase the difficulty of decision-making. Thus, water shortage and flood control (WSFC) can be taken into account at the same time for policymakers; meanwhile, mixed policy implementation (including the improvement in water resource utilization efficiency, water diversion, and farmland returning to wetland) can be considered in the the WSFC issue (as shown in Figure 9). Figure 9 shows water shortages and flood controls under S0–S12 when α is between 0.6 and 0.9. The results display that mixed policies (such as S10 and S12) have a better effect than the individual policies (S0, S2, S4, S6, and S8) in water shortage. Meanwhile, S6 has a good result in flood control, but it has little ability to reduce water shortages.

Figure 9. Water shortages and floods under S0–S12 when α is between 0.6 and 0.9.
Figure 10 shows coupla risks of water shortage, soil loss, and flood control under S0–S12 when α is 0.6. Among them, S2 and S4 (technique improvement) have the advantage of risk control in water shortage instead of soil loss and flood control. Meanwhile, S8 (water diversion) has the highest risk-control level for water shortages. Moreover, S6 (withdrawn farmland to wetland) is effective in reducing risks of soil loss and flood control, but it requires more water resources to increase water-shortage risks. In comparison, the combined policy (S12) can reduce coupla risks (including risks of water shortage, soil loss, and flood) than other individual policies (S2, S4, S6, and S8).
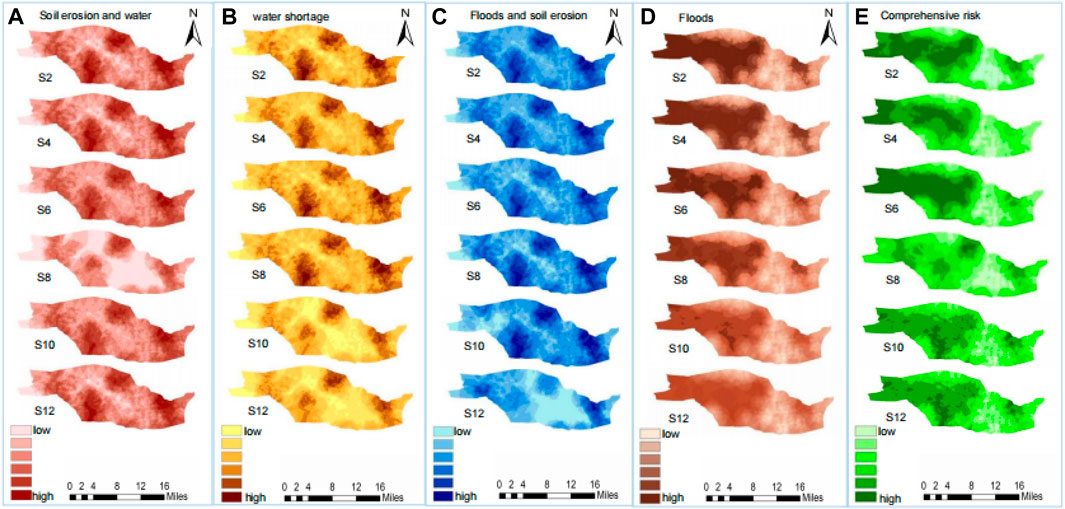
Figure 10. Coupla risks of water shortage, soil loss, and flood under S0–S12 when α is 0.6.
Figure 11 displays system benefits under S1–S12 when α is between 0.6 and 0.9. The current population–industry scale due to PIT into the floodplain can increase the loss of water in response to limited water resource-carrying capacity, which would lead to a lower system benefit under S1. The current technical level can only support water-saving and recycling techniques increased by 9% at highest (under S3). Although CFW can bring about a higher benefit in a long run, lower direct economic incomes from wetland construction would generate lower benefits in the short run (S5 and S6). Since the cost of water diversion is relative low for floodplain in the context of the south-to-north water diversion project funded by the state, it can remit the losses of water shortage for current population economy pattern in the mass, which would bring about higher benefits (S7 and S8). A comprehensive combined policy (including improvement of technique, CFW, water diversion) would bring about better results for water shortage reduction, which can lead higher benefits (S9–S12).
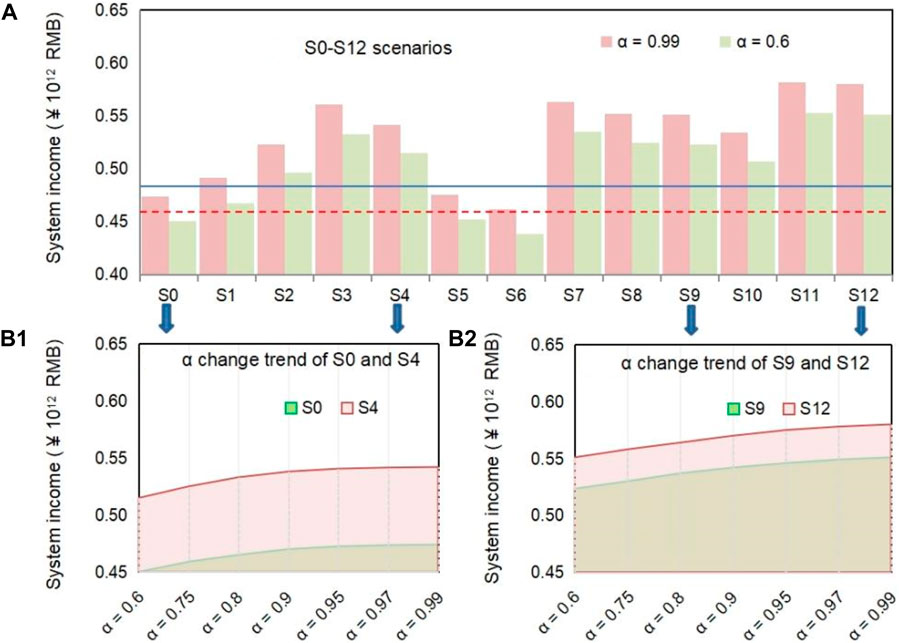
Figure 11. System benefits under S1–S12 when α is between 0.6 and 0.9.
In this study, an ASSF has been developed for planning a PEWM issue under various risks from artificial and natural uncertainties, which has the following advantages: 1) a location-entropy-based PVRA model can assess adverse effects on water resources in the floodplain due to PIT in the process of urban agglomeration; 2) coupla-risk analysis can combine various types of risks (including water shortage, soil loss, and flood control) as coupla risk maps; 3) an ASSF can deal with water resource planning problems resulting from randomness in water flow that is expressed in a probabilistic way due to data deficiencies; 4) it can reflect the tradeoffs between the predefined economic targets and the associated water shortage penalties/flood losses, as well as the fuzziness of the water availability (i.e., fuzzy way).
The applications of ASSF for balancing the relationship between population–economy development and water resource management in the Yongding River floodplain can support decision-makers in identifying the coupla risk combinations and coping strategies, which are worth implementing in other places as follows: 1) in the process of economic belt formation, PIT can promote the regional productivity of the floodplain, but it would also damage its source function, causing new challenges of climate change for the entire economic belt. Thus, PIT scales into the floodplain should be regulated by policymakers with the consideration of coordinated goal coupling economic and ecological targets; 2) CFW can recover the source function of the floodplain to reduce the coupla risk of water shortage, soil loss, and flood, which can be advocated in some special function areas (such as ecological protection or floodplain area) to support the resource carrying capacity of the economic belt; 3) unpredictable climate shocks, limited data availability, and policy interaction can increase the complexity of the PEWM issue, which would pose new threats for interregional decision-makers in the economic belt. The ASSF has been developed to help them handle multiple uncertainties caused by objective and subjective factors, which can reduce the adverse effects and flood-disaster damage caused by climate change in a floodplain. All the above experiences and inspiration can be generalized to the area where the economic belt is initially formed, particularly in developing countries.
Using the PEWM in the Yongding River floodplain, the following discoveries were obtained: 1) in the context of the “strategy of Beijing–Tianjin–Hebei coordinated development” (from 2013), the driven effect of industrial transformation would increase the population concentration in the Yongding River floodplain (Hebei Province) from 2015. Accelerated PIT into the floodplain can require more water resources, where each additional unit can promote the regional GDP by 0.019 units, increasing the water demand by 0.046 units. It can strengthen various risks such as water shortage, soil loss, and flood control, which needs a comprehensive regulation of PIT into the floodplain based on its source function to support a sustainable PEWM in the floodplain of the economic belt; 2) CFW can decrease the water demand and shortage ratio for irrigation in the long run, but this would reduce the direct economic income of irrigation in the short run. It can be deemed as an effective method to restrict excessive land exploitation and recover the source function of the floodplain in an economic belt. The obtained results show that the lowest water shortage ratio in irrigation and CFW would be 0% and when water flow is high; 3) backward irrigative schemes and low water utilization efficiency are not accommodated by the regional water carrying capacity in the study area. Thus, cleaner production modes and water-saving patterns should be introduced into the PEWM issue to remit the water crisis from the water-use side. The results show that improvement in water saving and recycling could reduce water shortages by 77.23 × 10^3 m3 and 48.34 × 10^3 m3 under S1 and S4, respectively, when water flow is low; 4) an individual policy has its own advantages to control single risk, but it is not suitable for complex risk combinations in a practical PEWM issue. For instance, S2 and S4 (technique improvement) have advantages of risk control in water shortages instead of soil loss and flood control. Meanwhile, S8 (water diversion) has the highest risk control level for water shortages. Moreover, S6 (withdrawn farmland to wetland) is effective in reducing the risks of soil loss and flood, but it requires more water resources to increase the water shortage risk. The combined policy (S12) can reduce coupla risks (including the risk of water shortage, soil loss, and flood) compared to other individual policies (S2, S4, S6, and S8). Thus, the tradeoff between economic benefits and costs of various policy scenarios should be analyzed by policymakers in the long term.
Although the developed RASF can effectively deal with uncertainties existing in PEWM planning, there are also several limitations that are subject to further improvement. For example, in the practical PEWM in a floodplain area of the economic belt, various types of uncertainties (e.g., nonlinearity and interval features) can generate different uncertainties and risks. Meanwhile, interregional policies with optimistic/pessimistic preferences of policymakers would affect the efficiency of PEWM planning. Therefore, more robust optimization techniques should be introduced into RASF to enhance its capacity in handling uncertainties amid drought–flood challenges and climate change.
The raw data supporting the conclusion of this article will be made available by the authors, without undue reservation.
HD: formal analysis, funding acquisition, investigation, and writing–original draft. XA: data curation, methodology, software, and writing–original draft. XZ: funding acquisition, methodology, resources, supervision, and writing–review and editing. TL: writing-review and editing. YT: writing-review and editing. XZ: writing-review and editing. SL: writing-review and editing.
The author(s) declare that financial support was received for the research, authorship, and/or publication of this article. This research was funded by the National Major Research and Development Project (2022YFD1500402) and the Social Science Foundation of Yunnan Province, grant number YB2023014.
The authors thank the editors and the reviewers for their insightful comments and suggestions.
The authors declare that the research was conducted in the absence of any commercial or financial relationships that could be construed as a potential conflict of interest.
All claims expressed in this article are solely those of the authors and do not necessarily represent those of their affiliated organizations, or those of the publisher, the editors, and the reviewers. Any product that may be evaluated in this article, or claim that may be made by its manufacturer, is not guaranteed or endorsed by the publisher.
The Supplementary Material for this article can be found online at: https://www.frontiersin.org/articles/10.3389/fenvs.2024.1395118/full#supplementary-material
Guo, X., Arshad, M. U., Zhao, Y., Gong, Y., and Li, H. (2023). Effects of climate change and grazing intensity on grassland productivity-A case study of Inner Mongolia, China. Heiliyon 9 (7), e17814. doi:10.1016/j.heliyon.2023.e17814
Halkos, G. E., Stern, D. I., and Tzeremes, N. G. (2016). Population, economic growth and regional environmental inefficiency: evidence from U.S. states. J. Clean. Prod. 112, 4288–4295. doi:10.1016/j.jclepro.2015.06.038
Huang, G. H., and Loucks, D. P. (2000). An inexact two-stage stochastic programming model for water resources management under uncertainty. Civ. Eng. Environ. Syst. 17, 95–118. doi:10.1080/02630250008970277
Inuiguchi, M. (2012). Robust optimization by fuzzy linear programming. Lect Note Econ Math Syst 658, 219–239. doi:10.1007/978-3-642-22884-1_11
Johannes, C., and Leeuwen, V. (2017). Water governance and the quality of water services in the city of Melbourne. Urban Water J. 14, 247–254. doi:10.1080/1573062X.2015.1086008
Kumar, D., Sharma, M., and Rai, S. (2017). A novel approach for river health assessment of Chambal using fuzzy modeling, India. Desalin Water Treat. 58, 72–79. doi:10.5004/dwt.2017.0144
Kumar, V., Vasto-Terrientes, L. D., Valls, A., and Schuhmacher, M. (2016). Adaptation strategies for water supply management in a drought prone Mediterranean river basin: application of outranking method. Sci. Total Environ. 540, 344–357. doi:10.1016/j.scitotenv.2015.06.062
Li, Y., Zhang, Q., Yao, J., Tan, Z., and Liu, X. (2019). Assessment of water storage response to surface hydrological connectivity in a large floodplain system (Poyang Lake, China) using hydrodynamic and geostatistical analysis. Stoch. Env. Res. Risk A 33, 2071–2088. doi:10.1007/s00477-019-01740-9
Liu, Q., Yang, J., Gao, L., Dong, Y. C., Guo, Z. X., Moallemi, E. A., et al. (2023). Robust sensitivity analysis to uncertainties in environmental and socio-economic scenarios: a perspective from a global socio-ecological system model. J. Clean. Prod. 410, 137244. doi:10.1016/j.jclepro.2023.137244
Liu, W., Xu, Y., and Huang, Y. (2011). Effects of global warming on precipitation and run-off volume in Xinjiang. Arid. Geog. 34, 419–428. doi:10.1007/s10409-004-0010-x
Men, B., Liu, H., Tian, W., and Liu, H. (2017). Evaluation of sustainable use of water resources in Beijing based on rough set and fuzzy theory. Water 9, 852. doi:10.3390/w9110852
Nematian, J. (2023). A two-stage stochastic fuzzy mixed-integer linear programming approach for water resource allocation under uncertainty in ajabshir qaleh chay dam. J. Environ. Inf. 41 (1), 52–66. doi:10.3808/jei.202300487
Park, S., Sohn, W., Piao, Y., and Lee, D. (2023). Adaptation strategies for future coastal flooding: performance evaluation of green and grey infrastructure in South Korea. J. Environ. Manage 334, 117495. doi:10.1016/j.jenvman.2023.117495
Peterson, G. D., Graeme, S. C., and Stephen, R. C. (2003). Scenario planning: a tool for conservation in an uncertain world. Conserv. Biol. 17, 358–366. doi:10.1046/j.1523-1739.2003.01491.x
Prokop, P., and Ploskonka, D. (2014). Natural and human impact on the land use and soil properties of the Sikkim Himalayas piedmont in India. J. Environ. Manage 138, 15–23. doi:10.1016/j.jenvman.2014.01.034
Swarta, R. J., Raskinb, P., and Robinsonc, J. (2004). The problem of the future: sustainability science and scenario analysis. Glob. Environ. Chang. 14, 137–146. doi:10.1016/j.gloenvcha.2003.10.002
Viljoen, M., and Booysen, H. (2006). Planning and management of flood damage control: the South African experience. Irrig. Drain. 55, S83–S91. doi:10.1002/ird.259
Wang, J. (2023). Research on the economic collaborative development evaluation in the BeijingTianjin-Hebei region based on hesitant triangular fuzzy information. J. Intell. Fuzzy Syst. 45 (5), 7533–7545. doi:10.3233/JIFS-232159
White, I., Melville, M., Macdonald, B., Quirk, R., Hawken, R., Tunks, M., et al. (2007). From conflicts to wise practice agreement and national strategy: cooperative learning and coastal stewardship in estuarine floodplain management, Tweed River, eastern Australia. J. Clean. Prod. 15, 1545–1558. doi:10.1016/j.jclepro.2006.07.049
Yu, C., Yin, X., Yang, Z., Cai, Y., and Sun, T. (2016). A shorter time step for eco-friendly reservoir operation does not always produce better water availability and ecosystem benefits. J. Hydrol. 540, 900–913. doi:10.1016/j.jhydrol.2016.07.008
Zeng, X., Zhang, S., Li, T., Xue, Y., Zhao, J., Fu, Y., et al. (2021). A risk-simulation based optimization model for wetland reallocation on Yongding floodplain, China. Ecol. Indic. 123, 107342. doi:10.1016/j.ecolind.2021.107342
Zeng, X. T., Li, Y. P., Huang, G., Kong, X., Zhu, Y., Liu, Z., et al. (2019). Scenario analysis of a sustainable water-food nexus optimization with consideration of population-economy regulation in Beijing-Tianjin-Hebei region. J. Clean. Prod. 228, 927–940. doi:10.1016/j.jclepro.2019.04.319
Zhang, W., Chang, W. J., Zhu, Z. C., and Hui, Z. (2020). Landscape ecological risk assessment of Chinese coastal cities based on land use change. Appl. Geogr. 117, 102174. doi:10.1016/j.apgeog.2020.102174
Keywords: location-entropy-based PVRA model, coupla risk, population–industry transformation, adaptive scenario, uncertainties
Citation: Dong H, An X, Zeng X, Li T, Teng Y, Zhang X and Li S (2024) Risks and coping strategies in the floodplain economic belt amid drought–flood challenges and climate change. Front. Environ. Sci. 12:1395118. doi: 10.3389/fenvs.2024.1395118
Received: 03 March 2024; Accepted: 17 April 2024;
Published: 15 July 2024.
Edited by:
Yuhan Huang, University of Technology Sydney, AustraliaReviewed by:
Ying Zhu, Xi’an University of Architecture and Technology, ChinaCopyright © 2024 Dong, An, Zeng, Li, Teng, Zhang and Li. This is an open-access article distributed under the terms of the Creative Commons Attribution License (CC BY). The use, distribution or reproduction in other forums is permitted, provided the original author(s) and the copyright owner(s) are credited and that the original publication in this journal is cited, in accordance with accepted academic practice. No use, distribution or reproduction is permitted which does not comply with these terms.
*Correspondence: Xueting Zeng, emVuZ3h1ZXRpbmdAY3VlYi5lZHUuY24=
Disclaimer: All claims expressed in this article are solely those of the authors and do not necessarily represent those of their affiliated organizations, or those of the publisher, the editors and the reviewers. Any product that may be evaluated in this article or claim that may be made by its manufacturer is not guaranteed or endorsed by the publisher.
Research integrity at Frontiers
Learn more about the work of our research integrity team to safeguard the quality of each article we publish.