
94% of researchers rate our articles as excellent or good
Learn more about the work of our research integrity team to safeguard the quality of each article we publish.
Find out more
ORIGINAL RESEARCH article
Front. Environ. Sci., 09 July 2024
Sec. Environmental Economics and Management
Volume 12 - 2024 | https://doi.org/10.3389/fenvs.2024.1386631
 Yang Bai1,2
 Yaru Li1,2*
Rapid transit is important for the green development of China’s tourism industry because it profoundly affects the optimal structural layout and rational allocation of elements that impact regional tourism. Based on provincial panel data from 2009 to 2020, the entropy weight method, tourism carbon emission measurement model, Super efficiency slacks-based measure model and threshold regression model were used to determine the impact of the rapid transit system on tourism eco-efficiency in China. The findings showed that rapid transit system has increased steadily, while tourism eco-efficiency has fluctuated significantly, and the relative development characteristics of rapid transit system and tourism eco-efficiency gradually changed from “lagging rapid transit system” to “lagging tourism eco-efficiency.” In addition, the rapid transit system and the highway and civil aviation have a nonlinear relationship with tourism eco-efficiency, while the high-speed railway has not passed the threshold effect test, and at the regional level, the impacts of rapid transit system have heterogeneous characteristics. As the deepening construction of rapid transit system, its threshold effect on tourism eco-efficiency will change from positive “V” to positive “U” type, promoting the more efficient development of environmentally friendly tourism.
Since the beginning of the 21st century, China’s tourism industry has developed rapidly. Moreover, based on its strong industrial relevance and permeability, tourism has stimulated the development of related industries and created considerable economic benefits. According to the statistics released by the Ministry of Culture and Tourism, in 2019, China’s total tourism revenue was 6.63 trillion yuan, and its comprehensive contribution to GDP reached 10.94 trillion yuan, accounting for 11.05% of the total GDP. However, the expansion of tourism activities is accompanied by the high consumption of fossil fuels and other resources, which are major contributors to global climate change and have negative environmental impacts on tourism destinations (Lenzen et al., 2018). The contradiction between the increasing demand for tourism and the limited carrying capacity of the ecological environment is constantly appearing. It is, therefore, an important problem for tourism to achieve adequate environmental protection and, at the same time, maintain positive economic development.
Due to the rapid development that has occurred for more than 40 years since the reform and opening, China has become the world’s second largest economy and surpasses the United States as the largest carbon emitter. To actively respond to global environmental challenges, China proposed the goal of achieving a carbon peak by 2030 and carbon neutrality by 2060 at the 75th United Nations General Assembly in 2020. Tourism is an important contributor to the country’s “energy bill,” and its impact on the environment is mainly due to greenhouse gas emissions caused by fossil energy combustion (Becken and Simmons, 2002). From the concept of “low-carbon tourism,” first proposed by the World Economic Forum in 2009, to the principle of “ecological priority and scientific use,” emphasised in the “14th Five-Year Plan” for tourism development in 2021, green transformation has become a critical task for China’s high-quality tourism development (Zhang X. et al., 2022). As an important infrastructure for tourism, transportation can effectively catalyse the development of the tourism economy by breaking regional barriers, and its challenges with respect to the sustainable development of tourism are worthy of attention. Carbon emissions from tourism transportation are the largest component of tourism carbon emissions (Wang et al., 2016; Lenzen et al., 2018), and scholars have noted that transportation is important in the eco-efficiency of tourism destinations (Reilly et al., 2010). In recent years, the proportion of the transportation scale of rapid transit system carrying tourist flow has gradually expanded, continuing to affect the transmission and replacement of tourism elements and becoming the “catalyst” for the agglomeration and diffusion of the tourism carbon footprint.
In this context, it is of great importance to clarify the development status of China’s rapid transit system and tourism eco-efficiency, and to explore the impact of rapid transit construction on tourism eco-efficiency and the driving laws behind it, so as to promote the environmentally friendly tourism relying on the adjustment of rapid transit layout. Therefore, based on panel data of 30 Chinese provinces (excluding Tibet, Hong Kong, Macao and Taiwan), this paper constructed the evaluation index system for rapid transit system and tourism eco-efficiency. Second, the comprehensive index of rapid transit system and tourism eco-efficiency were measured respectively, and their spatial and temporal evolution and relative development characteristics were analysed. Third, the threshold regression model was introduced to explore the impacts of the rapid transit system on tourism eco-efficiency and the regional heterogeneity characteristics. Finally, based on the empirical results, the stage characteristics of the impact of the rapid transit system on tourism eco-efficiency were discussed.
“Eco-efficiency” aims to maximise economic output while minimising environmental costs (WBCSD, 2000), as first proposed by Schaltegger and Sturm (1990). Later, Gössling et al. (2005) introduced the concept into the tourism field, providing a new quantitative research perspective for the sustainable development of tourism. Thus, tourism eco-efficiency has gradually become an important indicator for measuring the green development level of tourism.
Given the “carbon peaking and carbon neutrality goals” proposal and the promotion of the strategic task of high-quality tourism development, tourism eco-efficiency has increasingly become an interesting research topic. Moreover, papers focusing on tourism eco-efficiency at home and abroad consider four major aspects. First, the tourism eco-efficiency is quantified. Researchers mostly use the ratio method (Gössling et al., 2005; Perch-Nielsen et al., 2010) and model method (Sun et al., 2020; Zhang W. et al., 2022; Chen et al., 2022). To improve the representativeness of the research results, scholars tend to measure the efficiency value by constructing a comprehensive evaluation index system, and increasingly confirms the important role of the tourism carbon emission index. The research scale ranges from the micro to macro levels, including scenic spots (Peng et al., 2017), provinces (Wang and Wu, 2022), regions (Sun and Hou, 2021; Zhang X. et al., 2022), and the whole country (Perch-Nielsen et al., 2010; Chaabouni, 2019; Guo L. et al., 2022). The second is the analysis of the factors influencing tourism eco-efficiency. With further research, the influences of many factors on tourism eco-efficiency have gradually been revealed, such as economic development, tourist scale, industrial structure, opening to the outside world, and technological innovation (Chaabouni, 2019; Zha et al., 2021; Wang et al., 2022a; Guo T. T. et al., 2022). For example, Zhang X. et al. (2022) analysed the external factors influencing tourism eco-efficiency with the help of the Tobit model and found that the tourism industry structure, technological innovation and economic development level are all important positive driving factors. However, in research regarding influencing factors, insufficient attention has been given to transportation conditions. The third is the analysis of the spatial and temporal evolution of tourism eco-efficiency. For example, Guo L. et al. (2022) constructed an evaluation index system for tourism eco-efficiency, for which calculations were based on the Super efficiency slacks-based measure (Super-SBM) model, with the results showing that China’s tourism eco-efficiency was generally low and strongly volatile. In addition, Zha et al. (2020) used the nonconvex metafrontier model to measure the tourism eco-efficiency of China’s provinces, and found that the efficiency decreased spatially from east to west. Many researchers have noted that there are regional differences in the level of tourism eco-efficiency and obvious polarisation distribution characteristics. Finally, the optimisation strategy of tourism eco-efficiency is discussed. Tourism activities depends on a certain amount of energy consumption and thus will inevitably exert pressure on the environment (Suh et al., 2005). The utilization of organic waste from accommodations, the promotion of source separation (Manomaivibool, 2015) and implementing cleaner technologies (Yaw, 2005) can all reduce the negative impact of tourism on environmental health. Transport is also an important entry point for the optimisation of tourism eco-efficiency. To achieve energy conservation and reduce emissions in tourism transportation, reducing the number of tourists driving cars (Holding, 2001) and developing public transportation system (Thrasher et al., 2000) are both favourable green practice measures.
According to the “dumbbell” tourism system model proposed by Leiper (1979), transportation is an important component of the tourism system. How transportation construction affects tourism has received much attention. Regional traffic accessibility profoundly impact tourism demand and tourists’ travel choices (Zhang et al., 2013), thus, it is an important driving force for the evolution of the tourism economy. However, due to the dependence of transportation activities on fossil energy use, increases in the passenger transport scale of tourism transportation will critically impact the realisation of tourism carbon emission reduction targets (Isik et al., 2021). The transportation sector may even account for more than 80% of the total energy consumption of tourism activities (Peeters and Schouten, 2006). Based on the spatial Durbin model, Xiao et al. (2022) explored the impact mechanism of transportation infrastructure construction measured using per capita road area on carbon emissions, and the results showed that there was a nonlinear interaction between transportation and carbon emissions. Eijgelaar et al. (2016) confirmed the important impact of transportation mode selection on the tourism environment. The important role of transportation in the process of environmentally friendly tourism development has been affirmed by many studies (Wang et al., 2020; Li et al., 2022). Given the vigorous promotion of rapid transit construction in recent years, the impact of rapid transit on tourism has received increasing attention from scholars. Researchers mostly focus on the space-time compression effect of rapid transit on tourists’ travel (Ravazzoli et al., 2017), and its influence on the spatial structure of regional tourism (Zhou and Li, 2018). High-speed rail has gained increased attention, and research on the impact of rapid transportation on tourism eco-efficiency is in the preliminary exploration stage. Researchers studying the relationship between transportation and tourism eco-efficiency, have discussed based on two major paths. The first is to quantify the carbon emissions of the tourism transportation sector based on the perspective of the carbon footprint, and use “carbon” as a bridge connecting transportation and tourism eco-efficiency, thereby exploring the possible relationship between tourism eco-efficiency and transportation carbon emissions. The second is to include transportation in the factors influencing tourism eco-efficiency, exploring the simple linear impact of regional transportation on tourism eco-efficiency using the Tobit model (Tian and Zhao, 2022) and geographical detector model (Wang et al., 2020).
According to the literature review, it was found that although various results have been achieved in studies related to tourism eco-efficiency, the research on the impact of transit on tourism eco-efficiency lacks attention for rapid transit. Thus, there is a need to further clarify the effect of rapid transit; regarding research methods, studies were mostly based on a linear model framework, neglecting the possible nonlinear influence relationships of transportation on tourism eco-efficiency; in the research object, researchers usually focus on a single transportation mode, and comparative research and heterogeneous analysis of the impact of different modes of rapid transit on tourism eco-efficiency are lacking; in the measurement of variables, tourism eco-efficiency has a relatively mature evaluation system, but for the regional transportation construction, researchers mostly use simple indicators such as line density and passenger volume to measure, and rarely build a multilevel evaluation index system based on the system perspective.
Given the state of the literature, the major contributions of this paper are as follows. 1) Enrich the research content of the impact of transportation on tourism, especially to help clarify how transportation affects the sustainable development of tourism in the context of green economic development. 2) The threshold model is introduced, to make up for the shortcomings of the previous research mainly based on the linear model framework. 3) The selection of research objects keep pace with the times, with a focus on rapid transit, and innovatively compares and analyzes the effect of different rapid transit modes on tourism eco-efficiency. 4) Based on the comprehensive rapid transit, select indicators to build a more overall and scientific evaluation index system of rapid transit system.
The explained variable was tourism eco-efficiency. Drawing on previous studies (Zha et al., 2020; Wang et al., 2022b; Li and Zhang, 2022), the number of people employed in tourism, the number of related infrastructure and service sectors, and energy consumption were taken as input indicators; tourism revenue and arrivals were taken as desired output indicators; and tourism carbon emissions were taken as undesired output to construct an evaluation index system for tourism eco-efficiency from an input‒output perspective (Table 1).
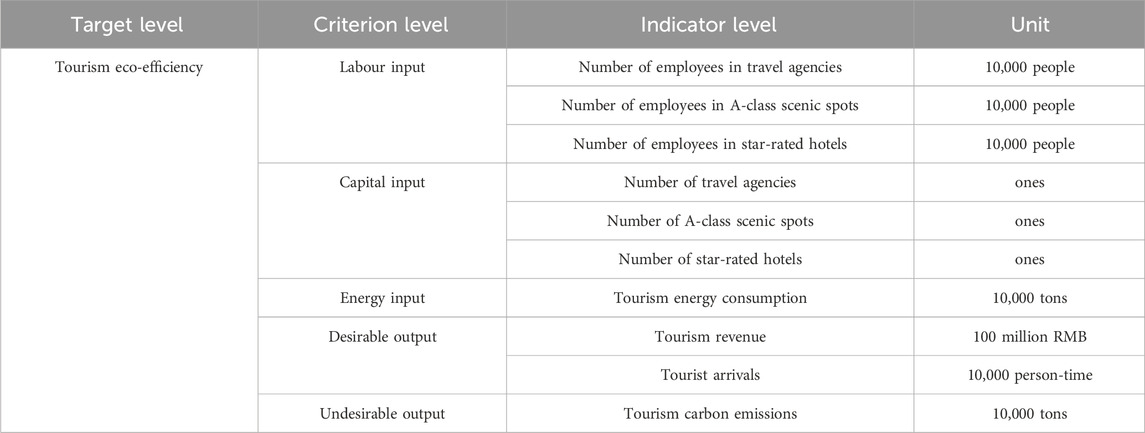
Table 1. Tourism eco-efficiency evaluation indicator system.
The core explanatory variable was rapid transit system. It was divided into 3 subsystems: highway, civil aviation and high-speed railway. Compared with traditional transportation, rapid transit presents a strong space-time compression effect, which can efficiently connect tourism destinations and tourists. In this paper, the rapid transit system was defined as public infrastructure that provides rapid and convenient transportation services with highway, civil aviation and high-speed railway as the main body. It can reflect the strengths and weaknesses of regional transportation development, usually evaluated in terms of 3 criteria: road network density, arterial line impact and location advantage (Jin et al., 2010). The evaluation index system was constructed based on the existing evaluation models (Jin et al., 2010; Cui et al., 2019; Guo et al., 2021) (Table 2).
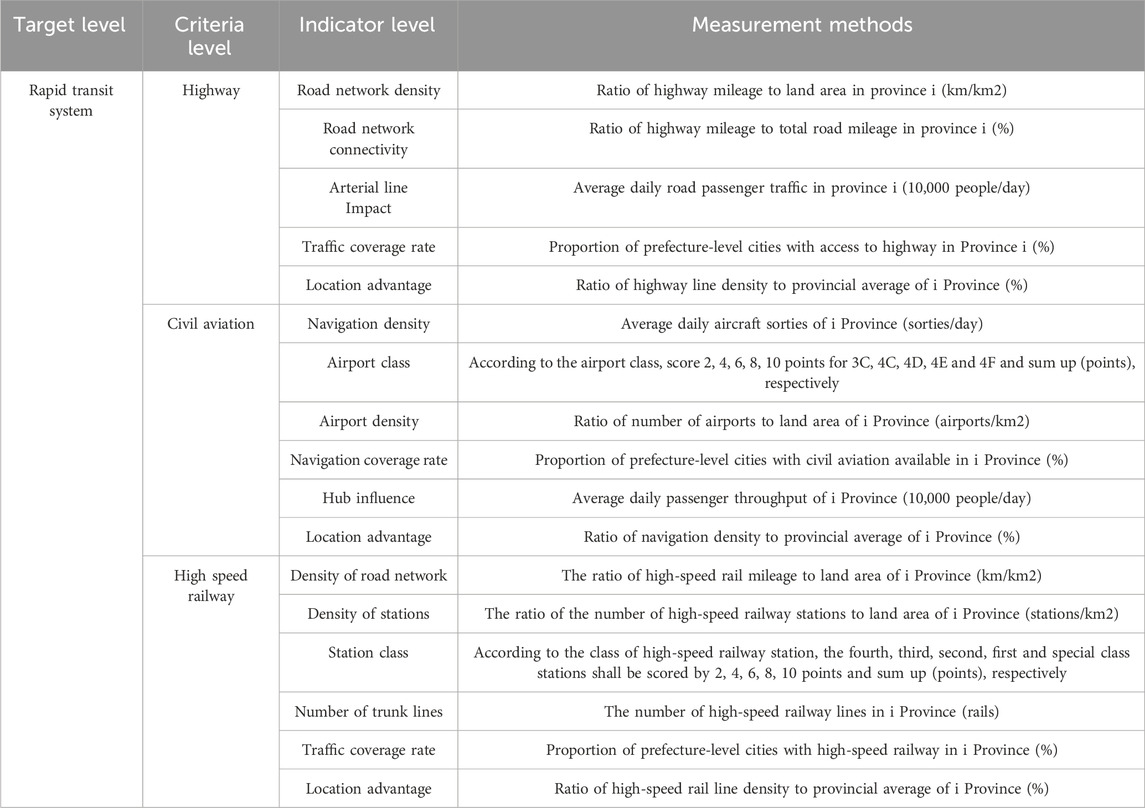
Table 2. Comprehensive evaluation index system of the rapid transit system.
The following variables were selected as control variables. ① Level of economic development, represented by GDP per capita; ② industrial structure, represented by the share of tertiary industry output in GDP; ③ level of urbanisation, expressed as the share of the urban population in the total regional population; ④ government support, measured by the ratio of fiscal general budget expenditure to GDP; and ⑤ environmental regulation, characterised by the share of regional environmental protection expenditure in GDP.
Considering data availability, China’s provincial panel data from 2009 to 2020 were selected as the research sample. Relevant data were mostly derived from the China Statistical Yearbook 2010–2021, the China Energy Statistical Yearbook 2010–2021, the Civil Aviation Airport Production Statistical Bulletin 2010–2021, the China Tourism Statistical Yearbook 2010–2018, the China Culture and Tourism Statistical Yearbook 2019, the China Culture, Heritage and Tourism Statistical Yearbook 2020–2021, the statistical bulletin on national economic and social development and the statistical yearbook of each province over the past years, with the missing data computed and added using linear interpolation. To eliminate differences in magnitudes, the data for each variable were taken as natural logarithms before regression analysis.
Referring to previous practices (Liu and Suk, 2021; Zuo et al., 2021), the entropy weight method was used to measure the comprehensive index values of the provincial rapid transit system and its subsystems.
The main source of carbon emissions is fossil fuel combustion. There is a lack of publicly available data on tourism energy consumption, thus such data need to be stripped from the energy end-use consumption of tourism-related industries. Referring to previous practices (Qiao et al., 2021; Tang and Huang, 2021), a measurement model was constructed (Eqs 1, 2):
where ENit is the stripping factor of tourism energy consumption; TIit is the total regional tourism revenue; GTIit is the added value of tertiary industry; TCEit is the tourism carbon emission; ETitj is the energy consumption of category j in the transportation, storage and postal industry; EWitj is the energy consumption of category j in the wholesale and retail industry and accommodation and catering industry; fj is the standard coal conversion factor of category j energy; and ρ is the CO2 emissions per unit of standard coal, with ρ set at 2.45.
According to studies (Guo L. et al., 2022; Shi et al., 2023), we used an improved SBM model that accounts for undesired outputs to measure tourism eco-efficiency, and the model is as follows (Eqs 3, 4):
where TE is tourism eco-efficiency; a, r and h represent the number of inputs, desirable outputs and undesirable outputs, respectively; xk, yk and bk are the input, desirable output and undesirable output values of the kth decision unit, respectively; X, Y and B are their corresponding input, desirable output and undesirable output matrices, respectively; s is the slack variable; and λ is the weight vector.
To explore the possible effects of the rapid transit system and its subsystems on tourism eco-efficiency, the following model was developed with reference to studies (Hansen, 1999; Song, 2021) (Eq. 5):
where I(·) is the indicator function; y1, …, yn are the thresholds; n thresholds divide the threshold variable into n + 1 value range intervals; Xitdenotes the control variable; β and δ are the estimated coefficients of the threshold and control variables, respectively; α0 is the constant term; and εit is the random disturbance term.
The entropy weight method and Super-SBM model were used to calculate the comprehensive index values of rapid transit system and tourism eco-efficiency respectively, and the line scatter diagram was drawn (Figure 1). According to the division of the regional scale based on the “eight subregions” standard of China’s socioeconomic distribution pattern, Figure 1A showed that the rapid transit system had overall stable growth, with the mean value of eight subregions gradually increasing from 2009 to 2019, and then slightly decreasing in 2020. In terms of comprehensive index ranking, the eight subregions demonstrated significant differences in polarisation, with the eastern, southern and northern coastal regions ranking the top three and the northwest region constantly ranking at the tail. Coastal regions rely on geographical location advantage to support the efficient flow of resource elements, placing greater demands on the supply of transport systems. In terms of fluctuating trends, the rapid transit system in the eastern and southern coastal regions increased sharply in 2010, while the southwest, middle reaches of the Yangtze River and northern coastal regions began to accelerate in 2012, 2013 and 2017, respectively. High-speed railway and civil aviation were the leading forces behind the rapid development of these subregions. The continuous extension of high-speed rail mileage and civil aviation throughput in the past decade have driven the regional rapid transit system to a greater extent.
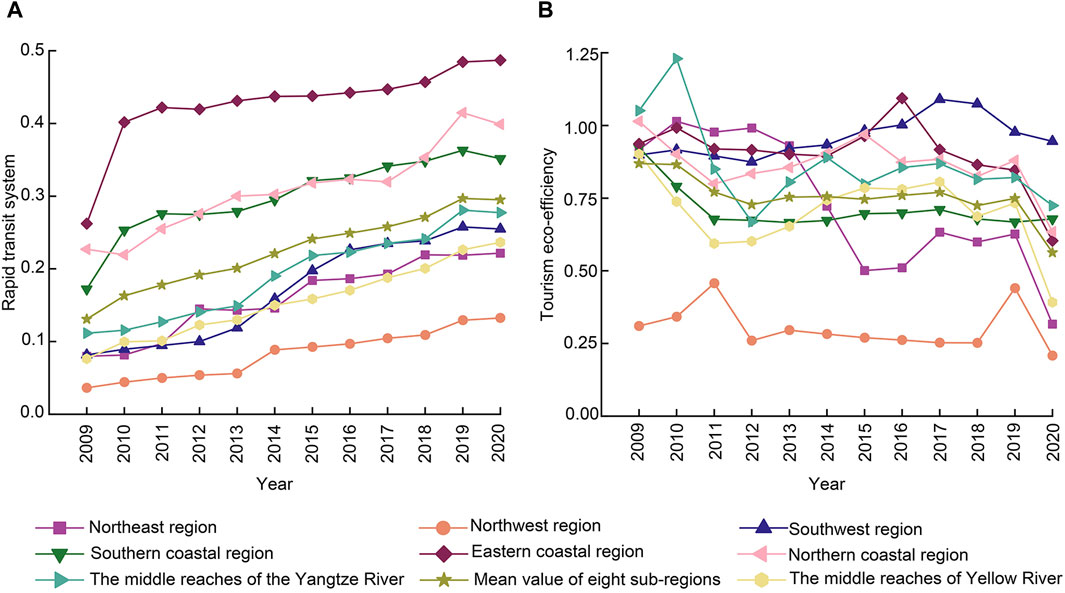
Figure 1. Temporal evolution of the rapid transit system and tourism eco-efficiency. (A) Rapid transit system; (B) Tourism eco-efficiency.
As shown in Figure 1B, the trend of tourism eco-efficiency evolution exhibited obvious differences among the eight subregions, and the mean values of them have an average annual growth of −0.04%. The efficiency value ranking showed that the tourism eco-efficiency of the northwest region was obviously lagging behind, while the eastern coastal and southwest region were typically at the top. The rich tourism resources in the northwest region were not fully utilised, leading to a weak economic driving force for the green transformation of tourism. In terms of fluctuating trends, tourism eco-efficiency in the northern, southern coastal and middle reaches of Yellow River regions continued to decline from 2009 to 2011, and slowly rebounded after 2012. With the implementation of green development strategies such as low-carbon pilot policies, its positive effect on the tourism environmental benefits has begun to emerge. A significant decline in efficiency values was detected in the northeast region during 2013–2015, during which there was a probable “painful” period accompanying industrial restructuring. The implementation of strategies such as the revitalisation of old industrial bases triggered an imbalance in the distribution of economic elements between industries, which led to a “crowding out” effect, squeezing development resources for environmentally friendly tourism.
The complete measured data of provincial rapid transit system and tourism eco-efficiency from 2009 to 2020 were divided into three levels: high-value area, medium-value area and low-value area, and expressed visually with the help of ArcGIS software (Figure 2).
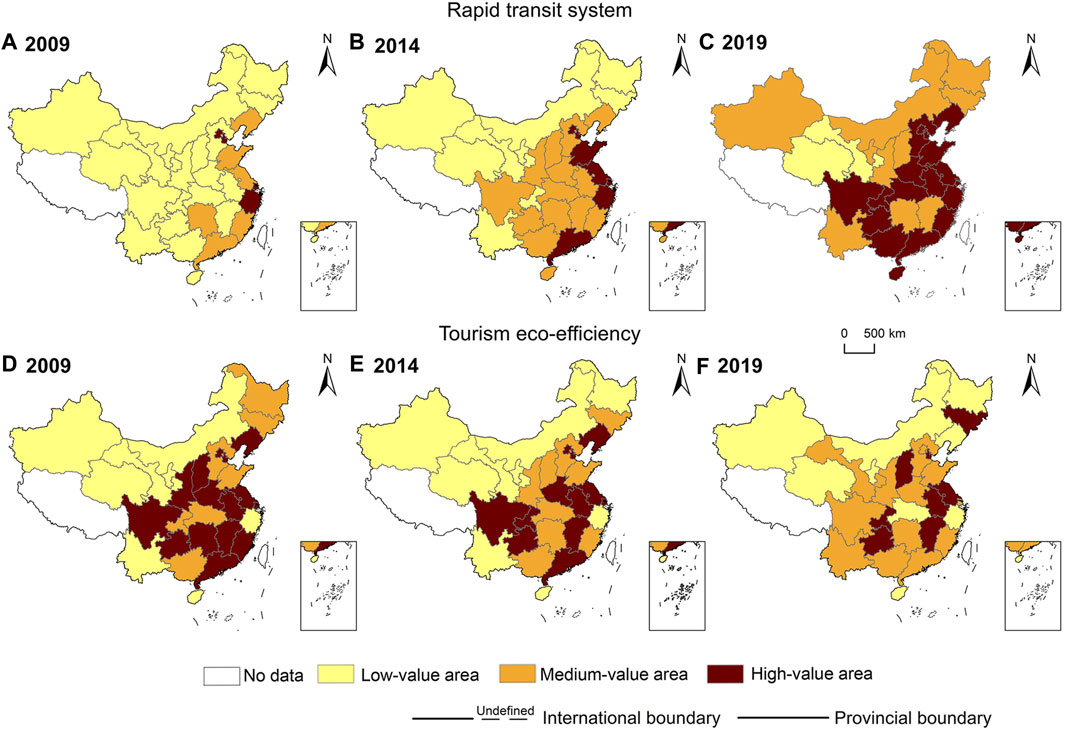
Figure 2. Spatial evolution of the rapid transit system and tourism eco-efficiency. (A) Rapid transit system in 2009; (B) Rapid transit system in 2014; (C) Rapid transit system in 2019; (D) Tourism eco-efficiency in 2009; (E) Tourism eco-efficiency in 2014; (F) Tourism eco-efficiency in 2019.
Figures 2A–C shows that in 2009, the ratio of high-, medium- and low-value areas in the rapid transit system was “4:6:20,” with point-shaped high-value areas and sheet-shaped medium-value areas mainly distributed in the eastern coastal region. The ratio changed to “7:14:9” in 2014, with high-value areas spreading along the sea and medium-value areas spreading westwards into a planar-shaped region, squeezing the spatial extent of low-value areas. The ratio became “18:10:2” in 2019, in which the distribution range of high-value areas infiltrated and spread to the medium-value areas; the medium-value areas compressed to form a distribution pattern of point-shaped and sheet-shaped coexistence; and the low-value areas became sporadically distributed in the northwest region. During the study period, the comprehensive index of the rapid transit system was witness to the coexistence of high-value areas diffusion and low-value areas contraction trends. Figures 2D–F shows that in 2009, 2014, and 2019, the number of high-value areas of tourism eco-efficiency accounted for 50.00%, 40.00%, and 26.67%, respectively. The high-value areas were mostly distributed along the Yellow River and Yangtze River Basins at the beginning of the period, and then the distribution space was gradually compressed into a scattered point shape. The spatial distribution scope of the medium-value areas were obviously expanded, finally realising the encirclement of the high-value areas. The low-value areas had a spatial locking effect, covering the provincial areas with little change. During the study period, tourism eco-efficiency mainly had a hierarchical reverse evolution in relation to the transition from high-value areas to medium-value areas, with 40% of the provinces showing a downwards movement. In general, the rapid transit system and tourism eco-efficiency values both showed a gradient decreasing spatial pattern of “eastern > central > western”.
Based on the above research, a two-dimensional combination matrix of rapid transit system-tourism eco-efficiency was drawn (Figure 3) to further explore the equilibrium development characteristics between rapid transit system and tourism eco-efficiency, among which “H-H, M-M” and “L-L” were equilibrium types and the rest were nonequilibrium types.
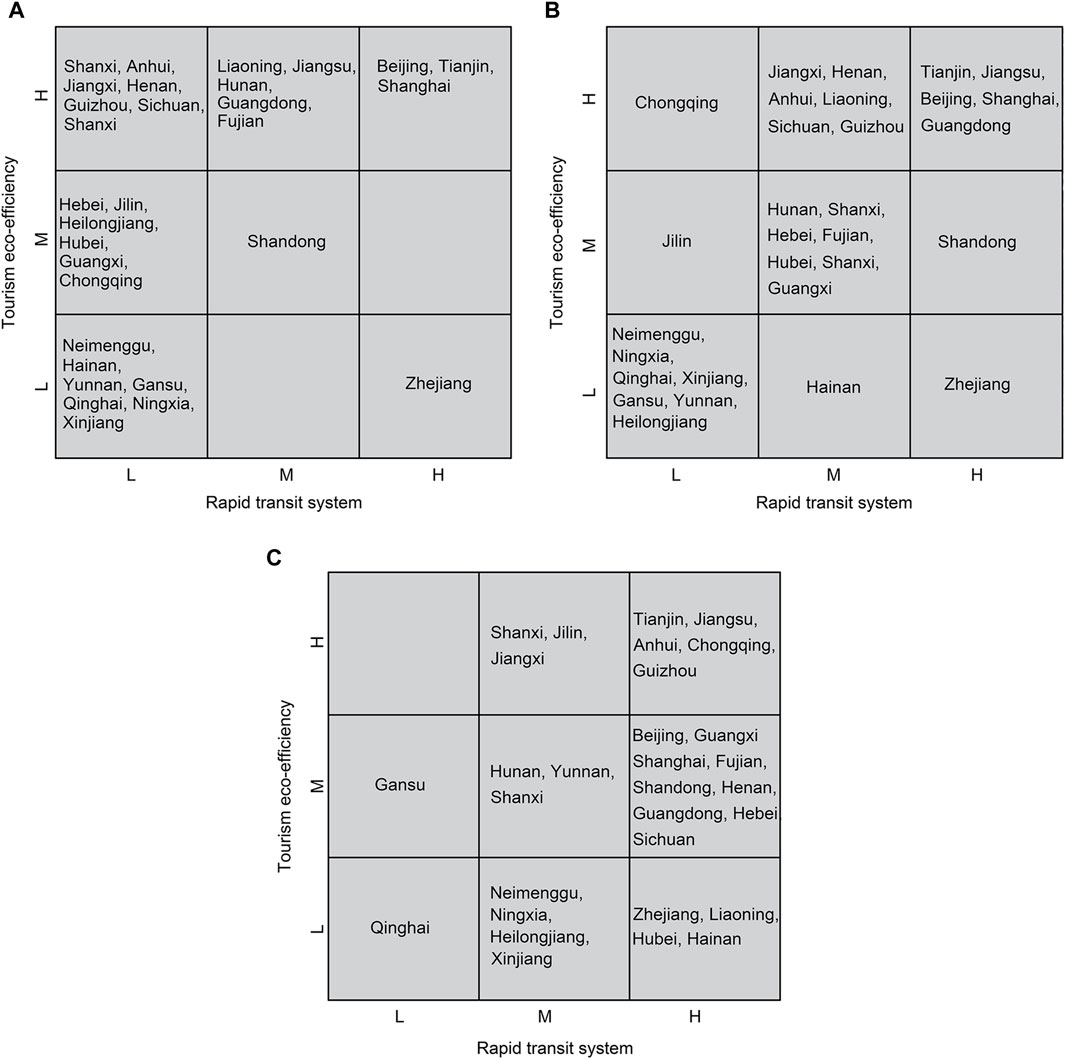
Figure 3. Two-dimensional combination matrix of rapid transit system-tourism eco-efficiency. (A) 2009; (B) 2014; (C) 2019.
In 2009, the ratio between the number of equilibrium and nonequilibrium types of provinces was 11:19, indicating a clear mismatch in the rhythm of rapid transit system construction and green tourism development, with Beijing, Tianjin and Shanghai showing an “H-H” quality equilibrium. In terms of the relative development, the “L-M, L-H, M-H” types of the sample accounted for 60.00%, indicating that the level of tourism eco-efficiency in most provinces was ahead of rapid transit system, therefore the “lagging rapid transit system” was the dominant characteristic. In 2014, the ratio between the number of equilibrium and nonequilibrium types of provinces was 19:11, with ever-increasing optimisation of coordination development pattern between the rapid transit system and tourism eco-efficiency, and the number of provinces reaching the “H-H” type increased to five. In terms of the relative development degree, the proportion of “L-L, M-M, H-H” types rose to 63.33%, with the rapid transit system in many provinces greatly narrowing the level gap with tourism eco-efficiency, while “relative equilibrium” became the dominant characteristic. In 2019, the ratio between the number of equilibrium and nonequilibrium types of provinces reached 9:21, and the development pace of rapid transit system and tourism eco-efficiency was once again out of balance. Five provinces, including Tianjin and Jiangsu, were in “H-H” equilibrium. Regarding the relative development degree, the “H-L, H-M, and M-L” type provinces accounted for 56.67%, indicating that the relative level of rapid transit system in most provinces has begun to surpass tourism eco-efficiency, thus “lagging tourism eco-efficiency” became the dominant characteristic. Overall, the dominant characteristics of the relative development between rapid transit system and tourism eco-efficiency exhibited an evolutionary trend of “lagging rapid transit system → relative equilibrium → lagging tourism eco-efficiency”.
Table 3 showed the regression results of rapid transit system on tourism eco-efficiency based on the linear individual fixed effect model. The linear effects of rapid transit system, civil aviation, and high-speed railway on tourism eco-efficiency were not significant except for highway, and there may be more complex nonlinear effects. Therefore, the threshold effect of rapid transit system on tourism eco-efficiency was further tested.
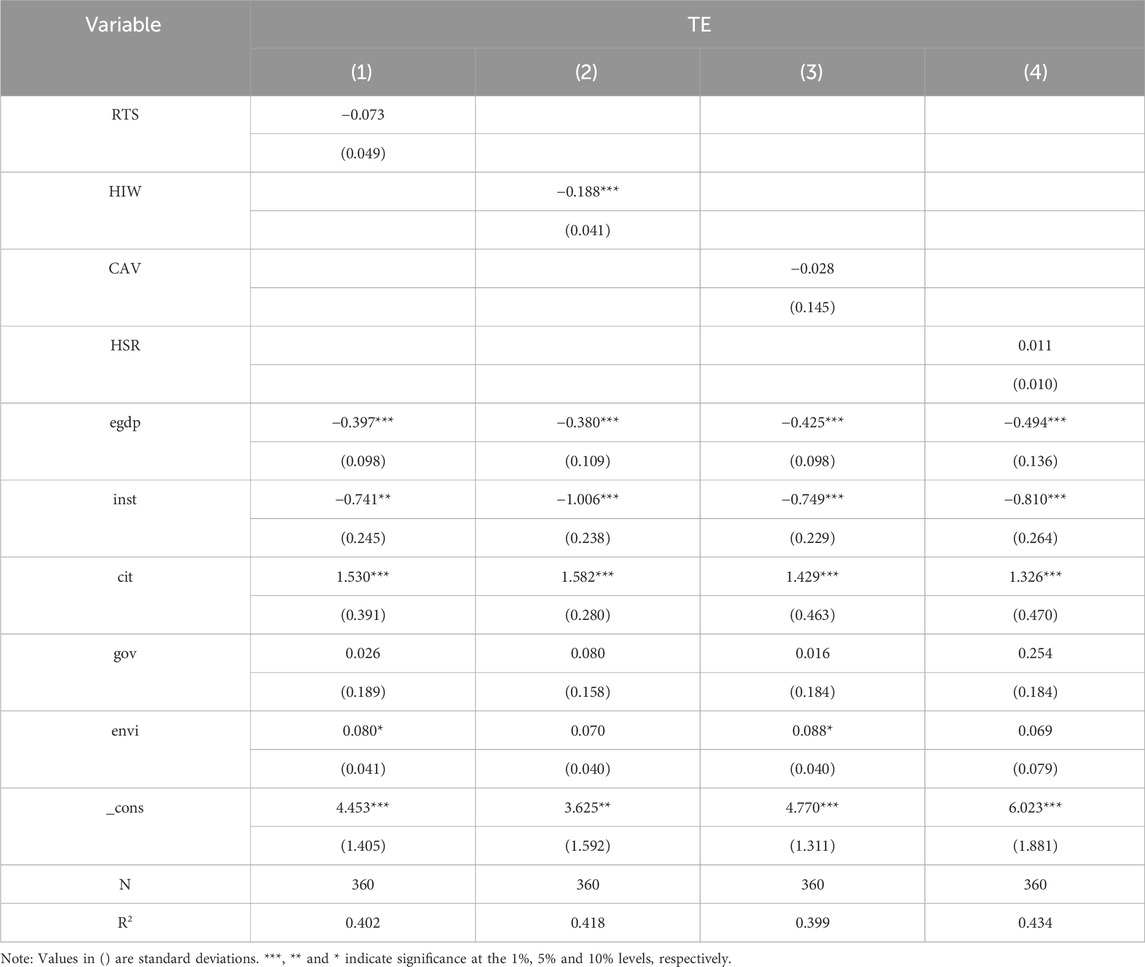
Table 3. Baseline regression results.
Based on Hansen’s (1999) research method to test the threshold effect, the rapid transit system and the highway, high-speed railway and civil aviation were used as threshold variables. The threshold effect was tested by self-sampling under the assumptions of the existence of an order of single, double and triple thresholds, respectively (Table 4). The results showed that the rapid transit system and the highway and civil aviation subsystems passed the significance test of the single threshold, while the high-speed railway subsystem showed no threshold effect.
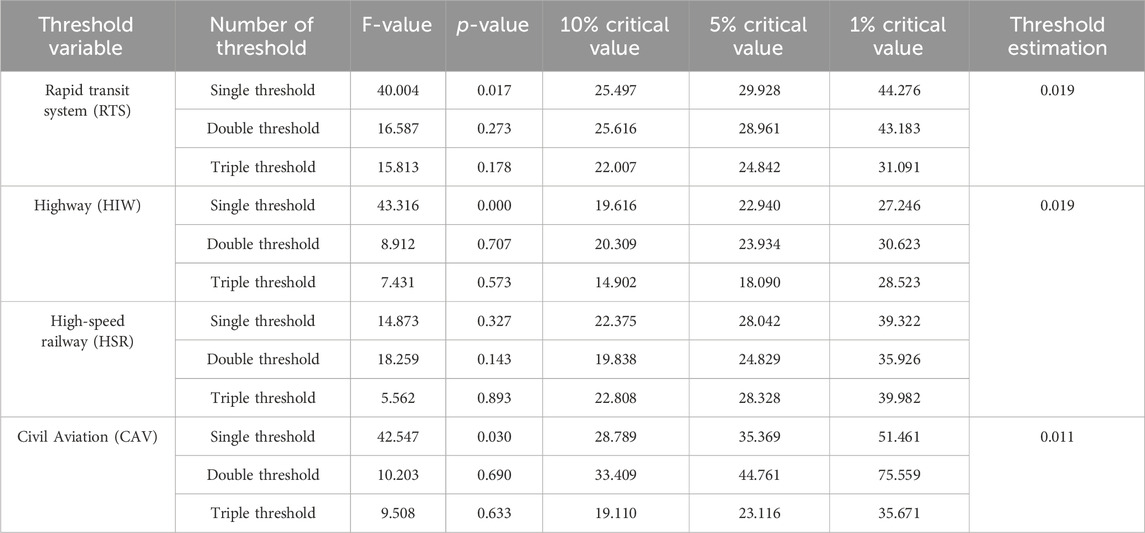
Table 4. Self-sampling test for the threshold effect.
To test the validity of the existence of the threshold, the rapid transit system, the highway and civil aviation were plotted as a single threshold variable for the likelihood ratio function diagram (Figure 4). The threshold values corresponded to LR values that all tended to 0, based on which it could be determined that the threshold effect existed and was valid.
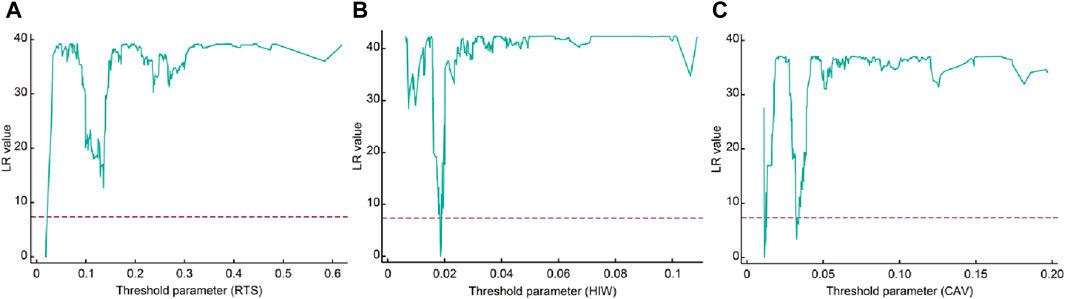
Figure 4. Threshold estimates and confidence intervals. (A) Rapid transit system; (B) Highway; (C) Civil Aviation.
Based on the test results, a single threshold model was used to analyse the effect of the rapid transit system and the highway and civil aviation subsystems on tourism eco-efficiency (Table 5).

Table 5. Threshold effects of the rapid transit system on tourism eco-efficiency.
The rapid transit system did not significantly negatively affect tourism eco-efficiency below the threshold but did significantly positively affect it upon crossing the threshold. It is possible that in the early stages of rapid transit system construction, the coordination between different transport modes within the system was poor. However, as it reached a higher level, the high-speed railway, civil aviation and highway gradually formed a network structure with complementary advantages and coordination, providing tourists with flexible and diverse travel traffic options, and driving the optimisation of regional tourism resource allocation. The highway significantly negatively affected tourism eco-efficiency when it was below the threshold, and this effect was further enhanced when the threshold was crossed. The new energy vehicles market share of China is still low, and the energy consumption of highway transportation is dominated by fossil energy. Compared with other transportation modes, highway contributes the most to tourism carbon emissions. Therefore, the expansion of its transportation scale inevitably has a greater negative impact on the environment. The civil aviation did not significantly positively affect tourism eco-efficiency below the threshold but showed a stronger positive impact after crossing the threshold. Civil aviation could effectively promote the coordination and connection between rapid transit modes, optimising the flow direction, flow rate, and flow speed of element flows in tourism destinations based on the multidirectional radiation function of air routes, thus reducing the environmental cost per unit of tourism economic output by improving the utilisation efficiency of tourism resources. The high-speed railway had an insignificant positive linear impact on tourism eco-efficiency. High-speed railway had the lowest average transport energy consumption, which could help reduce the overall energy consumption of rapid transit system while capturing the share of highway and civil aviation passenger traffic. With the completion of the “eight vertical and eight horizontal” high-speed railway network layout, the positive effect of high-speed rail may become significant and have an inflection point in the trend line. In addition, by comparing the coefficient magnitude of different rapid transit modes, it can be found that highway and civil aviation have a stronger effect on tourism eco-efficiency. The highway subsystem bore the largest market share of tourism transportation, while civil aviation is the mode of transportation with the strongest space-time compression function. Therefore, the change of the two may more effectively shake the development trend of tourism eco-efficiency.
The estimation results of the control variables showed that egdp and inst negatively affected tourism eco-efficiency, perhaps because the improvement of economic level stimulated tourism consumption behaviour, but the promotion and practice of low-carbon concepts in domestic tourism activities still need to be further deepened; the optimisation of the industrial structure was conducive to the linkages and interactions between tourism and related industries. However, while service capacity of the tertiary sector was increasing, tourism may had not achieved high-quality cooperation with other sectors. Cit, gov and envi positively influenced tourism eco-efficiency. The reason for this was that the improvement of the urbanisation level drove the agglomeration and professional development of regional tourism, which reduced the flow resistance and allocation cost of tourism elements; government support and environmental regulation provided economic support for optimizing tourism eco-efficiency, yielding greater scope for the horizontal and vertical expansion of new low-carbon tourism models. In addition, from the magnitude of the estimated coefficients, the effects of egdp, inst and cit on tourism eco-efficiency were significantly stronger than those of gov and envi. It may be that egdp, inst and cit are external macro environmental factors represented the regional overall economic and industrial development, which will undoubtedly have a key influence on the development trend of tourism. In contrast, gov and envi were more inclined to reflect the financial support methods adopted by the government to promote the development of environmentally friendly tourism, which may have a weaker decisive impact.
Based on the two test paths of removing a control variable one by one and replacing the original core explanatory variable with the rapid transit system calculated by the coefficient of variation method to perform threshold model regression, a robustness test of the threshold effect of the rapid transit system on tourism eco-efficiency was carried out (Table 6). The results showed that there was a single threshold for the threshold variable, and the direction of the effect coefficient of each variable was almost unchanged, so the model could be considered robust.
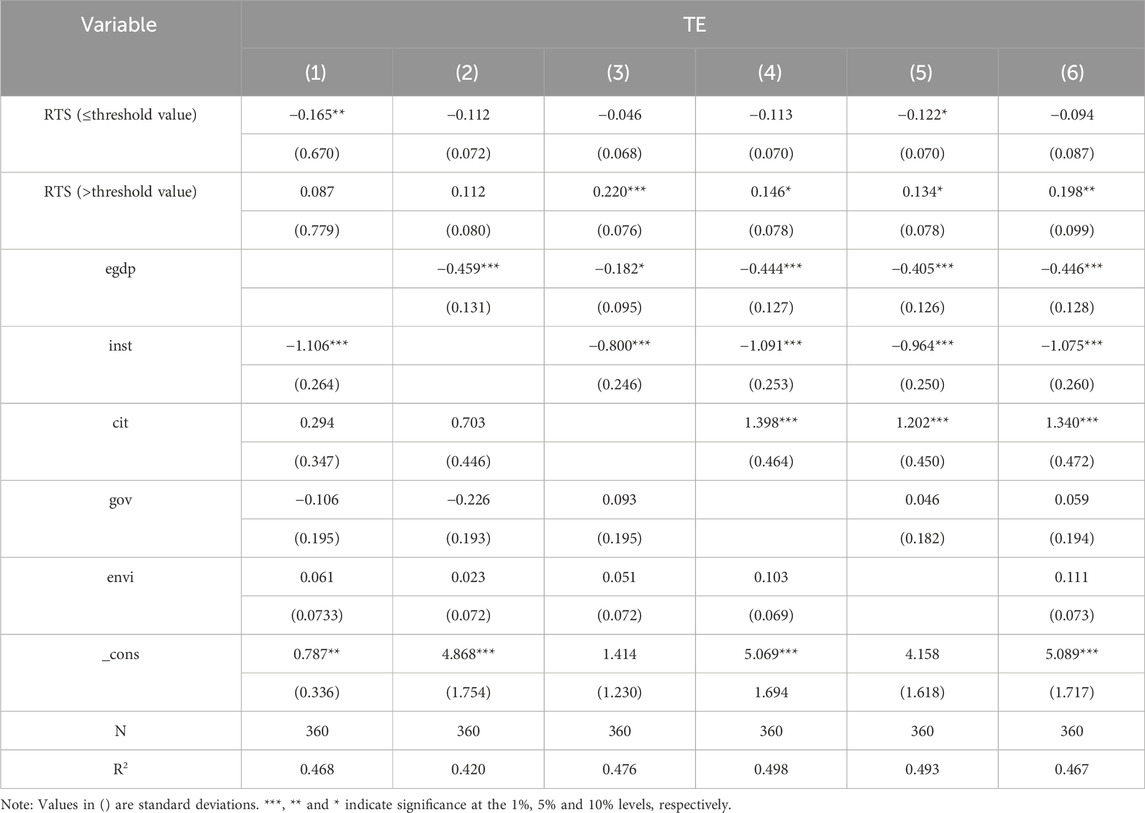
Table 6. Robustness test results.
Due to differences in tourism resource endowments, consumer market dynamics and transport system structures, the impact of rapid transit system on tourism eco-efficiency in different regions may have been heterogeneous. Thus, the research area was further subdivided into three major regions to reveal the heterogeneous impact (Table 7).
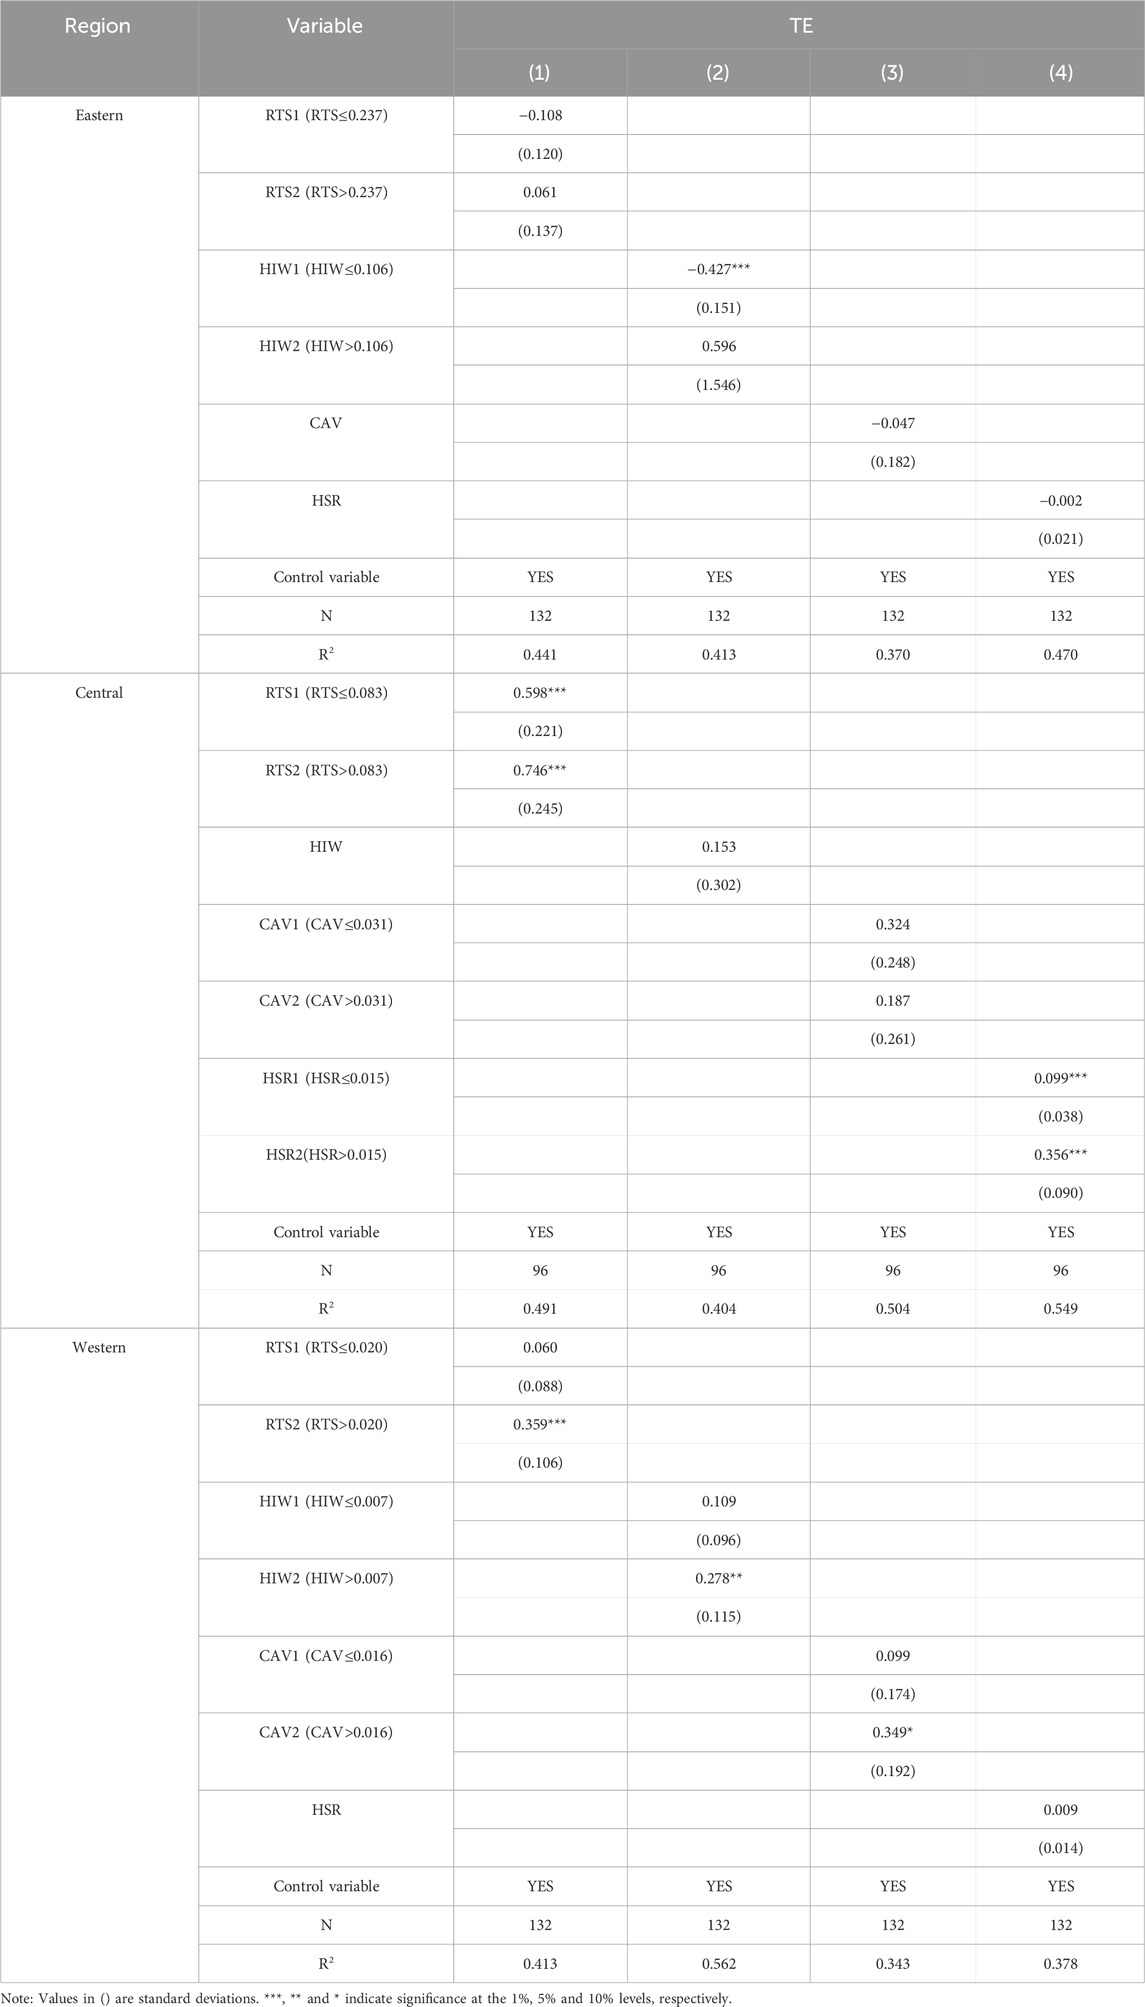
Table 7. Effect of regional heterogeneity in the rapid transit system on tourism eco-efficiency.
First, the rapid transit system passed the single threshold effect test in all regions. When it was below the threshold, it inhibited tourism eco-efficiency in the eastern region and promoted tourism eco-efficiency in the central and western regions, respectively. After crossing the threshold, it had a positive effect in all regions. The eastern region had a much higher level of tourist scale than the other two regions. Thus, in the early stage of rapid transit system construction, the imbalance between tourism demand and transportation supply may have been more prominent, hindering the improvement of tourism eco-efficiency. Given the gradual development of the rapid transit system, the adjustment and upgrading of the energy structure would push rapid transportation towards being cleaner and more efficient, positively affecting the tourism eco-efficiency of each region.
Second, the highway passed the single threshold effect test in the eastern and western regions, and the impact of highway was consistently positive in the western region, negative first and then positive in the eastern region, and positive and linear in the central region. Highway construction in the eastern region occurred early, and the line density was higher, which led to a greater ecological burden during the early stages due to the increase in energy consumption caused by the tourists. As the layout of the highway matured, the efficiency of the organisation of tourism passenger transport significantly increased, while the reduced cost and increased penetration of new energy vehicles reduced the average energy consumption of transport, highlighting the green drive to regional tourism eco-efficiency.
Third, the civil aviation passed the single threshold effect test in the central and western regions and exerted a positive effect at all threshold levels while maintaining a negative linear effect in the eastern region. In the eastern region, the airport distribution density and tourism throughput were greater. However, the negative environmental impact caused by the high frequency of flights under the high transportation energy consumption would hinder the improvement of tourism eco-efficiency. In contrast, in the central and western regions, the proportion of long-distance routes with lower average transport energy consumption in the routes opened by airports is higher. Therefore, civil aviation could contribute to the optimisation of tourist travel routes and the construction of a green travel system by virtue of its stronger spatial and temporal compression, thus improving regional tourism eco-efficiency.
Finally, the high-speed railway in the central region passed the single threshold effect test and positively contributed to tourism eco-efficiency under both the high- and low-threshold regimes, with negative and positive linear effects in the eastern and western regions, respectively. This was because the eastern region was more saturated with high-speed railway construction, and excessive passenger transportation could lead to an excessive increase in total energy consumption for tourism activities while contributing to the expansion and upgrading of tourism. In addition, the lagging construction of railway in the western region prompted more tourists to choose self-driven or civil aviation travel, which were flexible but have higher transport energy consumption. Therefore, the substitution of high-speed railway development for civil aviation and highway would optimise the overall energy consumption structure of tourism transportation, promoting the sustainable development of tourism.
Based on the results of the empirical analysis, the fitting trend line of the relationship between the rapid transit system and tourism eco-efficiency was drawn (Figure 5). The results showed that the two exhibited a positive “V” type relationship, while the subsystems (highway, civil aviation and high-speed railway) and tourism eco-efficiency showed an inverted “J,” a positive “J” and a linear type relationship, respectively. The results showed that when the rapid transit system was at a low level, the highway was the dominant subsystem for its impact effect; when the rapid transit system moved to a higher level, civil aviation and high-speed railway became the dominant subsystems within it, which was also consistent with the developmental history of China’s transport infrastructure construction. As the new type of rapid transportation, civil aviation and high-speed railway construction lagged behind highway in the early stage. Therefore, highway could rely on a solid construction foundation to exert far more influence on tourism passenger transport. Furthermore, under the combined effect of external environmental factors such as the level of economic development and industrial structure, the rapid transit system presented the same negative driving force as the highway subsystem. As the rapid transit system developed to a higher level, the country deepened the network layout of high-speed railway and civil aviation, and the two subsystems began to seize the original market share of highway based on their superior time-space compression function. The emergence and superposition of the influence of high-speed railway and civil aviation gradually overshadowed the effect of highway. Moreover, under the synergy of external pulling forces such as urbanisation, government support and environmental regulation, the rapid transit system showed the same positive driving force as the high-speed railway and civil aviation subsystems.

Figure 5. Simulation of the relationship between the rapid transit system and tourism eco-efficiency. (A) Rapid transit system; (B) Highway; (C) Civil Aviation; (D) High speed rail.
In summary, the internal elements of the system and the external environmental factors jointly influenced the effect of the rapid transit system on tourism eco-efficiency. The change in the dominant subsystem at different stages and the role of external environmental factors drove the rise and fall of the relationship between the rapid transit system and tourism eco-efficiency. Given the further coordinated promotion of the optimal layout of the future rapid transit system, the fitting trend line of the threshold effect of the rapid transit system on tourism eco-efficiency would change from positive “V” to positive “U” type. Based on the above analysis, the driving effect evolution of the rapid transit system on tourism eco-efficiency and its corresponding stage interaction characteristics are summarised (Figure 6).

Figure 6. The driving evolution path of the rapid transit system on tourism eco-efficiency.
In the first stage, the rapid transit system and tourism eco-efficiency were in a state of “malposition and disequilibrium.” The internal coordination and articulation of the rapid transit system dominated by highway was poor, which mainly drove the low-quality and extensive economic growth of the tourism industry. Furthermore, driven by the coordination of major elements, such as road network density and average daily road passenger volume within rapid transit system, and by important factors such as the economic development level and industrial structure of the external environment, tourism eco-efficiency decreased with the construction of rapid transit system. In the second stage, the rapid transit system and tourism eco-efficiency changed to a state of “adjustment and optimisation.” The influence of high-speed rail and civil aviation gradually expanded, causing them to be the major forces in rapid transit system, greatly optimising the energy consumption structure of rapid transit system and enhancing the efficiency of tourism resource utilisation. The rapid transit system began to drive the tourism industry to enter the transitional developmental stage of green transformation that pays more attention to environmental impact. Furthermore, driven by the coordination of major elements, such as airport density and station density within the rapid transit system, and by important factors, such as the level of urbanisation and environmental regulation of the external environment, tourism eco-efficiency began to rise with the improvement of the rapid transit system. In the third stage, the rapid transit system and tourism eco-efficiency would enter a state of “co-frequency and energy release.” The coordinated network layout would be formed among the different transport modes of the rapid transit system, which could drive the tourism industry to achieve a win-win sustainable development model of economic and environmental benefits. Furthermore, driven by the coordination of major elements, such as road network density and station density within rapid transit system, and by important factors, such as the economic development level and the industrial structure of the external environment, tourism eco-efficiency would rely on rapid transit system to improve efficiently.
With the rapid development of high-speed rail, civil aviation and other rapid transportation modes in China, the layout of rapid transit systems has been greatly optimised, and the construction level of China’s rapid transportation infrastructure has assumed a leading position in the world. Rapid transportation effectively broadens the travel radius and distance of tourists based on the strong space-time compression effect, and expand the scale of the potential tourist market along the transportation route by enhancing accessibility (Spasojević et al., 2017; Jin et al., 2020), thus activating the regional tourism economy. However, transportation, as a bridge connecting tourists and destinations, is also the first contributing sector to the energy consumption bill of tourism and is the main source of tourism carbon emissions (Becken and Simmons, 2002). Moreover, through empirical research, some scholars have noted that an increase in the number of tourists will significantly negatively affect tourism eco-efficiency (Liu et al., 2017; Wang et al., 2020). Therefore, in the context of the high-quality development of tourism, a blind reliance on rapid transportation construction to expand the tourism consumption market may lead to the extensive growth of tourism and threaten the ecological environment of tourism destinations. Therefore, it is essential to clarify the impact and interaction mechanism of rapid transportation on tourism eco-efficiency, so as to promote the coordination of supply and demand in the tourism market through the scientific layout of rapid transit system and drive the development of high-quality tourism.
Compared with normal-speed transportation, the market share of tourism passenger transport carried by highway, civil aviation and high-speed rail has been expanding, resulting in a profound impact on the spatial transfer and diffusion of tourist flow. Therefore, we constructed a multilevel evaluation index system developed by three mainstream rapid transportation modes to measure the level of regional transportation development, and further tested and analysed the threshold effect of the rapid transit system on tourism eco-efficiency. The results showed that China’s tourism eco-efficiency fluctuated from 2009 to 2020, thus confirming the calculation results of many scholars (Sun and Hou, 2021; Guo T. T. et al., 2022), indicating that the green development trend of tourism is severe. In addition, the results of the threshold model regression showed that the threshold effect curve of the rapid transit system on tourism eco-efficiency is a positive “V.” Previous studies have shown that the construction of means of transport has a significant positive impact on tourism eco-efficiency (Tian and Zhao, 2022). It is possible that in the research area of Shandong Province, where transportation development is at a high level in China, the phenomenon of “high-level transportation has a positive impact” is consistent with the empirical results of this paper. The increasing maturity of rapid transit system can more effectively drive the improvement of tourism eco-efficiency. This core research conclusion can boost confidence in the realisation of the sustainable development goals of the tourism industry. However, the fact that the tourism eco-efficiency level is decreasing is also releasing outwards signals, that is relying only on the regulation and optimisation of tourism transportation is not enough to reverse the negative development of tourism eco-efficiency. Thus, it is necessary to explore and pay attention to the impact of major factors other than transportation, and overcome this dilemma through the synergy of various factors. Finally, the heterogeneous effects of rapid transit modes provide a reference for the mainstream direction of rapid transportation construction planning. The empirical results showed that compared with highway, high-speed railway and civil aviation are more active in optimising tourism eco-efficiency. Thus, the government should focus on optimising the construction of high-speed railway and civil aviation to alleviate the pressure of highway tourism traffic in future construction. Therefore, from the results of regional heterogeneity research, the focus of the eastern region should be to optimise the layout of the rapid transit system while taking the highway as the basic advantage support, and strive to explore the scientific development plan of high-speed railway and civil aviation. The central region should steadily utilise the great enabling effect of high-speed railway and further stimulate the positive potential of civil aviation and highway on tourism eco-efficiency. In addition, subject to geographical characteristics, the western region has the weakest high-speed railway construction. At this stage, the promotion of highway and civil aviation is the main task, especially with civil aviation as the core, to help solve the problem of “difficult entry” for tourists.
Furthermore, there are various limitations in this study. Tourism activities involve many industries. However, due to data availability constraints, the measurements of tourism energy consumption and tourism carbon emissions cover only the transportation, storage, postal, wholesale, retail, accommodation and catering industry sectors. In the future, we need to try to expand the coverage to more sectors and find more accurate measurement methods. Secondly, China has a vast territory, thus the geographical scope of the province as a research sample is still too large. On the basis of overcoming the difficulty of data availability, it is better to try to carry out research from the prefecture-level city or even county scale. In addition, compared with highway and civil aviation, there are more deficiencies in the evaluation index data of the high-speed railway dimension, and the public data do not explicitly disclose the high-speed rail passenger volume, which is important statistical data that characterises its transportation influence power. It is necessary to introduce an evaluation index that scientifically measures the influence of high-speed railway passenger transportation to further enhance the comprehensiveness and representativeness of the evaluation of high-speed railway.
Based on panel data for Chinese provinces for the period 2009–2020, this paper analysed the impact of the rapid transit system on tourism eco-efficiency. The major conclusions are as follows: first, the rapid transit system shows the characteristics of overall stable growth, with coastal provinces have always been in a leading position; the overall tourism eco-efficiency fluctuates greatly with time, with obvious differences in the evolution trend among different subregions. The regional polarisation differences of the rapid transit system and tourism eco-efficiency are both obvious, with a gradient decreasing spatial pattern of “eastern > central > western.” Second, based on the analysis of the two-dimensional combination matrix, the nonequilibrium development of the rapid transit system and tourism eco-efficiency is obvious, and the number of provinces in the equilibrium type shows an inverted “V” shape change. The dominant characteristics of the relative development between the rapid transit system and tourism eco-efficiency have an evolutionary trend of “lagging rapid transit system → relative equilibrium→ lagging tourism eco-efficiency.” Third, according to the threshold effect test, the rapid transit system, highway and civil aviation show positive “V,” inverted “J” and positive “J” type effect relationships on tourism eco-efficiency, respectively, while the high-speed railway has not passed the threshold effect test. Fourth, the threshold effect of the rapid transit system on tourism eco-efficiency has great regional heterogeneity, with the rapid transit system having a single threshold effect in the eastern, central and western regions. Highway in the eastern and western regions and civil aviation in the central and western regions show nonlinear effects, and high-speed railway have a threshold effect only in the central region. Finally, when the rapid transit system enters a high enough level, its further optimisation and construction will promote the more efficient development of environmentally friendly tourism.
Publicly available datasets were analyzed in this study. This data can be found here: Considering data availability, China’s provincial panel data from 2009–2020 were selected as the research sample. Relevant data were mainly derived from the China Statistical Yearbook 2010–2021, the China Energy Statistical Yearbook, the Civil Aviation Airport Production Statistical Bulletin, the China Tourism Statistical Yearbook 2010–2018, the China Culture and Tourism Statistical Yearbook 2019, 2020–2021, the China Culture, Heritage and Tourism Statistical Yearbook, the statistical bulletin on national economic and social development and the statistical yearbook of each province over the past years, with the missing data computed and added using linear interpolation.
YB: Writing–review and editing. YL: Writing–original draft.
The author(s) declare that financial support was received for the research, authorship, and/or publication of this article. This work was supported by the National Social Science Foundation of China under Grant [20BJY211]; Xinjiang Uygur Autonomous Region Social Science Foundation of China under Grant [22BJY029]; and Xinjiang University Philosophy and Social Science Cultivation Program for Young Teachers under Grant [22CPY148].
The authors would like to thank all colleagues who contributed to this study.
The authors declare that the research was conducted in the absence of any commercial or financial relationships that could be construed as a potential conflict of interest.
All claims expressed in this article are solely those of the authors and do not necessarily represent those of their affiliated organizations, or those of the publisher, the editors and the reviewers. Any product that may be evaluated in this article, or claim that may be made by its manufacturer, is not guaranteed or endorsed by the publisher.
Becken, S., and Simmons, D. G. (2002). Understanding energy consumption patterns of tourist attractions and activities in New Zealand. Tour. Manag. 23 (4), 343–354. doi:10.1016/s0261-5177(01)00091-7
Chaabouni, S. (2019). China’s regional tourism efficiency: a two-stage double bootstrap data envelopment analysis. J. Destination Mark. Manag. 11, 183–191. doi:10.1016/j.jdmm.2017.09.002
Chen, Y., Zhu, Z., and Zhang, L. (2022). Exploring the ecological performance of China’s tourism industry: a three-Stage undesirable SBM-DEA approach with carbon footprint. Int. J. Environ. Res. Public Health 19 (22), 15367. doi:10.3390/ijerph192215367
Cui, X., Fang, C., Wang, Z., and Bao, C. (2019). Spatial relationship of high-speed transportation construction and land-use efficiency and its mechanism: case study of Shandong Peninsula urban agglomeration. J. Geogr. Sci. 29 (4), 549–562. doi:10.1007/s11442-019-1614-1
Eijgelaar, E., Peeters, P., Bruijn, K. D., and Dirven, R. (2016). Travelling large in 2015: the carbon footprint of Dutch holidaymakers in 2015 and the development since 2002. China: NHTV Breda University of Applied.
Gössling, S., Peeters, P., Ceron, J. P., Dubois, G., Patterson, T., and Richardson, R. B. (2005). The eco-efficiency of tourism. Ecol. Econ. 54 (4), 417–434. doi:10.1016/j.ecolecon.2004.10.006
Guo, L., Li, P., Zhang, J., Xiao, X., and Peng, H. (2022a). Do socio-economic factors matter? A comprehensive evaluation of tourism eco-efficiency determinants in China based on the Geographical Detector Model. J. Environ. Manag. 320, 115812. doi:10.1016/j.jenvman.2022.115812
Guo, T. T., Wang, J. D., and Li, C. (2022b). Spatial-temporal evolution and influencing mechanism of tourism ecological efficiency in China. Sustainability 14 (24), 16880. doi:10.3390/su142416880
Guo, X., Mu, X., Ming, Q., and Lu, B. (2021). Impact effect of rapid transport system on urban tourism productivity in the Yangtze River Economic Belt. Econ. Geogr. 41 (12), 213–222. doi:10.15957/j.cnki.jjdl.2021.12.023
Hansen, B. E. (1999). Threshold effects in non-dynamic panels: estimation, testing, and inference. J. Econ. 93 (2), 345–368. doi:10.1016/s0304-4076(99)00025-1
Holding, D. M. (2001). The sanfte mobilitaet project: achieving reduced car-dependence in European resort areas. Tour. Manag. 22 (4), 411–417. doi:10.1016/s0261-5177(00)00071-6
Isik, M., Dodder, R., and Kaplan, P. Ö. (2021). Transportation emissions scenarios for New York City under different carbon intensities of electricity and electric vehicle adoption rates. Nat. Energy 6 (1), 92–104. doi:10.1038/s41560-020-00740-2
Jin, F., Wang, C., Li, X., and Wang, J. (2010). China’s regional transport dominance: density, proximity, and accessibility. J. Geogr. Sci. 20 (2), 295–309. doi:10.1007/s11442-010-0295-6
Jin, S., Yang, J., Wang, E., and Liu, J. (2020). The influence of high-speed rail on ice-snow tourism in northeastern China. Tour. Manag. 78, 104070. doi:10.1016/j.tourman.2019.104070
Leiper, N. (1979). The framework of tourism. Ann. Tour. Res. 6 (4), 390–407. doi:10.1016/0160-7383(79)90003-3
Lenzen, M., Sun, Y., Faturay, F., Ting, Y. P., Geschke, A., and Malik, A. (2018). The carbon footprint of global tourism. Nat. Clim. Change 8 (6), 522–528. doi:10.1038/s41558-018-0141-x
Li, S., Ren, T., Jia, B., and Zhong, Y. (2022). The spatial pattern and spillover effect of the eco-efficiency of regional tourism from the perspective of green development: an empirical study in China. Forests 13 (8), 1324. doi:10.3390/f13081324
Li, Y., and Zhang, Y. (2022). Spatial-temporal evolution and influencing factors of tourism eco-efficiency in China’s Beijing-Tianjin-Hebei region. Front. Environ. Sci. 10. doi:10.3389/fenvs.2022.1067835
Liu, J., Zhang, J., and Fu, Z. (2017). Tourism eco-efficiency of Chinese coastal cities: analysis based on the DEA-Tobit model. Ocean Coast. Manag. 148, 164–170. doi:10.1016/j.ocecoaman.2017.08.003
Liu, Y., and Suk, S. (2021). Coupling and coordinating relationship between tourism economy and ecological environment—a case study of nagasaki prefecture, Japan. Int. J. Environ. Res. Public Health 18 (23), 12818. doi:10.3390/ijerph182312818
Manomaivibool, P. (2015). Wasteful tourism in developing economy? A present situation and sustainable scenarios. Resour. Conservation Recycl. 103, 69–76. doi:10.1016/j.resconrec.2015.07.020
Peeters, P., and Schouten, F. (2006). Reducing the ecological footprint of inbound tourism and transport to Amsterdam. J. Sustain. Tour. 14 (2), 157–171. doi:10.1080/09669580508669050
Peng, H., Zhang, J., Lin, L., Tang, G., Yan, B., Xiao, X., et al. (2017). Eco-efficiency and its determinants at a tourism destination: a case study of Huangshan National Park, China. Tour. Manag. 60, 201–211. doi:10.1016/j.tourman.2016.12.005
Perch-Nielsen, S., Sesartić, A., and Stucki, M. (2010). The greenhouse gas intensity of the tourism sector: the case of Switzerland. Environ. Sci. Policy 13 (2), 131–140. doi:10.1016/j.envsci.2009.12.002
Qiao, C., Mao, Y., and Morrison, A. M. (2021). Impacts of environmental regulations on tourism carbon emissions. Int. J. Environ. Res. Public Health 18 (23), 12850. doi:10.3390/ijerph182312850
Ravazzoli, E., Streifeneder, T., and Cavallaro, F. (2017). The effects of the planned High-Speed Rail system on travel times and spatial development in the European Alps. Mt. Res. Dev. 37 (1), 131–140. doi:10.1659/mrd-journal-d-15-00051.1
Reilly, J. M., Williams, P. W., and Haider, W. (2010). Moving towards more eco-efficient tourist transportation to a resort destination: the case of Whistler, British Columbia. Res. Transp. Econ. 26 (1), 66–73. doi:10.1016/j.retrec.2009.10.009
Schaltegger, S., and Sturm, A. (1990). Ökologische Rationalität: Ansatzpunkte zur Ausgestaltung von ökologieorientierten Managementinstrumenten. Die Unternehm. 44 (4), 273–290.
Shi, P., Long, H., Yao, Y., Li, X., and Wang, X. (2023). Study of the space–time transition and spatial spillover effects of tourism green production efficiency in the Yangtze River Delta—a reanalysis from the perspective of tourism carbon sinks. Front. Environ. Sci. 11. doi:10.3389/fenvs.2023.1260949
Song, Z. (2021). Economic growth and carbon emissions: estimation of a panel threshold model for the transition process in China. J. Clean. Prod. 278, 123773. doi:10.1016/j.jclepro.2020.123773
Spasojević, B., Lohmann, G., and Scott, N. (2017). Air transport and tourism–a systematic literature review (2000–2014). Curr. Issues Tour. 21 (9), 975–997. doi:10.1080/13683500.2017.1334762
Suh, S., Lee, K. M., and Ha, S. (2005). Eco-efficiency for pollution prevention in small to medium-sized enterprises: a case from South Korea. J. Industrial Ecol. 9 (4), 223–240. doi:10.1162/108819805775247918
Sun, Y., and Hou, G. (2021). Analysis on the Spatial-temporal evolution characteristics and spatial network structure of tourism eco-efficiency in the Yangtze River Delta Urban Agglomeration. Int. J. Environ. Res. Public Health 18 (5), 2577. doi:10.3390/ijerph18052577
Sun, Y., Hou, G., Huang, Z., and Yi, Z. (2020). Spatial-temporal differences and influencing factors of tourism eco-efficiency in China’s three major urban agglomerations based on the Super-EBM model. Sustainability 12 (10), 4156. doi:10.3390/su12104156
Tang, Z. K., and Huang, T. (2021). Carbon dioxide emission measurement and its spatiotemporal evolution of tourism industry in Heilongjiang Province, China. Adv. Meteorology 2021, 1–10. doi:10.1155/2021/1458373
Thrasher, S. A., Hickey, T. R., and Hudome, R. J. (2000). Enhancing transit circulation in resort areas: operational and design strategies. Transp. Res. Rec. 1735 (1), 79–83. doi:10.3141/1735-10
Tian, H., and Zhao, Q. (2022). Evaluation on regional tourism ecological efficiency under high quality development: a case of Shandong province. J. Arid Land Resour. Environ. 36 (12), 201–208. doi:10.13448/j.cnki.jalre.2022.320
Wang, C., Xu, L., Huang, M., Su, X., Lai, R., and Xu, A. (2022a). Research on the evolution of spatial network structure of tourism eco-efficiency and its influencing factors in China’s provinces based on carbon emission accounting. PLOS ONE 17 (9), e0272667. doi:10.1371/journal.pone.0272667
Wang, C., Zheng, Q., Zeng, H., Wu, Y., and Wei, C. (2022b). What configurational conditions promote tourism eco-transformation? a fuzzy-set qualitative comparative analysis based on the TOE framework. Front. Environ. Sci. 10. doi:10.3389/fenvs.2022.1012856
Wang, M., Xu, L., Hu, B., Jun, Z., and Wang, Z. (2016). Quantifying direct and indirect carbon dioxide emissions of the Chinese tourism industry. J. Clean. Prod. 126, 586–594. doi:10.1016/j.jclepro.2016.03.067
Wang, R., Xia, B., Dong, S., Yu, L., Li, Z., Ba, D., et al. (2020). Research on the spatial differentiation and driving forces of eco-efficiency of regional tourism in China. Sustainability 13 (1), 280. doi:10.3390/su13010280
Wang, Y., and Wu, X. (2022). The spatial pattern and influencing factors of tourism eco-efficiency in Inner Mongolia, China. Front. Public Health 10, 1072959. doi:10.3389/fpubh.2022.1072959
Xiao, F., Pang, Z., Yan, D., Kong, Y., and Yang, F. (2022). How does transportation infrastructure affect urban carbon emissions? an empirical study based on 286 cities in China. Environ. Sci. Pollut. Res. 30 (4), 10624–10642. doi:10.1007/s11356-022-22866-4
Yaw, F. J. (2005). Cleaner technologies for sustainable tourism: caribbean case studies. J. Clean. Prod. 13 (2), 117–134. doi:10.1016/j.jclepro.2003.12.019
Zha, J., Dai, J., Han, X., Zhao, C., Tan, T., and Li, Z. (2021). Assessing efficiency and determinants of tourist attractions based on a two-subprocess perspective: a case of Chengdu, southwestern China. J. Destination Mark. Manag. 19, 100542. doi:10.1016/j.jdmm.2020.100542
Zha, J., Yuan, W., Dai, J., Tan, T., and He, L. (2020). Eco-efficiency, eco-productivity and tourism growth in China: a non-convex metafrontier DEA-based decomposition model. J. Sustain. Tour. 28 (5), 663–685. doi:10.1080/09669582.2019.1699102
Zhang, W., Liu, X., Yang, C., Lyu, G., and Hou, X. (2013). Study on the impact of High Speed Railway on urban tourism: taking Nanjing as an example. Econ. Geogr. 33 (7), 163–168.
Zhang, W., Zhan, Y., Yin, R., and Yuan, X. (2022b). The tourism eco-efficiency measurement and its influencing factors in the Yellow River Basin. Sustainability 14 (23), 15654. doi:10.3390/su142315654
Zhang, X., Guo, W., and Bashir, M. B. (2022a). Inclusive green growth and development of the high-quality tourism industry in China: the dependence on imports. Sustain. Prod. Consum. 29, 57–78. doi:10.1016/j.spc.2021.09.023
Zhou, B., and Li, N. (2018). The impact of high-speed trains on regional tourism economies: empirical evidence from China. Tour. Econ. 24 (2), 187–203. doi:10.1177/1354816617749346
Keywords: rapid transit system, tourism eco-efficiency, spatiotemporal evolution, threshold effect, driving path
Citation: Bai Y and Li Y (2024) The threshold effect and driving path of the rapid transit system on tourism eco-efficiency in China. Front. Environ. Sci. 12:1386631. doi: 10.3389/fenvs.2024.1386631
Received: 15 February 2024; Accepted: 05 June 2024;
Published: 09 July 2024.
Edited by:
Yuan-Wei Du, Yunnan University, ChinaReviewed by:
Martin Thomas Falk, University of South-Eastern Norway (USN), NorwayCopyright © 2024 Bai and Li. This is an open-access article distributed under the terms of the Creative Commons Attribution License (CC BY). The use, distribution or reproduction in other forums is permitted, provided the original author(s) and the copyright owner(s) are credited and that the original publication in this journal is cited, in accordance with accepted academic practice. No use, distribution or reproduction is permitted which does not comply with these terms.
*Correspondence: Yaru Li, bGl5YXJ1MjAwMDIwMjNAMTYzLmNvbQ==
Disclaimer: All claims expressed in this article are solely those of the authors and do not necessarily represent those of their affiliated organizations, or those of the publisher, the editors and the reviewers. Any product that may be evaluated in this article or claim that may be made by its manufacturer is not guaranteed or endorsed by the publisher.
Research integrity at Frontiers
Learn more about the work of our research integrity team to safeguard the quality of each article we publish.