 Yanjun Hou
 Juemei Wu
- 1Department of Geography, Xinzhou Teachers University, Xinzhou, China
- 2School of Geography Science, Liaoning Normal University, Dalian, China
Assessment and prediction analyses of the ecological environmental quality of river basins are pivotal to realize ecological protection and high-quality coordinated development. Methods: The PLUS and InVEST models were used to analyze the spatiotemporal evolution characteristics of land-use in the Fen River Basin and simulate the spatial pattern of land-use under natural development (ND), ecological protection (EC), and economic development (ED) scenarios in 2030, as well as evaluate habitat quality (HQ) and its spatiotemporal variation characteristics from 2000 to 2030. From 2000 to 2020, the Fen River Basin consisted primarily of cultivated land, followed by forests, and then unused land. Habitat quality in the Fen River Basin showed a downward trend from 2000 to 2020. Between 2010 and 2020, the rate of decline decreased, and by 2030, the HQ in the EC scenario exhibited improvement compared to 2020. However, there was a reduction in HQ in the natural development and economic development scenarios and there was obvious heterogeneity in spatial distribution, showing the characteristics of “low middle and high edge”. The cultivated land was converted into forests, construction land, and grasslands, and the conversion of construction land and forests to cultivated land dominated the changes in HQ in the Fen River Basin.
1 Introduction
Habitat quality (HQ) refers to the ability of the environment under certain spatial and temporal conditions to contribute and support natural resources for the survival and development of individuals and populations (Sun et al., 2019; Liu and Xu, 2020; Yang, 2021; Lei et al., 2022). HQ determines ecosystem stability and is related to regional biodiversity levels, which indicates the degree of fragmentation and degradation of the ecological environment, thus establishing the foundation for sustainable development of land (Chen et al., 2016; Liang and Liu, 2017; Sun et al., 2019; Wu et al., 2022). Currently, the commonly used models for assessing regional HQ mainly include ARIES, HIS, SolVES, and InVEST models (Gong et al., 2018; Aneseyee et al., 2020; Li Q. et al., 2021; Raji et al., 2022; Wang and Cheng, 2022). Among them, the InVEST model is the most widely used as it comprehensively assesses ecosystem services and tradeoffs jointly and has the advantages of strong visualization, easy data acquisition, and convenient operation. This model has been developed by Stanford University, WWF, and The Nature conservancy (Aneseyee et al., 2020; Zhang et al., 2020; Yang et al., 2021; Wei et al., 2022).
The 20th National Congress report proposed to “promote green development and build a beautiful China where man and nature live in harmony,” putting the ecological environment in a more prominent position. Therefore, the assessment of HQ is of particular importance, as it provides a basis for improving the environmental governance system and sustainable land-use.
Land-use change is a complex process that has been attributed to human activities, economic development (ED), climate change, and other factors (Zhang et al., 2020; Wu et al., 2022). Monitoring this process is essential for managing natural resources (Singh et al., 2024) and environmental quality (Zhang et al., 2020; Yang et al., 2021; Singh et al., 2022a; Wang and Cheng, 2022; Wei et al., 2022). For instance, land-use change can alter the flow of materials and energy between habitat patches, thereby affecting the spatial distribution pattern among and quality of regional habitats (Li Y. et al., 2021; Jin et al., 2022; Raji et al., 2022). Elucidating the internal mechanisms underlying land-use change is important to understand the impact of this process on HQ (Li et al., 2020; Singh et al., 2022b). However, only a few studies have focused on the internal mechanisms of land-use change (Singh et al., 2021a; Singh et al., 2022c). Considering the land requirement to support large-scale human activities with the rapid increase in population and socioeconomic development, some studies have started to examine the development trajectory of future land use to adjust land-use planning effectively and relieve social and environmental pressures (Singh et al., 2021b; Liang et al., 2021). Land-use simulation has advanced significantly with the rapid development of computer and 3S technologies, and land-use simulation research is being conducted extensively worldwide (Chu et al., 2018; Singh et al., 2021a). Land-use predictions are often implemented using models. The commonly used models are conversion of land use and its effects at small regional extent (CLUE-S), future land use simulation model (FLUS), cellular automata (CA)-Markov, and PLUS. The CLUE-S, FLUS, CA-Markov, and PLUS models can predict the amount of land-used over a long time series and simulate the change in land-use space with high simulation accuracy (Liang et al., 2021; Shi et al., 2021). However, the CLUE-S, FLUS, CA-Markov models, which are referred to as traditional models, have some shortcomings. The CA-Markov model considers only the influence of cell number and structure on land-use simulation (Chu et al., 2018; Zhou et al., 2020; Jana et al., 2022; Luan et al., 2023), CLUE-S model does not consider the nonlinearity between land-use change-driven data (Kucsicsa et al., 2019), and FLUS model requires a coordinate system, resolution, and row and column numbers of all raster data to be unified (Liu et al., 2017). Nevertheless, these traditional models are available at a larger scale and on a variety of pairs; however, land-type patch simulations do not accurately elucidate the underlying drivers of land-use change. Therefore, the PLUS model is used as it can effectively solve the shortcomings of the traditional models by coupling the analysis strategy of land-use expansion rules based on the seed generation mechanism of multiple types of random plaques. It offers the advantages of high simulation accuracy and fast running speed, simulating the complexity of various land patches, thereby contributing to enhancing the accuracy of the evolution process (Liang et al., 2021; Shi et al., 2021; Wei et al., 2022). Thus, this work integrates the PLUS and InVEST models to estimate potential future modifications to land-use patterns and evaluate the spatial and temporal evolution of HQ in the Fen River Basin across a range of scenarios.
The PLUS and InVEST models operate in distinct domains, and their combination allows the maximization of their benefits for large-scale HQ assessment and land use simulation. Their combination also achieves interdisciplinary integration, which offers a thorough viewpoint for studying ecological conservation and land use in the Fen River Basin (Du et al., 2023). Furthermore, an all-encompassing approach to the ecological preservation of the Fen River Basin can be achieved by simulating land-use change and simultaneously evaluating its ecological effects (Bai et al., 2019; Shi et al., 2024). Current researchers have focused on administrative regions, such as metropolitan agglomerations (Chen and Yao, 2024), provincial areas (Jia et al., 2024), and municipal areas (Xiao et al., 2024), and have produced superior study outcomes. However, watersheds have not been taken into consideration in these studies. Watersheds are crucial places for sustaining human society and are comparatively autonomous geographical units (Wang et al., 2010; Liu et al., 2023). The Fen River Basin is a crucial component of the Yellow River Basin, serving as the primary hub for high-quality development within the region, and an important area for agricultural production, industrialization, and urbanization (Wang et al., 2010; He et al., 2024). The urbanization and industrialization of the Fen River Basin and the ra In the revised manuscript, pid growth of construction land within it have given rise to an increasing number of serious ecological and environmental issues, including a decline in plant cover, surface runoff, soil erosion, and biodiversity in the basin (Liu et al., 2023; Xue et al., 2024).
This study aimed to examine how land use in the Fen River Basin affects HQ. The spatial and temporal evolution of HQ in the Fen River Basin and the influence of land use on it were investigated by conducting the following: 1) A quantitative evaluation of the spatial and temporal evolution characteristics of the HQ in the Fen River Basin by using the InVEST model based on land use data from 2000 to 2020; 2) A simulation of HQ changes under three development scenarios of land-use changes in 2030 by using the PLUS model; and 3) A conclusive analysis of the impact of land-use changes on HQ.
2 Materials and methods
2.1 Study area
The Fen River Basin (35°13′4″–39°4′4″N, 110°26′42″–113°26′56″E) is the largest tributary of the Yellow River Basin located in the south-central region of Shanxi Province, China (Figure 1). The area of the river basin is approximately 3.97 × 10⁴ km2, accounting for 25.3% of the total area of Shanxi Province, with a length of 413 km from north to south, width of 188 km from east to west, and total length of 716 km of the mainstream. It also covers nine cities, namely, Xinzhou, Lüliang, Yangquan, Taiyuan, Jinzhong, Changzhi, Linfen, Jincheng, and Yuncheng. The Fen River Basin is bordered by the Lüliang Mountain in the west and Taihang Mountain in the east. The terrain is high in the north and low in the south, the mainstream runs through the central and southern parts of the province from north to south, and the tributary water system originates between the two mountain systems. The topography and geomorphology are generally long north and south, narrow east and west, and irregular bands distributed in the central region of the Shanxi Province. The Fen River Basin has a temperate continental monsoon climate with an average annual temperature of 7°C–13.7°C, and an average annual precipitation of 400–600 mm.
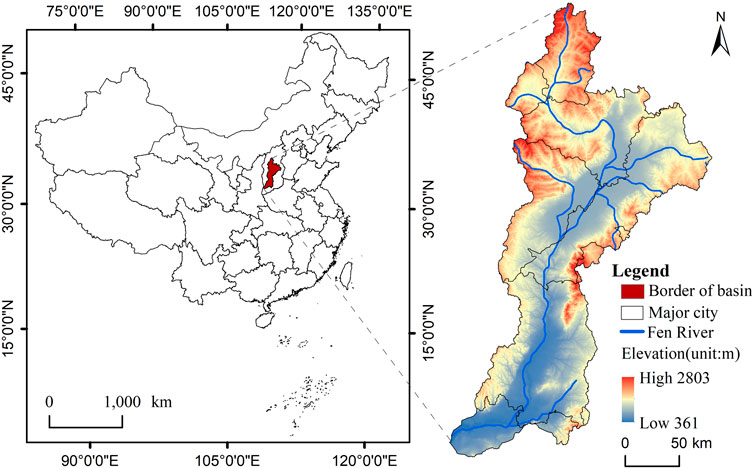
Figure 1. Location of the Fen River Basin in China. Blue solid line: Fen River; dark red: basin border; white: major cities; blue and red shading: high and low elevation, respectively.
2.2 Materials
Land-use data were obtained from the Resources and Environmental Data Sharing Center, Chinese Academy of Sciences, Beijing, China (https://www.resdc.cn/), with a spatial resolution of 30 m and a classification accuracy of over 95%. Data were classified into six categories: cultivated land, forests, grasslands, water bodies, construction land, and unused land. The administrative boundaries of China were from the national basic geographic information (http://www.ngcc.cn). The data on natural drivers used in this study mainly contain: The digital elevation model data (DEM) and slope were derived from the geospatial data cloud platform (http://www.gscloud.cn) with a spatial resolution of 30 m. Mean annual precipitation and temperature were derived from the Chengdu Institute of Mountain Hazards and Environment, Chinese Academy of Sciences (http://imde.cas.cn/), with a spatial resolution of 30 m. Soil type from the Resource and Environment Data Sharing Center of the Chinese Academy of Sciences (https://www.resdc.cn/) with a spatial resolution of 1 km. River system, obtained from OpenStreetMap (https://www.openstreetmap.org). Socioeconomic driver data mainly include: the distances to national, provincial, and county highways; townships; the first main road; highways; railroads; and the government were acquired from OpenStreetMap (https://www.openstreetmap.org), and population density data were attained from WorldPop (https://www.worldpop.org/), with a spatial resolution of 100 m. Gross domestic product (GDP).
2.3 Methods
2.3.1 Single land-use change dynamic attitude
Single land-use dynamics refer to the degree to which a certain land-use type (such as cultivated land, forests, and grasslands) changes over a certain period of time. The greater the absolute value of the dynamics, the more drastic the degree of change. The formula is as follows (Lambin et al., 2003; Shang et al., 2024):
where
2.3.2 Dynamic attitude towards integrated land-use change
Comprehensive land-use dynamics concern the overall degree of change in land-use type in the study area within a certain period. It covers not only the changes in a single land-use type but also the reciprocal transformation between various land-use types. The level of comprehensive land-use dynamics considers the rationality and sustainability of land-use in a region’s land-use policy and planning, resulting from profound significance. The formula is as follows (Shang et al., 2024):
where
2.3.3 PLUS model
The PLUS model presents a CA model that mines the causes of land expansion and landscape change. It is built on a rule mining framework (Land Expansion Analysis Strategy, LEAS) for land expansion analysis techniques and a multi-class stochastic seeding mechanism (Liang et al., 2021). The PLUS model was employed in this study because it produces more similar landscapes and higher simulation accuracy than other models.
2.3.3.1 LEAS
The land-use change components of each category in 2000 and 2010 were extracted using the LEAS module. The following six natural drivers were chosen: DEM, slope, soil type, Mean annual precipitation, Mean annual temperature, and distance to river systems. Meanwhile, the following nine socio-economic drivers were chosen: GDP density; population density; the distances to national, provincial, and county highways; townships; the first main road; highways; railroads; and the government. Random samples were obtained from the initial training dataset by using the random forest classification algorithm to determine the development probability and size of the drivers for each type of land use,
where
2.3.3.2 Markov Model
The Markov model was utilized in this work to predict land use based on historical land-use data in the research area (Liang et al., 2021). The following computation formula was used:
where
2.3.3.3 CARS
In the CARS module, the mechanisms of random seed and multitype random patch generation is based on a gradually decreasing threshold and are combined to simulate the spontaneous generation of land-use patches under the restriction of development probability (Liang et al., 2021; Jia et al., 2024). When the neighborhood effect of land type k is equal to 0 under the Monte Carlo method, the overall development probability surface of each land type
where
2.3.3.4 Accuracy Verification
The kappa coefficient ensures the accuracy of the land-use simulation results, revealing the feasibility and reliability of the data and simulation results (Liang et al., 2021; Jia et al., 2024). The kappa coefficient was calculated as follows to test the correctness of the simulation:
where
2.3.3.5 Simulation Scenario
Different regions have different developmental needs, and meeting these needs is key to land space planning, future land-use space simulation predictions, and providing forward-looking scientific theoretical references for urban managers and planners. Using pertinent research as a guide and considering the watershed’s particular conditions, this study (Liang et al., 2021; Jia et al., 2024; Xue et al., 2024). The land-use pattern in the Fen River Basin in 2030 was simulated using three distinct scenarios, each with a cost that was determined based on the information presented in Table 1.
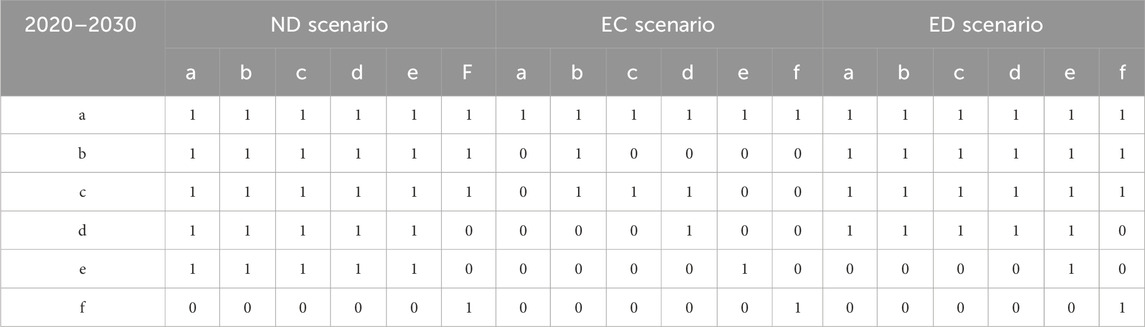
Table 1. Land use conversion cost matrix for each scenario.
The ND scenario was based on the land-use change rate and base year driving factors in the Fen River Basin from 2000 to 2020. The land-use simulation prediction was carried out without the influence of any policy, which is the basis for setting the constraints of other scenarios.
The EC scenario was based on the Fen River Basin Ecological Restoration Plan (2015–2030) and Ecological Landscape Planning (2020–2035), as well as other relevant provincial and municipal land and spatial planning. This scenario adds ecological security protection constraints based on the natural development scenario, which aims to protect the ecological environment and control the arbitrariness of existing natural ecological land transformation to achieve the effect of ecological environmental protection. The transfer of forests to construction land, grasslands to construction land, and cultivated land and water bodies to construction land has a probability decrease of 50%, 20%, and 30%, respectively. In contrast, the transfer of cultivated land to forests and grasslands has a probability increase of 30%.
The ED scenario was based on the “Outline of the 14th National Economic and Social Development Plan of Shanxi Province and the Long-term Goals for 2035″and the change trend of construction land in the ND scenario, the transfer of cultivated land and grasslands to construction land has a probability increase of 10%, and the transfer of construction to cultivated land, grassland, and forest land water bodies has a probability decrease of 70%.
2.3.4 HQ module of the InVEST model
In this study, the HQ of the Fen River Basin was evaluated using the HQ module of the InVEST model. The rationale for this model was based on land-use data calculated from the interaction between threat agents and habitats (Shi et al., 2024). HQ degradation was calculated as follows:
where
where
(Wei et al., 2022; Wu et al., 2022) The HQ assessment formula is as follows:
where
In this study, cultivated, construction, and unused land were selected as the threat factors affecting HQ. The parameters input to the model include the maximum influence distance, weight, decline type, and sensitivity of each land-use type to each threat agent (Shi et al., 2024). The specific parameters are shown in Tables 2, 3.
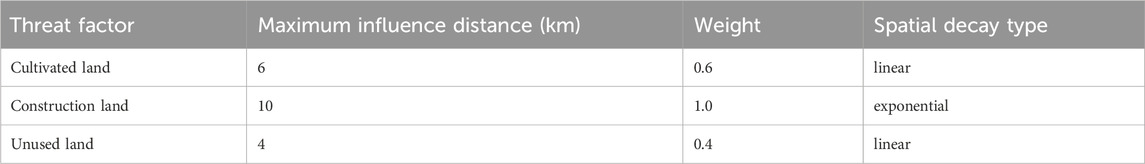
Table 2. Threat factors and their weight, maximum influence distance, and special decay type over space.
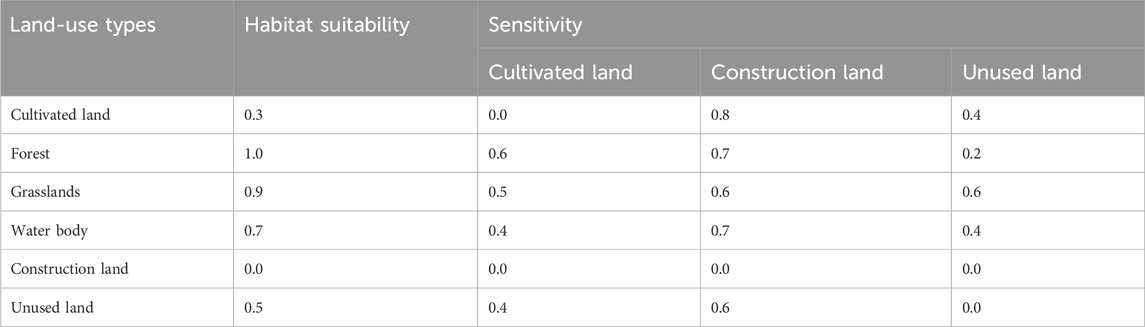
Table 3. Sensitivity of different land-use type to habitat threat factors.
The HQ Index ranges from 0 to 1, with values closer to one indicating higher HQ and rich biodiversity in the area. In order to clarify the spatial variation of HQ in the Fen River Basin, Citations to pertinent research and incorporation of watershed realities (Zhang et al., 2020; Yang et al., 2021), the HQ of the Fen Basin was divided into five levels: poor-value area (0.0–0.3), low-value area (0.3–0.5), intermediate-value area (0.5–0.7), moderate-value area (0.7–0.9), and high-value area (0.9–1.0).
2.3.5 HQ contribution rate of land-use transition
Land-use transformation affects HQ to a certain extent. To analyze the impact of land-use change on HQ more accurately (Chen et al., 2021; Qu et al., 2019; Wang and Cheng, 2022; Yang et al., 2020; Yin et al., 2020), a spatial overlay analysis of land-use transformation data and HQ change data in various scenarios from 2000 to 2030 was conducted using the grid calculator in ArcGIS 10.7, and a heat map was drawn using Origin software.
The contribution rate of HQ of land-use transformation refers to the change in the regional HQ index caused by the transformation of a certain land-use type, which quantifies the impact of the transition between land categories on the quality of the regional ecological environment, which is conducive to analyzing the dominant factors leading to the change in regional ecological environment quality (Liu and Long, 2016; Ren et al., 2018; Chen et al., 2020), which is expressed as the following:
where LEI is the ecological contribution rate to the transformation of certain land-use functions;
2.3.6 Research framework
The four main steps of this study were as follows: (1) comprehensive examination of the Fen River Basin’s land use development over time and space from 2000 to 2020; (2) Analyzing and simulating the spatiotemporal evolution of land use features in 2030; (3) Using the InVEST model, analyze and forecast the spatiotemporal evolution of habitat quality; and (4) Calculate HQ Contribution Rate of Land Use Transition. Figure 2 illustrates the study’s flow chart.
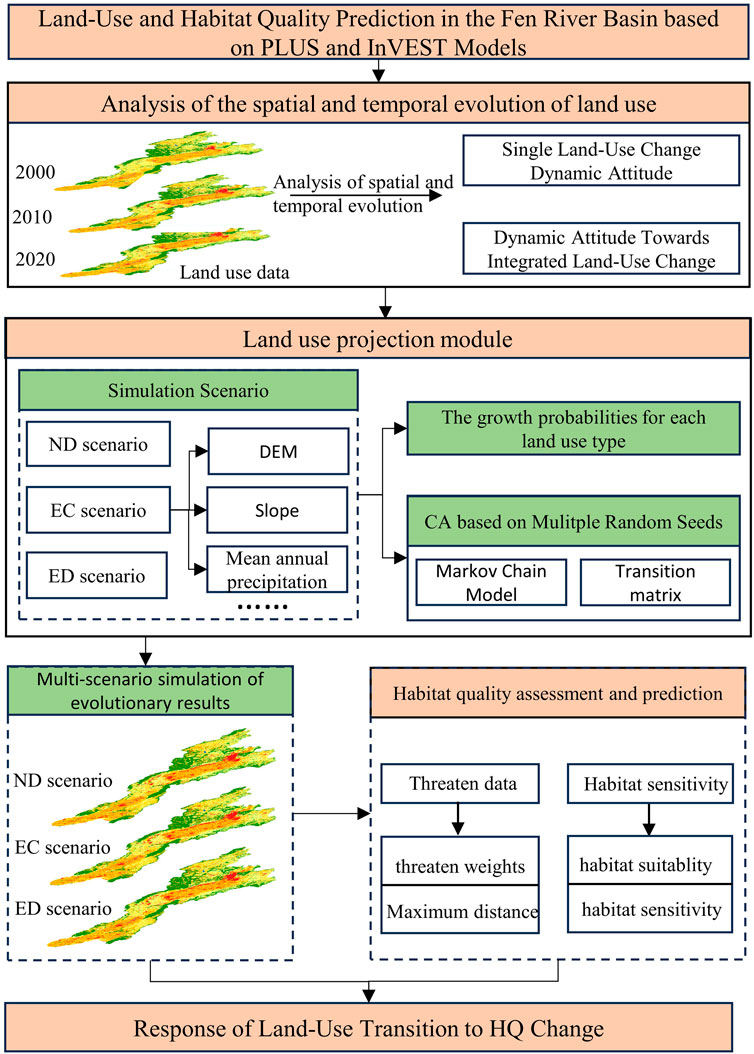
Figure 2. Research framework diagram.
3 Results
3.1 Land-use transitions
The main land-use types in the Fen River Basin are cultivated land and forests (Figures 3, 4). From the perspective of area changes, the overall local change trend from 2000 to 2020 was “two increases and four decreases.” That is, building land and forest land showed rising trends, whereas cropland, grassland, water bodies, and unutilized land all exhibited declining trends. Construction land had the greatest growth rate of 89.54%, which accounted for the largest area increase (1615.48 km2 in 2000–3060.46 km2 in 2020). Forests had an increasing and then decreasing trend, with an overall area increase of 165.72 km2 and a growth rate of 1.52%. The total area of cultivated land, grasslands, and unused land had a decreasing trend. The water body had an initial decrease, followed by an increase, with an overall area decrease of 911.54, 644.31, 4.42, and 49.14 km2 within a 20 years timeframe, and a reduction rate of −5.54%, −6.49%, −51.98%, and −15.45%, respectively.
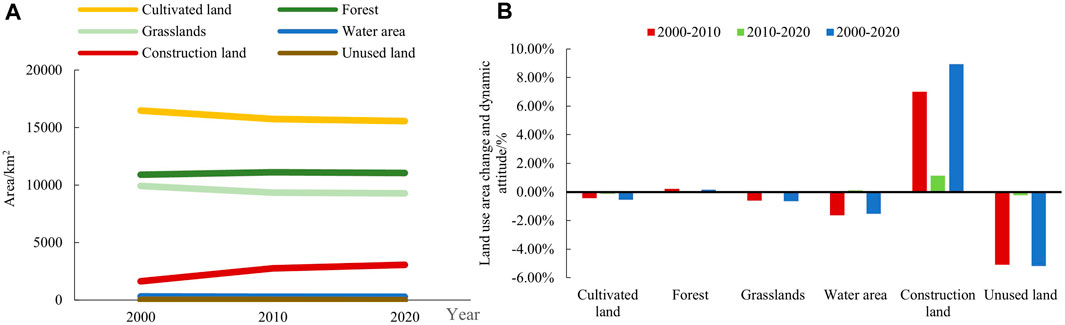
Figure 3. Changes in (A) land-use area and (B) dynamic land-use attitude gradient in the Fen River Basin from 2000 to 2020. (A) Yellow: cultivated land; light green: grasslands; red: construction land; green: forest; blue: water area; brown: unused land. (B) Red: 2000–2020; green: 2010–2020; blue: 2000–2020.
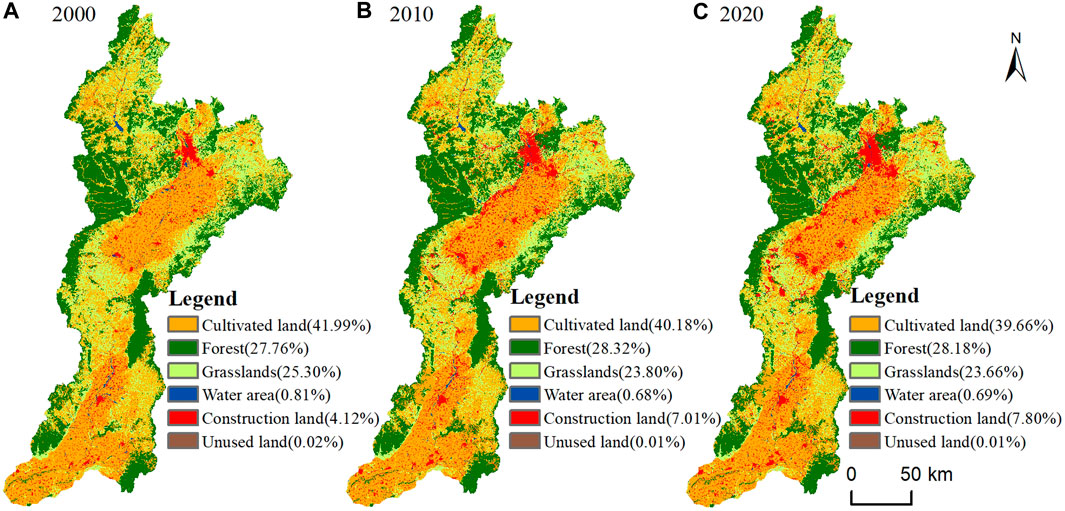
Figure 4. Land-use status in Fen River Basin from years 2000–2020. Yellow: cultivated land; light green: grasslands; red: construction land; green: forests; blue: water area; brown: unused land.
From the perspective of land-use change dynamics, from 2000 to 2020, the comprehensive land-use dynamics was 4.15%, and construction land showed the fastest growth (8.94%) in single land-use dynamic, followed by forests (0.15%). Cultivated land, grasslands, water body, and unused land showed a downward trend, with decreases of −0.55%, −0.65%, −1.55, and −5.20%, respectively. According to the Outline of the 14th National Economic and Social Development Plan of Shanxi Province and the Long-term Goals for 2035, the analysis results demonstrated that the dynamics of construction land are consistent with the trends of the river basin economy and construction development.
The Fen River Basin demonstrated spatial differentiation (Figure 4). The cultivated and construction land are primarily concentrated in the central and southern regions of the Fen River Basin, demonstrating a north-south belt distribution as a whole. These places are the core areas of low basins, flat terrain, convenient transportation, high ED, and high population density; and forest and grasslands are concentrated at the edge of the Fen River Basin.
From the analysis of the land-use transfer matrix (Figure 5), the area of construction land increased substantially from 2000 to 2010, mainly due to the transfer of cultivated land and grasslands, as the growth rate reached a maximum of 70.01%. In contrast, the growth rate (11.37%) of construction land was much slower between 2010 and 2020.
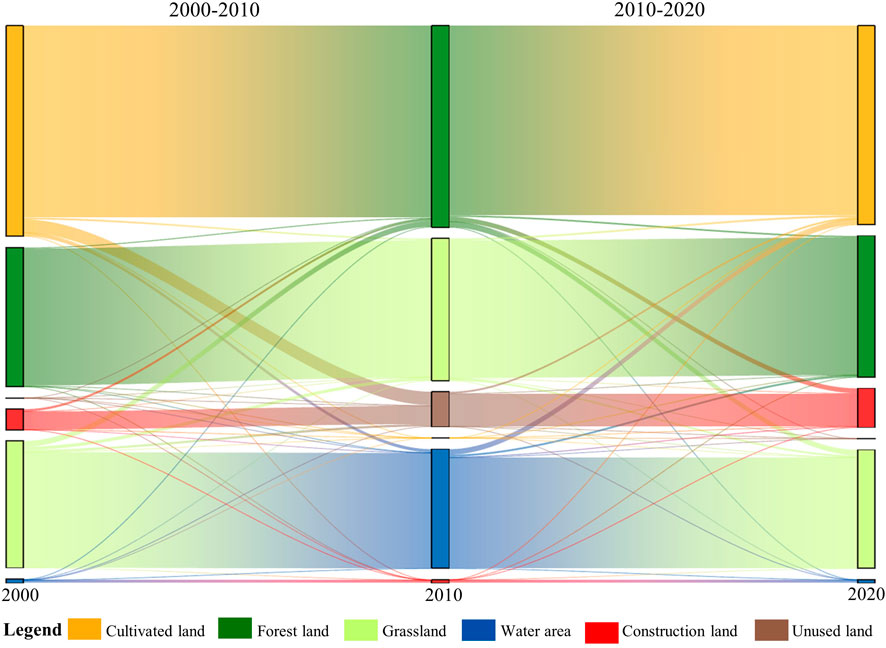
Figure 5. Land-use transfer matrices of the Fen River basin from 2000 to 2020. Yellow: cultivated land; light green: grasslands; red: construction land; green: forests; blue: water area; brown: unused land.
3.2 Land-use simulation
Based on historical data, the land use of the Fen River Basin was simulated in 2020. The simulation results were compared with the actual land use in 2020, and the kappa coefficient was 0.91, with an overall accuracy of 0.94. These findings suggested that the PLUS model simulation accuracy was high, and that it can accurately reflect land-use changes in the Fen River Basin. After determining the ideal parameter set using the PLUS model, three distinct 2030 scenarios were investigated (Figure 6).
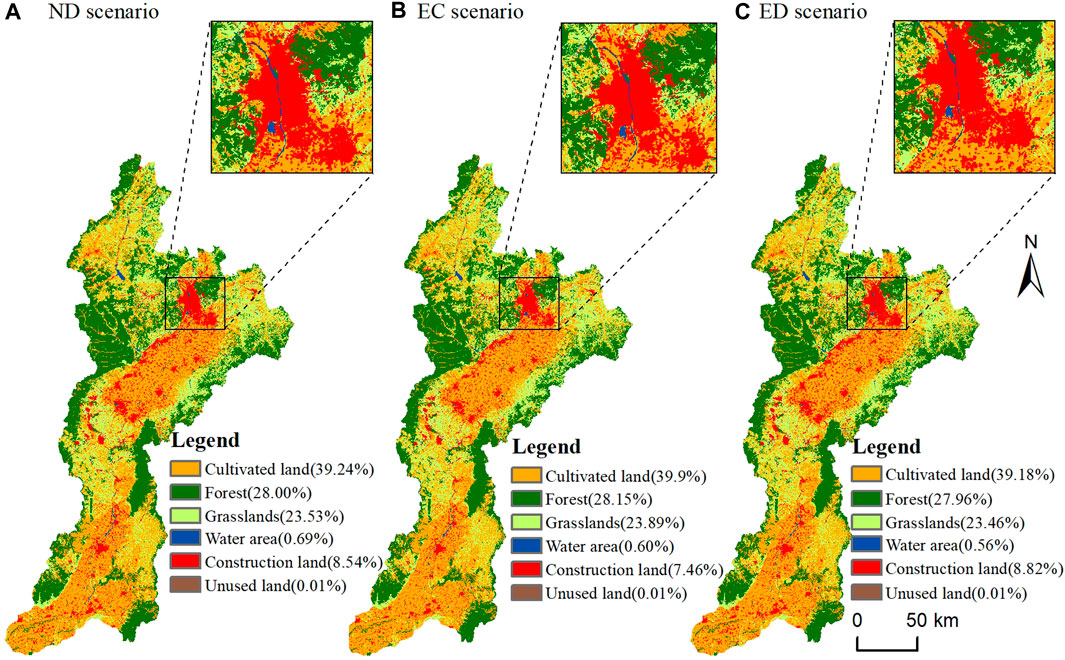
Figure 6. Land-use distribution map of the Fen River Basin in 2030. Yellow: cultivated land; light green: grasslands; red: construction land; green: forests; blue: water area; brown: unused land. ND: natural development; EC: ecological protection; ED: economic development.
The overall land-use pattern in the three scenarios was more consistent with the pattern of the river basin in 2020, and the main land-use types were cultivated land, forests, and grasslands. In the development law of land-use in the ND scenario from 2000 to 2020, the main land-use types in the Fen River Basin showed the characteristics of “one unchanged, two increases, and three decreases.” In other words, the amount of undeveloped land remained the same, the area occupied by buildings and water bodies expanded, and the area devoted to grasslands, forests, and undeveloped land decreased. Construction land had the greatest increase, with an estimated increase of 284.52 km2 by 2030, followed by water bodies, with an increase of 2.36 km2. Cultivated land continued to decrease in 2020, with a decrease of 184.99 km2, followed by forests and grasslands with an area decrease of 85.92 km2 and 61.69 km2, respectively. According to the results of the ND scenario, the ecological land-use of the Fen River Basin will be reduced. In the future, while ensuring social and economic development, attention should be paid to the protection of the urban ecological environment.
In the arbitrary conversion scenario of the EC scenario, forests, and grasslands accounted for the largest proportion of ecological land area. The rate of scenery is reduced, and its proportion is the largest; the increases in construction land is slightly lower than that in the other two scenarios.
In the ED scenario, the growth rate of construction land was the highest, with a growth rate of 12.97% and an area increase of 396.87 km2, indicating that urbanization in the Fen River Basin is accelerating in this context. However, there will be a continuous reduction of other ecological land as the city rapidly expands. Furthermore, it can be seen that cultivated land, forests, and grasslands have the largest decrease compared with the other scenarios.
3.3 Temporal and spatial characteristics of HQ
In 2000, 2010, and 2020, the HQ indices of the Fen River Basin were 0.6345, 0.6196, and 0.6152, respectively, with an of average 0.6231, demonstrating an intermediate-value area. However, over the past 20 years, the Fen River Basin has exhibited a continuous downward trend. The decline in HQ was most severe from 2000 to 2010, and the decline in HQ from 2010 to 2020 slowed compared to the previous decade, indicating that since 2015, the area with low HQ increased substantially, accounting for 47.46% of the total watershed in 2020, with an area increase of 557.45 km2, whereas the high-value area showed a continuous decrease between 2000 and 2020 (643.29 km2). The high-value area initially increased and then slightly decreased, with an overall increase of 164.70 km2. From the perspective of spatial patterns (Figure 7), the Fen River Basin showed distribution characteristics of high marginal HQ and low HQ in the central and southwestern regions. The Fen River Basin had the highest proportion of low-value HQ, accounting for 47.46% of the total basin; the space shows a clustering phenomenon, which is mainly distributed in the agricultural production area and urban core development area of the Fen River Basin, the central and south-central areas with high intensity of human activities, and the main land is cultivated land and construction land; this is followed by areas with high HQ values, accounting for 28.18% of the total basin, posted on the east and west sides of the river basin; forest and grassland coverage area, and human activity intensity is small.
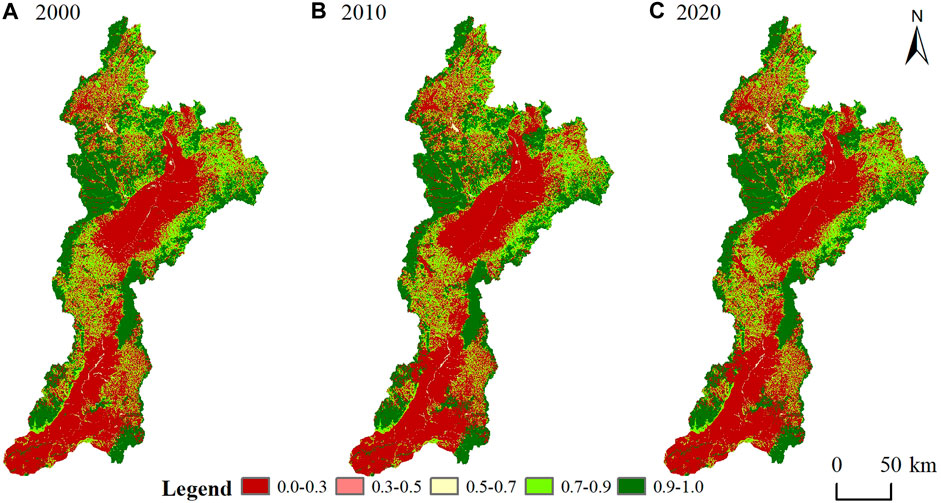
Figure 7. Spatial distribution of HQ of the Fen River Basin in (A) 2000, (B) 2010, and (C) 2020. Dark red: poor-value area (0.0–0.3); light red: low-value area (0.3–0.5); light red: low-value area (0.5–0.7); light green: moderate-value area (0.7–0.9); dark green: high-value area (0.9–1.0). HQ: habitat quality.
3.4 HQ simulation
In 2030, the ecological environment quality of the EC scenario (0.6107) was the highest, followed by the ND scenario (0.6171), and then the EC scenario (0.6086). The overall HQ was better, and the spatial distribution of HQ was consistent with that from 2000 to 2020 then the EC scenario (0.6086) (Figure 8).
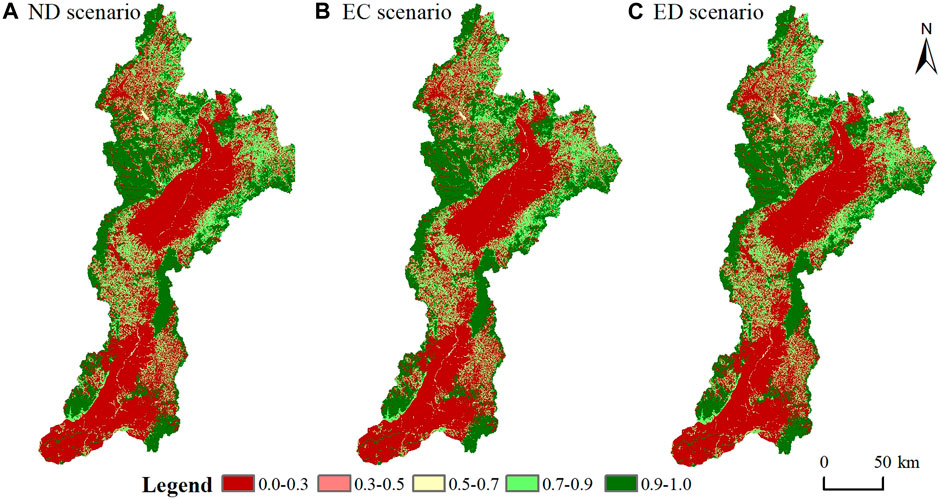
Figure 8. Multi-scenario HQ in the (A) ND, (B) EC, and (C) ED scenarios in the Fen River Basin in 2030. Dark red: poor-value area (0.0–0.3); light red: low-value area (0.3–0.5); cream: intermediate-value area (0.5–0.7); light green: moderate-value area (0.7–0.9); dark green: high-value area (0.9–1.0). HQ: habitat quality; ND: natural development; EC: ecological protection; ED: economic development.
In the ND scenario, in 2030, the HQ of areas of low-value increased by 99.53 km2, whereas the areas with high HQ and high value decreased by 86.52 km2 and 61.09 km2, respectively. It can be seen that in the ND scenario, the HQ of the Fen River Basin from 2020 to 2030 will deteriorate. In the EC scenario, the restriction of ecological arbitrary land conversion, such as the conversion of forests and grasslands, to land-use types with low ecological environment quality. The limitation of construction land expansion showed that the HQ in the poor- and low-value area decreased by 62.95 km2 and 0.04 km2, respectively, and the area with high HQ increased by 78.85 km2 and the high-value areas decreased; however, compared with 2020, the ecological environment quality in this scenario was higher, and the ecological environment quality improved. In the ED scenario, the urbanization process accelerated, and ecological land such as woodlands and grasslands decreased to varying degrees. Therefore, the area with low HQ increased the most compared with the other scenarios, and the area expanded by 190.70 km2, and this coincided with the expansion area of urban construction land distributed around the city, and the crowding of cultivated land by construction land was the main reason for the decline in HQ. The intermediate-, moderate-, and high-value areas decreased by 49.64 km2, 85.53 km2, and 101.22 km2, respectively.
3.5 Response of land-use transition to HQ change
Changes in HQ caused by land-use transformation in various scenarios from 2000 to 2030 are shown in Figure 9. In general, the conversions of cultivated land to grasslands, cultivated land to forests, cultivated land to construction land, grasslands to cultivated land, grassland to construction land, and forests to cultivated land dominated the changes in HQ in the Fen River Basin. Among them, cultivated land to grasslands and cultivated land to forests dominated the HQ in the watershed. The dominant watershed experienced a deterioration in HQ as a result of conversions from grasslands to cultivated land, forests to cultivated land, cultivated land to construction land, and grasslands to construction land.
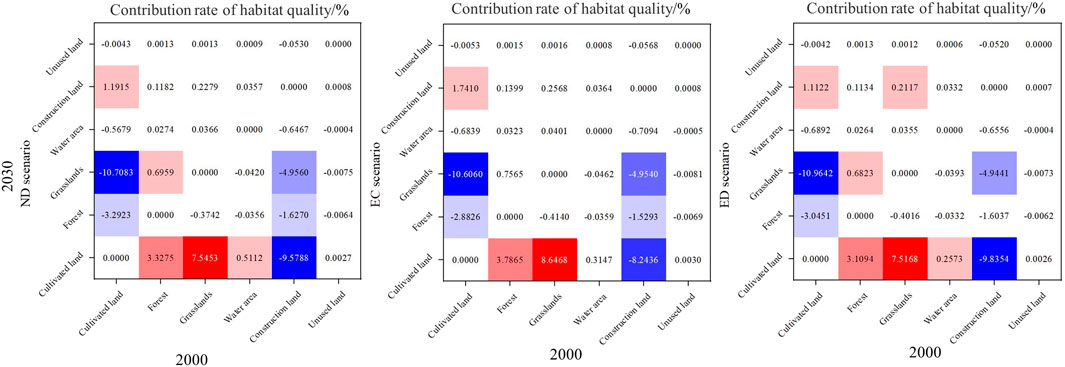
Figure 9. Effect of land-use transition on HQ in Fen River Basin from 2000 to 2030. HQ: habitat quality; ND: natural development; EC: ecological protection; ED: economic developmentTables.
In the ND scenario from 2000 to 2030, the conversion of grasslands to cultivated land was the dominant factor leading to a decline in HQ in the watershed, and the contribution rate of HQ was 10.71%. Followed by the conversion of cultivated land to construction land, grasslands to construction land, forests to cultivated land and construction land, the contribution rates of HQ were 9.58%, 4.96%, 3.39%, and 1.63%, respectively. The conversion of cultivated land to grasslands was the main factor that promoted the improvement of HQ in the watershed, with a contribution rate of 7.55%, followed by the conversion of cultivated land to forests and construction land to cultivated land, with contribution rates of 3.33% and 1.19%, respectively. In the EC scenario, the main conversion type leading to the decline and increase of HQ was the same as the ND scenario, in which the amount of HQ caused by the conversion of cultivated land to grasslands and woodlands was higher than that in the ND scenario, and the contribution rates of HQ were 8.65% and 3.79%, respectively.
4 Conclusion
The Fen River, which flows through Shanxi Province’s southern and northern districts and has multiple tributaries, is crucial to the sustainable development of the region. The Fen River Basin’s land use and ecological quality have witnessed substantial variations due to the formation of policies and regulations, rising urbanization, and the growth of the natural environment.
(1) The Fen River Basin is primarily composed of grassland, forest, and agricultural area. Between 2000 and 2020, the percentage of land used for building rose annually while the amount used for cropland, forests, and grasslands decreased. According to the simulation results of various scenarios, the amount of land that is expanded for construction varies; the ED scenario has the largest expansion scale, followed by the ND scenario, and the EC scenario has the smallest expansion scale of urban land.
(2) The Middle Fen River Basin’s HQ decreased between 2000 and 2020, with the fastest decline occurring between 2000 and 2010, and then beginning to ease after that. By 2030, the various scenarios’ HQ fell into the following order: scenarios in order of EC, ND, and ED. The years 2000–2030 exhibit a “low in the middle and high at the edges” pattern when seen spatially.
(3) In general, the primary land-use transfer that contributes to the degradation of habitat quality in the Fen River Basin is the conversion of biologically significant land, such as woodland and grassland, to urban development area. The improvement of habitat quality has been facilitated by the shift of agriculture to grassland and woods.
5 Discussion
The combined PLUS-InVEST model was employed in this work to evaluate and forecast the temporal and geographical evolutionary features of land use and HQ in the Fen River Basin. Projects involving the planning of landscapes and the conservation of biodiversity might use this work as a scientific reference.
The Fen River Basin was primarily composed of cultivated land, forest, and grasslands between 2000 and 2020. However, these areas have gradually reduced over time and construction land has increased. Furthermore, the distribution of the construction and cultivation land was strip-like in the central and southern areas of the river basin. This suggests that man-made landscapes are replacing natural ones in the Fen River Basin. To ensure the accuracy of the results of this work, pertinent data from previous studies (Liu et al., 2023; Ma et al., 2024; Xue et al., 2024) were collected and analyzed. These results were mostly in line with the study conclusions. According to the results of the various simulations, the construction land in the ND scenario is still expanding. In the EC scenario, it is also increasing, but the ecological land is protected, and the loss of forest and grassland is slowed down. In the ED scenario, the various land types are slightly reduced, but the construction land is expanding at the fastest rate. Numerous factors work together to change the land use in the Fen River Basin. Under the various simulation scenarios, the area under cultivation in the basin continues to shrink. This finding is directly linked to China’s implementation of the policy of converting farmland back to forest. Additionally, the need for construction land has grown significantly to meet the economic and social development of various cities, and a large amount of cultivated land has been occupied. This phenomenon is particularly evident in the central and southern regions, which have better natural and location conditions than other regions. The management of ecological soil erosion and land desertification in the watershed is largely dependent on forest land and grassland, which are the most significant types of ecological land. When the ecological land protection in the EC scenario is increased, the area of this land is reduced significantly. Thus, to encourage the sensible development and protection of forest land and grassland while actively carrying out the policy of returning farmland to forests and grassland, the government should establish a certain amount of nature protection, create forest parks, and direct the growth of ecological economy.
The HQ of the Fen River Basin is worsening every year. The fastest decline occurred between 2000 and 2010, whereas the slower decline occurred between 2010 and 2020. The ecological and environmental protection initiatives of Shanxi Province are related to this. When paired with the history of watershed governance, the scale of these efforts in 2015 was relatively limited. The “Fen River as the focal point of the ‘seven rivers’ ecological conservation and restoration of the overall program,” “Fen River Basin Ecological Restoration Planning (2015–2030),” and other governance initiatives were announced in Shanxi Province in 2015. The initiatives were implemented in succession, strengthening the overall land-use planning and ecological restoration of the basin. The ecological protection and restoration project of the mountains, forests, fields, lakes, and grasslands, which started in 2018, has not yet fully explained the positive significance of improving ecological land use for the ecological environment. Nevertheless, it has fully explained the changes in HQ from the results of this study. A comparison of the various modeling scenarios revealed that the ND scenario had lower watershed HQ than the EC scenario, which showed higher watershed ecosystem quality because it protected ecological lands. The ED scenario had the lowest ecosystem quality. Therefore, establishing the concept of ecological protection, prioritizing the safeguarding of ecological land, and preventing the occupation and agricultural development of forests and grasslands are essential steps for improving the ecological environment quality of the basin. Additionally, measures should be implemented to prevent construction land from encroaching upon ecological land and improve the ecological environment in the Fen River Basin.
In the ED scenario, the main conversion types leading to a decline in HQ were arable land and grasslands for construction. Compared with the EC and ND scenarios, the contribution rate of HQ was the largest, and the conversion of cultivated land to forests and grasslands promoted the HQ of the watershed. In summary, when other land-use types are converted into forests and grasslands, it improves the quality of the ecological environment of the river basin. Therefore, the relevant managers and planning of the Fen River Basin should coordinate all elements of natural resources, should strictly abide by the “ecological protection red line,” beware of the encroachment of cultivated land and construction land, plan an ecosystem compensation mechanism. Simultaneously, the quality of the ecological environment in the Fen River Basin should be improved, and the coordinated development of the ecological environment and social economy in the basin should be promoted.
In conclusion, the process of land-use change is extremely complex and influenced by multiple factors. The use of the PLUS model to simulate future land-use has limited data availability, which may impact simulation results. Furthermore, the impacts of socioeconomic factors, policy planning, and natural disasters on land-use change cannot be considered when simulating land-use scenarios, and the determination of parameters is subjective, which may affect the simulation results. Based on the findings of this study, the development of more sophisticated models can be achieved through the continuous reinforcement of field and long-term observational studies, leading to enhanced accuracy of research results. Furthermore, given the lack of fieldwork sessions, the list of threat factors and sensitivity parameters of the InVEST model used to calculate HQ in this study still has some limitations and ambiguous details. However, these parameters were established by combining data from other studies with a manual (Liu et al., 2023; Ma et al., 2024). In the future, these parameters can be combined with other data and fieldwork data to provide a more thorough and precise assessment of HQ.
Data availability statement
The datasets presented in this study can be found in online repositories. The names of the repository/repositories and accession number(s) can be found below: https://www.resdc.cn/.
Ethics statement
The manuscript presents research on animals that do not require ethical approval for their study.
Author contributions
YH: Conceptualization, Funding acquisition, Methodology, Writing–original draft, Writing–review and editing. JW: Data curation, Software, Writing–review and editing.
Funding
The author(s) declare that financial support was received for the research, authorship, and/or publication of this article. This work was supported by the Special Project “Mount Wutai Mountain Regional Ecosystem Service Function and Its Balance and Coordination Effect” of Mount Wutai Cultural Ecological Collaborative Innovation Center (2022WTS05).
Conflict of interest
The authors declare that the research was conducted in the absence of any commercial or financial relationships that could be construed as a potential conflict of interest.
Publisher’s note
All claims expressed in this article are solely those of the authors and do not necessarily represent those of their affiliated organizations, or those of the publisher, the editors and the reviewers. Any product that may be evaluated in this article, or claim that may be made by its manufacturer, is not guaranteed or endorsed by the publisher.
References
Aneseyee, A. B., Noszczyk, T., Soromessa, T., and Elias, E. (2020). The inVEST habitat quality model associated with land use/cover changes: a qualitative case study of the Winike watershed in the Omo-Gibe Basin, Southwest Ethiopia. Remote Sens. 12, 1103. doi:10.3390/rs12071103
Bai, L., Xiu, C., Feng, X., and Liu, D. (2019). Influence of urbanization on regional habitat quality: a case study of Changchun City. Habitat Int. 93, 102042. doi:10.1016/j.habitatint.2019.102042
Chen, M., Bai, Z., Wang, Q., and Shi, Z. (2021). Habitat quality effect and driving mechanism of land use transitions: a case study of Henan Water source area of the middle route of the south-to-north water transfer project. Land 10, 796. doi:10.3390/land10080796
Chen, S., and Yao, S. (2024). Evaluation of the protection effectiveness of national key ecological functional area based on land use and ecosystem service value. Environ. Dev. Sustain. 26, 12467–12487. doi:10.1007/s10668-023-03863-0
Chen, W., Zhao, H., Li, J., Zhu, L., Wang, Z., and Zeng, J. (2020). Land use transitions and the associated impacts on ecosystem services in the middle reaches of the Yangtze River economic belt in China based on the geo-informatic Tupu method. Sci. Total Environ. 701, 134690. doi:10.1016/j.scitotenv.2019.134690
Chen, Y., Qiao, F., and Jiang, L. (2016). Effects of land use pattern change on regional scale habitat quality based on invest model—a case study in Beijing. Acta Sci. Nat. Univ. Pekin. 52, 553–562. doi:10.13209/j.0479-8023.2016.057
Chu, L., Sun, T., Wang, T., Li, Z., and Cai, C. (2018). Evolution and prediction of landscape pattern and habitat quality based on CA-Markov and InVEST model in Hubei section of three gorges reservoir area (TGRA). Sustainability 10, 3854. doi:10.3390/su10113854
Du, S., Zhou, Z., Huang, D., Zhang, F., Deng, F., and Yang, Y. (2023). The response of carbon stocks to land use/cover change and a vulnerability multi-scenario analysis of the karst region in Southern China based on PLUS-InVEST. Forests 14, 2307. doi:10.3390/f14122307
Gong, J., Ma, X., Zhang, L., Liu, D., and Zhang, J. (2018). Spatiotemporal variation of habitat quality in Bailongjiang watershed in Gansu based on InVEST model. Res. Soil Water Conserv. 25, 191–196. doi:10.13869/j.cnki.rswc.2018.03.027
He, L., Xie, Z., Wu, H., Liu, Z., Zheng, B., and Wan, W. (2024). Exploring the interrelations and driving factors among typical ecosystem services in the Yangtze River economic Belt, China. J. Environ. Manage. 351, 119794. doi:10.1016/j.jenvman.2023.119794
Jana, A., Jat, M. K., Saxena, A., and Choudhary, M. (2022). Prediction of land use land cover changes of a river basin using the CA-markov model. Geocarto Int. 37, 14127–14147. doi:10.1080/10106049.2022.2086634
Jia, C., Fan, Y., Wei, C., Luo, K., Li, S., and Song, Y. (2024). Identifying internal distributions and multi-scenario simulation of ecosystem service value in Liaohe basin based on Geodetector and PLUS model. Wetlands 44, 7. doi:10.1007/s13157-023-01762-8
Jin, S., Liu, X., Yang, J., Lv, J., Gu, Y., Yan, J., et al. (2022). Spatial-temporal changes of land use/cover change and habitat quality in Sanjiang Plain from 1985 to 2017. Front. Environ. Sci. 10, 1032584. doi:10.3389/fenvs.2022.1032584
Kucsicsa, G., Popovici, E. A., Bălteanu, D., Grigorescu, I., Dumitraşcu, M., and Mitrică, B. (2019). Future land use/cover changes in Romania: regional simulations based on clue-S model and Corine Land Cover database. Landsc. Ecol. Eng. 15, 75–90. doi:10.1007/s11355-018-0362-1
Lambin, E. F., Geist, H. J., and Lepers, E. (2003). Dynamics of land-use and land-cover change in tropical regions. Annu. Rev. Environ. Resour. 28, 205–241. doi:10.1146/annurev.energy.28.050302.105459
Lei, J., Chen, Y., Li, L., Chen, Z., Chen, X., Wu, T., et al. (2022). Spatiotemporal change of habitat quality in Hainan Island of China based on changes in land use. Ecol. Indic. 145, 109707. doi:10.1016/j.ecolind.2022.109707
Li, J., Bai, Y., and Alatalo, J. M. (2020). Impacts of rural tourism-driven land use change on ecosystems services provision in Erhai Lake Basin, China. Ecosyst. Serv. 42, 101081. doi:10.1016/j.ecoser.2020.101081
Li, Q., Zhou, Y., Cunningham Mary, A., and Xu, T. (2021a). Spatiotemporal changes in wildlife habitat quality in the middle and lower reaches of the Yangtze River from 1980 to 2100 based on the InVEST model. J. Resour. Ecol. 12, 43–55. doi:10.5814/j.issn.1674-764x.2021.01.005
Li, Y., Duo, L., Zhang, M., Wu, Z., and Guan, Y. (2021b). Assessment and estimation of the spatial and temporal evolution of landscape patterns and their impact on habitat quality in Nanchang, China. Land 10, 1073. doi:10.3390/land10101073
Liang, X., Guan, Q., Clarke, K. C., Liu, S., Wang, B., and Yao, Y. (2021). Understanding the drivers of sustainable land expansion using a patch-generating land use simulation (plus) model: a case study in Wuhan, China. Comput. Environ. Urban Syst. 85, 101569. doi:10.1016/j.compenvurbsys.2020.101569
Liang, Y., and Liu, L. (2017). Simulating land-use change and its effect on biodiversity conservation in a watershed in Northwest China. Ecosyst. Health Sustain 3, 1335933. doi:10.1080/20964129.2017.1335933
Liu, F. T., and Xu, E. Q. (2020). Comparison of spatial-temporal evolution of habitat quality between Xinjiang Corps and Non-corps region based on land use. Ying Yong Sheng Tai Xue Bao 31, 2341–2351. doi:10.13287/j.1001-9332.202007.014
Liu, H., Wang, Z., Zhang, L., Tang, F., Wang, G., and Li, M. (2023). Construction of an ecological security network in the Fenhe River Basin and its temporal and spatial evolution characteristics. J. Clean. Prod. 417, 137961. doi:10.1016/j.jclepro.2023.137961
Liu, Q., Qiao, J., Li, M., and Huang, M. (2023). Spatiotemporal heterogeneity of ecosystem service interactions and their drivers at different spatial scales in the Yellow River Basin. Sci. Total Environ. 908, 168486. doi:10.1016/j.scitotenv.2023.168486
Liu, X., Liang, X., Li, X., Xu, X., Ou, J., Chen, Y., et al. (2017). A future land use simulation model (flus) for simulating multiple land use scenarios by coupling human and natural effects. Landsc. Urban Plan. 168, 94–116. doi:10.1016/j.landurbplan.2017.09.019
Liu, Y., and Long, H. (2016). Land use transitions and their dynamic mechanism: the case of the Huang-Huai-Hai plain. J. Geogr. Sci. 26, 515–530. doi:10.1007/s11442-016-1283-2
Luan, Y., Huang, G., and Zheng, G. (2023). Spatiotemporal evolution and prediction of habitat quality in Hohhot City of China based on the InVEST and CA-Markov models. J. Arid. Land. 15, 20–33. doi:10.1007/s40333-023-0090-8
Ma, X., Li, J., and Li, G. (2024). Simulation and multi-scenario prediction of land-use change in the Gansu section of the Yellow River Basin, China. Front. Environ. Sci. 12, 1403248. doi:10.3389/fenvs.2024.1403248
Qu, Y., Jiang, G., Li, Z., Tian, Y., and Wei, S. (2019). Understanding rural land use transition and regional consolidation implications in China. Land Use Policy 82, 742–753. doi:10.1016/j.landusepol.2018.11.014
Raji, S. A., Odunuga, S., and Fasona, M. J. (2022). Spatially explicit scenario analysis of habitat quality in a tropical semi-arid zone: case study of the Sokoto–Rima Basin. J. Geovisualization Spat. Anal. 6, 11–21. doi:10.1007/s41651-022-00106-0
Ren, H., Zhang, J., Zhu, W., Wang, L., Zhang, L., and Zhu, L. (2018). Impact of land use change on habitat in the qihe River Basin of Taihang mountains. Prog. Geogr. 37, 1693–1704.
Shang, S., Cui, T., Wang, Y., Gao, Q., and Liu, Y. (2024). Dynamic variation and driving mechanisms of land use change from 1980 to 2020 in the lower reaches of the Yangtze River, China. Front. Environ. Sci. 11. doi:10.3389/fenvs.2023.1335624
Shi, J., Liang, X., Wei, Z., and Li, H. (2024). Spatial–temporal heterogeneity in the influence of landscape patterns on trade-offs/synergies among ecosystem services: a case study of the Loess Plateau of northern Shaanxi. Environ. Sci. Pollut. Res. Int. 31, 6144–6159. doi:10.1007/s11356-023-31521-5
Shi, M., Wu, H., Fan, X., Jia, H., Dong, T., He, P., et al. (2021). Trade-offs and synergies of multiple ecosystem services for different land use scenarios in the Yili River Valley, China. Sustainability 13, 1577. doi:10.3390/su13031577
Singh, G., Dahiya, N., Sood, V., Singh, S., and Sharma, A. (2024). ENVINet5 deep learning change detection framework for the estimation of agriculture variations during 2012–2023 with Landsat series data. Environ. Monit. Assess. 196, 233. doi:10.1007/s10661-024-12394-8
Singh, G., Sethi, G. K., and Singh, S. (2021a). Survey on machine learning and deep learning techniques for agriculture land. SN Comput. Sci. 2, 487. doi:10.1007/s42979-021-00929-6
Singh, G., Sethi, G. K., and Singh, S. (2021b). Performance analysis of deep learning classification for agriculture applications using Sentinel-2 data. Commun. Comput. Inf. Sci. 1393, 205–213. doi:10.1007/978-981-16-3660-8_19
Singh, G., Singh, S., Sethi, G., and Sood, V. (2022a). Deep learning in the mapping of agricultural land use using Sentinel-2 satellite data. Geographies 2, 691–700. doi:10.3390/geographies2040042
Singh, G., Singh, S., Sethi, G. K., and Sood, V. (2022b). Detection and mapping of agriculture seasonal variations with deep learning–based change detection using Sentinel-2 data. Arab. J. Geosci. 15, 825. doi:10.1007/s12517-022-10105-6
Singh, G. K. S., Sethi, G. K., and Singh, S. (2022c). Quantitative and qualitative analysis of PCC-based change detection methods over agricultural land using sentinel-2 dataset 3rd international conference on computing, analytics and networks (ICAN). Rajpura, Punjab, India 2022, 1–5. doi:10.1109/ICAN56228.2022.10007391
Sun, X., Jiang, Z., Liu, F., and Zhang, D. (2019). Monitoring spatio-temporal dynamics of habitat quality in nansihu lake basin, eastern China, from 1980 to 2015. Ecol. Indic. 102, 716–723. doi:10.1016/j.ecolind.2019.03.041
Wang, B., and Cheng, W. (2022). Effects of land use/cover on regional habitat quality under different geomorphic types based on invest model. Remote Sens. 14, 1279. doi:10.3390/rs14051279
Wang, S. Y., Liu, J. S., and Ma, T. B. (2010). Dynamics and changes in spatial patterns of land use in Yellow River Basin, China. Land Use Policy 27, 313–323. doi:10.1016/j.landusepol.2009.04.002
Wei, Q., Abudureheman, M., Halike, A., Yao, K., Yao, L., Tang, H., et al. (2022). Temporal and spatial variation analysis of habitat quality on the plus-InVEST model for Ebinur Lake Basin, China. Ecol. Indic. 145, 109632. doi:10.1016/j.ecolind.2022.109632
Wu, J., Luo, J., Zhang, H., Qin, S., and Yu, M. (2022). Projections of land use change and habitat quality assessment by coupling climate change and development patterns. Sci. Total Environ. 847, 157491. doi:10.1016/j.scitotenv.2022.157491
Xiao, J., Zhang, Y., and Xu, H. (2024). Response of ecosystem service values to land use change, 2002–2021. Ecol. Indic. 160, 111947. doi:10.1016/j.ecolind.2024.111947
Xu, L., Guo, W., and Jia, J. (2024). Simulation and analysis of land use change in Jianghuai Hilly area based on PLUS model. Pol. J. Environ. Stud. 33, 1899–1914. doi:10.15244/pjoes/173108
Xue, Z., Meng, X., and Liu, B. (2024). Spatiotemporal evolution and driving factors of ecosystem services in the upper Fenhe watershed, China. Ecol. Indic. 160, 111803. doi:10.1016/j.ecolind.2024.111803
Yang, J., Xie, B., and Zhang, D. (2021). Spatial-temporal evolution of habitat quality and its influencing factors in the Yellow River Basin based on invest model and geodetector. J. Desert Res. 41, 12–22.
Yang, Y. (2021). Evolution of habitat quality and association with land-use changes in mountainous areas: a case study of the Taihang Mountains in Hebei Province, China. Ecol. Indic. 129, 107967. doi:10.1016/j.ecolind.2021.107967
Yang, Y., Bao, W., Li, Y., Wang, Y., and Chen, Z. (2020). Land use transition and its eco-environmental effects in the Beijing–Tianjin–Hebei urban agglomeration: a production–living–ecological perspective. Land 9, 285. doi:10.3390/land9090285
Yin, D., Li, X., Li, G., Zhang, J., and Yu, H. (2020). Spatio-temporal evolution of land use transition and its eco-environmental effects: a case study of the Yellow River Basin, China. Land 9, 514. doi:10.3390/land9120514
Zhang, X., Song, W., Lang, Y., Feng, X., Yuan, Q., and Wang, J. (2020). Land use changes in the coastal zone of China’s Hebei Province and the corresponding impacts on habitat quality. Land Use Policy 99, 104957. doi:10.1016/j.landusepol.2020.104957
Keywords: Fen River Basin, habitat quality, plus model, InVEST model, land type
Citation: Hou Y and Wu J (2024) Land-use and habitat quality prediction in the Fen River Basin based on PLUS and InVEST models. Front. Environ. Sci. 12:1386549. doi: 10.3389/fenvs.2024.1386549
Received: 15 February 2024; Accepted: 27 June 2024;
Published: 19 July 2024.
Edited by:
Sartajvir Singh, Chandigarh University, IndiaReviewed by:
Gurwinder Singh Balahara, Noida International University, IndiaVishakha Sood, Indian Institute of Technology Ropar, India
Copyright © 2024 Hou and Wu. This is an open-access article distributed under the terms of the Creative Commons Attribution License (CC BY). The use, distribution or reproduction in other forums is permitted, provided the original author(s) and the copyright owner(s) are credited and that the original publication in this journal is cited, in accordance with accepted academic practice. No use, distribution or reproduction is permitted which does not comply with these terms.
*Correspondence: Yanjun Hou, eWpob3UxMjIzQDE2My5jb20=