 Hannes Keck
 Katharina H. E. Meurer
 Sabine Jordan
 Thomas Kätterer
 David Hadden3
- 1Department of Ecology, Swedish University of Agricultural Sciences, Uppsala, Sweden
- 2Department of Soil and Environment, Swedish University of Agricultural Sciences, Uppsala, Sweden
- 3Bolin Centre for Climate Research, Stockholm University, Stockholm, Sweden
- 4Department of Forestry and Wood Technology, Linnaeus University, Växjö, Sweden
In the process of their formation, northern peatlands were accumulating vast amounts of carbon (C). When drained for agricultural use, a large proportion of that C is oxidized and emitted as carbon dioxide (CO2), turning those peatlands to strong CO2 emitters. As a mitigation option, setting-aside farmland on drained peat is being incentivized by policies, but recent evidence casts doubt on these policies’ efficiency for greenhouse gas (GHG) emission mitigation. To investigate the effects of setting-aside farmland on GHG fluxes from a Swedish peatland, we measured CO2, nitrous oxide (N2O), and methane (CH4) fluxes on two adjacent sites under contrasting management. The cultivated (CL) site was used for cereal production (wheat or barley) and the set-aside (SA) site was under permanent grassland. Carbon dioxide fluxes were measured from 2013 to 2019 using the eddy covariance (EC) method. Additionally, CO2, N2O, and CH4 fluxes were measured during the growing seasons of 2018–2020, using transparent and opaque chambers on vegetated plots and on bare peat. The cumulative CO2 fluxes measured by EC over the measurement period were 0.97 (±0.05) and 2.09 (±0.17) kg m−2 with annual average losses of 0.16 and 0.41 kg CO2 m−2 yr−1 for the CL and SA site, respectively. Thus, the SA site acted as a stronger CO2 source than the CL site. Both sites’ contribution to global warming, calculated on basis of the chamber measurements, was dominated by CO2. The contribution of the SA site was higher than that of the CL site. Nitrous oxide emissions were low at both sites with higher emissions from the CL site for transparent measurements and measurements on bare peat. Whereas, CH4 uptake was highest on the SA grassland. Thus, on the basis of our study, we found no evidence that setting-aside farmland on shallow drained peat soils will reduce GHG emissions or even turn the peatland into a C sink.
1 Introduction
Peatlands cover approximately 3% of the global land area and store about 679 Gt of carbon (C) (Leifeld and Menichetti, 2018; Xu et al., 2018). Peat is a C deposit from decayed vegetation formed under anaerobic conditions during the postglacial period when C uptake exceeded C losses from peatland ecosystems. Most pristine peatlands act as carbon dioxide (CO2) sinks, emit small amounts of nitrous oxide (N2O; Minkkinen et al., 2020) and are sources of methane (CH4; Frolking and Roulet, 2007). The high global warming potential (GWP) of CH4 (27 times more efficient than CO2 over a 100-year period, GWP100, Foster et al., 2021) makes it that some peatlands have a net warming effect on the climate (Frolking et al., 2006; Koehler et al., 2011). However, due to the relatively short lifetime of CH4 in the atmosphere, most pristine peatlands act as overall net C sinks, sequestering approximately 13–22 g C m−2 yr−1 (Yu et al., 2010). Furthermore, peatland’s CO2 uptake exceeds the emitted CH4 in terms of CO2 equivalents (CO2EQ) (Lai, 2009; Gallego-Sala et al., 2018). When drained for agricultural use, the decomposition of organic matter (peat) is accelerated in the aerated peat and the ecosystem begins to lose C in the form of CO2. The rate of CO2 lost to the atmosphere is related to temperature and the water table depth, but at the same time, the aerated peat exhibits reduced CH4 emissions or turns even into a CH4 sink (Maljanen et al., 2010; 2004; Ballantyne et al., 2014; Knox et al., 2015; Evans et al., 2021). Agricultural peatlands, especially when ploughed and fertilized, can further accelerate decomposition rates and increase CO2 emissions due to the increased oxygen and nitrogen (N) availability that may lead to a higher soil microbial activity (Maljanen et al., 2007; 2004; Lund et al., 2009). Nitrogen fertilization increases N availability not only for plants but also for microorganisms. Under anaerobic conditions, denitrifiers can reduce nitrate via nitrite and nitric oxide to N2O during denitrification, serving as the main source of atmospheric N2O (Ravishankara et al., 2009; Kuypers et al., 2018). This process often takes place in oxygen-deficient aggregates in the soil, referred to as “hot-spots” for N2O production and at sporadic “hot-moments” in time when the conditions are favourable (Kuzyakov and Blagodatskaya, 2015). Ammonia-oxidizing microorganisms can perform a similar process under aerobic conditions, which is known as “nitrifier denitrification” (Kuypers et al., 2018). Thus, the use of N fertilizer can increases N2O emissions from agricultural ecosystems (Davidson, 2009).
Globally, GHG emissions from drained peatlands are high and the potential for anthropogenic emission reduction by peatland restoration (e.g., re-wetting) is estimated to 1.9 Gt CO2EQ (Leifeld and Menichetti, 2018). Even though only a small fraction of Nordic agriculture is located on drained peatland, this fraction strongly contributes to national GHG emissions. About 10% of the agricultural land in Sweden is located on peat and gyttja soils (gyttja: mineral matrix enriched by humic deposits, see Holstad and Degago, 2021) and is responsible for about 6%–8% of the national GHG emissions (Berglund and Berglund, 2010). In Finland, this area is 15% of the total agricultural land, which leads to about 8% of national GHG emissions (Kasimir-Klemedtsson et al., 1997; Maljanen et al., 2004). Politicians are therefore well advised to incentivize practices for reducing GHG emissions from agricultural peatlands if they endeavour to meet the goals defined in the Paris Agreements. However, since many drained peatlands are productive agricultural soils (e.g., Richardson and Smith, 1977; Kramer and Shabman, 1993), a balanced compromise between the degree of environmental protection, or the livelihood of future generations, and short-term economic profitability needs to be made. Until today, incentives on EU and member state level are in place for supporting peatland drainage, e.g., direct payments to farmers for setting aside drained peatlands as grassland (Chen et al., 2023; EU Regulation No 1307/2013, 2013). Some may favour an intensification of agricultural production on a limited land area to enable setting-aside farmland (i.e., land-sparing) for environmental protection purposes and eventually reducing the GHG emissions from agriculture (e.g., Burney et al., 2010; Tilman et al., 2011; Wang et al., 2018). In a Canadian study, Wang et al. (2018) found that C sequestration of a pristine bog was lower than of an adjacent abandoned pasture on the same peatland complex in Newfoundland and relate this difference to contrasting above ground biomass. The authors tentatively suggested that abandoning peatland pastures could be a method to increase C sequestration in peatland ecosystems. However, this may not be applicable to many peatlands. Several studies have investigated how different management intensities including setting-aside agricultural land influence GHG fluxes from Nordic peatlands, with variable results (Maljanen et al., 2010; 2007; Hadden and Grelle, 2017; Wang et al., 2018; Berglund et al., 2021; Evans et al., 2021). Berglund et al. (2021) and Hadden and Grelle (2017), however, showed that a set-aside grassland on drained peat had higher respiratory net CO2 losses than an adjacent cultivated peat in central Sweden. Hadden and Grelle (2017) measured CO2 fluxes from a cultivated cereal cropping system and an adjacent set-aside grassland on shallow peat over a period of 4 years. They concluded that the set-aside grassland acted as a small net CO2 source, whereas the cropland acted as a small net sink. Berglund et al. (2021) measured CO2, CH4, and N2O fluxes at the same site using manual and automatic chambers and found that the set-aside grassland acted as a stronger GHG source than the cropland. Maljanen et al. (2010) concluded in their review that annual CO2 and N2O fluxes from abandoned croplands on peat were similarly high as those from cultivated peatlands in the Nordic countries. Maljanen et al. (2007) came to a similar conclusion when comparing the GHG fluxes from several sites of cultivated and abandoned peatlands in Finland. Evans et al. (2021) found that the effect of peatland management was negligible compared to the importance of the effective water table depth for C emissions from peatland ecosystems.
In this study, we build upon the work of Hadden and Grelle (2017) and Berglund et al. (2021) with a more extensive data-set including more than 6 years of eddy covariance (EC) CO2 flux data and combine it with 3 years of manual chamber measurements of CO2, N2O, and CH4 fluxes and investigate the GHG flux dynamics at two adjacent sites, a cultivated (CL) peatland and a set-aside (SA) grassland on peat. We apply modern EC data processing protocols, comparing our results with those of Hadden and Grelle (2017) and extend on their work by comparing EC and chamber-based CO2 flux measurements. We hypothesize that (i) different management has no effect on the cumulative CO2 fluxes from either site, (ii) the CL site is a larger source of N2O and (iii) a stronger sink for CH4.
2 Material and methods
2.1 Site description
The study sites were located on a drained peatland in central Sweden, 30 km NW of Uppsala (Figure 1). The mean annual temperature (1989–2019) is 5.9°C and the mean annual precipitation is 590 mm yr−1 (Table 1; SMHI, 2023). The EC measurements at the CL site (60.0835°N, 17.233°E) and at the SA grassland (60.079°N, 17.236°E) were established in 2012. The two sites are located 0.5 km from each other. The average peat thickness at the CL and SA site were about 25 cm and 34 cm, respectively. The original peatland was drained in 1878 (Nerman, 1898). During this time, the peat thickness was considerably greater than it is today, since peatland subsidence due to drainage is estimated to range from 0.5 to 2.5 cm yr−1 for Nordic peatlands (Berglund, 1996). The CL site had been used as cropland for more than 10 years prior to the study period. During the study period (2013–2019), spring wheat was grown as a sacrificial crop for wildlife and, thus not harvested during the whole study period except for 2016 and 2018. In 2016, the field was fallowed and no agricultural management has been taking place. In 2018, barley was grown and harvested (3.7 Mg ha−1). In spring 2013 and 2014, the field was ploughed to a depth of 20 cm using a mouldboard plough. In 2015, as well as between 2017 and 2020 tillage was done using a carrier disk cultivator. Nitrogen fertilizer (70 kg ha−1) was applied when the barley was sown in spring 2018.
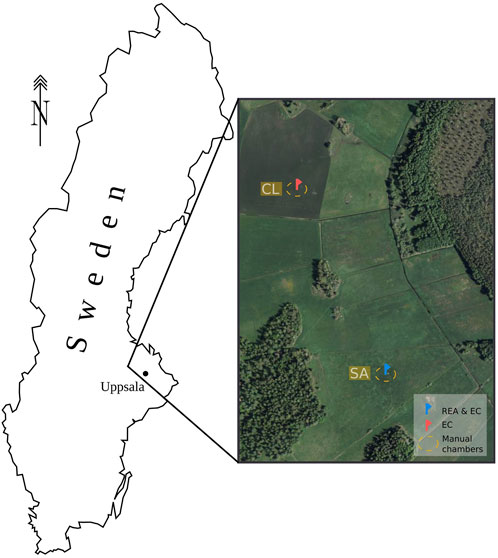
Figure 1. Map of the set-aside (SA) grassland and the cultivated (CL) site in Sweden (Keck, 2024).
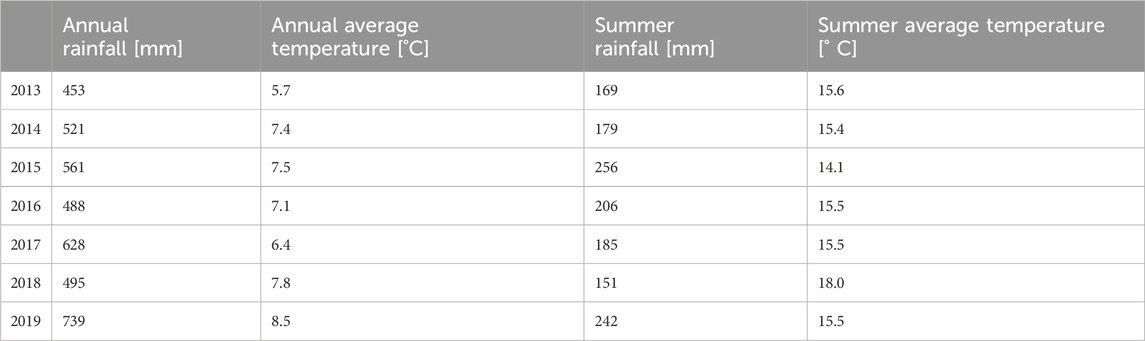
Table 1. Annual and summer (May to August) rainfall and average temperature at the study sites. Precipitation data were retrieved from the Swedish Meteorological and Hydrological Institute (SMHI, 2023).
The SA grassland was a permanent grassland for more than 30 years, and during the study period, it was only cut once per season from 2015–2019 with all biomass remaining on site, except in 2018, when the grass was removed as hay for fodder. Chemical soil properties at 5–15 cm depth were similar on both sites with 33.6% and 31.7% total C (i.e., organic C for a peat soil), 2.03% and 1.93% total N, and thus a C/N ratio of 16.5 and 16.4 for the CL and SA site, respectively (Berglund et al., 2021). More information on the site’s background can be found in Berglund et al. (2021) and Hadden and Grelle (2017).
2.2 Instrumentation
2.2.1 Eddy covariance
At both sites, EC flux measurements were conducted continuously during the study period. On the CL, a three-dimensional ultrasonic anemometer (Solent 1012R3, Gill Instruments, Lymington, United Kingdom) and a closed path gas analyser (LI-6262, LI-COR Inc., Lincoln Nebraska, United States) were installed. Air was drawn at a rate of 12 L min−1 through a high-density polyethylene sample line (6 mm diameter) with the inlet at 2.5 m above ground. The same setup was used at the SA site, however in 2012 and 2014, the gas analyser was replaced by a GGA-EP Off-Axis Integrated Cavity Output Spectroscopy (OA-ICOS; Los Gatos Research Inc., San Jose, CA, United States), a dry scroll pump, and a 10 mm diameter PTFE tube, and in 2019 by an open path analyser (LI-7500, LI-COR Inc., Lincoln, Nebraska, United States). More details about the instrumentation can be found in Hadden and Grelle (2017).
2.2.2 Non-steady-state chambers
During the growing seasons of 2018–2020, regular chamber flux measurements were taken on both sites. On the CL site, eight base rings were installed, on which flux measurements were taken by means of manual chamber sampling. A transparent chamber was used that was equipped with a vent tube, a fan and a thermometer. Four vials (each 50 mL) per closed chamber period of 12 min were taken and later analysed by a G2508 gas analyser (Picarro, Santa Clara, CA, United States) to determine the dry mole fractions of CO2, CH4, and N2O. On five base rings, CO2 flux as net ecosystem exchange (NEE) was measured (the vegetation was left intact), and on three base rings, soil respiration (RSOIL, i.e., no vegetation) was measured. Additionally, ecosystem respiration (RECO) measurements were taken using the same chamber but covered with a custom-made opaque hood. These measurements were taken on the vegetated base rings. On the SA grassland, 15 base rings were installed, ten of which were used to measure NEE and five to measure RSOIL. Here, the same transparent chambers were used, but connected directly to the Picarro G2508 gas analyser via a custom-made air circulation system. For more details see Keck et al. (under review). A comparison between the two gas sampling approaches did not show significant differences (Supplementary Table S1). Note that the NEE measurements by the manual chambers were only used for the comparison of the EC and the chamber method. At each chamber measurement, the temperature inside the chamber and the soil temperature at 5 cm depth outside the chamber were recorded and a soil sample for gravimetric soil water content determination from the immediate surrounding of the chamber base ring was taken.
2.3 Climate variables
Air temperature and relative humidity using a MP103A sensor (ROTRONIC AG, Bassersdorf, Switzerland) were logged on a CR1000 data logger (Campbell Scientific, Logan, UT, United States) with an average interval of 30 min. On each site at 5 cm depth, soil moisture and soil temperature were measured using EC-5 sensors (Decagon Devices Inc., Pullman, WA, United States) and Model 107 thermistors, respectively. On the CL site, a pyranometer (LI 200, LI-COR Inc., Lincoln, NE, United States) measured global radiation. The water table depth was measured manually every time chamber flux measurements were taken using a perforated pipe, which was installed vertically in the soil to a depth of 140 cm. Precipitation data for the years 1990–2020 were retrieved from the weather station in Harbo (5.9 km from the CL site), run by the Swedish Meteorological and Hydrological Institute (SMHI, 2023). When this station was inactive, the gaps were filled with data from the closest active stations (Tärnsjö, about 16 km and Östervåla, 7 km from our sites for the periods 2015-04-01 to 2016-09-29 and 2016-09-29 to 2019-12-31, respectively). The data were used to calculate the average annual rainfall of the area and as a proxy for water availability during the measurement period. For visualizing purposes only, 30-min gaps within the climatic variables (air temperature, global radiation and relative humidity) were filled using linear interpolation and longer gaps using the average of the same date and time of all years.
2.4 Eddy covariance data processing
The high frequency data (20 Hz) were logged and processed by the Ecoflux software (In Situ Flux Systems AB, Ockelbo, Sweden). The turbulent fluxes were calculated according to Aubinet et al. (1999) on a 30 min block-averaging basis. This included a two-fold coordinate rotation and lag determination by cross-correlation analysis. Data gaps, mainly due to power or pump failures, summed up to 24.2% and 7.9% for the CL and SA site, respectively. For further data processing, the statistical programming language R (version 4.3.1; R Core Team, 2023) was used. Periods of low turbulent mixing were determined using the ustar filtering method proposed by Papale et al. (2006) implemented in the R package REddyProc (version 1.3.2; Wutzler et al., 2018). Fluxes originating from these periods were rejected. Outliers were removed by the absolute deviation about the median method by Papale et al. (2006) as well as negative night-time fluxes. After all, post processing and quality control steps the data gaps summed up to 35.3% and 24.3% for the CL and SA site, respectively.
2.5 Gap-filling and flux partitioning
The data gaps due to power or instrument failure, outlier removal, and ustar filtering were gap-filled by the marginal distribution sampling (MDS) method by Reichstein et al. (2005). This method is a combination of the look-up table (LUT) and the mean diurnal course (MDC) approach (Falge et al., 2001). In brief, the LUT approach bins the fluxes based on similar meteorological conditions within a moving window around the missing value. The missing value is then calculated as the mean of the time window and the bin representative of the respective measured meteorological conditions. The MDC approach exploits the autocorrelation of the diurnal CO2 fluxes by using a moving time window of several days around the gap and fills it by the mean of the fluxes occurring during this window and at the same time (±1 h). The MDS approach applied here used the LUT approach when meteorological data (global radiation, air temperature and vapour pressure deficit, VPD) were available. When no meteorological data were available the MDC approach was used. This method was described and tested in detail (e.g., Reichstein et al., 2005; Moffat et al., 2007; Desai et al., 2008; Wutzler et al., 2018). Data gaps that could not be filled by the MDS method were filled by the average value of the same date and time of all other measurement years at the same site. This was particularly true for extended periods in the summers of 2017 and 2018 on the CL site when we experienced instrument failures repeatedly. The measured NEE was partitioned into gross primary production (GPP) and RECO. For the night-time flux partitioning, the method of Reichstein et al. (2005) and Wutzler et al. (2018) was used to estimate relationships between nocturnal respiration (when RG < 10 W m-2) and air temperature on a temporal basis. The Lloyd and Taylor (1994) relationship was then applied to estimate daytime RECO. The GPP was calculated as the difference between the NEE and RECO. Cumulative fluxes at both sites were calculated by summing up all half-hourly fluxes. Only non-gap-filled data were used for consecutive analysis. The uncertainty introduced by the ustar threshold application was calculated by the bootstrap approach described by Wutzler et al. (2018). The uncertainty due to the gap-filling was estimated by calculating the standard deviations of the means that were used to fill the gaps by the different approaches (Wutzler et al., 2018).
2.6 Chamber flux calculation and comparison with eddy covariance
The chamber flux estimates were calculated using a quadratic or linear model with the statistical programming language R. The linear model was chosen only if: i) just three vial concentration measurements were available (for the CL site), which was the case if individual vial concentration measurements were faulty due to, e.g., leakage. Those were then excluded from the flux estimate calculation, ii) If the linear model described the data distribution better than the quadratic model on the basis of a p-values comparison. In all other cases a quadratic model was used to estimate GHG fluxes. Furthermore, detection limits according to Keck et al. (2023, under review) for N2O and CH4 flux estimates were calculated and any data below our systems detection limit (in absolute terms) flagged.
A comparison between the NEE measured by the EC and the chamber method was done by extracting non-gap-filled EC data that corresponded to the time (±1 h) when chambers where taken.
3 Results
3.1 CO2 fluxes measured by eddy covariance
The cumulative CO2 fluxes from both sites over the measurement period (2013-01-01 to 2019-08-28) were 0.97 (±0.05) and 2.09 (±0.17) kg CO2 m−2 with annual average losses (2013-01-01 to 2018-12-31) of 0.16 and 0.41 kg CO2 m-2 yr−1 for the CL and SA site, respectively. Thus, both sites acted as net CO2 sources (Figure 2). The difference in the inter-annual flux dynamics of the CL and the SA site can likely be explained by the contrasting management on both sites. The management on the CL site led to variable NEE fluxes over the years. The soil disturbance due to ploughing and the onset of crop growth in spring is visible in the sudden CO2 losses and strong CO2 uptake thereafter (years 2013 and 2014 in Figure 2). The years with disc carrier cultivation showed more gradual CO2 emission peaks in early spring (years 2015, 2017–2019 in Figure 2). The consistent management and little disturbance on the SA grassland led to smaller inter-annual variations of NEE fluxes compared to the CL site. Highest seasonal CO2 emissions were observed at the end of the growing season and strong CO2 uptake during the vegetation period. The strongest CO2 uptake was observed in 2019, possibly due to a legacy effect of the difference in management in the previous season, when the vegetation was removed after the annual cut, due to an animal feed shortage. The driest and hottest summer during the study period was in 2018 (Table 1), which exhibited temperature and water stress on the ecosystem. This is evident from the highest VPD and the highest air temperature during that summer (Figure 3), coinciding with the low CO2 uptake at the grassland site (Figure 2). In Figure 4 the relationship of NEE and temperature for the months May to August of the years 2018 and 2019 on the SA site are shown. In both years during daytime the rate of change was similar, however in 2019, the ecosystem at the SA site was starting to take up CO2 at lower temperatures compared to the dry season of 2018. During night-time, respiration increased with rising temperatures in 2019 but stayed close to constant in 2018.
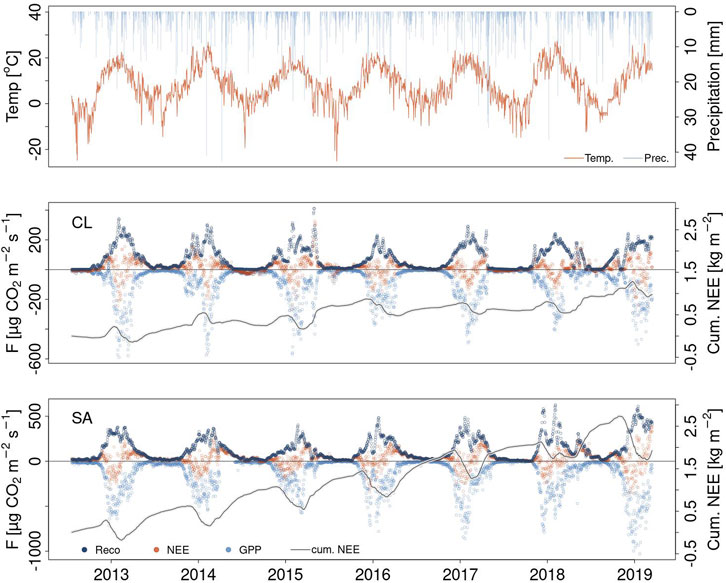
Figure 2. Average daily temperature (red, top panel) and precipitation (blue, top panel) at the study site. Average daily CO2 flux as ecosystem respiration (RECO, dark blue), net ecosystem exchange (NEE, red), and gross primary production (GPP, light blue) and cumulative CO2 fluxes (Cum. NEE) at the cultivated (middle panel) (CL) and set-aside site (bottom panel) (SA).
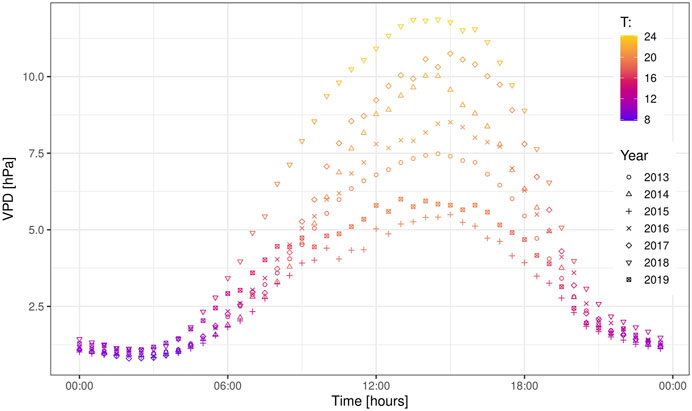
Figure 3. Diurnal courses of summer time vapour pressure deficit (VPD) and air temperature (°C) at our research sites.
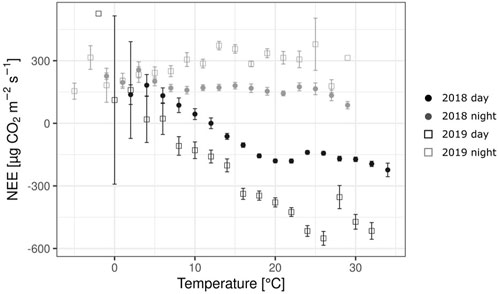
Figure 4. Mean net ecosystem exchange (NEE; error bars: standard error) in relation to air temperature at the SA site for the months of May to August in 2018 and 2019 at night (grey) and at day (black).
3.2 Greenhouse gas fluxes measured by non-steady-state chambers
During the summer months (May to August) of the 3-year chamber measurement period, mean net CO2 fluxes of −234.9 and −276.8 μg m−2 s−1, mean RECO of 150.7 and 476.1 μg m−2 s-1 and mean RSOIL fluxes of 113.7 and 215.6 μg m−2 s−1 were measured on the CL and SA site, respectively (Table 2). As many as 70.8% of N2O and 30.2% of CH4 fluxes were (in absolute terms) below our instrumentation’s detection limit for the CL site and 50.0% of N2O and 1.82% of CH4 fluxes at the SA site according to the method by Keck (2024) (Supplementary Table S1). Average N2O fluxes were higher at the CL site at vegetated base rings using the transparent chamber and on bare peat; however, when the opaque chamber was used we observed higher N2O emissions from the vegetated base rings at SA site. On average negative CH4 fluxes were observed, at both sites with higher uptake at the SA site. The contribution to global warming was calculated for both sites in CO2EQ based on GWP100 of 273 and 27 CO2EQ for N2O and CH4, respectively (Forster et al., 2021). The GHG balance at both sites was dominated by the CO2 fluxes, the fluxes of N2O and CH4 had only a small influence. At the SA site, the overall GHG source in terms of CO2EQ was larger for the opaque and bare peat measurements than that of the CL site (Table 2). For the transparent chamber measurements, the SA site was a stronger sink than the CL site.
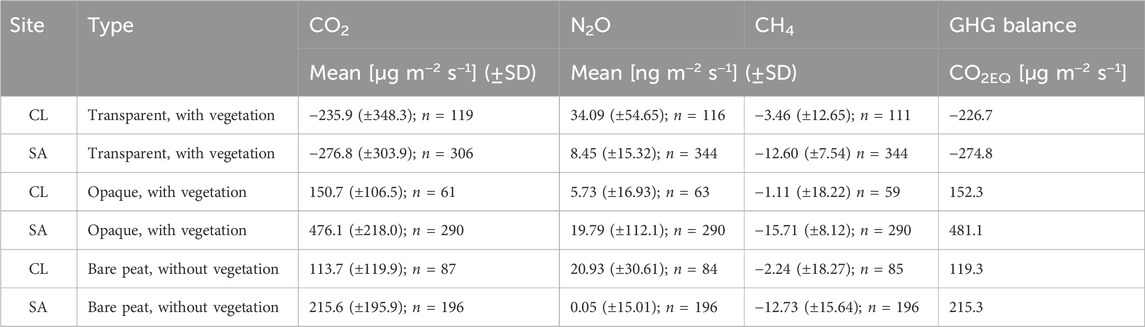
Table 2. Mean GHG fluxes over the summer months (May to August 2018–2020) of CO2, N2O, and CH4 for the cultivated (CL) and the set-aside grassland (SA) measured with transparent and opaque chambers and on bare peat. In brackets the respective standard deviations (SD) and the number of observations (n). GHG balance in CO2EQ.
3.3 Influence of temperature and soil moisture on greenhouse gas fluxes
Ecosystem respiration measured by the chambers increased with chamber headspace temperature (CL: p = 0.077; SA: p < 0.05; see Figure 5), but was not significantly related to soil water content or the interaction of headspace temperature with soil water content. Soil respiration at the CL and the SA site was neither significantly related to soil temperature, soil water content, nor their interaction during the measurement period (Figure 5). Nitrous oxide fluxes at the CL site increased significantly with soil temperature and water content and were influenced by their interaction term (p < 0.05), whereas those at the SA site were neither influenced by soil temperature, by soil water content nor their interaction (Figure 6). However, this result might be influenced by the high proportion of N2O fluxes that were below the systems detection limit (Supplementary Table S2). We found no evidence of soil temperature affecting CH4 fluxes at either site. Methane fluxes at the SA site were significantly related to soil water content and the interaction of soil temperature with soil water content (p < 0.05; Figure 6) but no significant relationships were found for the CL site.
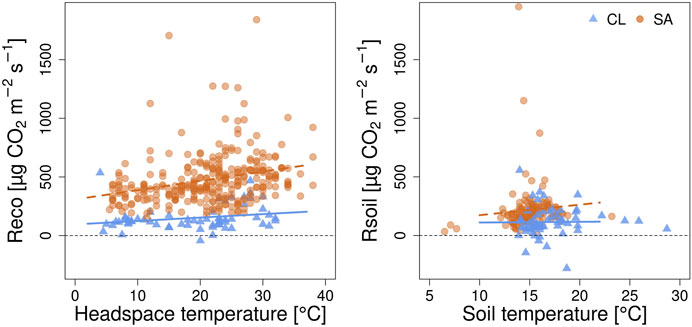
Figure 5. Ecosystem respiration (RECO; left graph) and soil respiration (RSOIL; right graph) during May–August of the years 2018–2020 measured by manual chambers in relation to chamber headspace or soil temperature, respectively at the cultivated site (CL, blue triangles) and the set-aside site (SA, red dots).
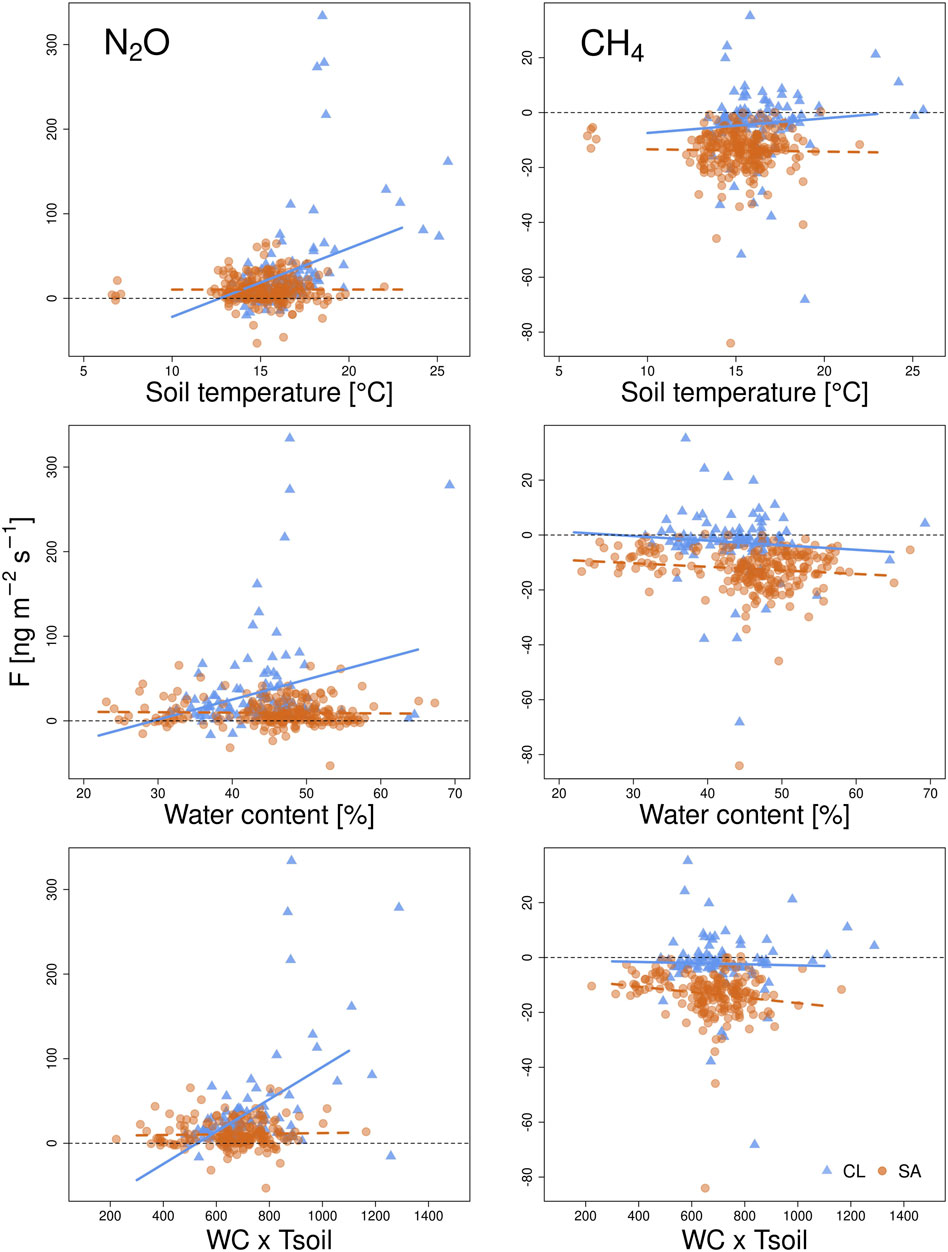
Figure 6. Nitrous oxide and CH4 fluxes in relation to soil temperature (upper graph), water content (middle graph) and interaction of water content and soil temperature (lower graph) at the cultivated site (CL, blue triangles) and the set-aside grassland (SA, red dots).
3.4 Comparison of CO2 fluxes measured by eddy covariance and non-steady-state chambers
From 2018 to 2020, EC and chamber flux measurements were conducted at both sites. A comparison of NEE in the summer months (May-August) showed a relatively good overall agreement for both sites and between the two methods (Figure 7). However, during periods of high CO2 uptake at the grassland site, the chamber method gave lower fluxes. This may be due to occasional differences in spatial flux representation between the two systems and to the reoccurring disturbance during regular chamber placements and its effect on the plant growth inside the base rings.
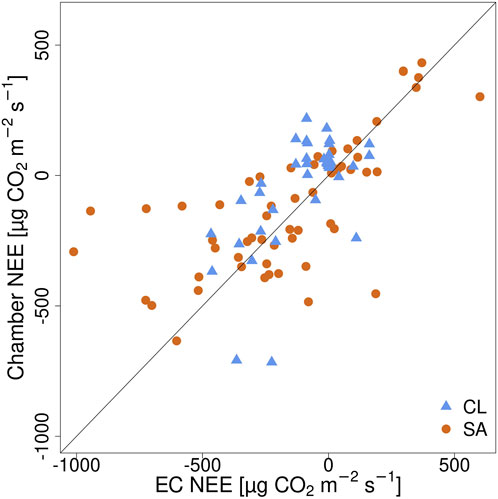
Figure 7. System comparison between the chamber-based NEE flux observations and those based on the eddy covariance system at the cultivated site (CL, blue triangles) and the set-aside site (SA, red dots). Solid line, x = y.
4 Discussion
The annual CO2 emissions reported in this study are of similar magnitude to other shallow boreal drained peatlands. Lohila et al. (2004) measured CO2 fluxes over the course of 2 years by the EC method above an agricultural peatland in Finland. They found annual CO2 losses of 0.77 and 0.29 kg CO2 m−2 yr−1 for the first year when barley was grown and the second year when grass was cultivated, respectively. Thus, the cumulative annual emissions were above the ones found for the CL and SA sites (0.16 and 0.41 kg CO2 m-2 yr−1, respectively). However, they originated from a slightly thicker peat (40–60 cm) and therefore, a larger volume of peat was exposed to oxidative conditions and by that may have influenced the flux magnitudes. Studies investigating CO2 emissions from Nordic peatlands with thicker peat layers usually report larger CO2 emissions (e.g., Maljanen et al., 2001; Maljanen et al., 2004; Maljanen et al., 2007; Maljanen et al., 2010). Above a peatland in Finland with a shallow peat layer (15–30 cm), Gerin et al. (2023) measured GHG fluxes by EC for two consecutive years and estimated the annual CO2 emissions as NEE to 0.32 and 0.74 kg CO2 m−2 yr−1, for the first and second year, respectively. This site was used for grass-silage production interchangeably with cereal cultivation and the management included bi-annual fertilisation and grass cuts, as well as the application of herbicides. Thus, the difference in management may explain the larger emissions compared to our sites. However, Evans et al. (2021) found a strong effect of the effective water table (the aerated peat thickness) on the CO2 emissions from 16 peatland sites under different management intensities in the United Kingdom and Ireland, with a negligible effect of management intensity. The aerated peat thickness at the CL and SA site are defined by the local peat thickness, because the water table lies well below the peat layer during the growing season (<150 cm). Thus, the slightly shallower peat at the CL (25 cm) compared to the SA site (34 cm) may have contributed to the observed differences between the CO2 flux magnitudes. Management intensity may play a minor role in controlling CO2 emissions from drained agricultural peatlands. Maljanen et al. (2007) found by comparing GHG fluxes from five Finnish sites on drained peat, that the mean annual CO2 emissions of abandoned organic agricultural soils were similar to those of active croplands. However, some other studies have not found such a clear relationship between peat depth and CO2 emissions and assign a higher importance to the influence of management activities (e.g., Elsgaard et al., 2012; Tiemeyer et al., 2016; Wang et al., 2018). Under the assumption that aerated peat thickness is the sole driver of CO2 emissions, we estimated the effect of the different peat thickness at our sites on the difference in CO2 emissions. This was done by using the linear relationship between aerated peat thickness and CO2 emissions that was found by Evans et al. (2021) and estimated that the 9 cm thicker peat at the SA site may lead to higher CO2 emissions by about 0.31 kg CO2 m−2 yr−1.
Hadden and Grelle (2017) investigated the NEE of the same site from July 2012 to November 2016 and found that the CL site acted as a small CO2 sink (−200 g m−2 CO2) and the SA site as a CO2 source (200 g m−2 CO2) over the measurement period. Whereas, this study found that both sites were sources of CO2 with the SA emitting more CO2 annually (0.41 kg CO2 m−2 yr−1) than the CL site (0.16 kg CO2 m-2 yr−1). This difference originated mainly from the different data post-processing procedures, in particular the exclusion of unrealistic data, the ustar filtering, and gap-filling. Hadden and Grelle (2017) excluded data that originated from periods of known instrument failures or rime or ice formation on the sonic anemometers and removed unrealistic outliers. In this study, we used more rigorous outlier detection (i.e., absolute deviation about the median), ustar filtering (Papale et al., 2006) and excluded negative night-time fluxes. For estimating the cumulative CO2 fluxes, the data gaps by Hadden and Grelle (2017) were filled by linear interpolation (30-min gaps) or by the mean diurnal course method (Falge et al., 2001). Whereas, in this study, the marginal distribution sampling method by Reichstein et al. (2005) was used. Additionally, some differences between our findings and those of Hadden and Grelle (2017) may be attributed to the difference in the measurement period length (Hadden and Grelle (2017): mid-2012 to end-2016; this study: beginning-2013 to mid-2019) and a change in management in the years after 2016. As at the CL site, ploughing was substituted by carrier disk management, and at the SA grassland, a change in management occurred in 2015 already, when the farmer started to cut the grass once a year.
To estimate the C exports from the CL site, annual potential yield of 0.2 kg m−2 yr−1 were assumed for all years (Jan-Erik Olsson, pers. comm.) except of 2016 when the field was fallowed and 2018, when barley was grown and harvested, yielding 0.37 kg m−2. Totalling to a potential yield of 1.17 kg m−2 for the years 2013–2019. During autumn and winter, wild boars, deer, moose, and birds were foraging on the crop and reducing the estimated potential yields by approximately 80% for all years except 2016 and 2018. Assuming a water content of 15% (w/w) and roughly estimating that about half of the biomass that was consumed by wildlife remained on site with excreta and by applying a biomass-to-C conversion ratio of 0.45 (Hicke et al., 2004) we come to a total C export by harvest and herbivory (Cherb/harv) of 0.26 kg C m−2 for the years 2013–2019. Thus, in terms of CO2 an annual export of about 0.16 kg CO2 m−2 yr−1. At the SA site, the estimate of C exports by Hadden and Grelle (2017) of 0.03 kg C m−2 yr−1 was used. In 2018, 0.123 kg C m-2 was exported with the harvest. Therefore, the C export from the SA site summed up to an annual C loss in terms of CO2 of 0.167 kg CO2 m−2 yr−1. The annual CO2 loss as the sum of NEE and Cherb/harv from the CL site resulted in 0.32 kg CO2 m−2 yr−1 and for the SA site (Cherb/harv = 0), to 0.58 kg CO2 m−2 yr−1. By considering the effect of Cherb/harv the CO2 balance of the CL site remains lower than that of the SA site. This can only be used as an indication for the sites C losses, since the Cherb/harv in this study is not based on measured data of C exports, but on assumptions.
The CO2 fluxes measured by the manual chambers support our findings by EC of larger fluxes from the SA site compared to the CL site. Other studies on drained boreal peatlands found similar results. In accordance with Berglund et al. (2021), we observed the highest average CO2 uptake, the highest RECO and RSOIL on the SA site and Maljanen et al. (2004) reported larger NEE fluxes from grass-covered plots than from cereal-covered plots on two drained boreal peatlands. The often observed relatively high N2O emissions from agricultural peatlands (Maljanen et al., 2003b; Maljanen et al., 2004; Gernin et al., 2023), were not confirmed at our study site. This can be explained by low nitrogen fertiliser input at the CL site and the complete lack of nitrogen fertilisation at the SA site. Both sites were small sinks for CH4, as is commonly reported for drained agricultural peatlands (e.g., Maljanen et al., 2003a; Maljanen et al., 2004; Hadden and Grelle, 2017; Berglund et al., 2021). A higher CH4 uptake at the SA site was observed. The same pattern was previously found by Maljanen et al. (2007) on abandoned peatlands in Finland and by Berglund et al. (2021) at the same study site that is subject to this article. The GHG balance for the CL and the bare peat at the SA site are comparable to those by Berglund et al. (2021). However, due to the higher emissions from our vegetated base rings of the SA site our GHG budget from the opaque and vegetated chambers exceeded those reported by Berglund et al. (2021).
For a complete estimate of the local GHG balance, continuous and year round measurements of all three GHGs, systematic measurements of C removed with biomass, estimates of N leached to the ground water, and early season and late season drainage ditch emissions should be considered. Moreover, investigating the impact of management practices such as rewetting or paludiculture on the local GHG balance is essential for understanding the GHG emission reduction potential of the sites.
On the basis of our measurements and in accordance with other recent literature (e.g., Maljanen et al., 2007; Hadden and Grelle, 2017; Berglund et al., 2021; Evans et al., 2021), we found no evidence that setting-aside agricultural peatlands will reduce CO2 emissions or even turn the peatlands into a C sink. Thus, the political debate about setting-aside agricultural peatlands is in need of reassessment, if the aim is to reduce GHG emissions and agricultural policies that support setting-aside or fallowing agricultural peatlands without rewetting (EU Regulation No 1307/2013, 2013) are likely ineffective means for climate change mitigation.
5 Conclusion
Based on more than 6 years of cumulative eddy covariance CO2 flux data, we found no evidence that setting-aside cropland reduced greenhouse gas emissions. The set-aside grassland was a larger source of CO2 (0.41 kg CO2 m−2 yr−1) than the adjacent cropland (0.16 kg CO2 m−2 yr−1), both located on a shallow drained peat in central Sweden. Respiratory CO2 losses, photosynthetic CO2 assimilation and CH4 uptake were higher at the set-aside grassland than at the cropland. Nitrous oxide emissions from the cropland exceeded those from the grassland, but this had a minor effect on the sites global warming potential as estimated in this study.
Data availability statement
The raw data supporting the conclusion of this article will be made available by the authors, without undue reservation.
Author contributions
HK: Conceptualization, Data curation, Formal Analysis, Investigation, Methodology, Visualization, Writing–original draft, Writing–review and editing. KM: Conceptualization, Supervision, Writing–review and editing. SJ: Supervision, Writing–review and editing. TK: Supervision, Writing–review and editing. DH: Investigation, Writing–review and editing. AG: Funding acquisition, Investigation, Resources, Supervision, Writing–review and editing.
Funding
The author(s) declare that financial support was received for the research, authorship, and/or publication of this article. Financial support was provided by the Swedish Farmers’ Foundation for Agricultural Research (contract no. O-18-23-169).
Acknowledgments
The authors thank Jan-Erik Olson and Sören Hedwall who provided their fields on which the measurements were taken. Many thanks also to Chis Evans, Ross Morrison, Alex Cumming, and Gustaf Granath for valuable discussions on measurement techniques, EC data analysis, and peatland biogeochemistry, as well as to the Swedish Meteorological and Hydrological Institute for publicly providing weather and climate data. We also thank Gloria Jimwaga, Bernabé Ramírez Sánchez and Arthee Chowdhury for their help in the field.
Conflict of interest
The authors declare that the research was conducted in the absence of any commercial or financial relationships that could be construed as a potential conflict of interest.
Publisher’s note
All claims expressed in this article are solely those of the authors and do not necessarily represent those of their affiliated organizations, or those of the publisher, the editors and the reviewers. Any product that may be evaluated in this article, or claim that may be made by its manufacturer, is not guaranteed or endorsed by the publisher.
Supplementary material
The Supplementary Material for this article can be found online at: https://www.frontiersin.org/articles/10.3389/fenvs.2024.1386134/full#supplementary-material
References
Aubinet, M., Grelle, A., Ibrom, A., Rannik, Ü., Moncrieff, J., Foken, T., et al. (1999). “Estimates of the annual net carbon and water exchange of forests: the EUROFLUX methodology,” in Advances in ecological research (Elsevier), 113–175. doi:10.1016/S0065-2504(08)60018-5
Ballantyne, D. M., Hribljan, J. A., Pypker, T. G., and Chimner, R. A. (2014). Long-term water table manipulations alter peatland gaseous carbon fluxes in Northern Michigan. Wetl. Ecol. Manag. 22, 35–47. doi:10.1007/s11273-013-9320-8
Barcza, Z., Haszpra, L., Kondo, H., Saigusa, N., Yamamoto, S., and Bartholy, J. (2003). Carbon exchange of grass in Hungary. Tellus B Chem. Phys. Meteorol. 55, 187. doi:10.3402/tellusb.v55i2.16695
Berglund, Ö. (1996) Cultivated organic soils in Sweden: properties and amelioration (PhD thesis). Uppsala, Sweden: Sveriges lantbruksuniversitet.
Berglund, Ö., and Berglund, K. (2010). Distribution and cultivation intensity of agricultural peat and gyttja soils in Sweden and estimation of greenhouse gas emissions from cultivated peat soils. Geoderma 154, 173–180. doi:10.1016/j.geoderma.2008.11.035
Berglund, Ö., Kätterer, T., and Meurer, K. H. E. (2021). Emissions of CO2, N2O and CH4 from cultivated and set aside drained peatland in Central Sweden. Front. Environ. Sci. 9, 630721. doi:10.3389/fenvs.2021.630721
Bollig, C., and Feller, U. (2014). Impacts of drought stress on water relations and carbon assimilation in grassland species at different altitudes. Agric. Ecosyst. Environ. 188, 212–220. doi:10.1016/j.agee.2014.02.034
Burney, J. A., Davis, S. J., and Lobell, D. B. (2010). Greenhouse gas mitigation by agricultural intensification. Proc. Natl. Acad. Sci. 107, 12052–12057. doi:10.1073/pnas.0914216107
Chen, C., Loft, L., and Matzdorf, B. (2023). Lost in action: climate friendly use of European peatlands needs coherence and incentive-based policies. Environ. Sci. Policy 145, 104–115. doi:10.1016/j.envsci.2023.04.010
Davidson, E. A. (2009). The contribution of manure and fertilizer nitrogen to atmospheric nitrous oxide since 1860. Nat. Geosci. 2, 659–662. doi:10.1038/ngeo608
Desai, A. R., Richardson, A. D., Moffat, A. M., Kattge, J., Hollinger, D. Y., Barr, A., et al. (2008). Cross-site evaluation of eddy covariance GPP and RE decomposition techniques. Agric. For. Meteorol. 148, 821–838. doi:10.1016/j.agrformet.2007.11.012
Elsgaard, L., Görres, C.-M., Hoffmann, C. C., Blicher-Mathiesen, G., Schelde, K., and Petersen, S. O. (2012). Net ecosystem exchange of CO2 and carbon balance for eight temperate organic soils under agricultural management. Agric. Ecosyst. Environ. 162, 52–67. doi:10.1016/j.agee.2012.09.001
EU Commission (2021) “COMMUNICATION FROM THE COMMISSION TO THE EUROPEAN PARLIAMENT, THE COUNCIL,” in The EUROPEAN economic and social committee and the committee of the regions - EU Soil Strategy for 2030 Reaping the benefits of healthy soils for people, food, nature and climate.
EU Regulation No 1307/2013 (2013) REGULATION (EU) No 1307/2013 OF THE EUROPEAN PARLIAMENT AND OF THE COUNCIL.
Evans, C. D., Peacock, M., Baird, A. J., Artz, R. R. E., Burden, A., Callaghan, N., et al. (2021). Overriding water table control on managed peatland greenhouse gas emissions. Nature 593, 548–552. doi:10.1038/s41586-021-03523-1
Falge, E., Baldocchi, D., Olson, R., Anthoni, P., Aubinet, M., Bernhofer, C., et al. (2001). Gap filling strategies for defensible annual sums of net ecosystem exchange. Agric. For. Meteorol. 107, 43–69. doi:10.1016/S0168-1923(00)00225-2
Forster, P., Storelvmo, T., Armour, K., Collins, W., Dufresne, J.-L., Frame, D., et al. (2021). “The earth’s energy budget, climate feedbacks, and climate sensitivity,” in Climate change 2021: the physical science basis. Contribution of working group I to the sixth assessment report of the intergovernmental panel on climate change. Editors V. Masson-Delmotte, P. Zhai, A. Pirani, S. L. Connors, C. Péan, S. Bergeret al. (Cambridge, United Kingdom and New York, NY, USA: Cambridge University Press), 923–1054. doi:10.1017/9781009157896.009
Frolking, S., Roulet, N., and Fuglestvedt, J. (2006). How northern peatlands influence the Earth’s radiative budget: sustained methane emission versus sustained carbon sequestration. J. Geophys. Res. 111, G01008. doi:10.1029/2005JG000091
Frolking, S., and Roulet, N. T. (2007). Holocene radiative forcing impact of northern peatland carbon accumulation and methane emissions. Glob. Change Biol. 13, 1079–1088. doi:10.1111/j.1365-2486.2007.01339.x
Gallego-Sala, A. V., Charman, D. J., Brewer, S., Page, S. E., Prentice, I. C., Friedlingstein, P., et al. (2018). Latitudinal limits to the predicted increase of the peatland carbon sink with warming. Nat. Clim. Change 8, 907–913. doi:10.1038/s41558-018-0271-1
Gerin, S., Vekuri, H., Liimatainen, M., Tuovinen, J.-P., Kekkonen, J., Kulmala, L., et al. (2023). Two contrasting years of continuous N 2 O and CO 2 fluxes on a shallow-peated drained agricultural boreal peatland. Agric. For. Meteorol. 341, 109630. doi:10.1016/j.agrformet.2023.109630
Hadden, D., and Grelle, A. (2017). The impact of cultivation on CO 2 and CH 4 fluxes over organic soils in Sweden. Agric. For. Meteorol. 243, 1–8. doi:10.1016/j.agrformet.2017.05.002
Hicke, J. A., Lobell, D. B., and Asner, G. P. (2004). Cropland area and net primary production computed from 30 Years of USDA agricultural harvest data. Earth Interact. 8, 1–20. doi:10.1175/1087-3562(2004)008<0001:CAANPP>2.0.CO;2
Holstad, Ø. B., and Degago, S. A. (2021). Strength and deformation characterization of Norwegian organic cohesive soil (gyttja). IOP Conf. Ser. Earth Environ. Sci. 710, 012018. doi:10.1088/1755-1315/710/1/012018
Kasimir-Klemedtsson, Å., Klemedtsson, L., Berglund, K., Martikainen, P., Silvola, J., and Oenema, O. (1997). Greenhouse gas emissions from farmed organic soils: a review. Soil Use Manag. 13, 245–250. doi:10.1111/j.1475-2743.1997.tb00595.x
Keck, H. (2024). Greenhouse gas fluxes from drained peatland: measurement techniques and management impacts. Acta Univ. Agric. Sueciae 2024, 5. Doctoral thesis. doi:10.54612/a.4h68t79f4i
Knox, S. H., Sturtevant, C., Matthes, J. H., Koteen, L., Verfaillie, J., and Baldocchi, D. (2015). Agricultural peatland restoration: effects of land-use change on greenhouse gas (CO 2 and CH 4) fluxes in the Sacramento-San Joaquin Delta. Glob. Change Biol. 21, 750–765. doi:10.1111/gcb.12745
Koehler, A. K., Sottocornola, M., and Kiely, G. (2011). How strong is the current carbon sequestration of an Atlantic blanket bog? MULTIANNUAL C BALANCE OF A BLANKET BOG. Glob. Change Biol. 17, 309–319. doi:10.1111/j.1365-2486.2010.02180.x
Kramer, R. A., and Shabman, L. (1993). The effects of agricultural and tax policy reform on the economic return to wetland drainage in the Mississippi delta region. Land Econ. 69, 249. doi:10.2307/3146591
Kuypers, M. M. M., Marchant, H. K., and Kartal, B. (2018). The microbial nitrogen-cycling network. Nat. Rev. Microbiol. 16, 263–276. doi:10.1038/nrmicro.2018.9
Kuzyakov, Y., and Blagodatskaya, E. (2015). Microbial hotspots and hot moments in soil: concept and review. Soil Biol. biochem. 83, 184–199. doi:10.1016/j.soilbio.2015.01.025
Lai, D. Y. F. (2009). Methane dynamics in northern peatlands: a review. Pedosphere 19, 409–421. doi:10.1016/s1002-0160(09)00003-4
Leifeld, J., and Menichetti, L. (2018). The underappreciated potential of peatlands in global climate change mitigation strategies. Nat. Commun. 9, 1071. doi:10.1038/s41467-018-03406-6
Lloyd, J., and Taylor, J. A. (1994). On the temperature dependence of soil respiration. Funct. Ecol. 8, 315. doi:10.2307/2389824
Lohila, A., Aurela, M., Tuovinen, J.-P., and Laurila, T. (2004). Annual CO2 exchange of a peat field growing spring barley or perennial forage grass. J. Geophys. Res. 109, D18116. doi:10.1029/2004JD004715
Lund, M., Christensen, T. R., Mastepanov, M., Lindroth, A., and Ström, L. (2009). Effects of N and P fertilization on the greenhouse gas exchange in two northern peatlands with contrasting N deposition rates. Biogeosciences 6, 2135–2144. doi:10.5194/bg-6-2135-2009
Maljanen, M., Hytönen, J., Mäkiranta, P., Alm, J., Minkkinen, K., Laine, J., et al. (2007). Greenhouse gas emissions from cultivated and abandoned organic croplands in Finland. Boreal Env. Res 12, 133–140.
Maljanen, M., Komulainen, V.-M., Hytönen, J., Martikainen, P. J., and Laine, J. (2004). Carbon dioxide, nitrous oxide and methane dynamics in boreal organic agricultural soils with different soil characteristics. Soil Biol. biochem. 36, 1801–1808. doi:10.1016/j.soilbio.2004.05.003
Maljanen, M., Liikanen, A., Silvola, J., and Martikainen, P. J. (2003a). Methane fluxes on agricultural and forested boreal organic soils. Soil Use Manag. 19, 73–79. doi:10.1079/sum2002171
Maljanen, M., Liikanen, A., Silvola, J., and Martikainen, P. J. (2003b). Nitrous oxide emissions from boreal organic soil under different land-use. Soil Biol. Biochem. 35, 689–700. doi:10.1016/S0038-0717(03)00085-3
Maljanen, M., Martikainen, P. J., Walden, J., and Silvola, J. (2001). CO2 exchange in an organic field growing barley or grass in eastern Finland: CO 2 EXCHANGE IN AN ORGANIC FIELD. Glob. Change Biol. 7, 679–692. doi:10.1111/j.1365-2486.2001.00437.x
Maljanen, M., Sigurdsson, B. D., Guðmundsson, J., Óskarsson, H., Huttunen, J. T., and Martikainen, P. J. (2010). Greenhouse gas balances of managed peatlands in the Nordic countries – present knowledge and gaps. Biogeosciences 7, 2711–2738. doi:10.5194/bg-7-2711-2010
Minkkinen, K., Ojanen, P., Koskinen, M., and Penttilä, T. (2020). Nitrous oxide emissions of undrained, forestry-drained, and rewetted boreal peatlands. For. Ecol. Manag. 478, 118494. doi:10.1016/j.foreco.2020.118494
Moffat, A. M., Papale, D., Reichstein, M., Hollinger, D. Y., Richardson, A. D., Barr, A. G., et al. (2007). Comprehensive comparison of gap-filling techniques for eddy covariance net carbon fluxes. Agric. For. Meteorol. 147, 209–232. doi:10.1016/j.agrformet.2007.08.011
Nagy, Z., Pintér, K., Czóbel, Sz., Balogh, J., Horváth, L., Fóti, Sz., et al. (2007). The carbon budget of semi-arid grassland in a wet and a dry year in Hungary. Agric. Ecosyst. Environ. 121, 21–29. doi:10.1016/j.agee.2006.12.003
Novick, K. A., Stoy, P. C., Katul, G. G., Ellsworth, D. S., Siqueira, M. B. S., Juang, J., et al. (2004). Carbon dioxide and water vapor exchange in a warm temperate grassland. Oecologia 138, 259–274. doi:10.1007/s00442-003-1388-z
Papale, D., Reichstein, M., Aubinet, M., Canfora, E., Bernhofer, C., Kutsch, W., et al. (2006). Towards a standardized processing of Net Ecosystem Exchange measured with eddy covariance technique: algorithms and uncertainty estimation. Biogeosciences 3, 571–583. doi:10.5194/bg-3-571-2006
Radley, G., Keenleyside, C., Frelih-Larsen, A., McDonald, H., Andersen, S. P., Qwist-Hoffmann, H., et al. (2021). Technical Guidance Handbook - setting up and implementing result-based carbon farming mechanisms in the EU (Report to the European Commission). DG Clim. Action, under Contract No. CLIMA/C.3/ETU/2018/007. COWI, Kongens Lyngby. doi:10.2834/056153
Ravishankara, A. R., Daniel, J. S., and Portmann, R. W. (2009). Nitrous oxide (N2O): the dominant ozone-depleting substance emitted in the 21st century. Science 326, 123–125. doi:10.1126/science.1176985
Reichstein, M., Falge, E., Baldocchi, D., Papale, D., Aubinet, M., Berbigier, P., et al. (2005). On the separation of net ecosystem exchange into assimilation and ecosystem respiration: review and improved algorithm. Glob. Change Biol. 11, 1424–1439. doi:10.1111/j.1365-2486.2005.001002.x
Richardson, S. J., and Smith, J. (1977). PEAT WASTAGE IN THE EAST ANGLIAN FENS. J. Soil Sci. 28, 485–489. doi:10.1111/j.1365-2389.1977.tb02256.x
SMHI (2023) Data. Available at: https://www.smhi.se/data.
Tiemeyer, B., Albiac Borraz, E., Augustin, J., Bechtold, M., Beetz, S., Beyer, C., et al. (2016). High emissions of greenhouse gases from grasslands on peat and other organic soils. Glob. Change Biol. 22, 4134–4149. doi:10.1111/gcb.13303
Tilman, D., Balzer, C., Hill, J., and Befort, B. L. (2011). Global food demand and the sustainable intensification of agriculture. Proc. Natl. Acad. Sci. 108, 20260–20264. doi:10.1073/pnas.1116437108
Wang, M., Wu, J., Lafleur, P. M., Luan, J., Chen, H., and Zhu, X. (2018). Can abandoned peatland pasture sequestrate more carbon dioxide from the atmosphere than an adjacent pristine bog in Newfoundland, Canada? Agric. For. Meteorol. 248, 91–108. doi:10.1016/j.agrformet.2017.09.010
Wohlfahrt, G., Hammerle, A., Haslwanter, A., Bahn, M., Tappeiner, U., and Cernusca, A. (2008). Seasonal and inter-annual variability of the net ecosystem CO2 exchange of a temperate mountain grassland: effects of climate and management. J. Geophys. Res. 113, D08110. doi:10.1029/2007JD009286
Wutzler, T., Lucas-Moffat, A., Migliavacca, M., Knauer, J., Sickel, K., Šigut, L., et al. (2018). Basic and extensible post-processing of eddy covariance flux data with REddyProc. Biogeosciences 15, 5015–5030. doi:10.5194/bg-15-5015-2018
Xu, J., Morris, P. J., Liu, J., and Holden, J. (2018). PEATMAP: refining estimates of global peatland distribution based on a meta-analysis. CATENA 160, 134–140. doi:10.1016/j.catena.2017.09.010
Keywords: agricultural peatland, climate change mitigation, eddy covariance, land sparing, permanent grassland, carbon dioxide, methane, nitrous oxide
Citation: Keck H, Meurer KHE, Jordan S, Kätterer T, Hadden D and Grelle A (2024) Setting-aside cropland did not reduce greenhouse gas emissions from a drained peat soil in Sweden. Front. Environ. Sci. 12:1386134. doi: 10.3389/fenvs.2024.1386134
Received: 14 February 2024; Accepted: 08 May 2024;
Published: 30 May 2024.
Edited by:
Katerina Dontsova, University of Arizona, United StatesReviewed by:
Fumiaki Takakai, Akita Prefectural University, JapanMatthew Saunders, Trinity College Dublin, Ireland
Copyright © 2024 Keck, Meurer, Jordan, Kätterer, Hadden and Grelle. This is an open-access article distributed under the terms of the Creative Commons Attribution License (CC BY). The use, distribution or reproduction in other forums is permitted, provided the original author(s) and the copyright owner(s) are credited and that the original publication in this journal is cited, in accordance with accepted academic practice. No use, distribution or reproduction is permitted which does not comply with these terms.
*Correspondence: Hannes Keck, aGFubmVzLmtlY2tAZW1wYS5jaA==
†Present address: Hannes Keck, Empa, Laboratory for Air Pollution/Environmental Technology, Dübendorf, Switzerland