
94% of researchers rate our articles as excellent or good
Learn more about the work of our research integrity team to safeguard the quality of each article we publish.
Find out more
REVIEW article
Front. Environ. Sci., 26 April 2024
Sec. Interdisciplinary Climate Studies
Volume 12 - 2024 | https://doi.org/10.3389/fenvs.2024.1382621
This article is part of the Research TopicNatural Methane Emissions in a Changing Arctic - Implications for Climate and EnvironmentView all 16 articles
 Xin Lan1,2*
 Edward J. Dlugokencky3
Rapid warming in the Arctic has the potential to release vast reservoirs of carbon into the atmosphere as methane (CH4) resulting in a strong positive climate feedback. This raises the concern that, after a period of near-zero growth in atmospheric CH4 burden from 1999 to 2006, the increase since then may be in part related to increased Arctic emissions. Measurements of CH4 in background air samples provide useful, direct information to determine if Arctic CH4 emissions are increasing. One sensitive first-order indicator for large emission change is the Interpolar Difference, that is the difference in surface atmospheric annual means between polar northern and southern zones (53°–90°), which has varied interannually, but did not increase from 1992 to 2019. The Interpolar Difference has increased moderately during 2020–2022 when the global CH4 burden increased significantly, but not yet to its peak values in the late-1980s. For quantitative assessment of changing Arctic CH4 emissions, the atmospheric measurements must be combined with an atmospheric tracer transport model. Based on multiple studies including some using CH4 isotopes, it is clear that most of the increase in global atmospheric CH4 burden is driven by increased emissions from microbial sources in the tropics, and that Arctic emissions have not increased significantly since the beginning of our measurement record in 1983 through 2022.
Atmospheric methane (CH4) has wide-ranging impacts on climate and air quality. The increase in CH4’s atmospheric burden since pre-industrial (usually taken as 1750) is responsible for 0.55 W m2 direct effective radiative forcing (https://gml.noaa.gov/ccgg/ghgpower/). Its atmospheric chemistry produces tropospheric O3 and stratospheric H2O, two additional important GHGs), which add ∼0.4 W m−2 (IPCC Assessment Report 6, hereafter AR6) to CH4’s forcing. Tropospheric O3 is also a regulated pollutant that affects human health and agricultural productivity. Increases in atmospheric CH4 burden impact the atmospheric concentration of hydroxyl radical (OH), which affects the lifetime of CH4 and other reduced long-lived greenhouse gases (LLGHG).
From paleoclimate studies, we know that the changing atmospheric burden of CH4 (along with CO2, primarily) is a key driver in transitions from glacial to interglacial periods (Bock et al., 2017). Small changes in Earth’s orbital parameters have little impact on Earth’s radiation budget, but they impact the geographical and seasonal distribution of solar radiation, which affects ice sheets and GHGs (Lorius et al., 1990). As ice sheets shrink, the darker surface underneath absorbs more radiation, warming Earth. A warming planet also releases GHGs from the ocean and land, acting as a climate feedback.
Similar to ancient times, current Arctic environmental conditions are especially worrisome for potential climate feedback that will accelerate the impacts of anthropogenic emissions of CO2 from fossil fuel combustion and other LLGHG emissions. Arctic landmasses hold huge stores of carbon, on order 1000 Pg C, in the top 3 m of permafrost. For comparison, the current atmosphere holds ∼4 Pg C as CH4. While frozen in permafrost (permanently frozen ground), Earth’s climate is immune to this carbon, as long as it remains frozen in permafrost. But if the permafrost thaws, this carbon can be released where it can be converted to CO2 or CH4 by microbes, depending on hydrology. Additionally, there is a large amount of CH4 in clathrates on land and under the Arctic Ocean, but we consider these as potential impacts over millennial time scales rather than an immediate threat (Ruppel and Kessler, 2017; Ruppel and Waite, 2020).
We also know the Arctic is warming rapidly, at ∼0.73 K decade−1 since 1979, about a factor of 3 faster than the global average (Rantanen et al., 2022), in part because of decreasing snow and ice cover that affects albedo. This has potentially large impacts on carbon cycling in the Arctic. Thawing permafrost accelerates formation of thermokarst lakes and generally increases wetland area; flux measurements in Siberia show these lakes can strongly emit CH4 (Wik et al., 2016). Warmer temperatures are likely to increase the length of the growing season, also increasing the depth of the active layer at the permafrost surface. As newly formed wetlands drain, flow of dissolved organic carbon into the Arctic Ocean increases, where it can be converted to CH4 by microbes in carbon-rich sediments. These changes may also affect vegetation, e.g., as tree growth occurs further north, which affects Arctic albedo. For this paper, we ignore the substantial impacts of thawing permafrost on Arctic infrastructure, e.g., crumbling of building foundations and pipeline footings. CH4 production and emission is also sensitive to temperature. This sensitivity is typically characterized by a Q10 value, which quantifies the relative change in production or emissions for a 10 K increase in temperature. Reported Q10 is typically in the range of 2–15 with large uncertainties (e.g., Change et al., 2021). Methane production and loss through oxidation by soil bacteria also depend on inundation; so changes in precipitation magnitude, type, and distribution caused by climate change and local hydrology will also impact CH4 emission rates.
So how can we determine if CH4 emissions in the Arctic are increasing as a result of climate change? Detailed field studies are useful for improving understanding of processes responsible for CH4 fluxes (both emission and soil sink), but they are still limited in their footprint (Röβger et al., 2023) or temporal extent or both. Satellite GHG monitoring looks at sunlight reflected from Earth’s surface, which is limited to estimating atmospheric CH₄ only in daytime with strong sunlight and under cloud-free conditions that are not possible during polar night. Other remote sensors look at thermal infrared radiation to retrieve atmospheric CH4, so they allow extension of the measurement coverage to nighttime conditions (including polar night), but are most sensitive to high altitudes, far from emissions. High-quality ground and vertical observations (often called in situ observations) of the temporal and spatial distributions of atmospheric CH4 provide strong (i.e., with small uncertainty) constraints on CH4’s budget of emissions and sinks and how they change over time. Here we give some examples of how NOAA GML surface atmospheric observations are used to quantify potential changes in Arctic CH4 emissions.
This study is based on measurements of atmospheric CH4 from air samples collected at sites in NOAA GML’s Cooperative Global Air Sampling Network. The sampling network has been described elsewhere (Dlugokencky et al., 1994), so only a brief description is given here. Sites are located so sampled air is free of local or regional contamination of CH4 and other climate-related anthropogenic gases and represents a large, well-mixed volume of background atmosphere. This is important to ensure the observations can be compared with output of atmospheric chemical transport models, where the model grid is relatively large (larger than 1° latitude x 1° longitude for the model described below), and for meaningful trends from weekly sampling. Most discrete air samples have been collected in 2.5 L borosilicate glass flasks at approximately weekly frequency. Each flask has two glass-piston stopcocks, an inlet and outlet, sealed with polytetrafluoroethylene O-rings. Flasks are sent to sampling sites filled with dry gas containing no CH4 (fill gas). A battery-powered portable sampler is used to flush a pair of flasks in series for ∼10 min before the flasks are pressurized to a small overpressure of ∼0.4 atm. The lack of CH4 in the fill gas provides an excellent tool to ensure the flasks are sufficiently flushed with ambient air; insufficient flushing combined with sensitive measurement methods would result in a significant difference in CH4 measured between members of the sample pair. Once sampled, the flasks are returned to Boulder, CO for analysis. Various other sampling methods and flask types have also been used since CH4 measurements began in 1983, but they account for a very small percentage of samples, and we have ensured all agree by direct comparisons.
From the start of measurements in 1983 until mid-2019, CH4 was measured by gas chromatography with flame ionization detection (GC/FID) (Dlugokencky et al., 1994). Since mid-2019, a commercial laser-based spectrometer utilizing cavity ring-down spectroscopy (CRDS) has been used. Air samples are physically dried to a dew point of −70°C with a cold trap. The CH4 quantity reported is amount of substance fraction and it is in units of mole fraction, dry air. We use the abbreviation ppb for nmol mol−1. Analyzer response (both GC/FID and CRDS) has been calibrated with a suite of CH4 in natural air standards. This suite of standards, which is maintained by NOAA GML, defines the WMO X2004A scale (maintained by NOAA) with a nominal range from 300 to 5000 ppb [Dlugokencky et al., 2005; https://gml.noaa.gov/ccl/scales.html]. Measurement uncertainties (reported as 68% confidence interval) range from ∼3 ppb in 1983 to ∼0.6 ppb in 2023. With careful attention to analytical details, we are confident that our reported trends and spatial patterns are meaningful.
Before NOAA CH4 data are analyzed, they undergo a two-step procedure to ensure temporal variability is representative of large, well-mixed atmospheric volumes and not the result of sampling or analytical errors, or local contamination. In the first quality control step, all data with clear sampling or analysis errors are flagged and excluded from further analysis. The second step, which is based on statistical analysis and behavior of other species measured in the same air sample (e.g., CO), ensures the sample meets our background condition. To calculate large scale averages, measurements from a subset of background network sites (Figure 1) are first smoothed in time. From these smoothed curves, values are extracted at approximately weekly synchronized intervals, and new curves are fitted with an iterative process as a function of latitude. The latitude fits at each weekly time step are used to create a matrix of CH4 as functions of time and latitude. Values in the matrix are stored at latitudinal spacing of sine (latitude) = 0.05 (Figure 1), so each represents an equal volume of atmosphere. Averages of atmospheric CH4 over specific latitude zones are calculated by averaging the appropriate values from the matrix.
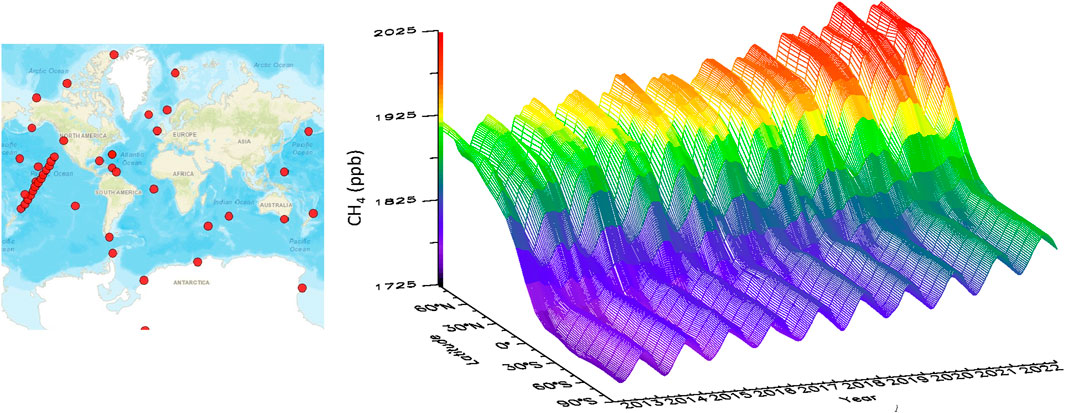
Figure 1. Left: subset of atmospheric sampling sites used in the construction of the Marine Boundary Layer (MBL) Reference for CH4. Right: atmospheric CH4 abundance at Earth’s surface based on NOAA’s Marine Boundary Layer measurements (Lan et al., 2023).
We start at the global scale to illustrate how observations are used to constrain the atmospheric CH4 budget of sources and sinks. Given that atmospheric CH4’s lifetime is long relative to atmospheric mixing, global changes will broadly reflect atmospheric changes observed over smaller regions, although, by themselves, global changes in atmospheric CH4 abundance are poor indicators of the processes causing the change.
At the global scale, the time series of measured atmospheric burden can be used in a mass-balance calculation with an estimate of CH4’s lifetime to constrain total global emissions to within ∼10% (with most of the uncertainty in the lifetime).
Here, [CH4] is the global CH4 burden determined from atmospheric observations with the conversion 1 ppb = 2.763 Tg CH4 (based on atmospheric mass and CH4 distributions in TM5 (The Global Atmospheric Tracer Model, version 5), Lan et al., 2021) and τ is the budget lifetime, 8.8 years (not to be confused with the perturbation lifetime (11.8 ± 1.8 years in AR6) used by IPCC to calculate Global Warming Potential). In 2020–2022, we observed the largest increase in CH4 since our systematic measurements started in 1983, with an average annual increase of 15.2 ppb/yr, and the atmospheric burden reached 5316 Tg CH4 in 2023 (Lan et al., 2024). Global total emission increased to 642 Tg/yr CH4 in 2020–2023, almost 15% greater than the 1983–2006 average of 560 Tg/yr. The time series of emissions calculated with global mass balance is plotted in Figure 2.
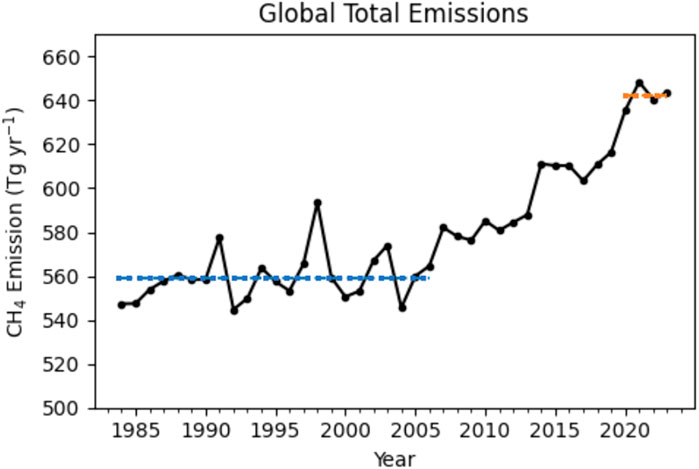
Figure 2. Global total annual CH4 emissions calculated using a mass-balance approach constrained by measured atmospheric burden and increase (
Atmospheric mixing is not instantaneous, so gradients in the measured abundances of gases remain in the background atmosphere that reflect the large-scale distributions of emissions. Figure 1 shows the latitude gradient of atmospheric CH4 at background sites. These patterns can be exploited directly, or in more sophisticated approaches using atmospheric tracer transport models, to quantify the spatial distribution of emissions and how they change with time. Because vertical mixing in the Arctic is much less rapid than in the tropics, surface measurements are quite sensitive to changing emissions. Accounting only for differences in horizontal vs. vertical atmospheric transport, Bousquet et al. (2011) found that measurements of atmospheric CH4 at the surface in the Arctic were about a factor of 2–3 more sensitive to surface emissions than the tropics.
Interpretation of the atmospheric measurements alone informs us of potential changes in CH4 emissions in the Arctic. Figure 3 plots the interpolar difference (IPD) between annual mean CH4 values calculated for polar northern (PNH = 53° to 90°N) and polar southern (PSH = 53° to 90°S) latitude zones. The largest signal is the step change between 1991 and 1992 of ∼10 ppb, which is consistent in timing with the economic collapse of the former Soviet Union. Following that, IPD trends downward or remains approximately level, until ∼2020 when it recovers to pre-1992 levels. While IPD provides strong observational evidence for a potential change in Arctic emissions, it reflects changes in both emissions and transport. To account for transport effects, Dlugokencky et al. (2003) used an atmospheric tracer transport model (The Global AtmosphericTracer Model, version 3; TM3) and anthropogenic emissions from a global inventory to simulate atmospheric CH4 at NOAA observing sites. The emission inventory captured a decrease in annual emissions of ∼10 Tg CH4 from the former Soviet Union through the 1991–92 anomaly in IPD.
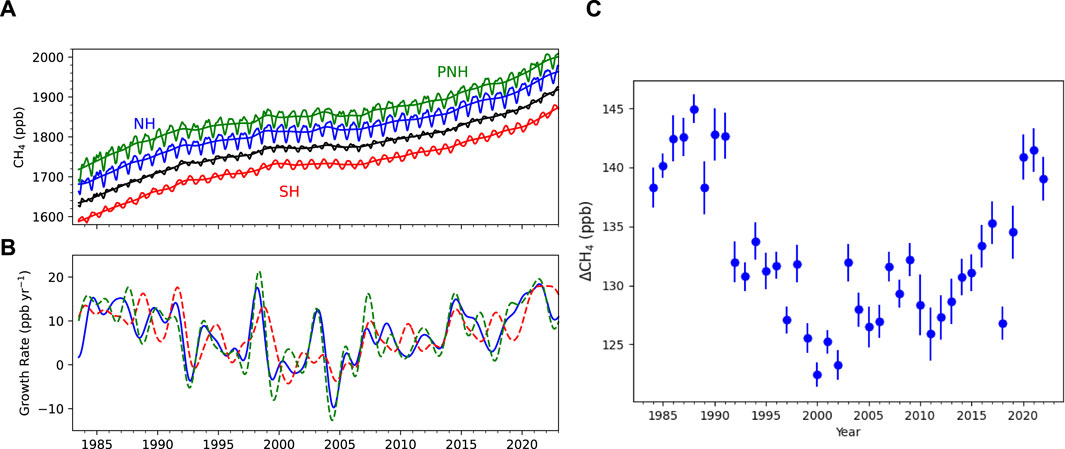
Figure 3. (A) Large-scale average time evolution of CH4 determined from surface measurements in Figure 1. Plotted are Polar Northern Hemisphere (PNH; 53° to 90°N), Northern Hemisphere (NH), global, and Southern Hemisphere (SH) averages, from top to bottom. Deseasonalized trend lines are also plotted for each. (B) Instantaneous CH4 growth rates determined as time-derivatives of the trend lines in (A). (C) Differences in annual averaged atmospheric CH4 between polar northern (53°–90°N) and polar southern latitudes (53°–90°S).
While it is useful to analyze atmospheric observations to try to qualitatively assess CH4 emissions at high northern latitudes and how they change with time, a tracer transport model is necessary to quantify those emissions and their changes. The Global Carbon Project - CH4 (the Global Methane Budget) summarized top-down inversion results for CH4 from a few atmospheric tracer transport models that assimilate atmospheric CH4 measurements to inform emissions (Saunois et al., 2020). They found that (shown in their Table 5) total Arctic methane emissions (60–90°N) were stable when comparing 2008–2017 with 2000–2009 periods. Extended inversion results until 2022 from the Copernicus Atmosphere Monitoring Service (CAMS; https://atmosphere.copernicus.eu/) model show that average Arctic total methane emissions are 57 Tg/yr in 2020–2022, slightly greater than the 54.3 Tg/yr average in 2010–2019 (Segers and Houwelling, 2024), which may partially explain the increase in observed IPD since 2020 (Figure 3). Arctic total emissions for 2020–2022, however, are similar to the 57.9 Tg/yr average estimated for 2000–2009, which does not support a large long-term emission increase from natural processes in the Arctic.
Atmospheric measurements of stable carbon isotopes of CH4 (denoted as δ13C-CH4) provide additional constraints on emissions from different source sectors, given that different CH4 sources have distinct δ13C-CH4 signatures driven by different fundamental processes (Schwietzke et al., 2016; Lan et al., 2021). Microbially-driven CH4 emissions tend to be more depleted in δ13C-CH4 (range of emission-weighted globally averaged values −60 to −62‰) while thermogenic emissions (predominated by fossil fuel emissions) tend to be slightly enriched in δ13C-CH4 (−43 to −45‰) compared with the atmosphere. Methane emitted through biomass burning (pyrogenic) retains the δ13C signature in the biofuels, which results in highly enriched δ13C-CH4 signatures (−24 to −25‰). As atmospheric CH4 began increasing in 2007 after near-zero growth from 1999 through 2006, measurements of the relative amount of δ13C-CH4 at Alert (82.45°N, 62.51°W) suggested that warm, wet conditions in the Arctic during 2007 enhanced natural CH4 emissions from wetlands (Dlugokencky et al., 2009). The post-2006 global CH4 increase is accompanied by a significant decreasing trend in atmospheric δ13C-CH4 (Michel et al., 2021), suggesting a dominant contribution from microbial CH4 emissions, which can include both anthropogenically influenced microbial sources such as livestock, landfill/waste, and rice cultivation, and natural sources such as wetlands and shallow lakes. Atmospheric inverse modeling that assimilates both atmospheric CH4 and δ13C-CH4 measurements suggests a major emission increase in 2006–2016 from tropical regions, while total emissions from the Arctic remain stable (Basu et al., 2022). These conclusions are consistent with GCP-CH4 results. Basu et al. (2022) found a more significant contribution from microbial emission increase to post-2006 global increase than the GCP- CH4 study, but mainly from the tropics. Extended modeling results until 2021 from joint atmospheric CH4 and δ13C-CH4 inversions provided by NOAA’s CarbonTracker-CH4 modeling system (Oh et al., 2023) also found a dominant role of global microbial emission increases since 2006, but no significant increase in total Arctic methane emissions or Arctic microbial emissions.
There is, without question, potential for significant amplification of climate change resulting from disturbance of large carbon reservoirs in the Arctic. Thawing permafrost releases carbon into newly formed inundated regions that can be converted to CH4 or CO2, depending on hydrology. Such changes were a major contributor to transitions from glacial to interglacial periods in the paleoclimate record. Are changes to Arctic CH4 emissions already significantly altering Earth’s climate? Our best constraint comes from high-quality atmospheric measurements of CH4 abundance at background surface measurement sites, both for assessing changes in CH4 emissions and determining the reasonableness of estimates from particular Arctic sources.
We, and other participants in the World Meteorological Organization, Global Atmosphere Watch program (https://community.wmo.int/en/activity-areas/gaw) of GHG and related tracer observations, put great effort into ensuring high-quality measurements where spatial and temporal gradients are meaningful. These gradients are used in the range of analysis methods and scales to quantify emissions and how they change with time. Total Arctic methane emissions north of 53°N are estimated to account for about 10% of global total emissions, while north of 60°N accounts for about 4%. Based on the difference in surface atmospheric CH4 between polar northern and polar southern latitudes, and interpretation of such observed features by various atmospheric tracer transport models, a significant increase in Arctic emissions has not yet been detected.
XL: Conceptualization, Data curation, Formal Analysis, Funding acquisition, Investigation, Methodology, Writing–original draft, Writing–review and editing. ED: Conceptualization, Data curation, Formal Analysis, Investigation, Methodology, Writing–original draft, Writing–review and editing.
The author(s) declare financial support was received for the research, authorship, and/or publication of this article. This research was supported in part by NOAA Climate Program Office AC4 program NA23OAR4310283 and NOAA cooperative agreement NA22OAR4320151.8.
We thank all the organizations and individuals who have assisted us with our cooperative global air sampling network and measurements, and we are grateful for the conscientious efforts of all network observers.
The authors declare that the research was conducted in the absence of any commercial or financial relationships that could be construed as a potential conflict of interest.
All claims expressed in this article are solely those of the authors and do not necessarily represent those of their affiliated organizations, or those of the publisher, the editors and the reviewers. Any product that may be evaluated in this article, or claim that may be made by its manufacturer, is not guaranteed or endorsed by the publisher.
Basu, S., Lan, X., Dlugokencky, E., Michel, S., Schwietzke, S., Miller, J. B., et al. (2022). Estimating emissions of methane consistent with atmospheric measurements of methane and δ 13 C of methane. Atmos. Chem. Phys. 22 (23), 15351–15377. doi:10.5194/acp-22-15351-2022
Bock, M., Schmitt, J., Beck, J., Seth, B., Chappellaz, J., and Fischer, H. (2017). Glacial/interglacial wetland, biomass burning, and geologic methane emissions constrained by dual stable isotopic CH4 ice core records. Proc. Natl. Acad. Sci. 114 (29), E5778–E5786. doi:10.1073/pnas.1613883114
Bousquet, P., Ringeval, B., Pison, I., Dlugokencky, E. J., Brunke, E.-G., Carouge, C., et al. (2011). Source attribution of the changes in atmospheric methane for 2006–2008. Atmos. Chem. Phys. 11 (8), 3689–3700. doi:10.5194/acp-11-3689-2011
Chang, K.-Y., Riley, W. J., Knox, S. H., Jackson, R. B., McNicol, G., Poulter, B., et al. (2021). Substantial hysteresis in emergent temperature sensitivity of global wetland CH4 emissions. Nat. Commun. 12, 2266. doi:10.1038/s41467-021-22452-1
Dlugokencky, E. J., Houweling, S., Bruhwiler, L., Masarie, K. A., Lang, P. M., Miller, J. B., et al. (2003). Atmospheric methane levels off: temporary pause or a new steady-state? Geophys. Res. Lett. 30 (19). doi:10.1029/2003GL018126
Dlugokencky, E. J., Myers, R. C., Lang, P. M., Masarie, K. A., Crotwell, A. M., Thoning, K. W., et al. (2005). Conversion of NOAA atmospheric dry air CH4 mole fractions to a gravimetrically prepared standard scale. J. Geophys. Res. Atmos. 110, D18. doi:10.1029/2005JD006035
Dlugokencky, E. J., Paul Steele, L., Lang, P. M., and Masarie, K. A. (1994). The growth rate and distribution of atmospheric methane. J. Geophys. Res. Atmos. 99 (D8), 17021–17043. doi:10.1029/94JD01245
Lan, X., Basu, S., Schwietzke, S., Bruhwiler, L. M. P., Dlugokencky, E. J., Michel, S. E., et al. (2021). Improved constraints on global methane emissions and sinks using δ13C-CH4. Glob. Biogeochem. Cycles 35 (6), e2021GB007000. doi:10.1029/2021GB007000
Lan, X., Tans, P., and Thoning, K.NOAA Global Monitoring Laboratory (2023). NOAA greenhouse gas marine boundary layer reference - CH4. Boulder, Colorado: NOAA GML. doi:10.15138/TJPQ-0D69
Lan, X., Thoning, K. W., and Dlugokencky, E. J.: Trends in globally-averaged CH4, N2O, and SF6 determined from NOAA global monitoring laboratory measurements. 2024, doi:10.15138/P8XG-AA10
Michel, S. E., Vaughn, B. H., Tans, P., Thoning, K., and Lan, X. (2021). Atmospheric δ13C-CH4 data from the institute of arctic and alpine Re- search (INSTAAR) at the university of Colorado. Boulder Coop. NOAA Glob. Monit. doi:10.15138/79jq-qc24
Oh, Y., Bruhwiler, L., Lan, X., Basu, S., Schuldt, K., Thoning, K., et al. (2023). CarbonTracker CH4 2023 (Boulder, Colorado: NOAA Global Monitoring Laboratory).
Rantanen, M., Karpechko, A. Y., Lipponen, A., Nordling, K., Hyvärinen, O., Ruosteenoja, K., et al. (2022). The Arctic has warmed nearly four times faster than the globe since 1979. Commun. Earth Environ. 3, 168. doi:10.1038/s43247-022-00498-3
Rößger, N., Sachs, T., Wille, C., Boike, J., and Kutzbach, L. (2022). Seasonal increase of methane emissions linked to warming in Siberian tundra. Nat. Clim. Change 12 (11), 1031–1036. doi:10.1038/s41558-022-01512-4
Ruppel, C., and Kessler, J. D. (2017). The interaction of climate change and methane hydrates. Rev. Geophys. 55, 126–168. doi:10.1002/2016RG000534
Ruppel, C. D., and Waite, W. F. (2020). Timescales and processes of methane hydrate formation and breakdown, with application to geologic systems. J. Geophys. Res. Solid Earth 125, e2018JB016459. doi:10.1029/2018JB016459
Saunois, M., Stavert, A. R., Poulter, B., Bousquet, P., Canadell, J. G., Jackson, R. B., et al. (2020). The global methane budget 2000–2017. Earth Syst. Sci. data 12 (3), 1561–1623. doi:10.5194/essd-12-1561-2020
Schwietzke, S., Sherwood, O. A., Bruhwiler, L. M. P., Miller, J. B., Etiope, G., Dlugokencky, E. J., et al. (2016). Upward revision of global fossil fuel methane emissions based on isotope database. Nature 538 (7623), 88–91. doi:10.1038/nature19797
Segers, A., and Houweling, S. (2024). Description of the CH4 inversion production chain. CAMS Copernic. Atmos. Monit. Serv. Rep., Available at: https://ads.atmosphere.copernicus.eu/cdsapp#!/dataset/cams-global-greenhouse-gas-inversion?tab=overview.
Keywords: atmospheric methane, Arctic, methane emissions, climate change, climate feedbacks
Citation: Lan X and Dlugokencky EJ (2024) Atmospheric constraints on changing Arctic CH4 emissions. Front. Environ. Sci. 12:1382621. doi: 10.3389/fenvs.2024.1382621
Received: 05 February 2024; Accepted: 08 April 2024;
Published: 26 April 2024.
Edited by:
Carolyn Ruppel, US Geological Survey (USGS), United StatesReviewed by:
Peter Swarzenski, United States Geological Survey, United StatesCopyright © 2024 Lan and Dlugokencky. This is an open-access article distributed under the terms of the Creative Commons Attribution License (CC BY). The use, distribution or reproduction in other forums is permitted, provided the original author(s) and the copyright owner(s) are credited and that the original publication in this journal is cited, in accordance with accepted academic practice. No use, distribution or reproduction is permitted which does not comply with these terms.
*Correspondence: Xin Lan, eGluLmxhbkBub2FhLmdvdg==
Disclaimer: All claims expressed in this article are solely those of the authors and do not necessarily represent those of their affiliated organizations, or those of the publisher, the editors and the reviewers. Any product that may be evaluated in this article or claim that may be made by its manufacturer is not guaranteed or endorsed by the publisher.
Research integrity at Frontiers
Learn more about the work of our research integrity team to safeguard the quality of each article we publish.