 Hang Su1
 Kejin Ren
 Dongdong Wang
95% of researchers rate our articles as excellent or good
Learn more about the work of our research integrity team to safeguard the quality of each article we publish.
Find out more
ORIGINAL RESEARCH article
Front. Environ. Sci. , 30 April 2024
Sec. Environmental Informatics and Remote Sensing
Volume 12 - 2024 | https://doi.org/10.3389/fenvs.2024.1382233
This article is part of the Research Topic Advances in Numerical Model, Data Assimilation, and Observations for Hazardous Weather Prediction: Volume II View all 6 articles
In recent years, although the air quality in the Liaoning region has improved, heavy pollution weather is still caused by external pollution transportation. In order to study the influence of multi-directional long-distance pollution on the heavily polluted weather in Liaoning, this paper analyzes three types of transport channel (northerly, northwesterly, and southwesterly transport corridors) by combining ground observations, airborne observations, AQI and the concentration data of atmospheric pollutants such as PM2.5, PM10 and so on. The results show that both northerly and southwesterly winds caused widespread fog and haze in the Liaoning region. The PM2.5 concentration reached the second-highest value on record (1479 μg/m3) during the pollution period caused by northwesterly wind transport. Wind and sand transported from the northwest mainly caused dusty weather in Liaoning, with PM10 concentration reaching up to 1200 μg/m3 during the pollution period. Northeasterly and northwesterly wind transport mainly led to the accumulation of pollutants in high places to high pollution values. Convergence of winds due to southwesterly wind transport led to prolonged accumulation of pollutants in the Liaoning region, resulting in severe pollution. Long-distance pollution transport is now one of the main sources of heavy pollution in the Liaoning region.
With the rapid development of contemporary society and economy, industrialization and urbanization are steadily advancing. The industry is expanding at a high speed on a global scale. A large amount of industrial waste gas, waste residue and other substances produced cumulatively far exceeds the purification capacity of the earth’s terminals. In the context of such heavily polluted environment, the pollution of the atmospheric environment at the regional and global scales has become a severe problem faced by humanity worldwide. As air pollution is a regional environmental problem, the concentration of air pollutants in a region is not only affected by the emission of local pollution sources but also by the transportation of air pollutants from outside of the region (Su et al., 2014; Pu-hui et al., 2019). Multiple cities in economically developed regions may constitute “city clusters.” The diffusion and mixing of pollutants within these clusters may lead to regional pollution diffusion on a large scale between cities (Xiangde et al., 2004). Atmospheric pollution on a regional scale may spread to the city’s peripheral areas and even be transported over long distances to other relevant areas. Therefore, the study of air pollution sources only within a particular city can no longer comprehensively solve the regional air environment pollution problem, and there is a greater need in understanding the transformation and transportation process of pollutants in the air.
With the gradual aggravation of domestic air pollution problems in recent years, more and more scholars have begun to pay attention to the impact of long-distance pollution transportation on the degree of air pollution. Yannan et al. (2023) used the application of the WRF model to analyze the PM2.5 transport characteristics and emission reduction effects under the influence of different weather types in the Beijing-Tianjin-Hebei region, and the results showed that the transport of exogenous pollution was more pronounced in Beijing and Shijiazhuang on PM2.5 pollution days, and that the emission contributions of local sources in Shijiazhuang were all higher than those of local sources in Beijing. Gao et al. (2021) analyzed the pollution characteristics of the top pollutants in Harbin City in different seasons through the air quality index to reveal the seasonal differences in the transmission paths of atmospheric pollutants and the trajectories of potential source contributing factors and concentration weights in Harbin City. Using the HYSPLIT model, Li et al. (2018) analyzed the transport paths and vertical exchange characteristics of haze in the dry and wet seasons in four sub-regions of Guangdong Province in southern China with 10 years of data from 2005 to 2014, summarizing the three main transport paths based on the results statistically and combining them with the analysis of the vertical exchanges, which indicated that Wuyi and Nanling mountain ranges play a blocking role for the haze streams in other regions. Yan et al. (2005) took the subsurface of the Pearl River Delta at different times as an example, and the results showed that the development of urban agglomerations made the spreading range of pollutants smaller, the contribution to the local area increased, and the contribution to other areas decreased.
However, such studies mainly focused on economically developed regions such as Beijing-Tianjin-Hebei, Yangtze River Delta, and Pearl River Delta and analyzed a single pollution event. As an essential old industrial base in China, the Liaoning region is a high-incidence area with heavy pollution from fog, haze, sand, dust, etc. The cause of heavy pollution in the region is mainly composed of two parts: the air pollution caused by the local heavy pollution industries in the Liaoning region and the air pollutants due to the transportation from the external cities. However, there are few existing studies analyzing the degree of influence of external pollutant transport on local weather in Liaoning. Chen et al. (2019) analyzed a pollution process that occurred in mid-March 2017 in central Liaoning using meteorological data and online ion chromatography data. The study found that during the pollution period in Shenyang, horizontal diffusion conditions were consistently unfavorable, with strong inversions occurring from night to early morning. Additionally, vertical diffusion conditions were significantly unfavorable, resulting in the accumulation of pollutants to higher concentrations. The pollution process was greatly influenced by straw burning. While there are articles discussing the heavy pollution weather in the Liaoning region, but few studies have been conducted on the pollution situation caused by external transportation in the region. So this paper selects three representative and wide-scale heavy pollution weather processes in Liaoning as cases, analyzes their meteorological causes, compares and analyzes the influence of different types of multi-directional long-distance pollution transport on heavy pollution weather in Liaoning.
This paper selects three representative heavily polluted weather processes in the Liaoning region as case studies. On 8 November 2015, northerly winds transported air pollutants from straw burning in Heilongjiang and Jilin to the Liaoning region, resulting in severe fog and haze. On April 3–4, 2020, the northwest wind transported sand and dust from Inner Mongolia to Liaoning, resulting in a polluted weather process of mixing sand, floating dust and haze along the direction of wind transmission from north to south in Liaoning. On 19 December 2016, southwesterly winds transported air pollutants generated by emissions from the Beijing-Tianjin-Hebei region to the Liaoning region, where similarly severe fog and haze conditions occurred. The heavily polluted weather in Liaoning caused by the three types of transport has the same points and has its typical characteristics. With the help of these three heavily polluted weather processes in Liaoning, this paper explores the impacts of multi-directional long-distance pollution transport on the heavily polluted weather in Liaoning.
The research data in this paper includes high and low altitude data such as ground observation data, sounding data and the hourly monitoring data of AQI, PM2.5 and PM10 concentrations from the China Meteorological Administration (CMA). The above data are mainly from the observation data of the Liaoning Meteorological Bureau and the Liaoning Department of Ecology and Environment. The meteorological data used in the backward trajectory model are GDAS data provided by the National Centers for Environmental Prediction (NCEP) of the United States of America, with a spatial resolution of 1° × 1°.
In order to understand the trajectory of pollutants with airflow, this study uses the diffusion model HYSPLIT (Hybrid Single-Particle Lagrangian Integrated Trajectory model), jointly developed by the National Oceanic and Atmospheric Research Center (NOAA) and the Air Resources Laboratory (ARL), which is a hybrid of the Lagrangian method of model computation, which uses a moving frame of reference for convective and diffusive computations as the trajectories or air parcels start moving from their initial positions (Liu et al., 2021b). HYSPLIT is widely used in atmospheric pollutant transport studies, from simplified single trajectory estimates based on sounding gauge observations to a system that covers multiple interacting pollutants transported, dispersed and deposited from local to global scales to visualize the trajectories of atmospheric air mass and particle motions (Jiang and Duan, 2020).
This paper uses the Meteoinfo software, based on the HYSPLIT4 model, to simulate the 24-h backward trajectories of Shenyang city (41.93°E, 123.68°N) during three instances of heavy pollution. The primary cluster analysis method employed was the spatial variance clustering algorithm proposed by Dorling et al. (1992) The spatial variance clustering algorithm grouped the air mass trajectories reaching the pattern-receiving point area. This was achieved by calculating the spatial variance of each two trajectory combinations and clustering the groups of air mass trajectories arriving at the mode receptor region based on the similarity of their trajectory space.
The potential source contribution function (PSCF) analysis is a method for identifying source regions based on airflow trajectory analysis (Begum et al., 2005; Yan-jun et al., 2019). The method assumes that if the backward trajectory of an air mass has a residence time in a particular grid, the air mass will receive emissions from this region and subsequently undergo transport, contributing to the concentration at the receiving point. A rectangular grid (
Also, in order to reduce the effect of error in the conditional probability function due to the small total number of samples n, the weighting coefficient
In turn, the PSCF is weighted, and the larger the value of WPSCF, the higher the influence of the grid area on the particulate matter concentration at the monitoring point Eq. 3:
The PSCF analysis calculates the proportion of contaminated trajectories in a grid, reflecting the density of fallout or retention time of contaminated trajectories in the grid, which cannot reflect the degree of contamination of the contaminated trajectories and have the same WPSCF value when the pollutant mass concentration is slightly higher or much higher than the given threshold. So it is tough to differentiate between the source areas with high pollutant mass concentration (Jie, 2021; Wu et al., 2023). Moreover, concentration-weighed trajectory (CWT) analysis quantitatively gives the average weight concentration of each grid by calculating the weight concentration of the trajectory, which quantitatively reflects the pollution degree of different trajectories (Jiang et al., 2022). In CWT, each grid point has a weight concentration, which is realized by calculating the average mass concentration of pollutants corresponding to all trajectories passing through the grid and the calculation formula is Eq. 4:
Where:
Among the pollution transport events in the northward direction, this paper selects a severe fog and haze weather event in the Liaoning region from November 7–14, 2015, as a case study, which is the largest area-covering and most extended duration of heavy pollution in the Liaoning region since 2012 (Yawei et al., 2016; Hou et al., 2017; Lin et al., 2019). Beginning on November 6, the visibility of cities in the province began to decline. Some places appeared light fog, while PM2.5 concentrations also began to appear as an elevated phenomenon. November 7 reached the haze weather standards and covered all cities. On November 8th, the concentration of various pollutants in the Liaoning region reached its peak during the day, resulting in the most severe haze with heavy and above levels of pollution. Some cities in Liaoning had AQI as high as 500, the central cities of Liaoning have been in the severe haze, the eastern cities of Liaoning reached a severe haze. On November 10, the province has turned to a moderate haze and continue to weaken the phenomenon. November 11, the beginning of the daytime haze weather of moderate or below the level of haze weather and the night of the fog weather alternately. November 14, the beginning of the province’s visibility back up, the fog and haze weather began to weaken and disappear. Since records were kept, the fog and haze weather made the PM2.5 concentration in Shenyang city reach the second largest value (1479 μg/m3). Localized AQI value is 257, with a wide range of impacts and long duration. It severely impacted local transportation and the health of residents due to low visibility and atmospheric pollution caused by fog and haze (Meina and Zhang, 2014; Liu et al., 2021a; Zhao and Zhang, 2022).
As shown by the satellite remote sensing monitoring map, a large number of fire spots generated by straw burning (red dots in Figure 1) appeared in Heilongjiang and Jilin provinces on November 6–7, 2015, while continuous northerly winds of 3-4 levels occurred in the northeastern part of the country, which was conducive to the transport of pollutants generated by straw burning to the Liaoning region (Figure 2). From November 5–8, 2015, peak PM2.5 concentrations occurred successively from north to south in cities in the central part of the Northeast region, indicating that pollutants were gradually imported into the Liaoning region with northerly winds. This process coincided with the heating period of winter in the Northeast region, and the mineral resources used for heating in this period are mainly coal, so the air quality within the cities decreases significantly when entering the heating period from the non-heating period (Jiaxuan, 2020). According to the PM2.5 concentration data, Harbin, Changchun, Shenyang, and Penglai, in turn, showed peak concentrations during this period (Figure 1), which also proves that the northerly winds are the main driving force for the propagation of pollutants in this fog and haze.
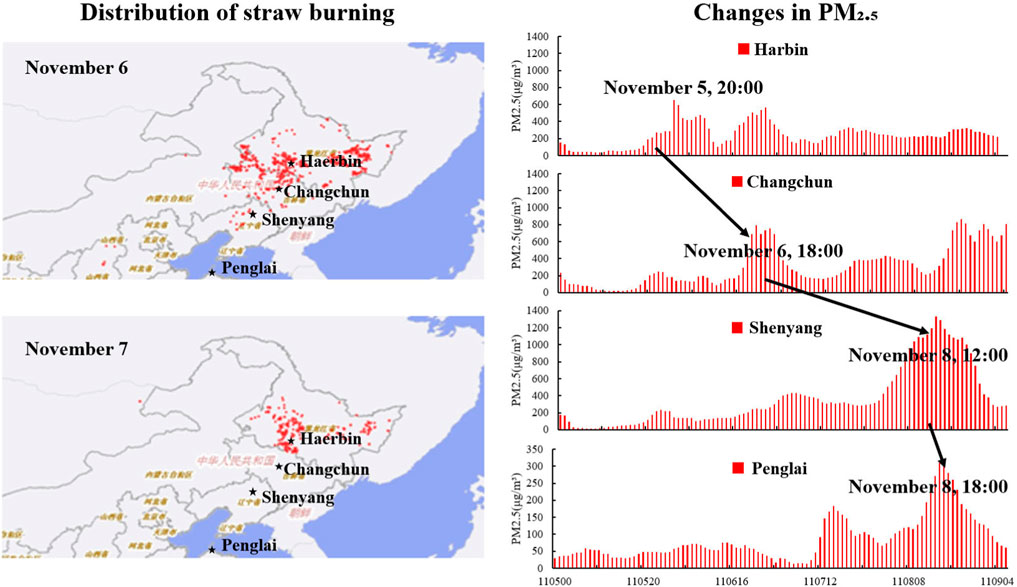
Figure 1. Pollutant transport from straw burning in the Northeast, November 5–8, 2015.
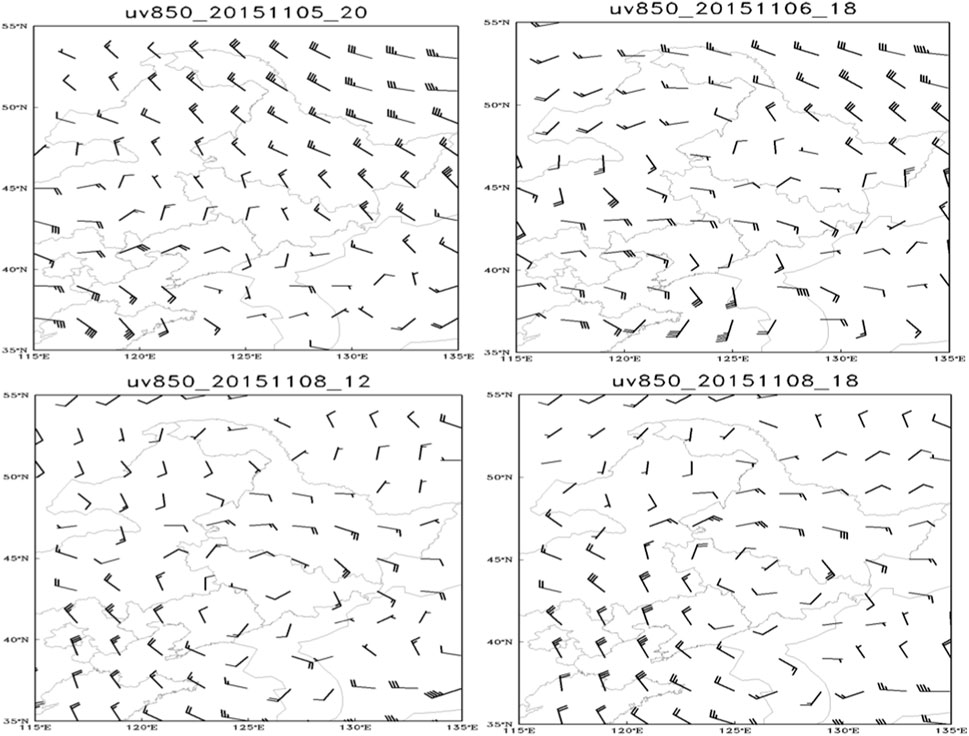
Figure 2. 850 hPa wind field map of the Northeast, November 5–8, 2015.
By analyzing the rising speed of pollutant concentration in this northward transported pollution event, the change of PM2.5 concentration over time in Shenyang city during the heavy pollution process (Figure 3) was selected for the comparative study. The results showed that on 8 November 2015, under the influence of the northward winds, the PM2.5 concentration in Shenyang city rose sharply from 360 μg/m³, and reached a peak of 1,500 μg/m³ at about 13:30 on the same day, and then decreased sharply to about 800 μg/m³, with large fluctuations.
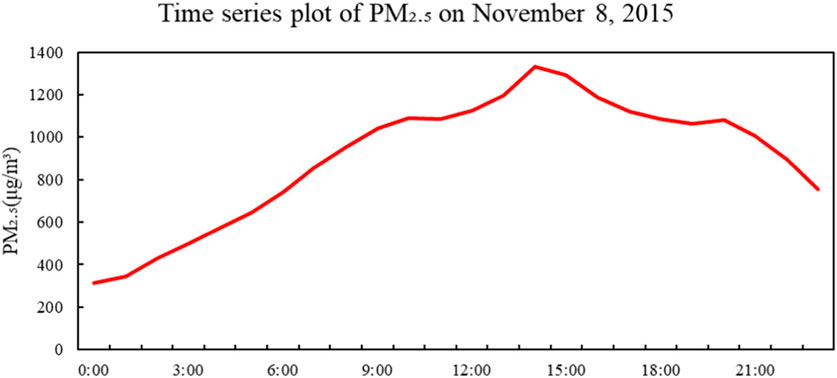
Figure 3. PM2.5 concentration versus time in Shenyang City on 8 November 2015 during the heavy pollution peak hour.
Regarding the weather situation, the primary analysis is the effect of wind convergence on this pollutant build-up in the Liaoning region. The 500 hPa wind field aloft in the Liaoning region from 6 to 9 November 2015 shows (Figure 4) a persistent stable westerly convergence throughout this period. At the 500 hPa pre-processing period, the Liaoning area was influenced by a high-pressure ridge and gradually moved northward, with a southwesterly flow under the ridge, which contributed to a significant increase in humidity in the Liaoning area. Consequently, this condition favored the occurrence of foggy and hazy weather. A warm ridge or advection is present over the lower 850 hPa Liaoning region, but it is relatively weak. As a result, the wind field is not powerful and the concentration of pollutants is maintained (Yannan et al., 2023). On the ground map, Liaoning is in the middle of a closed high-pressure and a closed low-pressure, the location of the low-pressure rear, and the two major high and low-pressure systems are in a static state of little movement. The Liaoning region was under the influence of a ground low-pressure weather system control, leading to local air convergence with the convergence center in Shenyang. As a result, the wind speed was low, and the humidity was high at the center, facilitating the condensation of pollutants at higher levels. On the November 9th, the ground low-pressure system gradually moved away from the Liaoning region, resulting in a reduction in air pollution.
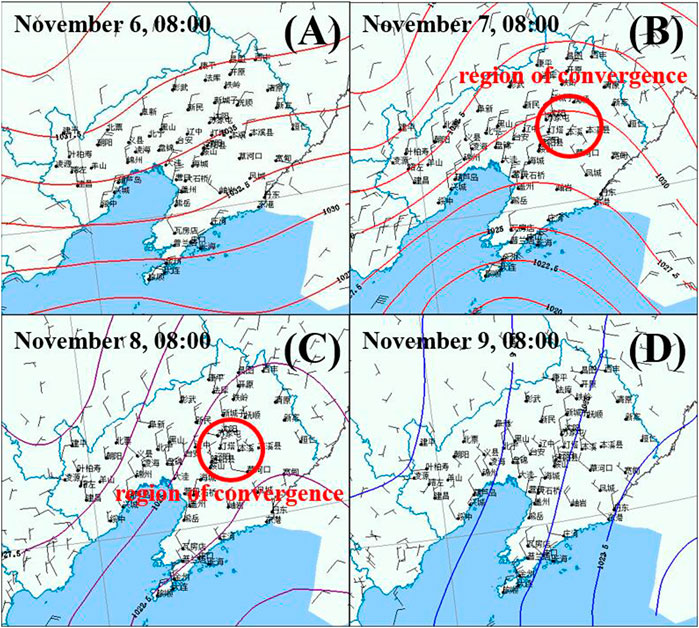
Figure 4. Time series of the surface 500 hPa wind field and barometric field in the Liaoning region during the peak of heavy pollution in November 2015 [where the times are 8:00 a.m. on the 6th (A), 8:00 p.m. on the 7th (B), 8:00 p.m. on the 8th (C), and 8:00 p.m. on the 9th (D)].
In the analysis of vertical diffusion conditions, this paper analyzes the inhibitory influence of the atmospheric inversion layer on the vertical diffusion of pollutants in the Liaoning region this time, because heavily polluted weather is often accompanied by the emergence of exceptional weather conditions. Previous studies have shown the close relationship between atmospheric inversion layer and air quality. The inversion is recognized as an essential factor that affects the extent of air pollution (Yao et al., 2018; Peng et al., 2021; Shi-min et al., 2021; Qi et al., 2022). From this single-station sounding map of the area of the air pollution transport process experienced in the Liaoning region (Figure 5), when pollutants are transported to the Liaoning region, an inversion layer occurs vertically above the irradiation region, which prevents the pollutants from spreading vertically as well, resulting in a large amount of pollutants being compressed in the space of only a few hundred meters from the ground (Liu et al., 2022). Take 8 November 2015, Shenyang station as an example, the process of the vertical distribution of temperature data shows that 850 hPa below the existence of a pronounced inversion layer. On November 14th, the inversion layer dissipated, and atmospheric pollution vanished with it. At 8:00 on the 8th of the sounding map shows that there are three prominent inversion layers at Shenyang station, respectively located between 925 and 850 hPa, 850-700 hPa, 700-600 hPa, and there is a significant warming section around 925 hPa, very favorable for the accumulation of pollution, although there is an inversion layer over Harbin. However, the number of inversion layers over Harbin is fewer and the height of the lowest inversion layer is higher. Therefore, it did not cause significant pollution in Harbin and Changchun. From 7th to 8th, Liaoning province experienced a wide range of rainy and snowy weather processes. The air 0.5–2.5 km on the sounding map also had a transparent wet layer. The temperature curve and dew point temperature curve overlap 2200 m below the air humidity is larger, the relative humidity in the air reached 100%, but at the same time, the precipitation was minimal, coupled with the wind being weak in the horizontal direction and vertical direction, the pollutants cannot be effectively diffused, and the high humidity environment in the air makes the pollutants absorb moisture and grow, thus forming fog and haze weather. Observation of the vertical structure of the atmosphere at the peak of heavy pollution during this air pollution transport process showed that a 3-layer inversion occurred on 8 November 2015 over Shenyang (Figure 5). Due to the number of inversions, the ability of the atmosphere to diffuse vertically has always been limited. The delivery of foreign pollutants to the Liaoning region, due to the alternating surface winds conversion, the pollutants are transported back and forth and piled up in the near-surface layer, which makes it possible to have long periods for the pollution to exist, and, at the same time, the air within the inverted layer of humidity is significant, and pollutants are prone to hygroscopic growth and exacerbate the pollution.
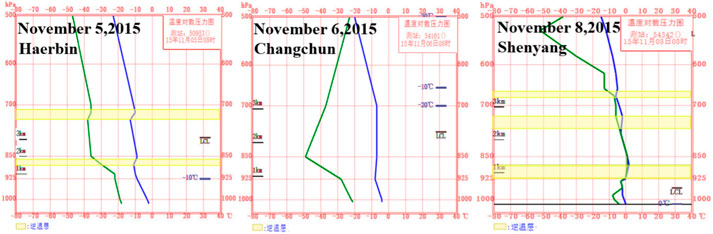
Figure 5. Convergence area at the peak of heavy pollution 5 November 2015 Harbin site sounding, 6 November 2015 Changchun site sounding, 8 November 2015 Shenyang site sounding (the blue line is the temperature contour, the green line is the dew point temperature contour representing humidity, the yellow area is the inversion layer).
In order to analyze more clearly the possible sources of air pollutants in the Liaoning region and to analyze the effect of atmospheric transport on the concentration of each air pollutant in the Liaoning region, the HYSPLIT model and NCEP meteorological reanalysis data were used to simulate the long-distance pollution transport paths of the external pollution sources to the Liaoning region. Shenyang city (41.9339°N, 123.6836°E) is selected as the model input coordinate point. The mass points of the air mass at different heights (50 m, 500 m, and 5000 m) are set. The trajectory of the air mass is tracked backward based on the GDAS meteorological data (Figure 6). The results show that there are apparent northward transport channels at 50 m and 500 m from November 7–14, 2015, mainly originating from Heilongjiang and Jilin provinces.
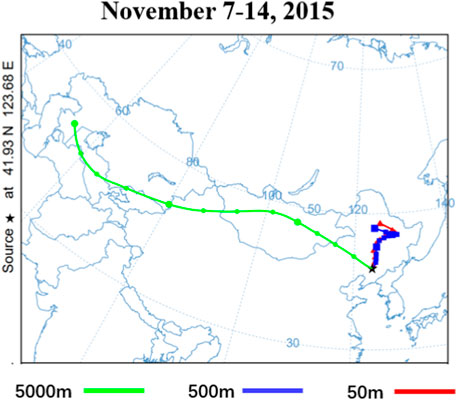
Figure 6. Trajectory analysis of backward airflow during pollution transport, November 7–14, 2015.
The effective backward trajectories simulated for this pollution transport process were clustered (Figure 7A), and four primary transport paths were obtained separately (Figure 7B), and the results were consistent with the trend of wind direction change in this pollution transport process. The transportation path and direction of the trajectory indicate the area that the air mass passes through before it reaches Shenyang City, and the moving speed of the air mass can be judged by the length of the trajectory. The long trajectory corresponds to the fast-moving air mass, and the short trajectory corresponds to the slow-moving air mass. The two main atmospheric circulation factors affecting winter temperatures in Shenyang City are the East Asian trough and the Arctic Oscillation. When the East Asian trough is strong and the northwestern cold air extends southward, it brings a large amount of water vapor to the region, resulting in noticeable humidification effects. This condition increases the likelihood of foggy and hazy weather occurrences. As shown in Figure 7A, in the pollution process in November 2015, the trajectory of the northward direction is more and longer biased, which is favorable to the transport of pollutants from Heilongjiang and Jilin, etc. The southward trajectory is less biased, but the trajectory line of the airflow is shorter, the airflow speed slows down, and the air quality is affected more by the localized small-scale impacts, so that the pollutants appear to be aggregated and have a longer impact time in Shenyang.
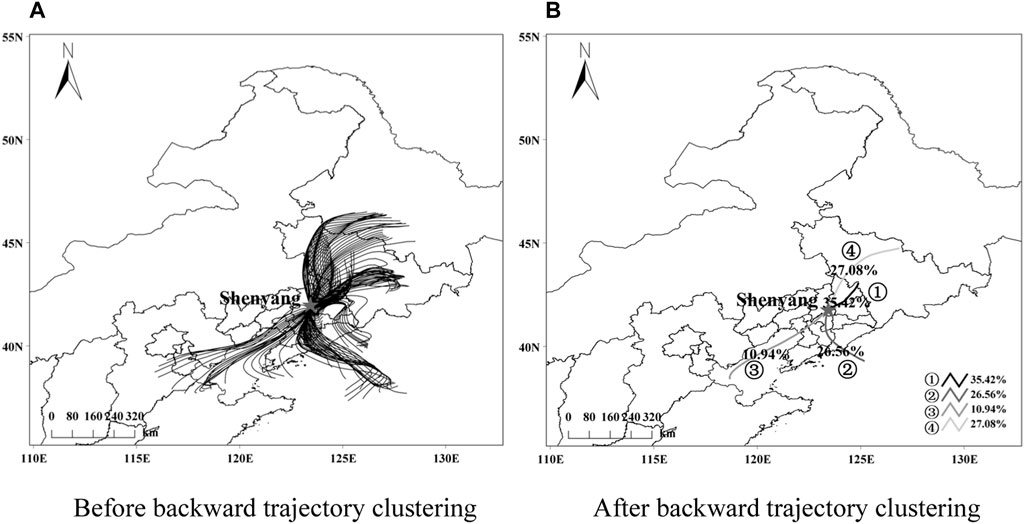
Figure 7. Backward trajectory distribution of the pollution transport process, November 7–14, 2015. [Where (A) is before backward trajectory clustering and (B) is after backward trajectory clustering].
According to the direction and speed differences of the airflow trajectories, the 24-h backward trajectories of this pollution process were merged and classified using the cluster analysis method, the number of clustered trajectories of this pollution process was classified into four categories [Figure 7B], adding the data of the daily average of the quality concentration of particulate pollutants corresponding to this pollution process, as well as the AQI (Air Quality Index) of the corresponding time, the statistics of the clustered trajectories were performed (Table 1). Analyze the effect of airflow trajectories on the air pollutant mass concentration of this pollution process. Combined with Figure 7 and Table 1, it can be seen that the mass concentrations of particulate pollutants PM2.5 and PM10 were higher during the pollution process in November 2015, and the primary pollutant was PM10. Airflow trajectories (clusters one and 4) from the northern part of Liaoning, the Jilin area, and the southwestern part of Heilongjiang accounted for the largest percentage of the total number of airflow trajectories in the pollution process in November 2015 (Dian et al., 2023). Their corresponding ρ(PM2.5) as well as ρ (PM10) were the maximum values in this pollution process, with the highest ρ(PM2.5) of 590.56 μg/m³ and the highest ρ (PM10) of 613.81 μg/m³.The contribution of the fourth trajectory to PM2.5 snd PM10 was the largest among all the clustered trajectories in this pollution process.
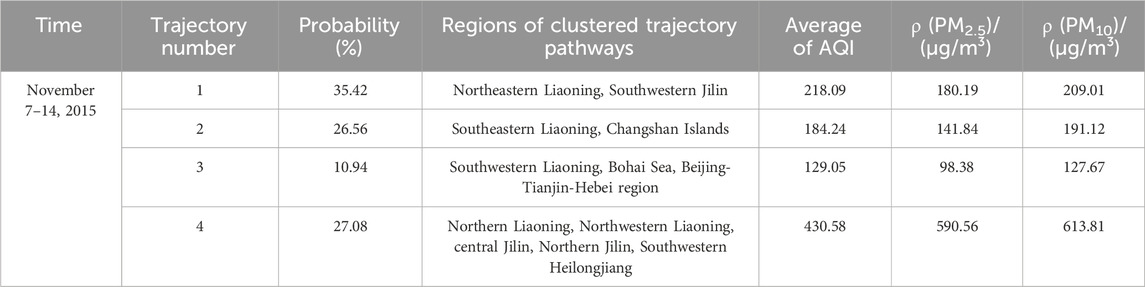
Table 1. Regional characteristics of the clustering of various types of trajectories of the pollution transport process from November 7–14, 2015.
The WPSCF algorithm is a method to identify the pollution source area based on the airflow trajectory analysis by combining the air mass trajectory with the particulate matter concentration, and the larger the value of WPSCF, the higher the influence of the grid area on the particulate matter concentration of the monitoring point. Figure 8 analyzes the trajectory clustering, PM2.5 potential source distribution, and their relative contributions in Shenyang City during this pollution transport process. In order to make the potential source area more easily identifiable, this paper sets the threshold of PM2.5 concentration for the whole observation period to the national secondary standard 75. From the pollution process in November 2015 (Figure 8A), it can be seen that this pollution was influenced by the northeastward airflow, and the main potential source areas of pollutants were distributed in the regions of northern Liaoning, western Jilin, and southern Heilongjiang. The distribution characteristics of CWT (Figure 8B) were similar to those of PSCF. The high-value areas of CWT in the pollution process of November 2015 were concentrated in the regions of western Jilin, central Jilin, and northwestern Heilongjiang, similar to the spatial distribution characteristics of the high-value area of PSCF, which contributed to the daily mean value of pollutant ρ (PM2.5) above 500 μg/m3 and up to more than 800 μg/m3.
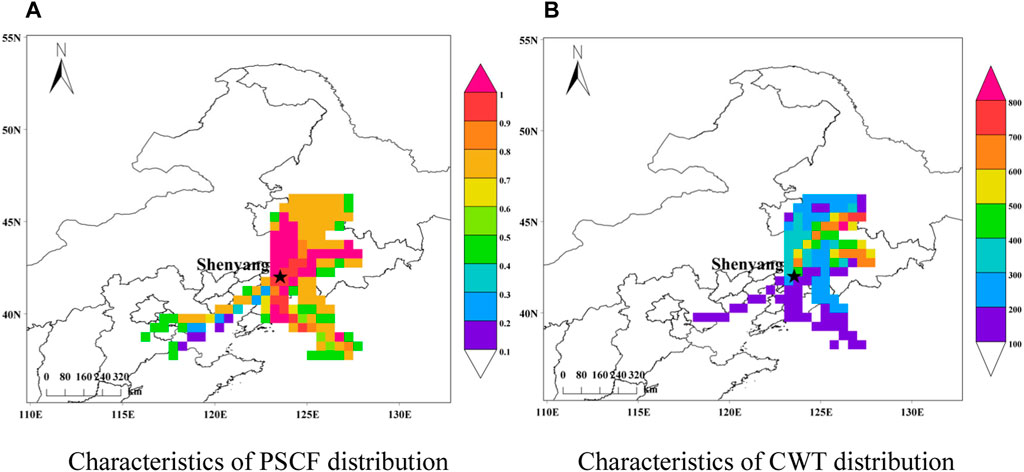
Figure 8. Characteristics of PSCF and CWT distribution during pollution transport from November 7–14, 2015. [Where (A) is characteristics of PSCF distribution and (B) is characteristics of CWT distribution].
From 16:00 on 3 April 2020 to 2:00 on 4 April 2020, a polluted weather process with a mixture of sand, dust and haze occurred in Liaoning from north to south along the direction of wind conduction. The sand and dust in the large area of Liaoning region originated from the Horqin Desert on the border between Liaoning Province and Inner Mongolia Autonomous Region, as well as a number of desert areas in the province with poor vegetation conditions, coupled with strong northwesterly winds, which led to one of the most severe sand and dust weather in Liaoning region in recent years (Lin et al., 2019), so this paper selects this weather pollution event as a typical case of northwesterly conveyance to be analyzed. April 3 19:00 to 22:00 was the main period of this polluted weather process, after this polluted weather process there were 8 national stations with sandy weather, one national station with dusty weather, and 23 stations with hazy weather (Figure 9).
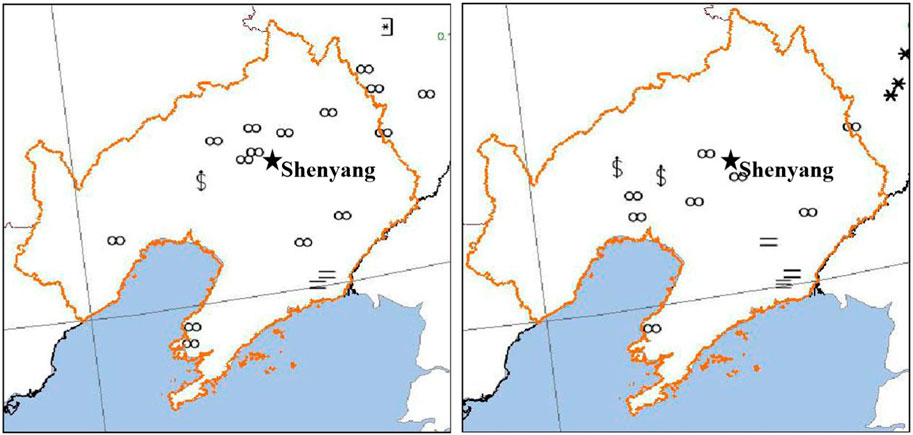
Figure 9. Surface weather map of Liaoning region at 20:00–21:00 on 3 April 2020.
By analyzing the 850 hPa wind field map of the Liaoning region (Figure 10A), this sandy weather first appeared in western Jilin at 10:00 a.m. on April 3. After the cyclone strengthened, the cold front moved southward, with the maximum ground northerly wind reaching 16 m/s, beginning to affect the western and northern parts of Liaoning. As the cold front continued to move southeastward, sandy and hazy weather appeared at the back of the cold front, during which the PM10 concentration reached a maximum of 1200 μg/m3. 1:00 on April 4, as the cold front moved southwestward, the PM10 concentration in the southwestern parts of Liaoning reached between 360 and 621 μg/m3. As the cold front moved out of the Liaoning region at 2:00 on April 4, the influence of the cold front on Liaoning ended ultimately, the intensity of the surface cyclone has been maintained in the process, and strengthened again after entering the sea due to the lower sea temperature. The ratio of PM2.5/PM10 in Shenyang was selected for graphical analysis here (Figure 10B). The results show that there was a significant jump in the ratio of PM2.5/PM10 at about 20:00 on 3 April 2020, indicating that the pollution event was a weather pollution caused by sand and dust, rather than an ordinary weather pollution event.
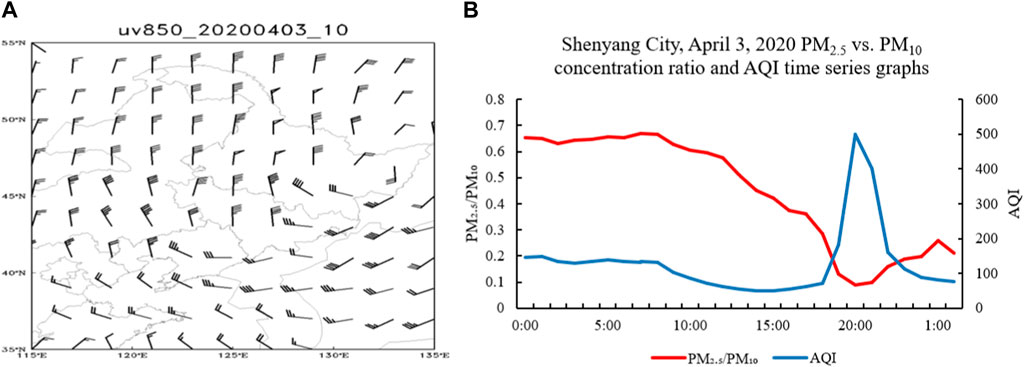
Figure 10. Changes in wind fields and particulate pollutant concentrations during the April 3, 2020 pollution in the Liaoning region. [Where (A) is 850hPa wind field map of Liaoning region at 10:00 on April 3, 2020 and (B) is Shenyang City, April 3, 2020 PM2.5 vs. PM10 concentration ratio and AQI time series graphs].
In terms of wind convergence, this paper analyzes the pollution event using barometric pressure field, wind field and temperature field. At 8:00 a.m. on 3 April 2020, the 200 hPa northwesterly wind rapid area is located in the eastern part of Inner Mongolia to northeastern China. The 66 m/s rapid nucleus is located from Lake Baikal to the eastern part of Inner Mongolia to the junction of Heilongjiang and Jilin in China. There is also a 58 m/s rapid over the Liaoning region, and there is an apparent convergence of the winds in the eastern part of Inner Mongolia to the junction of the three northeastern provinces. The rapids with southwesterly winds are located in the western part of the northeast, and the wind at the center of the rapids' nucleus reaches 50 m/s. In the eastern part of Inner Mongolia, there is a convergence of cold advection with northwesterly winds, which is conducive to the further cooling of the cold air mass. At 8:00 a.m. and 20:00 p.m., the ground cold front was located in the western part of Heilongjiang to the eastern part of Inner Mongolia. 16:00 p.m. on April 3, due to the increase in pressure gradient caused by the increase in near-surface layer winds, sandy weather appeared in the northern part of Liaoning but was in the back of the cold front. From the distribution of the wind field and height field at 8:00 and 20:00 on April 3, the 500 hPa trough area moved from the northern part of Heilongjiang to the southeastern part of Heilongjiang. The dust area was located behind the 500 hPa trough, and the northerly wind rapids behind the trough played a specific role in the occurrence of sandy weather (Figure 11).
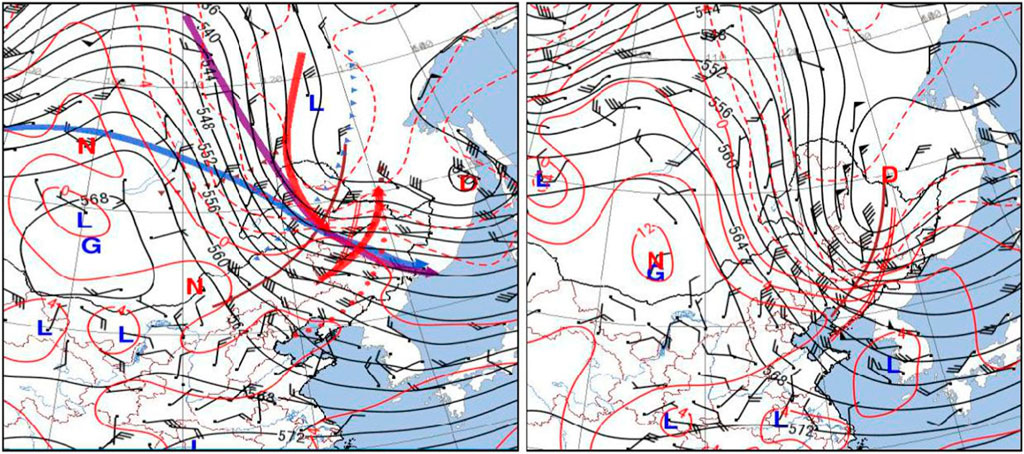
Figure 11. 500 hPa Ground pressure, wind and temperature fields at 0800 and 2000 h on 3 April 2020.
Here, the HYSPLIT model and NCEP meteorological reanalysis information are used to simulate the transport path of external pollution sources for this dust pollution event. Same as the November 2015 pollution event, Shenyang city (41.9339°N, 123.6836°E) was also selected as the model input coordinate point to simulate the air mass trajectory (Figure 12). The results show that on 3 April 2020, there was a clear northwesterly wind transport channel at 50 m, 500 m as well as 5000 m.This time the source of pollution mainly came from the Horqin Desert, which made the Liaoning region experience mixed polluted weather of raised sand, floating dust and haze.
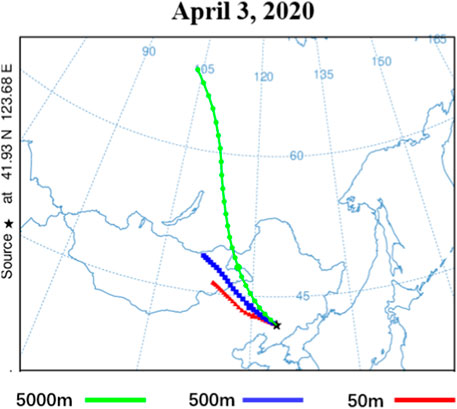
Figure 12. Trajectory analysis of backward airflow during pollution transport on 3 April 2020.
The effective backward trajectories simulated for this dust pollution transport process are clustered (Figure 13A), and four primary transport paths are obtained separately (Figure 13B), the results are consistent with the trend of the wind direction of this pollution is transported process. The sand and dust pollution transport mainly from the northwest direction, that is, the eastern part of China’s Inner Mongolia region, as well as the northeast region of the airflow speed, by the wind will be Inner Mongolia along the sand and dust transported to the Liaoning area, causing local sandy weather, due to the speed of the airflow, the pollution does not last long, but caused by the local weather pollution is still more severe.
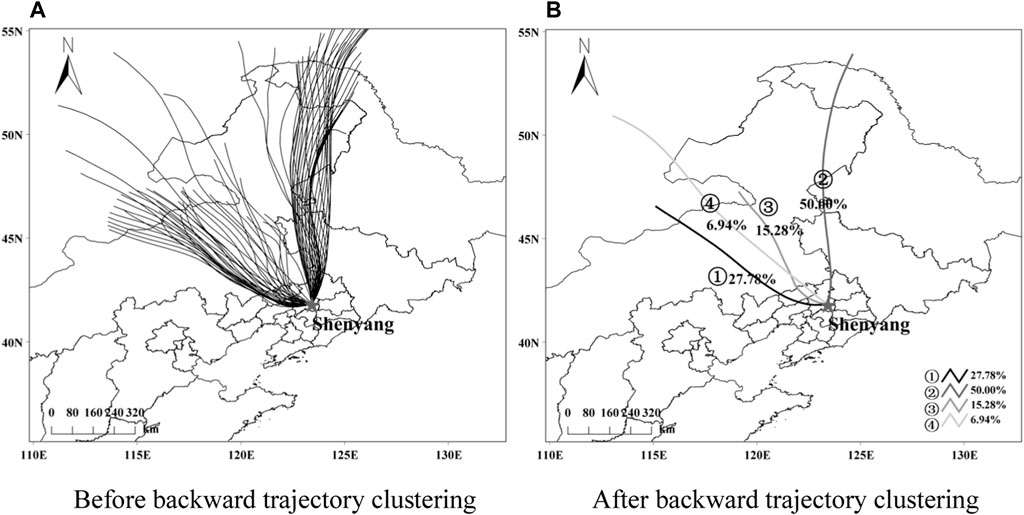
Figure 13. Backward trajectory distribution of the pollution transport process on April 3-4, 2020. [Where (A) is before backward trajectory clustering and (B) is after backward trajectory clustering].
Overlaying the daily average data of particulate pollutant quality concentration corresponding to this pollution process and the AQI at the corresponding time, the pollution characteristics of each trajectory were derived (Table 2), and the results showed that the primary pollutant of this pollution process was PM10. The four types of airflow trajectories were uniformly from the Inner Mongolia and Northeast region. There was also a small amount of airflow from the eastern part of Mongolia. In general, all four trajectories pass through the desert area and carry a large amount of sand and dust, among which the trajectories from northwestern Liaoning, central Inner Mongolia, and eastern Mongolia (trajectory 3) have the highest ρ(PM10) of 155.36 μg/m³, which contributes the most to all the clustered trajectories of this pollution process.
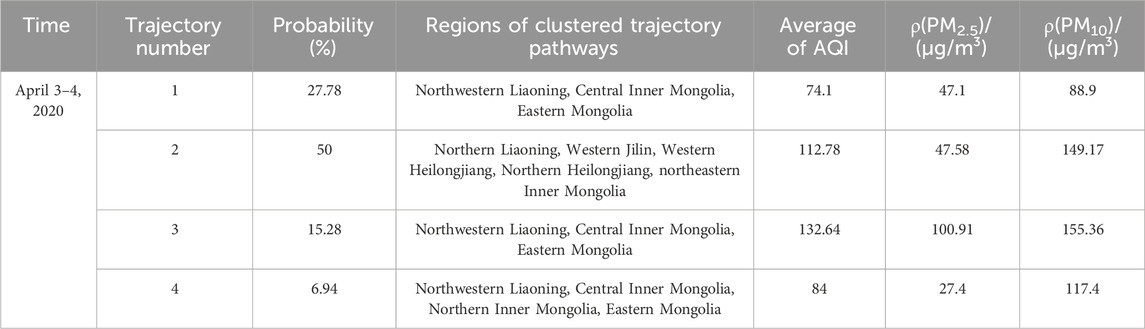
Table 2. Regional characteristics of the clustering of various types of trajectories for the pollution transport process on April 3–4, 2020.
In the potential source area analysis, the air pollutant concentration threshold was set at 75 (Figure 14). The results showed that during this sand and dust pollution process (Figure 14A), the distribution range of the main potential source areas of pollutants became narrow in the northwest-southeast direction. It was mainly concentrated in the eastern part of Inner Mongolia and the southwestern part of the northeastern region. The high CWT area of pollutant ρ(PM2.5) was mainly concentrated in northwest Liaoning, east Inner Mongolia, and northwest Northeast China, with a small amount of distribution in east Mongolia, which contributed up to more than 100 μg/m3 to the daily mean value of pollutant ρ(PM2.5) (Figure 14B).
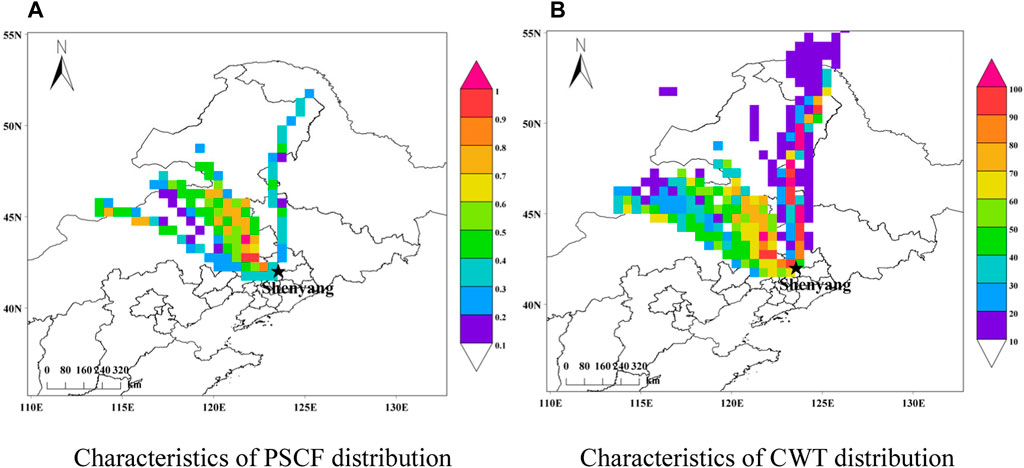
Figure 14. Characteristics of PSCF and CWT Distribution during Pollution Transport from April 3-4, 2020. [Where (A) is characteristics of PSCF distribution and (B) is characteristics of CWT distribution].
In addition to the air pollutants transmitted from Heilongjiang and Jilin provinces due to the northerly winds above, observations of wind speed and PM2.5 concentration near the ground show that an area of high PM2.5 concentration occurred in the Beijing-Tianjin-Hebei region from 08:00–11:00 a.m. on 18 December 2016, and at the same time, there was a persistent southwesterly wind of level 2–3 at the ground, which was conducive to the air pollutants being transported with the southwesterly winds to the Liaoning region (Figure 15).

Figure 15. 850 hPa wind field map of Liaoning area at 8 a.m. on 18 December 2016.
On 18 December 2016, from 8 to 11 a.m., the PM2.5 concentration in Liaoning Province gradually increased, Jinzhou, Fuxin, Tieling, Chaoyang and Huludao reached heavy pollution, Shenyang and Yingkou reached moderate pollution, and the remaining seven cities were mildly polluted or below. The night of 18th to 19th Liaoning province for the static situation, humidity, diffusion conditions continue to be unfavorable, taking into account the accumulation of pollution in the early stages, the province’s air quality is expected to be mainly moderate to heavy pollution, some cities may be severely polluted time. At 20 o ‘clock on the 18th, there was heavy fog in Shenyang city, and visibility was less than 40 m. During the day of the 20th, affected by the northerly wind, the diffusion conditions were slightly improved, and the air quality in the province was mainly medium to heavy pollution. As the topography of northeastern central Liaoning is a rectangular plain that slopes gently to the southwest (Wang et al., 2024), the Beijing-Tianjin-Hebei region, as the upwind city of the Liaoning region, continuously transports pollutants to the northeastern Liaoning region under the influence of southwesterly air currents once the southwesterly winds are the predominant wind direction (Figure 16), which results in the Liaoning region suffering from the impacts of heavily polluted weather.
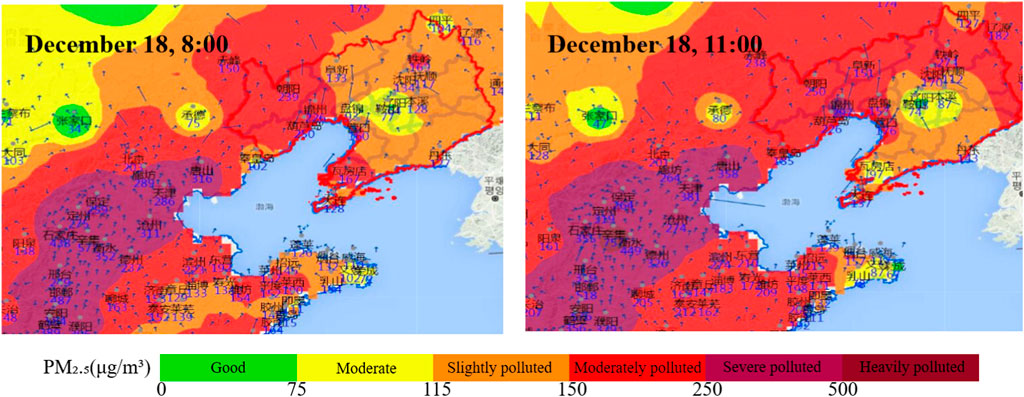
Figure 16. Transport of air pollutants from the Beijing-Tianjin-Hebei region to the Liaoning region at 08:00 and 11:00 on 18 December 2016.
By analyzing the change of PM2.5 concentration over time in Shenyang City during this heavy pollution caused by the southwest wind transport (Figure 17), it was found that on 19 December 2016, under the influence of the southwest wind, the PM2.5 concentration in Shenyang City on that day also showed some ups and downs. However, they were all kept in the range of 180 μg/m³-300 μg/m³, with slower ups and downs of the change and lower concentration peaks.
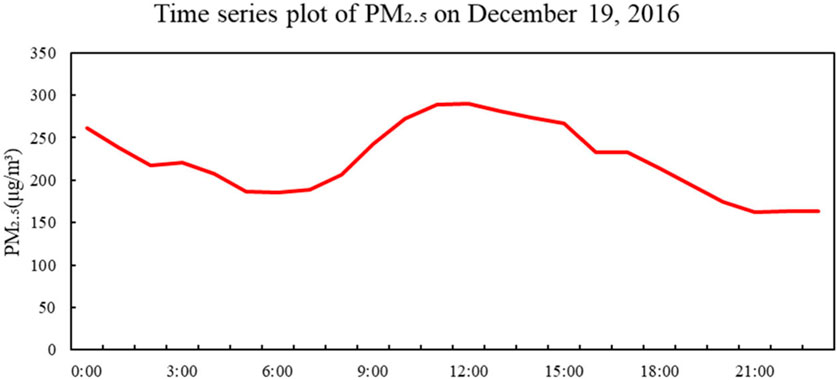
Figure 17. Variation of PM2.5 concentration over time in Shenyang City on 19 December 2016, during the heavy pollution peak hour.
Then, the analysis of the pollution process on December 19–21, 2016, was carried out using wind and barometric pressure field time series diagrams, and it was found that whether it was the northerly wind transport process on 8 November 2015 or the southwesterly wind transport process on December 19–21, 2016, when the pollutants were transported to the Liaoning region, there existed a prominent convergence area in the horizontal direction of the ground in the Liaoning region (Figure 18). The formation mechanism was the same as that of the heavy pollution weather process in November 2015. The pollutants transported in northerly winds and the southwesterly winds provided pollutant material conditions for the convergence. The main difference is that the transport of northerly wind mainly leads to the pollutants gathering to a high value of pollution in high places, causing the emergence of heavily polluted weather in the Liaoning region. In contrast, the transport of southwesterly wind mainly manifests itself as the pollutants gathering to the center of Shenyang under the effect of wind convergence and being unable to be dispersed, forming the irradiated transport of wind field, leading to the pollutants can exist for a more extended period in the area of Liaoning, resulting in the emergence of heavily polluted weather in the area of Liaoning.
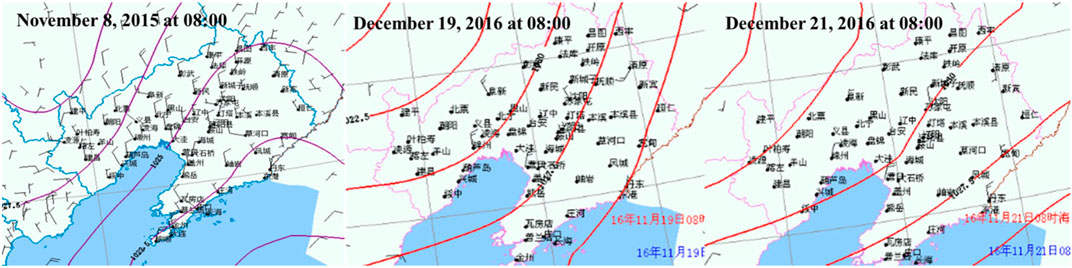
Figure 18. Time series of the surface wind field and barometric pressure field in Liaoning Province during the peak hours of heavy pollution on 8 November 2015 and December 19 and 21, 2016.
An analysis of the single-station sounding map of this pollution transport event on 19 December 2016 (Figure 19) concluded that during this southwesterly wind transport event, when the pollutants were transported to the Liaoning area, two layers of significant inversions appeared vertically above the convergence region, located between 500-462 hPa and 462-429 hPa, respectively. The height of the inversion layer is low, and the air pollution is compressed in the space between the ground and 1000 hPa, which increases the pollution concentration and lasts for an extended period, resulting in heavily polluted weather in the area.
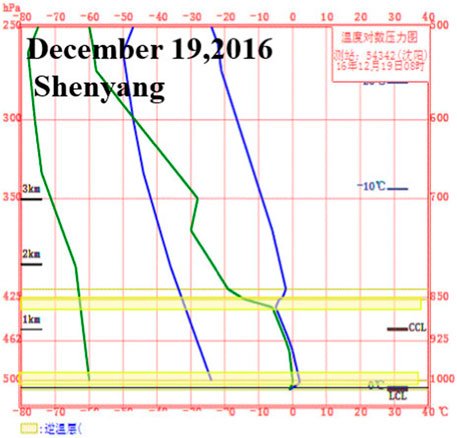
Figure 19. Sounding map of stations in the convergence region at the peak of heavy pollution on 19 December 2016 (the blue line is the temperature contour, the green line is the dew point temperature contour representing humidity, the yellow area is the inversion layer).
Using the HYSPLIT model and NCEP meteorological reanalysis data, Shenyang city (41.9339°N, 123.6836°E) was selected as the model input coordinate point to simulate the trajectory of the air mass (Figure 20). A southwesterly transport corridor appeared at 5,000 m to transport pollutants from Beijing-Tianjin-Hebei region to the Liaoning region on 18 December 2016. However, the 50 m and 500 m did not have prominent transport channels.

Figure 20. Trajectory analysis of the backward flow during pollution transport on 18 December 2016.
The clustering of the simulated effective backward trajectories yields four primary transport paths (Figure 21), consistent with the wind direction trend of this pollution event. As can be seen from Figure 21A, the formation mechanism in the pollution process in December 2016 was the same as that in November 2015. The weather pollution process was dominated by southwestward transport, the southwest wind brought pollutants from the Beijing-Tianjin-Hebei region to the Liaoning region, and at this time there was a clear area of convergence in the horizontal direction of the ground in the Liaoning region. The northeasterly direction also transported the airflow slowly to the Liaoning region, resulting in pollutants in the Liaoning region gathering to a high value of pollution, resulting in heavily polluted weather. In winter, the Shenyang area is in a period of adjustment of atmospheric circulation. Cold and warm air activity is frequent, and there is more windy weather.
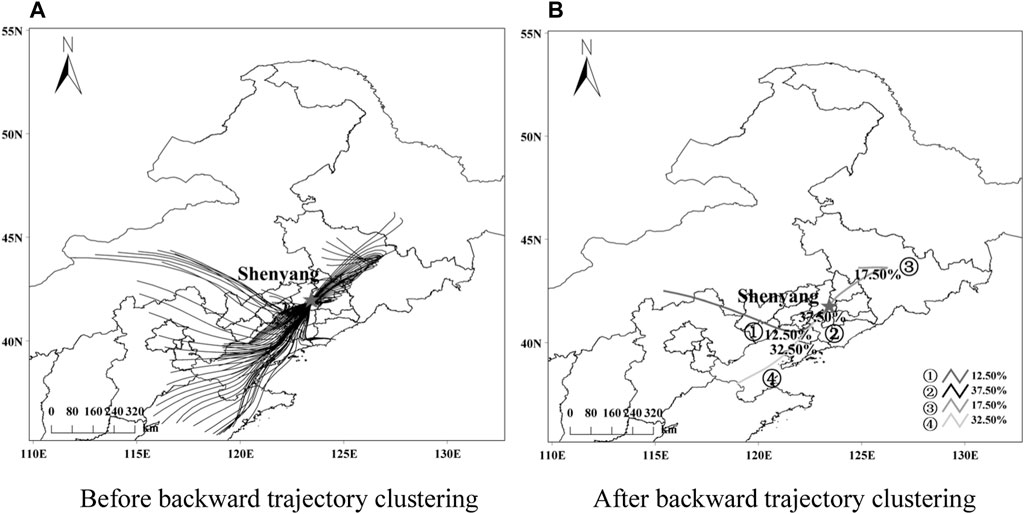
Figure 21. Backward trajectory distribution of the pollution transport process, December 18-20, 2016. [Where (A) is before backward trajectory clustering and (B) is after backward trajectory clustering).
The pollutant mass concentration data were clustered and analyzed after matching the backward trajectories and classified into four categories (Figure 21B). The air pollutant mass concentrations corresponding to the receptor points and the AQI at the corresponding time were calculated and analyzed for each category of trajectories (Table 3). The trajectories from central Liaoning as well as in the direction of Beijing-Tianjin-Hebei (clusters 2 and 4) accounted for the highest proportion of the number of all trajectories in this pollution process, corresponding to similar pollution values of ρ(PM2.5) as well as ρ(PM10), which were also the largest among the four trajectories. The transport of pollutants from central Liaoning was mainly attributed to the northeastern topography of central Liaoning as a gently dipping rectangular southwestward. When external pollutants are transported to the central region, an inversion layer occurs in the central convergence region, leading to pollutant aggregation and increased pollution.
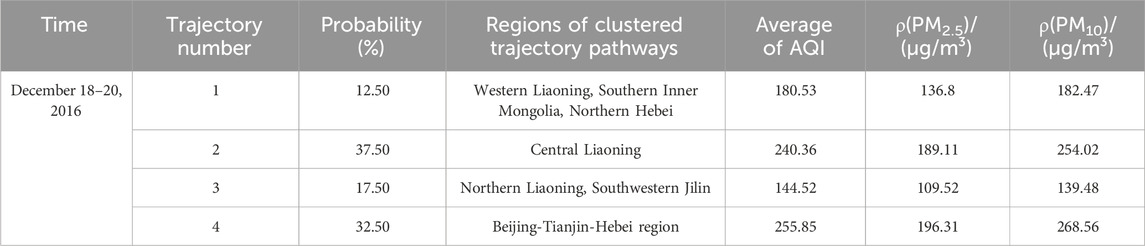
Table 3. Regional characteristics of the clustering of various types of trajectories of the pollution transport process on December 18–20, 2016.
The potential source contribution analysis of this pollution process (Figure 22) shows that the main potential source areas of pollutants are distributed in southwest Liaoning, Beijing-Tianjin-Hebei region, and Bohai Rim region through PSCF analysis (Figure 22A), and this pollution process also has the largest range of the high PSCF area among the three pollution processes. The high CWT area (Figure 22B) is mainly located in the Beijing-Tianjin-Hebei region, which is centered on the Bohai Sea, and contributes more than 200 μg/m3 to the daily mean value of pollutant ρ(PM2.5). Region, contributing more than 200 μg/m3 to the daily mean value of pollutant ρ(PM2.5).
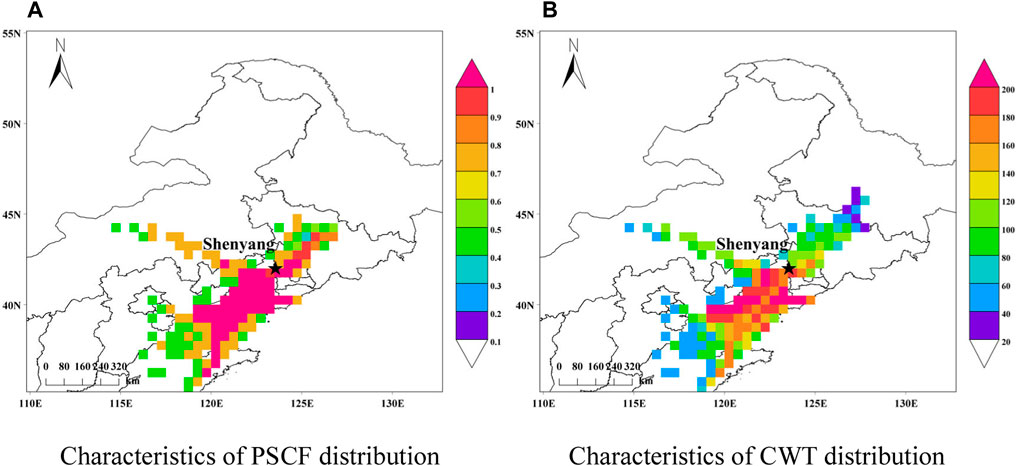
Figure 22. Characteristics of PSCF and CWT Distribution during Pollution Transport from December 18-20, 2016. [Where (A) is characteristics of PSCF distribution and (B) is characteristics of CWT distribution].
(1) The primary sources of pollution in the air pollution process from November 7 to 14, 2015 were the pollutants emitted into the province during the heating period and the transportation of pollutants from outside the province. The sustained and stable northerly winds provided a better impetus for the pollutants from outside the province, resulting in severe fog and haze weather. PM2.5 concentrations in Shenyang reached the second-highest level on record, with levels up to 1479 μg/m3. The sand and dust pollution weather on 3 April 2020, sand and dust mainly originated from the Horqin Desert as well as several desert areas with poor vegetation conditions in the Liaoning region, which was affected by the combined influence of the cyclone and cold fronts, which continued to move towards the Liaoning region, coupled with strong northwesterly winds, which led to the sand, dust, and haze pollution weather process, PM10 concentrations reached a maximum of 1200 μg/m3 during the period. On 18 December 2016, the main source of air pollution in the province was the emissions of pollutants during the heating period and the transportation of pollutants in the Beijing-Tianjin-Hebei region. Heating began in Beijing-Tianjin-Hebei and some surrounding cities, resulting in high-intensity emissions of various pollutants. However, these sustained southwesterly winds coincided with the conditions that led to the emergence of wind. During this time, the weather in the Liaoning region was static and stable, with high humidity and strong inversions. Additionally, early accumulation of pollution made diffusion conditions unfavorable, resulting in visibility of less than 40 m and heavy pollution in Liaoning.
(2) All three air pollution processes occurred against static and stable weather. During the occurrence of the contamination processes, the high altitude of the Liaoning region was always surrounded by a stable westerly latitudinal circulation. The control by the initial high-pressure ridge over 500 hPa gradually moved northward into the southwesterly airflow in front of the trough, which always provided water vapor conditions for the Liaoning region and corresponded to the inverted trough or the weak baroclinic pressure field at the ground, which was very conducive to the occurrence of persistent foggy and hazy weather at the ground level. Moreover, the southwesterly wind at high altitudes corresponds to the weaker easterly and northerly winds at low altitudes. On the ground, and at the same time, there is a better convergence area on the ground, which makes the atmospheric pollutants gather effectively. At the same time, the existence of an inversion layer over the sky is like a “lid” that hinders the vertical diffusion of pollutants, which is also an essential condition for the continuation of foggy and hazy weather. The unfavorable atmospheric environment decreases the capacity of the atmosphere, which also leads to foggy and hazy weather.
(3) Cluster analysis of the backward trajectories of pollutant airflow for the three types of external conveyance showed that airflow trajectories in the northerly direction from the northern Liaoning and Jilin regions, as well as the southwestern part of Heilongjiang, accounted for the largest proportion of the total number of airflow trajectories of the November 2015 pollution process. Its corresponding ρ(PM2.5) as well as ρ(PM10) are the maximum values in this pollution process, with the highest ρ(PM2.5) of 590.56 μg/m³ and ρ(PM10) of 613.81 μg/m³. Airflow trajectories in the northwest direction from northwestern Liaoning, central Inner Mongolia, and eastern Mongolia account for the most significant proportion of the total number of airflow trajectories for the April 2020 pollution process. It corresponds to the highest ρ(PM10) of 155.36 μg/m³. The southwestern trajectories from central Liaoning as well as from the direction of Beijing-Tianjin-Hebei accounted for the highest proportion of the number of all trajectories for the December 2016 pollution process. The results of the PSCF and CWT analyses for each of the three types of pollution processes corroborate each other, and the areas with the highest potential source area contributions were more consistent with the clustered pathway convergence areas. Long-distance pollution transport is now one of the main sources of heavy pollution in the Liaoning region.
The raw data supporting the conclusion of this article will be made available by the authors, without undue reservation.
HS: Data curation, Funding acquisition, Software, Writing–original draft, Writing–review and editing. KR: Data curation, Investigation, Software, Visualization, Writing–original draft, Writing–review and editing. JW: Funding acquisition, Software, Writing–review and editing. ZL: Software, Writing–review and editing. JL: Software, Writing–review and editing. DW: Data curation, Software, Writing–review and editing. YW: Data curation, Software, Writing–review and editing.
The author(s) declare that financial support was received for the research, authorship, and/or publication of this article. This research supported by the National Natural Science Foundation of China (41505120); National Natural Science Foundation of China (41905026); Natural Science Foundation of Jiangsu Province (BK20170945); Talent Start-up Fund of Nanjing University of Information Science and Technology (2016r028); The 63rd Batch of China Postdoctoral Science Foundation in General (2018M631554); The Cultivation of High-level Talents of Jiangsu 333 Project funding; Young Talent foundation of Liaoning Meteorological Bureau (Y201601); Doctoral foundation of Liaoning Meteorological Bureau (D201502).
We sincerely acknowledge the reviewers for their valuable comments and specific guidance, which effectively improved the quality and standard of this manuscript!
The authors declare that the research was conducted in the absence of any commercial or financial relationships that could be construed as a potential conflict of interest.
All claims expressed in this article are solely those of the authors and do not necessarily represent those of their affiliated organizations, or those of the publisher, the editors and the reviewers. Any product that may be evaluated in this article, or claim that may be made by its manufacturer, is not guaranteed or endorsed by the publisher.
Bao, J., and Liang, J. (2023). Analysis of PM2.5 transport routes and sources in key cities of hebei province during dry and wet seasons. Geomatics Spatial Inf. Technol. 46 (10), 50–53+57.
Begum, B. A., Kim, E., Jeong, C. H., Lee, D. W., and Hopke, P. K. (2005). Evaluation of the potential source contribution function using the 2002 Quebec forest fire episode. Atmos. Environ. 39 (20), 3719–3724. doi:10.1016/j.atmosenv.2005.03.008
Chen, Z., Lu, B., Zhang, J., and Biao, Z. (2019). Analysis of a pollution process in central Liaoning caused by spring straw burning. Environ. Prot. Circular Econ. (02), 70–74. doi:10.16803/j.cnki.issn.1004-6216.2016.06.018
Dian, Li, Chuandong, X., and Chong, L. (2023). Comparative analysis of wind profile radar observation results of two heavy pollution weather processes in Shenyang [J/OL]. Environ. Prot. Sci. 1-10. doi:10.16803/j.cnki.issn.1004-6216.202303017
Dorling, S. R., Davies, T. D., and Pierce, C. E. (1992). Cluster analysis: a technique for estimating the synoptic meteorological controls on air and precipitation chemistry—method and applications. Atmos. Environ. Part A General Top. 26 (14), 2575–2581. doi:10.1016/0960-1686(92)90110-7
Fang-jian, X. I. E., Xin-mei, Z., Tao-tao, D. O. U., Feng, Y., Chun-lei, L. I. U., Jie, L. I., et al. (2023). Transport influence and potential sources of PM2.5 pollution for nanjing. Environ. Sci. 44 (6), 3071–3079. doi:10.13227/j.hjkx.202206256
Gao, C., Zhang, Ke, Zang, S., Zhang, L., and Sun, Li (2021). Transportation pathways and potential sources of air pollutants in Harbin city. Environ. Sci. Technol. 44 (05), 162–170. doi:10.19672/j.cnki.1003-6504.2021.05.022
Hou, Y., Fangshu, X. U., Zhang, R., Zhao, M., and Huiqing, MING (2017). Meteorological causes of a regional persistent fog and haze event in liaoning. Meteorological Sci. Technol. | Meteorol Sci Technol 45 (04), 710–716. doi:10.19517/j.1671-6345.20160451
Jiang, H., and Duan, K. (2020). Analysis of seasonal primary pollutants and their potential source areas of Xi’an in 2017 based on HYSPLIT model. J. Lanzhou Univ. Med. Sci. 56 (02), 243–252. doi:10.13885/j.issn.0455-2059.2020.02.013
Jiang, Z., Pang, W., and Chen, Q. (2022). Case study on potential sources of air pollutants over ganjiang new district based on PSCF and CWT methods. Meteorology Disaster Reduct. Res. 45 (03), 216–224.
Jiaxuan, L. (2020). Influence of motor vehicle exhaust and coal combustion on Chinese hlaze. Guangzhou Chem. Ind. 48 (14), 120–122.
Jie, X. (2021). Study on the source distribution of ozone pollution in Jinzhou City based on backward trajectory modeling. Agric. Technol. 41 (03), 105–107. doi:10.19754/j.nyyjs.20210215032
Li, T. Y., Deng, X. J., Li, Y., Song, Y., Li, L., Tan, H., et al. (2018). Transport paths and vertical exchange characteristics of haze pollution in Southern China. Sci. Total Environ. 625 (JUN.1), 1074–1087. doi:10.1016/j.scitotenv.2017.12.235
Lin, Li, Gao, X., and Su, H. (2019). Characteristic analysis of a wide range haze in liaoning. J. Shenyang Aricultural Univ. 50 (03), 266–272.
Liu, Y., Jia, Z. H., and Su, H. (2021). “Heavy pollution weather statistics and backward trajectory analysis for summer 2014-2018 in Shenyang,” in Proceedings of the 2021 Annual Scientific and Technical Conference of the Chinese Society for Environmental Science (I), 10. doi:10.26914/c.cnkihy.2021.034965
Liu, Y., Wang, D., and Jia, Z. H. (2022). “Analysis on meteorological conditions of A heavy air pollution in Shenyang in november 2014,” in Proceedings of the 2022 Annual Scientific and Technical Conference of the Chinese Society of Environmental Sciences--Environmental Engineering Technology Innovation and Application Session (II), 8. doi:10.26914/c.cnkihy.2022.026858
Liu, H., Ying, W., Si-tong, W., Yang, L. I. U., and Bo, L. I. (2021). Study on the transport path of particles in Tianshui City based on HYSPLIT4 model. China Environ. Sci. 41 (8), 3529–3538. doi:10.19674/j.cnki.issn1000-6923.20210331.018
Meina, L., and Zhang, L. (2014). Haze in China: current and future challenges. Environ. Pollut. 189, 85–86. doi:10.1016/j.envpol.2014.02.024
Peng, W., Yun-dan, L. I., Kang, N., Zhu, B., and Xing-na, Y. U. (2021). Characteristics and comparative of typical haze weather during autumn and winter in the Yangtze River Delta. China Environ. Sci. 41 (7), 3043–3054. doi:10.19674/j.cnki.issn1000-6923.20210315.006
Pu-hui, R. E. N., Jing-fang, X. I. E., Hong-jin, J., Shu-nan, W., and Rui-qing, L. I. U. (2019). Transport p athways and p otential s ources of PM2.5 in different seasons in Taiyuan city. China Environ. Sci. 39 (8), 3144–3151. doi:10.19674/j.cnki.issn1000-6923.2019.0371
Qi, Y., Xiang, W., and Chen, Z. (2022). Impacts of low level ventilation and temperature inversion on air quality in Sichuan Basin. Acta Sci. Circumstantiae 42 (3), 322–333. doi:10.13671/j.hjkxxb.2021.0307
Shi-min, W. E. I., Xin-yuan, F., Shi-gong, W., and Zheng-Zi, Z. (2021). Characteristics of multi-layer inversions in Sichuan Basin and their influences on air pollution. China Environ. Sci. 41 (3), 1005–1013. doi:10.19674/j.cnki.issn1000-6923.2021.0112
Su, B., Ju-yang, X. U., Ruo-yu, Z., and Xian-Xin, J. (2014). Influence of atmospheric transport on air pollutant levels at a mountain background site of east China. Environ. Sci. 35 (08), 2871–2877. doi:10.13227/j.hjkx.2014.08.005
Wang, J., Ren, K., Su, H., Zhou, C., and Wang, X. L. Y. (2024). Analysis of air quality changes and causes in the Liaoning region from 2017 to 2022. Front. Environ. Sci. 12, 1344194. doi:10.3389/fenvs.2024.1344194
Wu, Z., Liu, L., and Duan, Y. (2023). Temporal distribution characteristics and potential sources analysis of air pollutants in linfen. Environ. Monit. China 39 (02), 95–106. doi:10.19316/j.issn.1002-6002.2023.02.10
Xiangde, Xu, Zhou, Li, Xiuji, Z., Peng, Y., Weng, Y., Shuwang, T., et al. (2004). Peripheral source influence area for heavy air pollution processes in the urban environment. Sci. China Ser. D-Earth Sci. (10), 958–966.
Yan, C., Jiang, W., Guo, W., Miao, S., Chen, X., Ji, C., et al. (2005). Study on the effect of the city group development in Pearle River Delta on local air pollutant dispersion by numerical modeling. Acta Sci. Circumstantiae (05), 700–710. doi:10.13671/j.hjkxxb.2005.05.023
Yan-jun, L. I., Xing-qin, A. N., and Guang-zhou, F. A. N. (2019). Transport pathway and potential source area of atmospheric particulates in Beijing. China Environ. Sci. 39 (3), 915–927. doi:10.19674/j.cnki.issn1000-6923.2019.0110
Yannan, H. U., Kai, M., Yuling, Y., Cuiping, M. A., Wenxing, L. I., and Zhichun, M. A. (2023). Analysis of PM2.5 transport characteristics and emission reduction effects of different weather types in the Beijing-Tianjin-Hebei region from 2015 to 2018. J. Meteorology Environ. 39 (4), 114–121.
Yao, Q., Jin-le, L. I. U., Zi-ying, C. A. I., Su-qin, H. A. N., and Zhi-qiang, M. A. (2018). Atmospheric stability and inverse temperature characteristics of Tianjin and its effect on PM2.5 pollution. China Environ. Sci. 38 (8), 2865–2872. doi:10.19674/j.cnki.issn1000-6923.2018.0301
Yawei, Yu, Su, H., Meng, Z., Zhou, C., and Yanhui, X. (2016). Weather conditions analysis of a wide range fog and haze in Liaoning. J. Guizhou Meteorology 40 (05), 46–50.
Keywords: long-distance pollution transport, wind convergence, HYSPLIT trajectory model, PSCF method, CWT method
Citation: Su H, Ren K, Wang J, Lu Z, Lu J, Wang D and Wang Y (2024) Comparative analysis of multi-directional long-distance pollution transport effects on heavily polluted weather in the Liaoning region. Front. Environ. Sci. 12:1382233. doi: 10.3389/fenvs.2024.1382233
Received: 05 February 2024; Accepted: 10 April 2024;
Published: 30 April 2024.
Edited by:
Swadhin Kumar Behera, Japan Agency for Marine-Earth Science and Technology (JAMSTEC), JapanReviewed by:
Sijia Lou, Nanjing University, ChinaCopyright © 2024 Su, Ren, Wang, Lu, Lu, Wang and Wang. This is an open-access article distributed under the terms of the Creative Commons Attribution License (CC BY). The use, distribution or reproduction in other forums is permitted, provided the original author(s) and the copyright owner(s) are credited and that the original publication in this journal is cited, in accordance with accepted academic practice. No use, distribution or reproduction is permitted which does not comply with these terms.
*Correspondence: Jinhu Wang, Z29sZHRpZ2Vyd2FuZ0BudWlzdC5lZHUuY24=
Disclaimer: All claims expressed in this article are solely those of the authors and do not necessarily represent those of their affiliated organizations, or those of the publisher, the editors and the reviewers. Any product that may be evaluated in this article or claim that may be made by its manufacturer is not guaranteed or endorsed by the publisher.
Research integrity at Frontiers
Learn more about the work of our research integrity team to safeguard the quality of each article we publish.