 Hongmei Shao
 Meifeng Yu
 Mengjie Xia
 Dan Yu
 Fuyang Gao2*
94% of researchers rate our articles as excellent or good
Learn more about the work of our research integrity team to safeguard the quality of each article we publish.
Find out more
ORIGINAL RESEARCH article
Front. Environ. Sci., 15 July 2024
Sec. Environmental Economics and Management
Volume 12 - 2024 | https://doi.org/10.3389/fenvs.2024.1382083
This article is part of the Research TopicGreen Finance & Carbon Neutrality: Strategies and Policies for a Sustainable FutureView all 35 articles
As the proportion of household carbon emissions to global carbon emissions continues to increase, reducing carbon emissions from household consumption has become an important way to achieve the goals of carbon peaking and carbon neutrality. How the trend of miniaturization of household size will affect household carbon emissions is a matter of concern. This paper uses a sample of 9,090 households from the China Family Panel Studies (CFPS) database in 2018 to empirically study the impact of changes in household size on household carbon emissions, from the perspective of household consumption structure and urban-rural areas. The research results indicate that the miniaturization of household size will increase household carbon emissions, the impact of household size on indirect HCEs is greater than on direct HCEs. The impact of household size on indirect HCEs is heterogeneous in consumption structure and the impact of household size on indirect HCEs from housing, transportation is greater than that of other consumption items. The impact of household size on urban household carbon emissions is greater than that in rural areas. The upgrading of household consumption structure and the miniaturization of household size promote the increase of HCEs jointly. Therefore, this paper proposes that under the trend of household miniaturization, energy-saving and emission reduction policies should focus on reducing indirect households carbon emissions, optimizing household structure and household consumption structure, enhancing environmental awareness among family members, establishing and improving the green consumption system, and building environment-friendly households.
Global warming and environmental pollution have become severe issues facing humanity. Scientists have identified the primary cause of global climate warming as greenhouse gas emissions, with carbon dioxide being the major component (Hardee and Mutunga, 2010). Reducing carbon emissions is essential to address this problem. Many countries have taken actions to mitigate carbon emissions and committed to achieving carbon neutrality. Traditionally, government-implemented carbon reduction measures have primarily targeted the supply-side sectors, such as the industrial sector, which consumes a significant portion of energy. However, with economic and social development, increasing research indicates that a substantial proportion of carbon emissions is attributed to household consumption. Therefore, demand-side measures should receive more attention in mitigating climate change (Liu et al., 2003). In particular, the household sector plays a crucial role in carbon reduction (Nejat et al., 2015; Ivanova et al., 2016; Klemes et al., 2021; Goldstein, 2022). The household size miniaturization has become a global demographic development, profoundly affecting production and lifestyles, which in turn impacts the environment (Liu et al., 2003; Wang, 2015).
Research on household carbon emissions originates from the relationship between demographic factors and energy consumption and carbon emissions (Jiang L W, 2011). Studies on demographic factors and carbon emissions are primarily based on the IPAT formula (Paul Ehrlich and John Holdren, 1971) and the stochastic form of the STIRPT model (York et al., 2003), expanding population factors from population size (Shi, 2003; Baige, 2010; Peng Xizhe, 2010) to include demographic structure factors (Jiang, 2010), such as population aging (Nan et al., 2011) and urbanization (Satterthwaite, 2009). Some scholars have also focused on household-level impacts (Dalton et al., 2008). However, these studies analyze the impact of household changes on carbon emissions from a macro perspective, failing to delve into how changes in household characteristics affect the environment. Households, as units of population analysis influencing carbon dioxide emissions, may be more effective than individuals, especially in developing countries (Jiang, 2010). From the household perspective, carbon emissions can be measured through household consumption behavior. Household carbon emissions are mainly influenced by household structural characteristics and consumption behavior (Bin and Dowlabdi, 2005). Household carbon emissions result from consumption behavior, and household characteristics and socioeconomic traits influence consumption patterns, which in turn affect household carbon emissions (Büchs M, 2013; Xu et al., 2016). Key household characteristics include household income (Weber and Matthew, 2008; Suling Feng et al., 2023), household size (Ivanova, Büchs, 2020), household head’s educational level (Janaki Imbulana Arachchi, 2022; Zhang, 2023), energy structure (Nair et al., 2019), and geographic location (Yu et al., 2023).
Household size is a significant demographic characteristic and an important factor affecting household carbon emissions. The impact of household size on carbon emissions primarily stems from household economies of scale (Ellsworth-Krebs, K., 2020; Shiwang et al., 2023). Economies of scale in households mean that members share household space, basic facilities (appliances, tools, and equipment), and other consumer goods (Ivanova, Büchs, 2020). As household size increases, per capita living costs decrease while maintaining the same living standard (Deaton A S, 1998). Therefore, as household size decreases, the economies of scale at the household level diminish, potentially increasing per capita energy consumption (Jiang, 2010; Wang, 2015; Milena Büchs, 2022; Zhang, 2023).
Different consumer goods have different economies of scale, depending on the composition of household members (Thaiyoong, 2011). Current research on these issues mainly explores income and consumption levels (Wang, 2015), neglecting the impact of changes in consumption structures. Some studies have noted the influence of consumption structures on carbon emissions (Wei et al., 2007; Weber and Matthews, 2008; Xu and Han, 2017), but they do not analyze household characteristics. Some scholars analyze the impact of household size on direct and indirect carbon emissions, suggesting that the negative impact of household size on indirect carbon emissions is greater than on direct carbon emissions (Zhang, 2022; Cong et al., 2023; Meng, 2023). Hongwu Zhang et al. (2020) argues that over time, the lifestyles of different social strata are becoming increasingly carbon-intensive, recommending that climate change research and policy-making consider the growing impact of lifestyles. Han et al. (2023) points out that with increasing household incomes, consumption structures change, with a lower proportion spent on food and higher proportions on transportation, communication, and housing, leading to higher household carbon emissions. The impact of household size on carbon emissions from food, transportation, communication, and housing consumption warrants further discussion.
China is a major emitter of carbon and has a large population. Despite leading the global clean energy economy, China’s carbon dioxide emissions and per capita emissions continue to grow, with an increase of approximately 565 million tons in 2023, making China’s per capita emissions 15% higher than those of developed economies (IEA, 2023). In 2020, to address global climate challenges, the Chinese government committed to achieving peak carbon emissions by 2030 and carbon neutrality by 2060. With rapid income growth, household consumption in China has become the second-largest energy-consuming sector after the industrial sector (Qu Jiansheng, 2014). Over 70% of household consumption expenditure occurs within the household sector (Liu et al., 2011), making household consumption a significant source of carbon emissions in China (Sun, 2022). In 2022, China’s population showed negative growth, while the aging of the population continued to deepen. China’s population aged 60 and over was 280 million, accounting for 19.8% of the national population, of which 210 million were aged 65 and over, accounting for 14.9% of the national population (China’s National Bureau of statistics, 2023). The accelerating process of population aging has led to the increasing number of empty nest families. Receiving higher education and the pressure of working and living lead to more young people marrying and having children late. The postponement of the first marriage age and the increase of the interval between first marriage and first childbirth have increased the proportion of single person households and two person households. The aging of the population and the expansion of population mobility have increased the proportion of empty nest families and families living alone. Low birth rate, population aging, urbanization, rising divorce rate and other factors jointly promote the continuous shrinking of household size in China (Wang and zhou, 2021). According to the seventh national census, the average household size in China decreased from 5.3 members in the 1950s to 3.1 in 2010 and 2.62 in 2020. The number of households has steadily increased, reaching 494,157,423 in 2020, an increase of 92.64 million from 2010. Over 125 million households are single-person households, accounting for 25.4% of total households, while two-person households account for 29.7%, and three-person households account for 21% (National Bureau of Statistics, 2021). The significant shrinking in household size and changes in household consumption patterns in China raise questions about their impact on household carbon emissions, an important issue for achieving carbon reduction and carbon neutrality goals.
Yu et al. (2023) used data of Jiangsu Province from 2015–2019 to find a negative correlation between household size and per capita HCEs in China. Yimeng Zhang and Zhang (2023) analyzed urban household data from 1992–2012 to examine the impact of household structural changes on carbon emissions. The former uses provincial data, while the latter only uses micro data of urban households. These recent studies on China focus on the relationship between household size and per capita household carbon emissions, analyzing the differences between direct and indirect carbon emissions but not from the perspective of consumption structure. The novelty and contribution of this study is as follows: (1) this study uses the GFPS data in 2018. The GFPS database covers the whole country, including urban families and rural families, which is more representative. (2)With economic development and rising income levels, household consumption patterns in China have shifted from survival-based to development-based and enjoyment-based, potentially increasing household carbon emissions (Zhang, 2020; Han et al., 2023). This study explores the impact of household size on household carbon emissions from the perspective of household consumption structure, comparing differences in eight categories of household consumption expenditure: food, clothing, housing, household goods and services, transportation and communication, education, culture and entertainment, healthcare, and other goods and services. The study examines whether smaller households exhibit high carbon emission consumption patterns. (3)Additionally, considering the inequality in development between urban and rural areas in developing countries, the study analyzes the disparity in household carbon emissions between urban and rural households, exploring whether the miniaturization of household size and urbanization in China exacerbates this inequality. This study comprehensively analyzes the impact of household size on household carbon emissions, as well as the heterogeneity of urban and rural areas and consumption structure, which helps to formulate more targeted and differentiated household carbon emission reduction strategies.
Household carbon emissions (HCEs) have been widely discussed. Existing studies mainly focused on the quantitative assessment of household carbon emissions, sources, and analysis of key influencing factors.
The measurement of household carbon emission is the basis of this study. and the HCEs refer to CO2 emissions caused by residents’ living consumption (Mi et al., 2020) and transportation (Fan et al., 2022) in household life. HCEs can be divided into direct and indirect HCEs (Bin and Dowlatabadi, 2005; Wei et al., 2007; Wang et al., 2019). Estimation of HCEs is generally carried out by this classification (Sun Y, 2022). Direct HCEs refer to direct household energy consumption, such as coal, natural gas, and other resources consumed by lighting, electrical appliances, cooking, and private transportation activities (Santill’ an et al., 2021). Indirect HCEs refer to CO2 generated in the production process of electricity, food, clothing and daily necessities, household equipment, transportation, and entertainment services (Liu et al., 2019).
The input-output method (IOM), consumer lifestyle approach (CLA), IPCC inventory method (IPC-RA) and life cycle assessment (LCA) are the main methods to measure HCEs (Zhang et al., 2015). Input-output method mainly evaluates indirect carbon emissions from macro-statistical data or micro-survey data of various countries and regions (Hereundeen and Tanaka, 1976; Weber and Perrels, 2000; Zhang Q.J. et al., 2019). But there is a lag in calculating carbon emissions by this method, which can lead to situations where the emissions accounting is impossible because of the incomplete input-output tables for some years (Wang et al., 2019). The consumer lifestyle approach typically calculates indirect carbon emissions from household consumption by multiplying household consumption expenditure by the IOM emission coefficients (Bin and Dowlatabadi, 2005; Fan and Wang, 2014; Xu X et al., 2016; Hu Z. et al., 2020). For IPCC inventory method, it uses macro statistics or micro-survey data from various countries, regions, and provinces and cities to directly assess carbon emissions (Ma X.W. et al., 2015; Li N. N. et al., 2022). This method is a commonly used approach by most scholars for measuring direct household carbon emissions. However, there is a significant difference in the carbon emission coefficients for the same energy source due to the inconsistency in energy production levels across different regions, leading to a certain deviation from the actual situation (Liu et al., 2013). The life cycle assessment calculate the greenhouse gas emissions generated throughout the entire lifecycle of products and services (Nissinen et al., 2006). LCA provides precise measurement results, but its requirement for more accurate data also makes it challenging to measure carbon emissions on a large scale (Li et al., 2015; Miehe et al., 2016).
Existing research on the factors influencing HCEs primarily focuses on two aspects: household demographic characteristics and consumption patterns. Different household characteristics lead to varied household consumption decisions, thereby affecting the household carbon footprint (Bin and Dowlatabadi, 2005). Household characteristics that significantly influence HCEs include household size, income, household member composition, gender of the head of household, education level, and the location of the family’s housing. Consumption factors affecting household carbon emissions are mainly derived from family income, savings, and consumption patterns. There are also studies that analyze the impact from the perspective of the family’s material foundation and lifestyle, such as housing and transportation (Xue Y.Z.,2020; Meng X.Z.,2023; Dusan Gordic, 2023). In general, scholars investigate the factors of HCEs based on specific attributes of the family (Xiang H.L., 2022).
Household income is a prominent factor affecting household carbon emissions (Wang 2015; Wang et al., 2018; Cao et al., 2019). The IPCC report in 2022 revealed that households in the top 10% of income contribute 36%–45% of global GHG emissions (IPCC et al., 2022). Household income levels influence consumption levels, and there is a positive correlation between income levels and household carbon emissions. Sumita Nair et al. (2019) conducted a study focusing on energy, transportation, and petroleum and natural gas consumption related to direct carbon emission activities and concluded that there is a positive correlation between household income and direct carbon emissions. Weber and Matthews (2008) found that carbon emissions are mainly concentrated in consumption for basic needs for low-income families, and as income levels rise, the proportion of carbon emissions associated with higher-level consumption categories, such as entertainment, also increases. Affluent families have greater consumption power and higher demand for goods and services, leading to more indirect carbon emissions (Zheng et al., 2020; Hartono, 2023). The household carbon footprint is also related to family wealth (Zhao et al., 2023; Su L.F., et al., 2023). Possessing a house enhances a family’s wealth, which in turn raising the consumption level and consequently increasing household carbon emissions (Ying et al., 2023). In addition, some studies also suggest a negative correlation between the highest income levels and HCEs (Sharma et al., 2021). Although researchers’ conclusions may vary, they all reveal the significant impact of household income on HCEs. Therefore, incorporating household income into this study will help to understand the combined carbon emission effects of household size and income, and assist governments in formulating more accurate carbon reduction policies.
It is generally believed that education level shows a negative correlation with both household energy use and carbon emissions (Golley et al., 2008; Brand et al., 2013). Education has a positive impact on HCEs (Yi et al., 2007; Büchs and Schnepf, 2013). Individuals with higher levels of education may be more eager to achieve a higher quality of life and prefer to consume modern energy sources (Li S.C.,2020). They often have a greater awareness of energy conservation, which can reduce HCEs, and are more willing to engage in green consumption and transportation (Yu et al., 2023). However, another previous study indicates that the higher the education level of the population, the more diversified and higher the demand, leading to more HCEs (Li et al., 2019). Increased levels of education are typically associated with higher earnings, leading to an increase in disposable income for households. As a result, the higher the quality of life within a household, the higher the carbon emissions (Han et al., 2023). These studies highlight the significant role of education in HCEs, as well as the importance of strengthening energy-saving, low-carbon, and environmental education.
The age of residents has a significant impact on energy consumption and HCEs. Murray and Mills (2011) suggested that HCEs in the US are correlated with the age of residents. Studies have indicated that the aging characteristics of household populations can reduce HCEs (Yu et al., 2022). Shaped by traditional culture, the elderly tend to have a lower propensity to consume and a stronger sense of thrift, which helps to reduce HCEs (Tong and Zhou, 2020). Besides, Mehmood et al. (2021) found that the seniors age group ≥65 were responsible for the highest HCEs in India. The older people prefer to use traditional and less energy efficient way to meet heating and entertainment demand, rather than the smart and energy saving appliances. Compared with younger adults, older people spend more time at home and need more energy to support their daily lives, which leading to more HCEs (Yagita and Iwafune, 2021). Sun and Lu (2023) believe that the increase in the elderly population exacerbates carbon emissions from healthcare, but overall it leads to a reduction in carbon emissions in other consumer activities. Different age groups have an impact on HCEs in different ways, such as consumption structure level and labour force level, which are complex and diverse (Yu et al., 2023).
Household size is an important factor affecting HCEs. Large families typically have more consumption expenditure than smaller families, while larger families can benefit from scale effects, which means a sharing mechanism can lead efficient use of goods and services in multi-person households and reduce carbon emissions per capita (Yates, 2018). Household members share electrical appliances, tools and equipment, cook together, cool and heat common living spaces and require less individual living space (Ivanova and Büchs, 2020). Empirical studies have shown that smaller households have higher per capita HCEs (Lyons et al., 2012; Qu et al., 2013; Underwood and Zahran, 2015; Ala-Mantila et al., 2014; Underwood and Fremstad, 2018; Ellsworth Krebs, 2020; Guo et al., 2022; Yu S.W. et al., 2023). The trend of declining family members in industrialized countries may undermine the benefits from intra-household sharing (Schroder et al., 2015). Hu Z. (2018) analyzed the carbon emissions of Japanese households from 2001 to 2011 and concluded that Japanese household size inhibited the average carbon emissions. Conversely, some studies argue that household size promotes HCEs (Sun Y., 2022; Zhao et al., 2023). If the total population of a region remains stable but family size shrinks, with each family’s basic consumption unchanged, this would lead to an increase in HCEs (Shang et al., 2021). Scholars further analyze the impact of household size on direct and indirect HCEs and suggest that the household size increases indirect HCEs (Yu et al., 2022; Meng et al., 2023). Zhang Y.M. (2022) find that household size in Chinese cities has expressed a significant negative effect on indirect per capita HCEs, which was much larger than that on direct HCEs.
In 2022, China experienced a negative population growth. Factors such as low birth rates, aging of population, urbanization, and a rising divorce rates have collectively contributed to the continuous reduction in the size of Chinese households (Wang and Zhou, 2021). The acceleration of the aging process has led to a rise in the number of empty-nest families. Pursuing higher education and work-related pressures have resulted in more young people marrying and having children at a later age. Additionally, delays in the age of first marriage and the increased interval between first marriage and first childbirth have both contributed to an increase in the proportion of one-person and two-person households. The aging of the population and the mobility of population have raised the proportion of empty-nest and single-person households. As a result, these families show reductions in both direct and indirect carbon emissions because they experience income insecurity (empty-nest families, etc.) or youth phase (single-person families and Dink families) that they are unable or unwilling to follow the traditional living pattern.
The urban-rural attribute of households has a significant positive effect on household carbon emissions (Sun Y, 2022). Urban household carbon emissions are generally higher than those in rural households (Fan et al., 2021). The urbanization process has varying impacts on direct and indirect HCEs (Li et al., 2015). There are obvious differences between urban and rural areas in terms of economic development, population structure, and consumption patterns, and the core factor affecting the differences in per capita carbon emissions is per capita income (Zhou et al., 2020; Feng et al., 2023). However, current research tends to focus on the accounting of HCEs from either urban or rural areas, neglecting comparative analysis of HCEs from urban and rural household consumption (Li and Wang, 2021).
Limited to availability of data, most scholars study the driving factors of HCEs from a macro perspective, neglecting the effects of micro households’ characteristics. The latest research prefers to analyze the impact of household size on HCEs, direct and indirect HCEs, and explore how household size affects the emissions under different income and education levels, but without focusing on the differences under disparate household consumption patterns. As a developing country, there is an imbalance in urban and rural development in China. Moreover, with economic development and income improvement, China’s household consumption level increases while the consumption structure changes from survival type to development and enjoyment type, which may increase household carbon emission (Zhang et al., 2020; Han et al., 2023).
This paper explores the regional characteristics of HCEs based on micro-level data of the 2018 China Family Panel Studies (CFPS), which covers the whole country and adopts probability sampling method. On the one hand, it analyzes the disparity in carbon emissions between urban and rural households and explores whether the trend of household size reduction and urbanization process will deepen urban-rural inequality in China. On the other hand, it analyzes whether the households of smaller size have a high-carbon consumption pattern by comparing the differences in the impact of eight categories of household consumption expenditure items, including food, clothing, housing, living supplies and services, transportation and communication, education, culture, and entertainment services, medical care, and other supplies and services. This paper conducts an in-depth analysis of the correlation between household size and HCEs from a structural perspective, providing targeted and differentiated strategies and suggestions for effectively achieving household carbon reduction in the context of the continuous reduction of household size in China, and contributing to the realization of China’s “carbon peaking and neutrality” strategy and green development.
The impact of household size on HCEs is reflected in two aspects: economies of scale within households and changes in the number of households. On one hand, households experience economies of scale, which reduce per capita HCEs. Although larger households typically have higher overall consumption expenditures compared to smaller households, resource sharing among household members can lead to cost savings and efficiency improvements. This scale effect can reduce per capita carbon emissions (Yates, 2018). As household size increases, members can share energy and electrical appliances such as lights, televisions, computers, and washing machines, thus reducing energy waste and redundancy, and improving energy use efficiency (Ellsworth-Krebs, 2020). Sharing appliances, tools, and equipment, cooking together, and jointly heating and cooling shared living spaces reduce the need for individual living spaces (Ivanova and Büchs, 2020). Larger households can also develop shared lifestyles and consumption habits, such as using transportation collectively, thereby reducing individual carbon emissions and the household’s carbon footprint (Underwood and Fremstad, 2018). A decrease in household size can undermine the benefits of internal sharing (Schroder et al., 2015). The trend towards smaller household sizes impacts the resource-sharing effect within households, generally increasing per capita consumption. For instance, the sharing degree of residential consumption is typically high, and the reduction in household size likely increases per capita residential consumption expenditure (Cao et al., 2019). On the other hand, with a constant population size, a decrease in household size implies an increase in the number of households. If the basic consumption per household remains unchanged, this will lead to an increase in household carbon emissions (Shang Mei, 2021). A significant manifestation of the shrinking household size in China is the rise in the proportion of one-person and two-person households. These households need to purchase more durable goods to meet the needs of their members, indirectly leading to additional energy consumption and carbon emissions. For example, divorces result in two separate households, further increasing consumption in areas like housing, home appliances, and transportation, which generates additional household carbon emissions, even surpassing the carbon emission increase from newborns (UNFPA, 2009). In summary, household size primarily affects household carbon emissions through economies of scale and sharing mechanisms that influence consumption patterns. Based on this, the following research hypotheses are proposed.
Hypothesis 1:. Household size has a negative impact on per capita HCEs.
Household size affects HCEs through scale effect, Therefore, the impact of household size on direct and indirect HCEs also has a scale effect. Thaiyoong and Maclean (2011) believes that different consumer goods have different scale effects. For example, when a young person leaves his or her parents to live alone, he or she will incur consumption expenses such as renting a house (or buying a house), buying a car, purchasing household appliances and household commodities. New energy consumption such as lighting and heating will increase direct carbon emissions, while new residential and transportation consumption will increase indirect carbon emissions. Because the demand for housing and transportation has a larger carbon emission coefficient (Qu Jiansheng, 2012; Xiang Huali, 2022), compared with the increase of direct carbon emissions caused by lighting and heating, indirect carbon emissions increased more. It means that the scale effect of indirect carbon emissions is greater than that of direct carbon emissions. Some scholars have pointed out that the impact of household size on indirect HCEs is greater than on direct HCEs (Yu et al., 2022; Meng et al., 2023; Zhang et al., 2023). Therefore, this study proposes the hypothesis 2.
Hypothesis 2:. Household size has a negative impact on direct and indirect HCEs, the impact of household size on indirect HCEs is greater than on direct HCEs.
This study further argues that the eight categories of consumer goods that generate indirect HCEs have different scale effect. As household income increases, the household consumption structure also changes, showing a decrease in the proportion of food consumption and an increase in expenditures on transportation, communication, and housing (Han Jun 2023). Different consumption types have varying carbon emission coefficients, with housing having a high emission coefficient (Qu Jian sheng, 2012). Increased housing expenditures will raise household carbon emissions. Household lifestyles are becoming increasingly carbon-intensive (Zhang et al., 2020). Different household sizes have varying proportions of consumption types in their overall consumption, leading to differences in the carbon emission structures among different household sizes (Qinchi, 2015). Xinkuo and Han (2017) found that food, clothing, housing, and communication consumption significantly contribute to urban household carbon emissions in China, and income growth and smaller household sizes mainly increase carbon emissions through these types of consumption. Therefore, this study proposes the hypothesis 3.
Hypothesis 3:. The impact of household size on indirect HCEs is heterogeneous in consumption structure and the impact of family size on indirect HCEs from housing, transportation is greater than that of other consumption items.
China, as a developing country, exhibits a dual urban-rural structure. Concurrently, China’s rapid urbanization process has increased the urbanization rate from 36.22% in 2000 to 63.89% in 2020. The combined effect of urbanization and shrinking of household size on HCEs is worth exploring. There are significant differences between urban and rural areas in population structure, economic development, per capita income, and consumption patterns (Zhou et al., 2020; Feng et al., 2023). Income levels and consumption structures are major factors causing differences in carbon emissions between urban and rural households (Zhang et al., 2019). Urban households generally have higher income and consumption levels than rural households, leading to higher carbon emissions in urban households (Fan et al., 2021). On one hand, rapid urbanization leads to a massive influx of rural populations into cities, with infrastructure development increasing carbon emissions (Satterthwaite, 2009); on the other hand, urban consumption levels are higher, with stronger consumption capabilities, more diverse consumption choices, and more integrated consumption patterns, continuously increasing urban household energy consumption. Therefore, this study proposes the hypothesis 4.
Hypothesis 4:. The impact of household size on urban household carbon emissions is greater than that in rural areas.
The data of this research comes from the family economy and relationship databases of China Family Tracking Survey (CFPS) database. The survey, conducted by the China Social Science Survey Center of Peking University, takes households as a sample, and adopts the probability sampling methods of proportional population size, implicit stratification and multi-stage, which has certain authority. According to the research content, this paper selects the household consumption expenditure items such as clothing, food, shelter, transportation, and energy in the database to calculate HCEs. After cleaning, the data of 9,090 households in 2018 were finally selected.
In the Kyoto Protocol, an international agreement, there are six kinds of greenhouse gases to be controlled, including carbon dioxide, methane, etc. The emissions of these gases are called carbon emissions (IPCC, 2014). However, due to the largest proportion of carbon dioxide emissions in daily life, carbon dioxide emissions are regarded as carbon emissions, so this paper takes carbon dioxide emissions as carbon emissions, and the total carbon dioxide emissions generated by various consumption behaviors in households are called HCEs. HCEs can also be divided into direct and indirect HCEs according to their sources. Direct HCEs come from the use of main cooking fuel, electric energy, and heat energy, while indirect HCEs come from eight categories of consumption expenditure.
Refer to the calculation method of Sun Yue (2022), direct household consumption carbon emission is the sum of household fuel carbon emission, electricity carbon emission and heating carbon emission. This paper uses the IPCC inventory method to estimate direct carbon emissions and for improving the measurement accuracy, the Chinese carbon emission factors (Table 1) were finally selected for calculation (Liu et al., 2013).
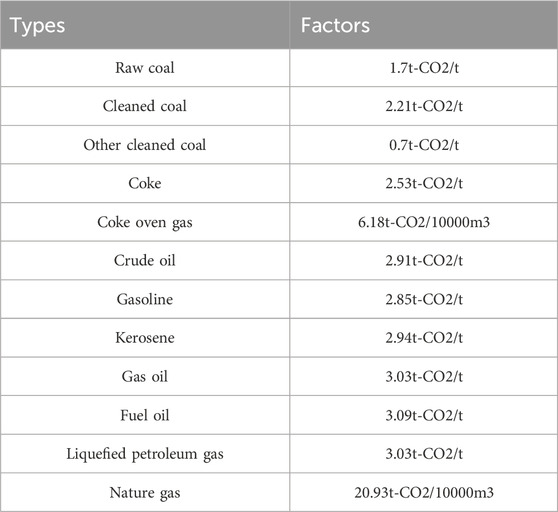
Table 1. Chinese carbon emission factors.
(1) Household fuel carbon emissions. Firstly, according to the CFPS household economy database, the fuel type is determined by the variable of “main fuel for cooking”; Secondly, the specific energy consumption Qi is calculated based on the household fuel cost of the household in the previous year and the annually average market price of main fuels. Thirdly, determine the carbon emission factor and calculate the carbon emission according to formula (1). The specific process follows the formula (1).
Where Cd represents carbon emissions of energy in once (unit: kg); indicates the type of energy; Qi represents the physical quantity of the i energy consumption (unit:kg/km3); fi represents the carbon emission factor of the i energy.
(2) Household electricity carbon emissions. The calculation is similar to the method above. Firstly, the electricity consumption Qe is calculated from the average annual price of residential electricity, and then the calculate direct carbon emission according to the carbon emission factors. Refer to the calculation method of Zhu Qin (2010), the specific formula (2) is as follows.
Where
(3) Household heating carbon emissions. The heating capacity
Where
Household indirect carbon emissions were measured according to input-output method and consumer lifestyle method. Refer to Qu Jiansheng (2012), household expenditures that generate indirect carbon emissions are divided into eight categories, including food, clothing, shelter, daily necessities and services, transportation and communication, education, culture and entertainment services, medical care, and other supplies and services. The carbon emission coefficients of the eight categories of household expenditures are shown in Table 2. The calculation formula (4) is as follows.
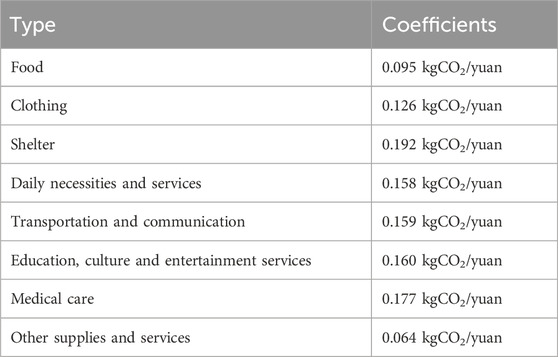
Table 2. Household carbon emission coefficient of consumer goods.
Where
According to the STIRPAT model (Dietz and Rosa, 1994; York et al., 2003), this paper takes the household as research object to establish the household environmental pressure model (formula 5). Specific linear regression model is as follows.
Where
Given the comprehensive consideration of the factors affecting household carbon emissions, this paper takes per capita household carbon emissions as the explained variable of model (5), family size as the core explanatory variable, and selects the gender (Ying et al., 2023), age (Yu et al., 2022), per capita income (Nair et al., 2019), urban and rural attributes (Suling Feng et al. ,2023), and education level of the household (Zhang et al., 2022) as the control variables, as shown in Table 3. In most studies, it is usually linearized by taking a natural logarithm on both sides in solving the problem of heteroscedasticity and conducting regression analysis (Yu et al., 2023). In this paper, the logarithm of the explained variables, explanatory variable, the variable of age and per capita household income is taken. The baseline model describes the influence of household characteristics on HCEs (Formula 6), which is estimated by ordinary least square method (OLS).
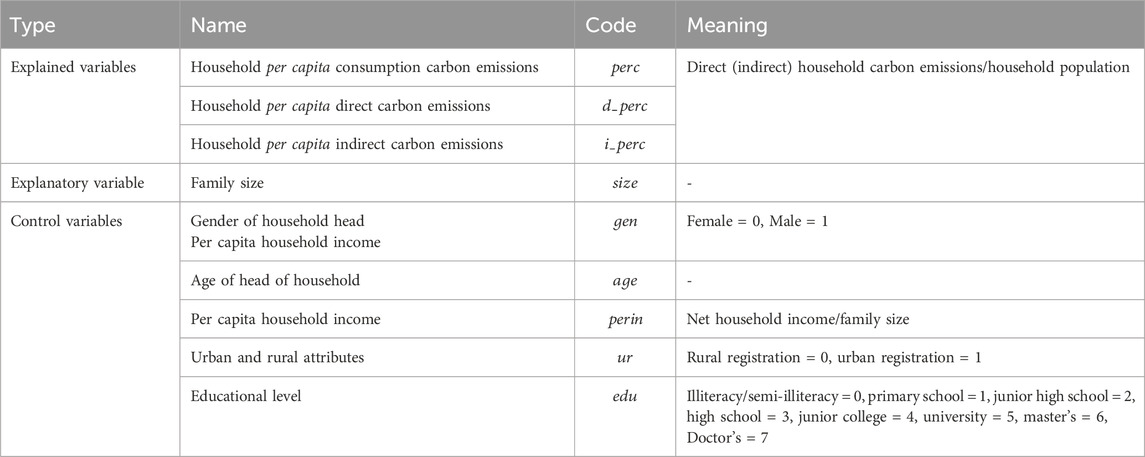
Table 3. Definition of model variables.
The definition of household size is the number of members in a household which clearly explained in the User Manual of the Chinese Family Tracking Survey. Only those who are directly or indirectly related by marriage, blood or adoption are defined as family members. And family members include those who live at home and those who live outside but have financial ties to family members. The reason why the head of household is used is that the head of household plays a significant role in household consumption decisions and patterns, and the age and gender of the head of household have a crucial impact on the scale and structure of household energy consumption (Golley J et al., 2008).
Table 4 is a descriptive statistical analysis of variables. The maximum and minimum values of per capita HCEs, direct HCEs and indirect HCEs, and per capita household income differ greatly, indicating that there are large differences among households. The largest household size was 17, with an average of 3.479, higher than the national average level in 2018; the average age of the head of household is 51.26 years old, indicating that the head of household is mainly middle-aged and elderly. Urban households accounted for 61% of the total sample. The average education level of the head of household is close to the level of junior high school. The reason for the low education level of the head of household may be that the head of household is older. The head of household over the age of 50 may have been born before 1980, when China’s education level was not high.
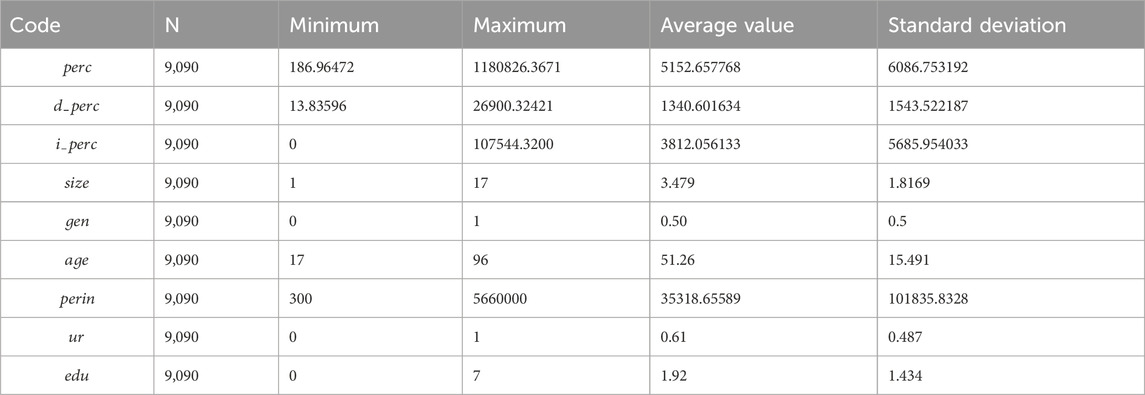
Table 4. Descriptive statistics of variables.
The calculation result shows that the indirect HCEs are greater than the direct HCEs. In 2018, the average HCEs was 1.35 tons, of which the average direct HCEs was 0.38 tons, and the average indirect HCEs was 0.97 tons. The per capita HCEs is 0.51 tons, of which the per capita direct HCEs is 0.13 tons, and the per capita indirect HCEs is 0.38 tons.
As shown in Table 5, the level of urban HCEs is higher than rural. The HCEs of urban and rural is 1.45 tons and 1.22 tons respectively, and the per HCEs of urban is greater than rural. The per capita HCEs of urban and rural were 0.57 and 0.42 tons, The per capita HCEs of urban were greater than rural households; The per capita direct HCEs and per capita indirect HCEs of urban are greater than those of rural. However, the proportion of per capita direct HCEs of urban HCEs (24.6%) is lower than that of rural (28.5%). It is worth mentioning that there are obvious differences in the scale and composition of HCEs in urban and rural areas, which are caused by the differences in lifestyle, energy structure, economic development level and infrastructure between urban and rural areas. The proportion of per capita direct HCEs of rural households is slightly higher than that of urban households, mainly because of the simple energy structure in rural that relies on traditional energy sources for heating and cooking.
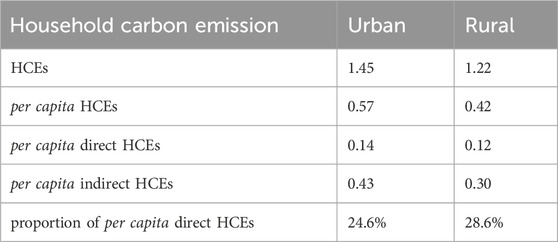
Table 5. The HCEs of urban and rural (unit:tCO2).
According to the accounting data, this paper found that the smaller family size, the higher the per capita direct and indirect HCEs. In one-person household, the HCEs direct and indirect HCEs are 2.46 and 9.40 tons/person respectively, while those in an eight-person household are 0.53 and 0.73 tons/person respectively, and the emission of the one-person household is about 4.64 and 12.87 times than the eight-person household. Figure 1 show that with the reduction of household size, the proportion of indirect HCEs per capita increases, while the proportion of direct HCEs per capita decreases.
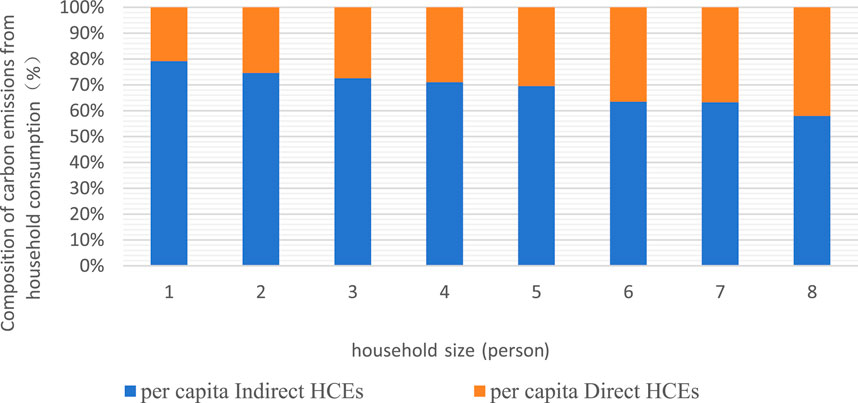
Figure 1. Composition of per capita HCEs by different household size.
This study matched the sample data to provinces, and then calculated the average values of household size, per capita HCEs, per capita direct HCEs, and per capita indirect HCEs in provinces (see Figures 2, 3, 4, 5).
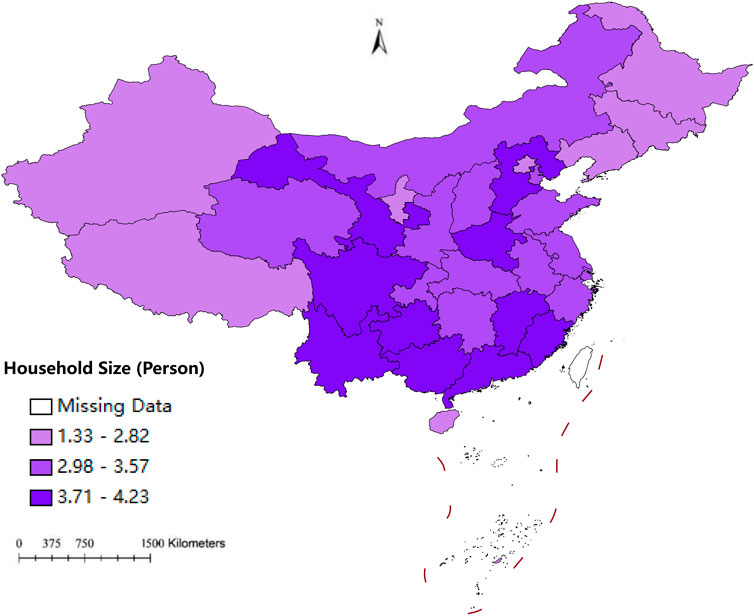
Figure 2. The average household size of provinces in China.
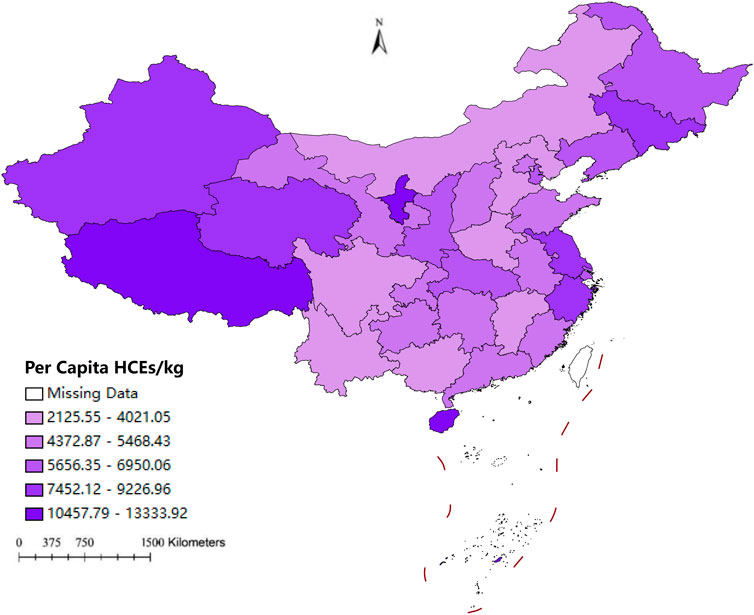
Figure 3. The average per capita HCEs of provinces in China.
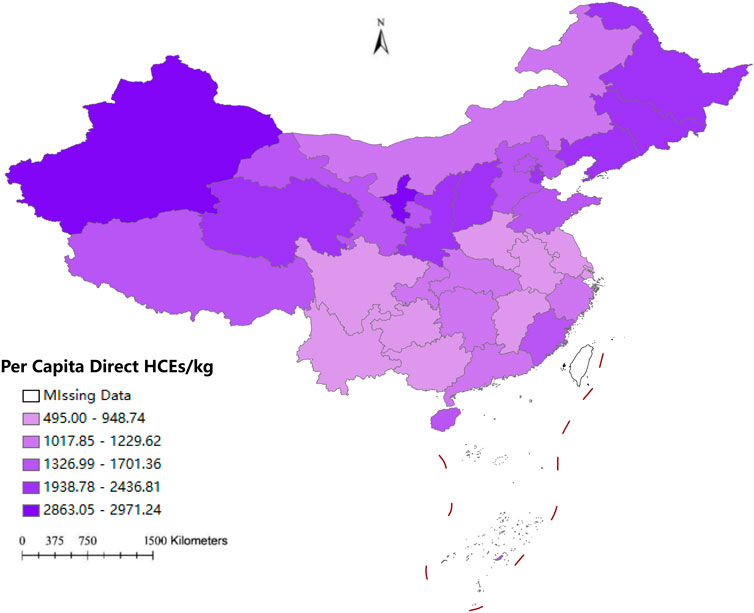
Figure 4. The average per capita direct HCEs of provinces in China.
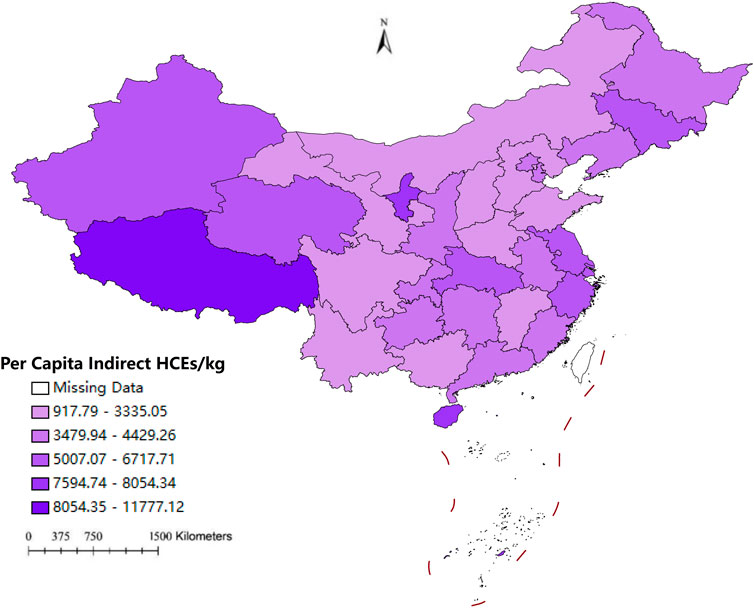
Figure 5. The average per capita indirect HCEs of provinces in China.
Figure 2 shows that Heilongjiang, Liaoning, Jilin, Xinjiang, Tibet, Ningxia and Beijing are provinces with small family sizes. Figure 3 shows that Heilongjiang, Liaoning, Jilin, Xinjiang, Tibet, Ningxia, Hainan, Jiangsu and Zhejiang are the regions with high levels of per capita HCEs and these provinces are mainly the western regions and the economically developed eastern regions. The provinces with smaller household size partially overlap with those with higher per capita HCEs, which confirms that there may be a negative correlation.
Figure 4 show that the province of Heilongjiang, Liaoning, Jilin, Xinjiang, Ningxia, Qinghai, Shanxi, Shaanxi have higher per capita direct HCEs. These provinces are concentrated in northern China, with high latitude and relatively low temperature. They need more energy for heating in winter, thus bringing more energy consumption and direct HCEs. Figure 5 show that the provinces with high household indirect carbon emissions are Tibet, Ningxia, Jilin, Xinjiang, Qinghai, Hainan, Jiangsu, Zhejiang and Shanghai. The high indirect HCEs in Tibet, Ningxia, Xinjiang and Qinghai may be related to the small number of survey data samples in the database, and there is uncertainty in the data. Jiangsu, Shanghai and Zhejiang are economically developed regions with high income levels, so indirect HCEs related to consumption are relatively high.
As shown in Table 6, the absolute values of correlation coefficients among all explanatory variables are not higher than 0.5, and VIF is not higher than 1.6, indicating that there is no multicollinearity problem among explanatory variables.
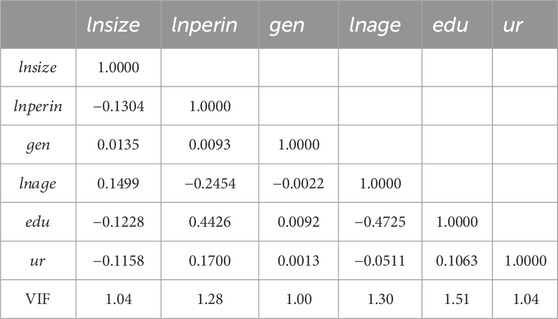
Table 6. Correlation coefficients of explanatory variables.
This study uses OLS to analyze the relationship between household size and per capita HCEs.The regression results are shown in Table 7. Column (1) in the table is the estimation result without controlling variables, and column (2) to column (6) are regression results considering per capita household income, age and gender of household head, urban and rural attributes, and education level, respectively.

Table 7. The result of baseline regression.
The results show that the coefficients of household size from column (1) to column (6) are significantly negative, which means that household size has a significant negative impact on per capita HCEs, that is, the smaller the family size, the higher the per capita HCEs. Hypothesis 1 is verified. The absolute value of the coefficient of household size is greater than the control variable, indicating that household size is the primary factor affecting per capita HCEs. Other variables in order of influence degree are per capita household income, age of head of household, urbanization and education level.
There is a significant positive correlation between per capita household income and per capita HCEs. The reason is that with the increase of household income, the level of household consumption has improved. In addition, people pursue high-quality, diversified and refined consumption, which promotes the increase of carbon emissions from household consumption (Weber et al., 2008; Nair et al., 2019; Hartono, 2023).
The age of household head has a significant negative effect on per capita HCEs, which is consistent with Tong Yufen (2020) and Yu et al. (2022). The reason may be that with the growth of age, the consumption willingness of household head decreases, the awareness of saving becomes stronger, and more attention is paid to environmental protection, energy conservation and emission reduction, thus reducing the household’s carbon emissions. The regression results of gender are not significant, indicating that gender of household head has no significant impact on household energy consumption patterns. The regression coefficient of urban and rural attributes is significantly positive, which means that in the process of urbanization, the urban lifestyle of households and the increase of urban families will increase the per capita HCEs. Education level has a significant positive impact on household carbon emissions, and the reason may be that household with higher education income more and desire a higher quality of life, and the relative increase in consumption demand will increase HCEs (Li et al., 2019).
As shown in Table 8, household size has a significant negative impact on per capita direct HCEs. Larger households can share energy demands (such as heating, cooling, and lighting), thereby benefiting from economies of scale, which result in relatively lower per capita direct carbon emissions. In columns (2) to (6), by gradually controlling the variables of per capita household income, age and gender of the head in family, urban and rural attributes, and education level, the results remain stable except the gender. The coefficients of household size are −0.5916, −0.5832, −0.5821, −0.5825, −0.5613, and −0.5604, respectively. Although the absolute value of the coefficient decreases with the introduction of control variables, it remains higher than those of other variables. The influence of other variables, in descending order of magnitude, are per capita household income, urbanization, education level, and age of the household head.
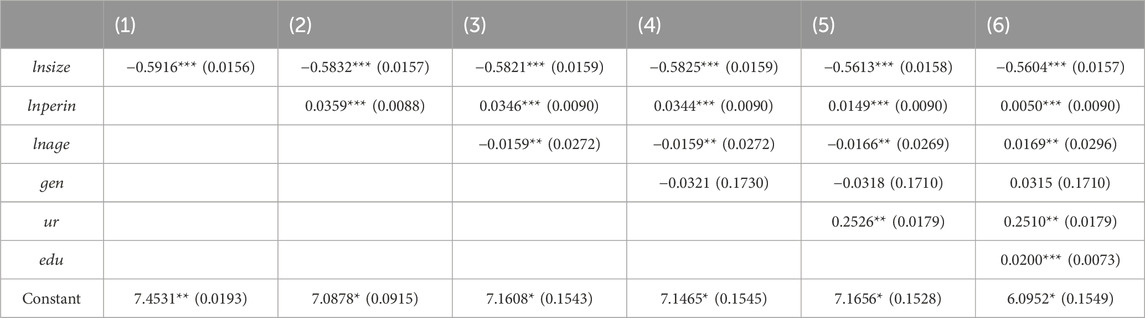
Table 8. Regression results of household size and per capita direct HCEs.
As shown in Table 9, household size has a significant negative influence on per capita indirect HCEs. These results are consistent with the results of Underwood and Fremstad (2018) and Guo et al. (2022). The absolute value of the coefficient for the impact of household size on per capita indirect HCEs (0.9279) is greater than that on per capita direct HCEs (0.5604), indicating that household size has a larger impact on indirect HCEs than on direct HCEs. Hypothesis 2 is thus confirmed. The absolute value of the household size coefficient also exceeds that of other variables, indicating that household size is a key factor influencing indirect HCEs. In descending order of magnitude, the other influential factors are per capita household income, age of the household head, urbanization, and education level. This ranking is consistent with that for HCEs indicating that indirect HCEs dominate the HCEs and exhibit a similar trend.
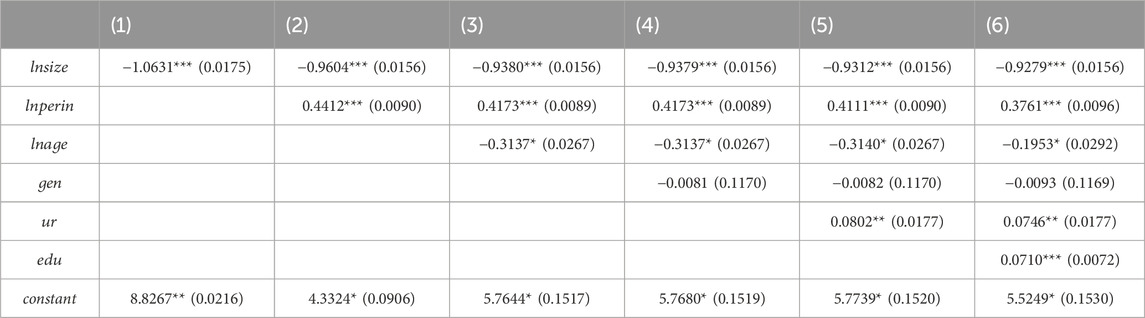
Table 9. Regression results of household size and per capita indirect HCEs.
This study further verifies the robustness of the baseline regression results by employing alternative regression methods and replacing variables. The Generalized Least Squares (GLS) method is applied to further eliminate heteroscedasticity and correct the model to obtain more efficient parameters. As shown in Table 10, the positive and negative of the coefficients remains consistent with the baseline regression results from the OLS method.
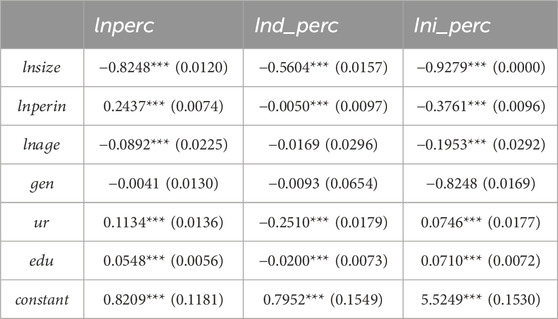
Table 10. Regression results based on GLS.
In this study, the number of books in the household is used as a substitute for the household education level variable (Cong et al., 2023). Upon cleaning the sample data, it was found that out of 9,090 samples, 3,548 samples had a value of “0,” and 85 samples were marked as “not filled” or “unknown”. By excluding the “not filled” or “unknown” samples, we obtained 9,005 valid samples. For these 9,005 samples, a value of 1 was uniformly added before taking the logarithm for the OLS regression. The results are presented in Table 11. The positive and negative of the coefficients remains consistent with the baseline regression results.
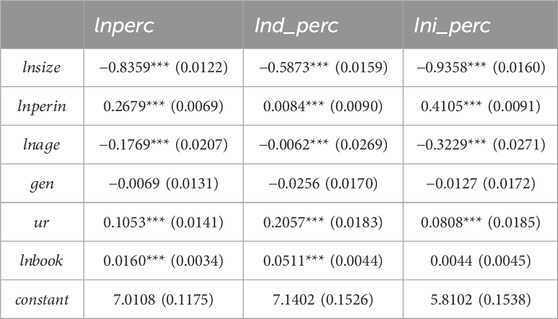
Table 11. OLS regression results by replacing variables.
According to the classification of household consumption expenditure above, the household expenditures that produce indirect HCEs mainly fall into eight categories: food (
As shown in Table 12, all coefficients are negative and significant at the 1% level, The findings demonstrate that household size has a significant negative impact on per capita HCEs across all eight expenditure categories. The results further confirm the existence of economies of scale in household carbon emissions and suggest that the benefits of different categories of resources can be shared among family members. In the eight categories of household expenditures, the coefficients are as follows: food (−0.2231), dress (−0.0967), housing (0.5131), daily necessities (−0.0643), transportation and communication (−0.1982), education, culture, and entertainment (−0.1107), healthcare (−0.0092), and other expenses (−0.0789). The top4 impact is observed in housing, food, and transportation and communication, while the smallest is in healthcare. The significant carbon emission coefficients for housing, food, and transportation and communication expenditures indicate that smaller households have higher demands for housing, food, and transportation, leading to higher carbon emissions. Smaller households exhibit a consumption pattern with higher carbon emissions. Hypothesis 3 is thus validated.
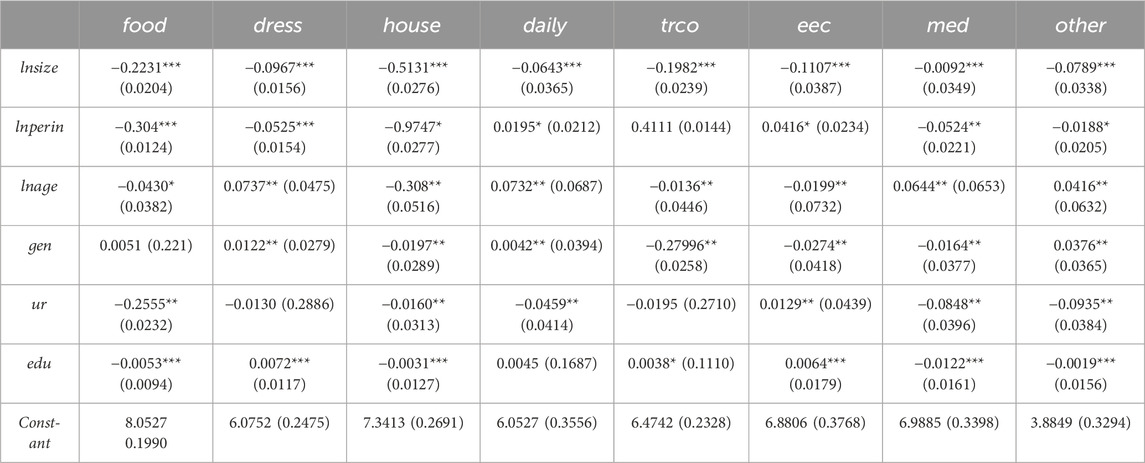
Table 12. The effect of household size on the different expenditure categories.
Comparing the driving factors of each consumption category reveals that household size is not the key factor for all consumption items. Food expenditure is primarily influenced by per capita household income and urbanization, while dress expenditure is mainly affected by household size and household income. Housing expenditure is primarily influenced by household income and household size. Daily necessities are mainly influenced by age and household size. Transportation expenditure is primarily affected by household income and gender. Education, culture, and entertainment expenditure are mainly influenced by household size and household income. Healthcare expenditure is affected by urbanization and age, while other goods and services expenditure is influenced by urbanization and household size. Identifying these factors can help formulate targeted emission reduction measures.
From Table 13, it can be seen that household size has a significant negative impact on per capita carbon emissions for both rural and urban households. The elasticity coefficients of household size on per capita carbon emissions are greater for urban households than for rural households. This is primarily due to differences in lifestyle and purchasing power between urban and rural households. Compared to rural households, urban households have a more modern lifestyle, greater purchasing power, and higher frequency of transportation. It may also be related to the relatively traditional lifestyle of rural residents, who are more likely to live with older generations, resulting in larger household sizes. Additionally, per capita household income has a greater impact on urban households than on rural ones. The effects of the household head’s age and education level are smaller in urban households compared to rural households. This collectively indicates that rural households are more traditional and frugal. Higher education levels among household heads are more beneficial in raising energy-saving and environmental awareness, thereby reducing HCEs. Hypothesis 4 is thus confirmed.
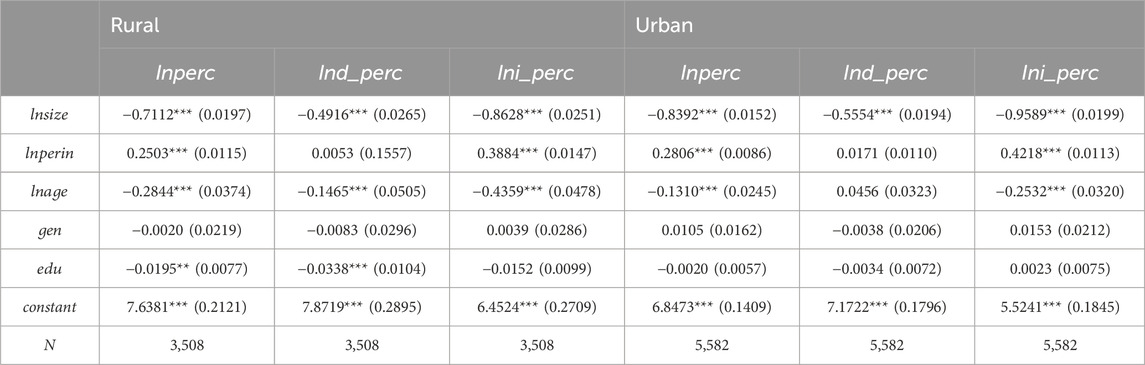
Table 13. The impact of household size on HCEs in urban and rural areas.
The factors affecting household carbon emissions include two aspects: household consumption patterns and household demographic characteristics. Scholars have extensively studied the impact of household size on carbon emissions under different income and education levels. This article analyzes the impact of changes in household size on HCEs from the perspective of family consumption structure and argues that families with smaller sizes tend to favor high-carbon emission consumption items, and the effects show urban-rural heterogeneity. This paper contributes to the study of household carbon emissions and is subject to three potential weaknesses.
Currently, the methods of Structural Factor Analysis and Regression Analysis are mainly used in academia for quantitative analysis of the impact of household characteristics on HCEs. The Structural Factor Analysis is well-theoretically grounded in the selection of driving factors (Shi, 2023). Regression Analysis is primarily based on the STIRPAT model and the STIRPAT model can be used to analyze various factors that cause disproportionate changes in environmental pressure (York et al., 2003), and it is widely applied in the study of driving factors for carbon emissions. Although the model has some subjectivity in the selection of variables, one of the advantages of the STIRPAT model is its flexibility, allowing as it does for the adding, modification, and decomposition of related influencing factors (Khan et al., 2020).
The input-output method and consumer lifestyle approach are often used to measure indirect HCEs. There is a certain lag when calculating carbon emissions by input-output method, and it may be impossible in accounting because of incomplete input-output tables for some years (Wang et al., 2019). The data used in this paper is 2018, and there is no input-output table for this year, so this paper uses the consumer lifestyle approach to calculate. This method often calculates indirect HCEs by multiplying the amount of residents’ consumption by the corresponding carbon emission coefficients. The emission coefficient of consumption amount is fixed and static, without considering account changes in technological progress. If technological progress reduces the prices of consumer goods, the quantity of consumer products may increase even if the amount spent on consumption remains unchanged. So, this method ignores the real rebound effect in consumption, making it difficult to indicate the actual consumption volume of residents. In addition, the coefficients of energy consumption and other consumption activities should be adapted to local conditions. Although the coefficients used in this paper have adjusted based on China’s consumption characteristics (Qu et al., 2013), they do not reflect the differences of household location. Carbon emission calculation model should be more in line with local production technology level and household consumption characteristics.
Zhang et al. (2023) utilized the 2018 China’s Urban Household Income and Expenditure Survey dataset to analyze the impact of household structure changes on carbon emissions. However, the China’s Urban Household Income and Expenditure Survey dataset only includes urban household samples, which cannot be compared with rural areas. This study employs the 2018 China Family Panel Studies (CFPS) data, which surveyed a sample of 14,218 households. After cleaning and excluding invalid samples, the final sample size is 9,090. Conducted by the China Social Science Survey Center at Peking University, the CFPS is a comprehensive and nationwide social tracking survey project. And it considers the family as a sample unit, collecting a wide range of data and includes a complete variety of survey questionnaires (Sun Y., 2022). Therefore, this paper uses multidimensional data from the database, including household demographics, economics, and education, and examines the full picture of urban and rural household carbon emissions through household consumption expenditure items related to clothing, food, housing, transportation, and energy, etc. Among the 9,090 samples, the sample size of Tibet, Xinjiang, Ningxia, Qinghai and other provinces is single digit. For instance, there are only 3 samples in the Tibet, with an average household size of 1.3 people, which is the lowest among all provinces. The average household size in Tibet in 2020 was 3.19, the highest in China (The Seventh National Population Census, 2020). A small sample size cannot accurately reflect the regional situation and may lead to uncertainty in the empirical analysis results.
Chen L., et al. (2022) explore the spatial relationship between urbanization and urban household carbon emissions in Chinese cities at the prefecture level and above, revealing the spatiotemporal characteristics of urban residents’ carbon emissions. This paper, based on cross-sectional data, discusses the differences in carbon emissions between urban and rural residents in China but has not analyzed the annual changes in household carbon emissions and their influencing factors. In the future, we will collect data from more years to track the spatiotemporal evolution of China’s HCEs and driving factors. Liu (2023), based on the analysis of British household data, believes that compared to household income, lifestyle-related factors have a greater impact on household carbon emissions. And Liu (2023) specified how the concept of lifestyle is associated with housing fuel using emissions and motor emissions and evaluated whether the living area and the number of cars owned are the reflection of energy-saving lifestyles. Although this study has focused on the structural changes in household consumption, it cannot determine whether the family’s lifestyle tendencies are energy-saving. In the future, this paper will adopt a database that includes more information on family lifestyles to delve into the impact of Chinese family lifestyles on household carbon emissions.
Based on the CFPS (China Family Panel Studies) household data, this paper explores the impact of family size on total household carbon emissions, direct and indirect household carbon emissions, and especially analyzes the heterogeneity of urban and rural structure and household consumption structure.
Firstly, our empirical results have proved that the negative effect of household size on indirect HCEs per capita (−0.9279) was greater than that of direct HCEs (−0.5604). On the contrary, household income and education level are positively correlated with household carbon emission, while household aging characteristics are negatively correlated with the emissions. The effect of household size is higher than that of household income, aging, and education level.
Secondly, from the perspective of urban and rural structure, the level of per capita carbon emission among urban households (−0.8392) is higher than that of rural households (−0.7112), indicating that the rapid urbanization in China and household size miniaturization increase the imbalance of carbon emissions between urban and rural areas, and have a “superimposed effect” on HCEs, which is not conducive to achieve the target of carbon peaking and neutrality.
Thirdly, household size has a negative impact on eight categories of consumption that bring indirect HCEs and the degree of impact in descending order is housing (−0.5131), food (−0.2231), transportation and communication (−0.1982), education and entertainment (−0.1107), clothing (−0.0967), daily necessities (−00643), other categories (−0.0789), and medical care (−0.0092). The upgrading of household consumption structure and the miniaturization of household size promote the increase HCEs. These carbon emission reduction potentials from different spending categories highlight the importance of optimizing household consumption structure for carbon emission reduction in Chinese households.
Based on the above research results, the following policy implications can be drawn.
Firstly, it is necessary to optimize family structures and encourage economy sharing within families. The current society is facing aging populations, declining birth rates, and the emergence of concepts such as non-marriage and Dink families, which have led to the decline of average family size in China. The government should strive to optimize family structures and improve the coverage of social welfare to mitigate the trend of shrinking family sizes. For example, the government could alleviate social pressures through balancing regional housing prices and employment opportunities and reduce the phenomenon of young people’s late or refusing marrying. Given the positive role of the elderly in family carbon reduction, the government should guide young people, especially urban youth, to live together with their aging parents. In addition, the entire society should provide more convenience and support for young people to cohabit with the elderly. This not only reduces the number of families and per capita living space but also helps the elderly use more energy-efficient household appliances, promoting carbon emission reduction and maximizing the scale economy, while encouraging the sharing of goods and services between families to promote the sharing economy within household.
Secondly, it is necessary to optimize the family consumption structure and advocate for a low-carbon consumption approach. The government should consciously establish a green consumption policy system to promote a low-carbon and environmentally friendly lifestyle. For example, using low-carbon labels can inform consumers about the carbon content of products and services, influencing their purchasing decisions. Considering that family consumption decisions are affected by costs and prices, it is advisable to guide family consumption behavior through measurements such as fuel taxes, congestion charges, carbon taxes on high-carbon products, and tiered electricity pricing. Establishing a personal carbon account is also beneficial to create a personal carbon tax system, which can digitally record an individual’s carbon emissions in clothing, food, housing, and transportation. Additionally. guiding small-scale families to choose green, low-carbon products plays an important role through incentive mechanisms, such as green buildings, green food, and new energy vehicles, encouraging the use of public transportation, promoting environmentally friendly shopping, or low-carbon consumption packaging, etc. Encouraging enterprises to provide more intensive residential apartments, low-power appliances, and miniaturized daily necessities suitable for small-scale families is also a step forward. The housing sector has become a sector with great potential for reducing carbon emissions (Dusan Gordic, 2023), and the government could design balanced rental and purchase schemes to allow renters to enjoy the same public rights as homeowners, increasing the consumption nature of housing and reducing its investment nature (Zhao et al., 2023).
Thirdly, it is necessary to tap into the potential of rural HCEs. Strengthen the transformation of traditional energy in rural areas, for example, by implementing policies to change from coal to gas, which greatly reducing the proportion of rural direct carbon emissions. Meanwhile, enhancing the education and publicity of energy-saving and emission-reduction contributes to raising the awareness of energy conservation and emission reduction among rural families.
The original contributions presented in the study are included in the article/supplementary material, further inquiries can be directed to the corresponding author.
HS: Conceptualization, Formal Analysis, Supervision, Writing–original draft, Writing–review and editing. MY: Data curation, Formal Analysis, Writing–original draft. MX: Formal Analysis, Software, Validation, Writing–review and editing. DY: Data curation, Software, Visualization, Writing–review and editing. FG: Conceptualization, Supervision, Writing–original draft.
The author(s) declare that no financial support was received for the research, authorship, and/or publication of this article.
We also would like to thank the reviewers for their thoughtful comments that helped improve the quality of this work.
The authors declare that the research was conducted in the absence of any commercial or financial relationships that could be construed as a potential conflict of interest.
All claims expressed in this article are solely those of the authors and do not necessarily represent those of their affiliated organizations, or those of the publisher, the editors and the reviewers. Any product that may be evaluated in this article, or claim that may be made by its manufacturer, is not guaranteed or endorsed by the publisher.
Ala-Mantila, S., Heinonen, J., and Junnila, S. (2014). Relationship between urbanization, direct and indirect greenhouse gas emissions, and expenditures: a multivariate analysis. Ecol. Econ. 104, 129–139. doi:10.1016/j.ecolecon.2014.04.019
Bin, S., and Dowlatabadi, H. (2005). Consumer lifestyle approach to US energy use and the related CO2 emissions. Energy Policy 33 (2), 197–208. doi:10.1016/S0301-4215(03)00210-6
Brand, C., Goodman, A., Rutter, H., Song, Y., and Ogilvie, D. (2013). Associations of individual, household and environmental characteristics with carbon dioxide emissions from motorised passenger travel. Appl. energy 104, 158–169. doi:10.1016/j.apenergy.2012.11.001
Büchs, M., and Schnepf, S. V. (2013). Who emits most? Associations between socio-economic factors and UK households' home energy, transport, indirect and total CO2 emissions. Ecol. Econ. 90, 114–123. doi:10.1016/j.ecolecon.2013.03.007
Cao, J., Ho, M. S., Li, Y., Newell, R. G., and Pizer, W. A. (2019). Chinese residential electricity consumption: estimation and forecast using micro-data. Resour. Energy Econ. 56, 6–27. doi:10.1016/j.reseneeco.2017.10.003
Cong, Y., Wang, Y. X., and Wu, Y. L. (2023). Impact of house prices on household carbon emissions. Front. Environ. Sci. 11, 1149089. doi:10.3389/fenvs.2023.1149089
Dalton, M., O’Neill, B., Prskawetz, A., Jiang, L., and Pitkin, J. (2008). Population aging and future carbon emissions in the United States. Energy Econ. 30 (30), 642–675. doi:10.1016/j.eneco.2006.07.002
Deaton, A. S., and Paxson, C. (1998). Economies of scale, household size, and the demand for food. J. Political Econ. 106 (5), 897–930. doi:10.1086/250035
Ellsworth-Krebs, K. (2020). Implications of declining household sizes and expectations of home comfort for domestic energy demand. Nat. Energy 5 (1), 20–25. doi:10.1038/s41560-019-0512-1
Fan, J. S., Zhou, L., Zhang, Y., Shao, S., and Ma, M. (2021). How does population aging affect household carbon emissions? Evidence from Chinese urban and rural areas. Energy Econ. 100 (Aug), 105356.1–105356.15. doi:10.1016/j.eneco.2021.105356
Fan, L., and Wang, D. (2014). Calculation and decomposition analysis on carbon emissions of indirect Residents’Consumption in China. Ecol. Econ. 30 (7), 28–32. doi:10.3969/j.issn.1671-4407.2014.07.007
Feng, S., Liu, J., and Xu, D. (2023). Digital fnancial development and indirect household carbon emissions: empirical evidence from China. Environ. Dev. Sustain. doi:10.1007/s10668-023-03603-4
FengS, L., Liu, J. J., and Xu, D. h. (2020). Digital financial development and indirect household carbon emissions: empirical evidence from China. Environ. Dev. Sustain. doi:10.1007/s10668-023-03603-4
Goldstein, B., Reames, T. G., and Newell, J. P. (2022). Racial inequity in household energy efficiency and carbon emissions in the United States: an emissions paradox. Energy Res. Soc. Sci. 84, 102365. doi:10.1016/j.erss.2021.102365
Golley, J., Meagher, D., and Meng, X. (2008). Chinese urban household energy requirements and CO2 emissions. China’s Dilemma Econ. Growth, Environ. Clim. Change 334. doi:10.22459/cd.07.2008.16
Gordic, D., Nikolic, J., Vukasinovic, V., Josijevic, M., and Aleksic, A. D. (2023). Offsetting carbon emissions from household electricity consumption in Europe. Renew. Sustain. Energy Rev. 175, 113154. doi:10.1016/j.rser.2023.113154
Guo, F., Zheng, X., Wang, C., and Zhang, L. (2022). Sharing matters: household and urban economies of scale for a carbon-neutral future. Resour. Conservation Recycl. 184, 106410. doi:10.1016/j.resconrec.2022.106410
Han, J., Shi-hao, N. I. U., and Ying-lu, G. A. O. (2023). Research on the accounting for household carbon emissions and influencing factors in the new development stage. J. Lanzhou Univ. Finance Econ. 39 (1), 68–80. id:1004-5465 (2023)01-0068-13.
Hardee, K., and Mutunga, C. (2010). Strengthening the link between climate change adaptation and national development plans: lessons from the case of population in national adaptation programmes of action (NAPAs). Mitig. Adapt. Strategies Glob. Change 15 (2), 113–126. doi:10.1007/s11027-009-9208-3
Hartono, D., Dachlan, A. N., Hastuti, S. H., Kartiasih, F., Saputri, N. K., Kurniawan, R., et al. (2023). The impacts of households on carbon dioxide emissions in Indonesia. Environ. Process. 10, 54. doi:10.1007/s40710-023-00666-3
Herendeen, R., and Tanaka, J. (1976). Energy cost of living. Energy 1 (2), 165–178. doi:10.1016/0360-5442(76)90015-3
Hu, Zh., Gong, X., and Liu, H. (2020). Analysis on the influencing factors and changing trend of household consumption carbon emission: take Shaanxi province as an example. Ecol. Econ. 36 (5), 24–30. Id: 1671-4407(2020)05-024-07.
Imbulana Arachchi, J., and Managi, S. (2022). Social capital, household income and carbon dioxide emissions: a multicountry analysis. Environ. Impact Assess. Rev. 96, 106838. doi:10.1016/j.eiar.2022.106838
Ivanova, D., and Büchs, M. (2020). Household sharing for carbon and energy reductions: the case of EU countries. Energies 13, 1909–1928. doi:10.3390/en13081909
Ivanova, D., and Büchs, M. (2022). Implications of shrinking household sizes for meeting the 1.5 °C climate targets. Ecol. Econ. 202, 107590. doi:10.1016/j.ecolecon.2022.107590
Ivanova, D., Stadler, K., Steen-Olsen, K., Wood, R., Vita, G., Tukker, A., et al. (2016). Environmental impact assessment of household consumption. J. Industrial Ecol. 20 (3), 526–536. doi:10.1111/jiec.12371
Jiang, L., and Hardee, K. (2011). How do recent population trends matter to climate change? Popul. Res. Policy Rev. 30 (2), 287–312. doi:10.1007/s11113-010-9189-7
Jiang, L., and Karen, H. (2009). How do recent population trends matter to climate change? PAI work Pap. Available at: http://www.Populationaction.Org/Publications/WorkingPapers/April_2009.DOI10.1007/s11113-010-9189-7. doi:10.1007/s11113-010-9189-7
Jian-Sheng, Q. U., Liu, L. N., Zeng, J. J., Zhang, Z. Q., Wang, L., Wang, Q. H., et al. (2014). An analysis on driving factors of China's urban and rural household carbon emissions. China Popul. Resour. Environ. 24 (8), 33–41. doi:10.3969/j.issn.1002-2104.2014.08.005
Khan, A. N., En, X., Raza, M. Y., Khan, N. A., and Ali, A. (2020). Sectorial study of technological progress and CO2 emission: insights from a developing economy. Technol. Forecast. Soc. Change 151, 119862. doi:10.1016/j.techfore.2019.119862
Klemes, J. J., Jiang, P., Fan, Y. V., Bokhari, A., and Wang, X. C. (2021). COVID-19 pandemics Stage II – energy and environmental impacts of vaccination. Renew. Sustain. Energy Rev. 150, 111400. doi:10.1016/j.rser.2021.111400
Li, C., Zhang, L., Gu, Q. Y., Guo, G., and Huang, Y. (2022). Spatio-temporal differentiation characteristics and urbanization factors of urban household carbon emissions in China. J. Environ. Res. Public Health 19, 4451. doi:10.3390/ijerph19084451
Li, J., Zhang, D., and Su, B. (2019). The impact of social awareness and lifestyles on household carbon emissions in China. Ecol. Econ. 160, 145–155. doi:10.1016/j.ecolecon.2019.02.020
Li, N. N., Zhao, Y., and Wang, J. F. (2022). Regional heterogeneity and policy responses of the rising residential income and savings on China’s urban household energy-related CO2. Ecol. Econ. 38 (1), 30–35. 1671-4407(2022)01-030-06.
Li, Y. M., Zhao, R., Liu, T. S., and Zhao, J. (2015). Does urbanization lead to more direct and indirect household carbon dioxide emissions? Evidence from China during 1996–2012. J. Clean. Prod. 102, 103–114. doi:10.1016/j.jclepro.2015.04.037
Li, Z. G., and Wang, J. (2021). Accounting and driving factors analysis of household carbon emissions in urban and rural China. Statistics Decis. Mak. 584 (20), 48–52. doi:10.13546/j.cnki.tjyjc.2021.20.010
Liu, J., Daily, G. C., Ehrlich, P. R., and Luck, G. W. (2003). Effects of household dynamics on resource consumption and biodiversity. Nature 421 (6922), 530–533. doi:10.1038/nature01359
Liu, L. C., Wu, G., Wang, J. N., and Wei, Y. M. (2011). China’s carbon emissions from urban and rural household during 1992-2007. J. Clean. Prod. (15), 1754–1766. doi:10.1016/j.jclepro.2011.06.011
Liu, M., Wang, H., Oda, T., Zhao, Y., Yang, X., Zang, R., et al. (2013). Refined estimate of China's CO2 emissions in spatiotemporal distributions. Atmos. Chem. Phys. 13 (21), 10873–10882. doi:10.5194/acp-13-10873-2013
Liu, T., Shryane, N., and Elliot, M. (2023). Micro-macro multilevel analysis of day-to-day lifestyle and carbon emissions in UK multiple occupancy households. Sustain. Prod. Consum. 39, 13–29. doi:10.1016/j.spc.2023.04.023
Lyons, S., Pentecost, A., and Tol, R. S. J. (2012). Socioeconomic distribution of emissions and resource use in Ireland. J. Environ. Manag. 112, 186–198. doi:10.1016/j.jenvman.2012.07.019
Ma, X. W., Du, J., Ye, Y., and Xu, M. (2015). A study of comparison of carbon emissions accounting from household energy consumption between China and United States of American. J. Beijing Inst. Technol. Soc. Sci. Ed. 17 (4), 34–40. doi:10.15918/j.jbitss1009-3370.2015.0405
Mehmood, U., Tariq, S., and Zia, U. (2021). Effects of population structure on CO2 emissions in South Asian countries: evidence from panel estimation. Environ. Sci. Pollut. Control Ser. 28, 66858–66863. doi:10.1007/s11356-021-14976-2
Meng, W. L., Yuan, G. C., and Sun, Y. P. (2023). Expansion of social networks and household carbon emissions: evidence from household survey in China. Energy Policy 174 (2023), 113460. doi:10.1016/j.enpol.2023.113460
Mi, Z. F., Zheng, J. L., Meng, J., Ou, J., Hubacek, K., Liu, Z., et al. (2020). Economic development and converging household carbon footprints in China. Nat. Sustain. 3 (7), 529–537. doi:10.1038/s41893-020-0504-y
Miehe, R., Scheumann, R., Christopher, M., Kammen, D. M., and Finkbeiner, M. (2016). Regional carbon footprints of households: a German case study. Environ. Dev. Sustain. 18 (2), 577–591. doi:10.1007/s10668-015-9649-7
Murray, A. G., and Mills, B. F. (2011). Read the label! Energy Star appliance label awareness and uptake among U.S. consumers. Energy Econ. 33, 1103–1110. doi:10.1016/j.eneco,2011.04.013
Nair, S., Bhatia, S. K., and Chandrakar, M. (2019). Household carbon emissions in India: correlation with income and household size. Asian J. Water, Environ. Pollut. 16 (2), 71–81. doi:10.3233/AJW190022
Nan, Li, Shao, K., and Wang, Q. (2011). Study on the impact of Population Structure on carbon emission in China. China Popul. Resour. Environ. 2011 (6), 19–23.
Nejat, P., Jomehzadeh, F., Taheri, M. M., Gohari, M., and Abd. Majid, M. Z. (2015). A global review of energy consumption, CO2 emissions and policy in the residential sector (with an overview of the top ten CO2 emitting countries). Renew. Sustain. energy Rev. 43, 843–862. doi:10.1016/j.rser.2014.11.066
Nissinen, A., Grönroos, J., Heiskanen, E., Honkanen, A., Katajajuuri, J. M., Kurppa, S., et al. (2006). Developing benchmarks for consumer-oriented life cycle assessment-based environmental information on products, services and consumption patterns. J. Clean. Prod. 15 (6), 538–549. doi:10.1016/j.jclepro.2006.05.016
Paul, E., and Holdren, J. (1971). Impact of population growth. Science 171, 1212–1217. doi:10.1126/science.171.3977.1212
Peng, X. Z., and Zhu, Q. (2010). Analysis on the impact of population situation and consumption pattern on carbon emission in China. Popul. Res. (1), 48–58.
Qinchi, W. (2015). Effects of household size on energy consumption and carbon emissions. Resour. Sci. doi:10.1016/j.ecolecon.2022.107734
Qu, J., Zeng, J., Li, Y., Wang, Q., Maraseni, T., Zhang, L., et al. (2013). Household carbon dioxide emissions from peasants and herdsmen in northwestern arid-alpine regions, China. Energy Policy 57, 133–140. doi:10.1016/j.enpol.2012.12.065
Satterthwaite, D. (2009). The implications of population growth and urbanization for climate change. Environ. Urbanization 21 (2), 545–567. doi:10.1177/0956247809344361
Schroder, C., Rehdanz, K., Narita, D., and Okubo, T. (2015). The decline in average family size and its implications for the average benefits of within-household sharing. Oxf. Econ. Pap. 67 (3), 760–780. doi:10.1093/oep/gpv033
Shang, M., Zhang, F., and Hu, Z. (2021). Research on household carbon emissions of urban and rural residents from the perspective of family heterogeneity: taking Shaanxi as an example. Ecol. Econ. 37 (2). 2021. Id:1671-4407(2021)02-013-09.
Shi, A. (2003). The impact of population pressure on global carbon dioxide emissions, 1975-1996: evidence from pooled cross-country data. Ecol. Econ. 44 (44), 29–42. doi:10.1016/S0921-8009(02)00223-9
Shiwang, Yu, Qi, Z., Jian, Li H., Ma, W., Sun, Y., Wang, X., et al. (2023). Development of an extended STIRPAT model to assess the driving factors of household carbon dioxide emissions in China. J. Environ. Manag. 325 (2023), 116502. doi:10.1016/j.jenvman.2022.116502
Sun, Q., and Lu, G. (2023). The effect of the elderly and child care on household carbon emissions. Heliyon 9 (2023), e17706. doi:10.1016/j.heliyon.2023.e17706
Sun, Y. (2022). Research on household carbon emissions and its influencing factors—an empirical analysis based on the perspective of the family life cycle. Popul. J. 2022.5vol.44.pp86-98. doi:10.16405/j.cnki.1004-129X.2022.05.007
Thaiyoong, P. M., Maclean, G., and Dalziel, P. (2011). Household size economies:Malaysian evidence. Econ. Analysis Policy 41 (2), 203–223. doi:10.1016/S0313-5926(11)50020-7
Tong, Y., and Zhou, W. (2020). The impact of family population aging on carbon emissions: an empirical study from the micro perspective of households. Popul. J. 42 (3), 78–88. doi:10.16405/j.cnki.1004-129X.2020.03.007
Underwood, A., and Fremstad, A. (2018). Does sharing backfire? A decomposition of household and urban economies in CO2 emissions. Energy Policy 123, 404–413. doi:10.1016/j.enpol.2018.09.012
Underwood, A., and Zahran, S. (2015). The carbon implications of declining household scale economies. Ecol. Econ. 116, 182–190. doi:10.1016/j.ecolecon.2015.04.028
Wang, Q. C. (2015). Effects of household size on energy consumption and carbon emissions. Resour. Sci. 37 (2), 1007–7588.
Wang, S., Li, G., and Fang, C. (2018). Urbanization, economic growth, energy consumption, and CO2 emissions: empirical evidence from countries with different income levels. Renew. Sustain. energy Rev. 81, 2144–2159. doi:10.1016/j.rser.2017.06.025
Wang, Y., Li, F., and Sun, X. (2019). Progress of research on carbon emissions of urban household consumption. Resour. Sci. 41 (7), 1201–1212. doi:10.18402/resci.2019.07.02
Wang, G., and Zhou, Y. (2021). Trends, influencing factors and social connotations of family size in China. Youth Explor. 2021 (04), 41–49. doi:10.13583/j.cnki.issn1004-3780.2021.04.004
Weber, C., and Perrels, A. (2000). Modelling lifestyle effects on energy demand and related emissions. Energy policy 28 (8), 549–566. doi:10.1016/S0301-4215(00)00040-9
Weber, C. L., and Matthews, H. S. (2008). Quantifying the global and distributional aspects of American household carbon footprint. Ecol. Econ. 66, 379–391. doi:10.1016/j.ecolecon.2007.09.021
Wei, Y. M., Liu, L. C., Fan, Y., and Wu, G. (2007). The impact of lifestyle on energy use and CO2 emission: an empirical analysis of China’s residents. Energy Policy 35 (1), 247–257. doi:10.1016/j.enpol.2005.11.020
Weilu, M., Gecheng, Y., and Yongping, S. (2023). Expansion of social networks and household carbon emissions: evidence from household survey in China. Energy Policy 174 (2023), 113460. doi:10.1016/j.enpol.2023.113460
Xin-Kun, Xu, and Li-Yan, H. A. N. (2016). The impact of employment status on household consumption embodied carbon emissions: evidence from Chinese urban households. Manag. Rev. (12), 145. doi:10.14120/j.cnki.cn11-5057/f.2016.12.012
Xinkuo, Xu, and Han, L. (2017). How a consumption pattern influences household carbon emission? —microscopic evidence from China’s urban households. Southeast Acad. Res. (3), 154–163. doi:10.13658/j.cnki.sar.2017.03.019
Xu, X., Han, L., and Lv, X. (2016). Household carbon inequality in urban China, its sources and determinants. Ecol. Econ. 128, 77–86. doi:10.1016/j.ecolecon.2016.04.015
Xue, Y. Z. (2020). Empirical research on household carbon emissions characteristics and key impact factors in mining areas. J. Clean. Prod. 2020 (20), 120470–120479. doi:10.1016/j.jclepro.2020.120470
Yagita, Y., and Iwafune, Y. (2021). Residential energy use and energy-saving of older adults: a case from Japan, the fastest-aging country. Energy Res. Soc. Sci. 75, 102022. doi:10.1016/j.erss.2021.102022
Yates, L. (2018). Sharing, households and sustainable consumption. J. Consumer Cult. 18 (3), 433–452. doi:10.1177/1469540516668229
Yi Ming, W., Cui, L. L., FanYing, etc, and Wu, G. (2007). The impact of life style on energy use and CO2 emission: an empirical analysis of China’s residents. Energy Policy 35 (35), 247–257. doi:10.1016/j.enpol.2005.11.020
Ying, C., Wang, Y., and Wu, Y. (2023). Impact of house prices on household carbon emissions. Front. Environ. Sci. 11, 1149089. doi:10.3389/fenvs.2023.1149089
York, R., Rosa, E. A., and Dietz, T. (2003). STIRPAT, IPAT, and ImPACT: analytic tools for unpacking the driving forces of environmental impacts. Ecol. Econ. 46 (46), 351–365. doi:10.1016/S0921-8009(03)00188-5
Yu, M., Meng, B., and Li, R. (2021). Analysis of China’s urban household indirect carbon emissions drivers under the background of population aging. Struct. Change Econ. Dyn. 60, 114–125. doi:10.1016/j.strueco.2021.11.013
Yu, S. W., Zhang, Q., Li, H. J., Ma, W., Sun, Y., Wang, X., et al. (2023). Development of an extended STIRPAT model to assess the driving factors of household carbon dioxide emissions in China. J. Environ. Manag. 325 (2023), 116502. doi:10.1016/j.jenvman.2022.116502
Yua,b, M., Mengc, Bo, and Li, R. (2022). Analysis of China’s urban household indirect carbon emissions drivers under the background of population aging. Struct. Change Econ. Dyn. 60, 114–125. doi:10.1016/j.strueco.2021.11.013
Zhang, H., Shi, X., Wang, K., Xue, J., Song, L., and Sun, Y. (2020). Intertemporal lifestyle changes and carbon emissions: evidence from a China household survey. Energy Econ. 86, 104655. doi:10.1016/j.eneco.2019.104655
Zhang, X., Luo, L., and Skitmore, M. (2015). Household carbon emission research: an analytical review of measurement, influencing factors and mitigation prospects. J. Clean. Prod. 103, 873–883. doi:10.1016/j.jclepro.2015.04.024
Zhang, Y., Wang, F., and Zhang, B. (2022). The impacts of household structure transitions on household carbon emissions in China. Ecol. Econ. 206 (2023), 107734. doi:10.1016/j.ecolecon.2022.107734
Zhang, Y. M., Wang, F., and Zhang, B. (2023). The impacts of household structure transitions on household carbon emissions in China. Ecol. Econ. 206 (2023), 107734. doi:10.1016/j.ecolecon.2022.107734
Zhang, Q., Tian, Y., and Ma, X. (2019). Identifying the impetus of Chinese household consumption of carbon emissions in structural path analysis. Acta Sci. Nat. Univ. Pekin. 55 (2). doi:10.13209/j.0479-8023.2018.099
Zhao, M., Yuan, Z., and Chan, H. S. (2023). Housing wealth and household carbon emissions: the role of homeownership in China. Ecol. Econ. 212 (2023), 107908. doi:10.1016/j.ecolecon.2023.107908
Zhao, M. X., Yuan, Z. H., and Chan, H. S. (2023). Housing wealth and household carbon emissions: the role of homeownership in China. Ecol. Econ. 212 (2023), 107908. doi:10.1016/j.ecolecon.2023.107908
Keywords: household carbon emissions, household size, household consumption structure, the CFPS data, indirect household carbon emissions
Citation: Shao H, Yu M, Xia M, Yu D and Gao F (2024) Will the miniaturization of household size promote household carbon emissions in China? Analysis based on CFPS data. Front. Environ. Sci. 12:1382083. doi: 10.3389/fenvs.2024.1382083
Received: 05 February 2024; Accepted: 14 June 2024;
Published: 15 July 2024.
Edited by:
Huaping Sun, Jiangsu University, ChinaReviewed by:
Daoyan Guo, Xi’an University of Science and Technology, ChinaCopyright © 2024 Shao, Yu, Xia, Yu and Gao. This is an open-access article distributed under the terms of the Creative Commons Attribution License (CC BY). The use, distribution or reproduction in other forums is permitted, provided the original author(s) and the copyright owner(s) are credited and that the original publication in this journal is cited, in accordance with accepted academic practice. No use, distribution or reproduction is permitted which does not comply with these terms.
*Correspondence: Fuyang Gao, Z2FvZnV5YW5nQGN1Zy5lZHUuY24=
Disclaimer: All claims expressed in this article are solely those of the authors and do not necessarily represent those of their affiliated organizations, or those of the publisher, the editors and the reviewers. Any product that may be evaluated in this article or claim that may be made by its manufacturer is not guaranteed or endorsed by the publisher.
Research integrity at Frontiers
Learn more about the work of our research integrity team to safeguard the quality of each article we publish.