 Ye Wang
 Jie Liu2*
 Lirong Zhang
95% of researchers rate our articles as excellent or good
Learn more about the work of our research integrity team to safeguard the quality of each article we publish.
Find out more
ORIGINAL RESEARCH article
Front. Environ. Sci. , 24 June 2024
Sec. Land Use Dynamics
Volume 12 - 2024 | https://doi.org/10.3389/fenvs.2024.1380868
This article is part of the Research Topic Dynamics of Land Use and Carbon Emissions in the Context of Carbon Neutrality and Carbon Peaking View all 14 articles
Introduction: The carbon storage service of ecosystems in ecologically fragile areas is highly sensitive to regional land use/land cover (LULC) changes. Predicting changes in regional carbon storage under different LULC scenarios is crucial for land use management decisions and exploring carbon sink potential. This study focuses on the Luan River Basin, a typical ecologically fragile area, to analyze the impact of LULC changes on carbon storage.
Methods: The PLUS-InVEST model was employed to simulate LULC patterns for the year 2030 under three scenarios: natural development, cropland protection and urban development, and ecological protection. The model projected the future carbon sink potential of the basin under these scenarios.
Results: From 2000 to 2020, carbon storage showed a trend of decrease followed by an increase. By 2030, compared to 2020, carbon storage is projected to increase by 16.97% under the ecological protection scenario and decrease by 22.14% under the cropland protection and urban development scenario. The increase in carbon storage was primarily due to the conversion of cropland and grassland to forestland, while the decrease was mainly associated with the conversion of forestland to grassland and cropland, and the transformation of grassland to cropland and construction land. In the potential LULC scenarios of 2030, certain regions within the basin exhibited unstable carbon sink potential, strongly influenced by LULC changes. These areas were predominantly characterized by artificially cultivated forests, shrubs, and agricultural land. Implementing appropriate forest management measures and optimizing agricultural land management practices are essential to enhance carbon sink potential in these regions. Population density, annual average temperature, and DEM (Digital Elevation Model) were the dominant factors driving the spatial variation of carbon sink potential in the Luan River Basin.
Discussion: The research results provide a theoretical basis for rational planning of land use and the enhancement of carbon sink potential in ecologically fragile regions.
The global issue of climate change caused by carbon dioxide emissions has received attention from countries worldwide (Sarkodie et al., 2020). With the ongoing process of urbanization, China has become the world’s largest emitter of carbon dioxide (Yu et al., 2021). At the 75th session of the United Nations General Assembly in 2020, China pledged to reach its peak carbon emissions by 2030 and achieve carbon neutrality by 2060 (Li et al., 2023). Terrestrial ecosystems play a crucial role in carbon reduction and sequestration, making them important components of the global carbon cycle (Liu et al., 2023). The significance of terrestrial ecosystems in reducing carbon emissions and mitigating global warming has made them a major research hotspot worldwide in recent years (Tang et al., 2018; Piao et al., 2022; Wang H. W. et al., 2023a). Research has shown that LUCC is one of the important factors that influence the carbon cycling process in terrestrial ecosystems and cause regional changes in carbon balance (Zhao M. M. et al., 2019b; Zhu et al., 2019; Aneseyee et al., 2022).
There are multiple methods for estimating regional carbon storage. Traditional estimation methods such as the storage accumulation method and biomass method have demonstrated high accuracy in calculating carbon stocks at small spatial scales (Fang et al., 2001; Brown, 2002; Boothandford et al., 2014). However, traditional methods for estimating carbon stocks have limited accuracy in large-scale studies, and is difficult to analyze the dynamic changes and spatial distribution of regional carbon stocks. As information technology advances, carbon stock estimation methods primarily based on modeling have emerged. In comparison to other model methods (McGuire et al., 1992; Neilson, 1995; Sitch et al., 2003), the InVEST model has the advantage of requiring less input data and having faster computation speed (Bagstad et al., 2013). It allows for the spatial mapping of carbon stock distribution and dynamic changes, providing insights into the relationship between LULC changes and carbon stocks (Posner et al., 2016). Currently, the InVEST model has been widely applied in spatial planning, ecological compensation, risk management, climate change adaptation, and other environmental management decisions in various countries and regions. Scholars have utilized the carbon stock module to explore the impact of LULC changes on carbon stocks in terrestrial ecosystems (He et al., 2016; Li Y. H. et al., 2022a; Xu et al., 2023).
LULC scenario simulation plays a pivotal role in accurately assessing and quantifying the impact of LULC change on ecosystem carbon storage (Liu et al., 2023). Currently, the combination of the InVEST model and LULC data has been used to calculate regional carbon stocks. Furthermore, land prediction models have been employed to forecast future LULC patterns and changes in carbon stocks at the regional level. In existing land prediction models, FLUS (Gu et al., 2022; Xiang et al., 2022), CLUE-S (Islam et al., 2021; Kiziridis et al., 2023), and CA-Markov (Alhameedi et al., 2022; Zhang et al., 2023) have been widely used. However, these models primarily focus on improving modeling techniques, model rules, and accuracy, while paying less attention to exploring the underlying driving forces behind land cover change (Sohl and Claggett, 2013). The PLUS model integrates the Land Expansion Analysis Strategy (LEAS) and a Cellular Automata (CA) model based on multi-type random patch seeds. On one hand, LEAS incorporates the advantages of traditional conversion analysis strategies, allowing for a better exploration of the driving factors behind various LULC changes. On the other hand, the CA model, combined with random seed generation and threshold decay mechanisms, can simulate LULC changes at the patch level more effectively. The PLUS model possesses powerful data mining capabilities and the ability to model land changes at the patch level, offering great potential for applications such as optimizing land resource allocation and defining urban expansion boundaries (Liang et al., 2021). The coupling of the InVEST and PLUS models has been widely used for the calculation and prediction of carbon stocks. Wang R. Y. et al. (2023b) used the PLUS and InVEST models to simulate and predict the spatial development pattern of LULC as well as the changes in carbon stocks in the Greater Bay Area in China in 2030 under multiple scenarios. Kulaixi et al. (2023) utilized the PLUS-InVEST model to examine the spatiotemporal distribution and changing patterns of carbon storage under multiple scenarios in an Arid Inland River Basin in Xinjiang, China. Cui et al. (2023) used the PLUS model to simulate the future four LULC scenarios and the ecosystem carbon storage was assessed by the InVEST model in Guangdong, China.
The Luan River Basin possesses abundant vegetation resources and serves as an important ecological barrier in the Beijing-Tianjin-Hebei region of China (Xu et al., 2020). Moreover, due to its location in the agricultural-pastoral transitional zone and constraints imposed by precipitation and temperature, it has become a typical ecologically fragile area in northern China. Currently, studies on carbon stocks in the Luan River Basin primarily focus on the analysis of historical changes and the prediction of future trends. He et al. (2022) explored and predicted the spatiotemporal link between changes in LULC and carbon storage by coupling the FLUS model and InVEST model in China’s Beijing-Tianjin-Hebei region, including the Luan River Basin. Guo et al. (2022) simulated the 2030 carbon storage and explored its spatial-temporal characteristics under three different scenarios. The above results provide scientific knowledge for the study of carbon storage in the Luan River Basin. However, the quantitative impact of LULC change on carbon storage remains uncertain, and there is a lack of discussion on carbon sink potential.
In the above context, this study primarily analyzes the following issues regarding the impact of LULC changes on carbon storage and future carbon sink potential: 1) How will potential LULC changes in 2030 affect the carbon storage in the basin? 2) What impact do transitions between different LULC types have on changes in carbon storage? Which LULC transitions primarily affect changes in carbon storage? 3) Based on the potential future LULC changes, what are the distribution characteristics of carbon sink potential? Considering the different characteristics of carbon sink potential zones, how can carbon storage in ecologically fragile areas be enhanced?
The Luan River Basin is situated in the northeast part of the North China Plain, spanning between 39°10′-42°35′ N and 115°20′-119°15′ E (Figure 1). It originates from Fengning County and flows into the Bohai Sea in Leting County, covering a total length of approximately 877 km and an area of 44,880 square kilometers. The landforms within the basin are diverse and complex, with the upper reaches being dominated by plateaus and mountainous hills, the middle reaches by the Yan Mountains, and the lower reaches by the flat Hebei Plain. The terrain slopes from northwest to southeast, and there is a notable difference in climate between the north and the south. The climate varies notably from north to south, with a transition from cold-temperate arid and semi-arid climate to warm-temperate semi-humid climate. The average annual temperature is between 1°C and 11°C and the average annual precipitation ranges from 400 to 800 mm (Zeng et al., 2012). The Luan River Basin is characterized by interlaced zones of agriculture, pastoralism, and forestry, leading to complex relationships among ecosystem services. It is a typical ecologically fragile area in northern China.
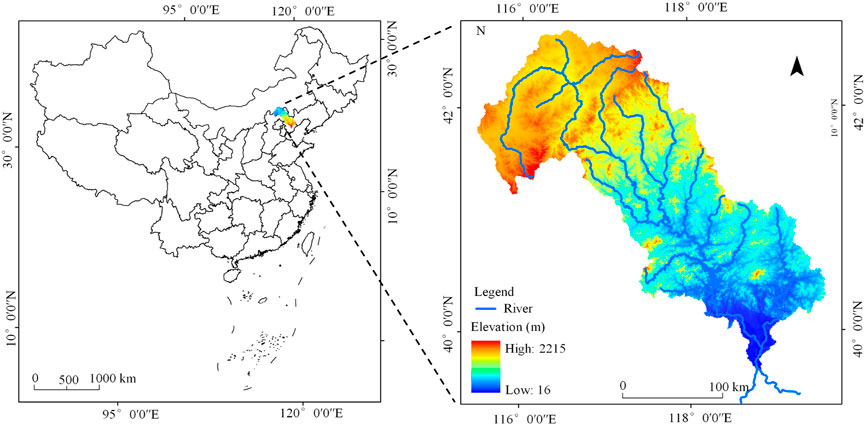
Figure 1. The geographical location and elevation map of the Luan River Basin.
The LULC data for the Luan River Basin in the years 2000, 2005, 2010, 2015, and 2020 were obtained from the Geospatial Data Cloud (https://www.gscloud.cn/), with a spatial resolution of 30 m. After cropping and projection, the LULC data were reclassified into six categories: cropland, forestland, grassland, water body, construction land, and unused land. The ArcGIS 10.0 Hydrology tool was utilized to delineate sub-basins in the Luan River Basin, based on DEM data. Taking into account both natural and socio-economic conditions, and based on the principles of driver accessibility, timeliness, and significance, 11 driving factors were selected to predict the LULC distribution in the Luan River Basin under different scenarios for the year 2030 (Table 1).
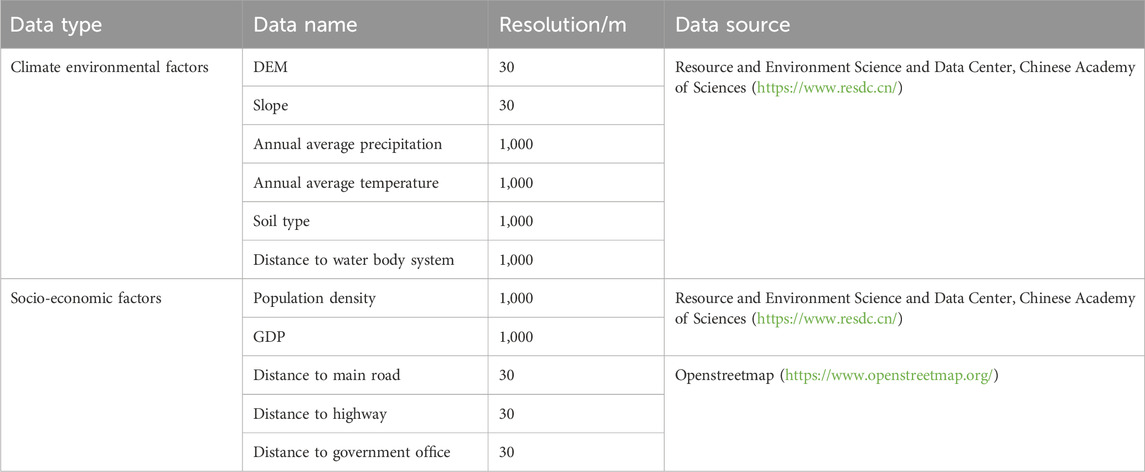
Table 1. Data and sources.
Carbon storage was calculated based on the InVEST model, which simulates carbon storage based on the LULC data of each period and the corresponding carbon density using the following formula (Li Y. X. et al., 2022b) (see Eqs 1, 2).
Where
The construction of the carbon density database primarily relied on measured data from existing literature. Priority was given to carbon density values obtained from field surveys conducted in the Luan River Basin (Xu et al., 2019). For data where reference literature was lacking, it was supplemented using research literature from neighboring areas (Li et al., 2004; He et al., 2022). If there were still gaps, carbon density data for six land types could be obtained based on the following carbon density correction formula (Zhang and Zhang, 2009; Alam et al., 2013) (see Eqs 3–6).
Where
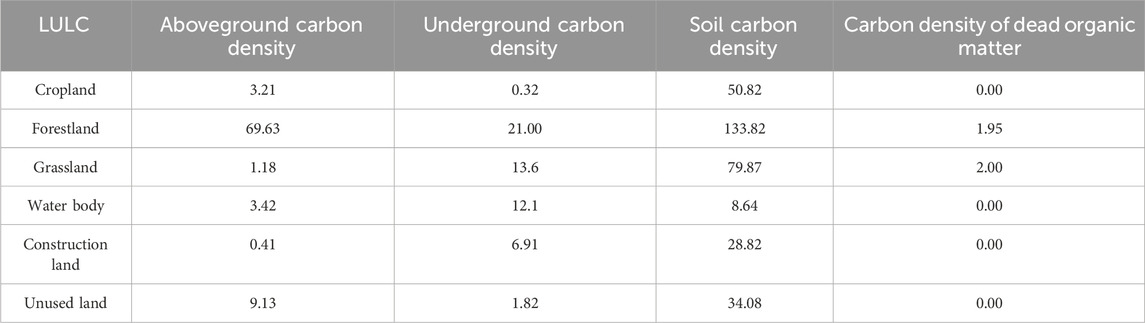
Table 2. Carbon density of different LULC types (t/ha).
The PLUS model is a fine-scale LULC prediction model developed based on the FLUS model, taking into account the policy-driven guidance effect in LULC planning (Liang et al., 2021; Gao et al., 2022). Based on LULC data from 2010 to 2020 in the Luan River Basin, this study utilized the driving factors as predictor variables to calculate the suitability probabilities for different LULC types. Using the 2010 LULC data as the baseline, the PLUS model was employed to simulate the LULC data for 2020. The simulated results were compared with the actual data for 2020, resulting in a Kappa coefficient of 0.81, indicating a high level of reliability in the simulation results (Zadbagher et al., 2018; Liu et al., 2022).
The neighborhood weights represent the expansion capacity of different LULC types. In this study, the neighborhood weights were calculated using the dimensionless values of the LULC-type area changes in the Luan River Basin from 2010 to 2020 (Table 3).

Table 3. The neighborhood weights of different land use types.
The “Land and Spatial Planning Announcement of Hebei Province (2021-2035)" was released in September 2021. It proposed the establisent of the ecological security barrier, implementation of cropland protection measures, and promotion of coordinated urban development. The Luan River Basin has irrigated nearly 21% of the irrigated areas in Hebei Province and has supported about 20% of the population, accounting for nearly 30% of the province’s GDP. Therefore, based on the ecological and economic role played by the Luan River Basin, different LULC scenarios for the year 2030 were simulated using the PLUS model to meet various development needs. The LULC transition matrix represented the conversion rules between different LULC types. When one LULC type could be converted into another, the corresponding value in the matrix was 1; otherwise, it was 0. The three scenarios are shown in Table 4. Parameters and weights used in the simulation of suitability maps are shown in Supplementary Table S1. These scenarios are as follows:
1) Natural Evolution Scenario (S1). Based on the transition probabilities from 2010 to 2020, the LULC structure for the year 2030 was predicted, allowing for free conversion between different LULC types.
2) Cropland Protection and Urban Development Scenario (S2). The priority was given to the development of construction land while strictly controlling the conversion of cropland to LULC types other than construction land. This scenario aimed to meet the demands of economic development while ensuring the protection of agricultural land.
3) Ecological Protection Scenario (S3). Under the requirements of ecological conservation, strict control measures were implemented for the conversion of forestland, grassland, and water bodies. Forestland and grassland could be converted into each other but could not be converted into other land types. On the other hand, other land types could be converted into forestland and grassland.
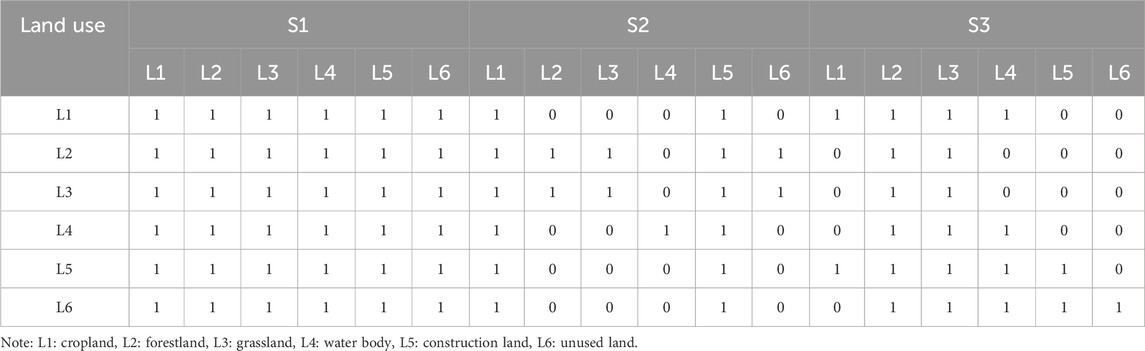
Table 4. LULC transfer matrix under different scenarios.
The spatial distribution patterns of the input driver parameters for LULC change, along with the corresponding changes in carbon sink, were analyzed using an exploratory spatial data analysis (ESDA) technique, specifically spatial autocorrelation through GeoDa-1.20.0 software (Hoque et al., 2019b; Zhang et al., 2019). Spatial autocorrelation, as assessed by Local Indicators of Spatial Association (LISA), reveals four distinct types of spatial clusters at the local level: High-High (HH), High-Low (HL), Low-High (LH), and Low-Low (LL) (Hoque et al., 2019b; Zhang et al., 2019).
Geodetector is a set of statistical methods used to detect spatial heterogeneity and reveal the underlying drivers. Its core idea is based on the assumption that if a certain independent variable significantly influences a dependent variable, then the spatial distribution of both variables should exhibit similarity (Wang et al., 2016; Lin et al., 2019). Discrimination and factor detection involve comparing the total variance of the study area with the sum of variances in the classified sub-regions to detect spatial heterogeneity in Y or determine the extent to which a factor X explains the spatial heterogeneity of attribute Y. The results are measured using the q-statistic. We utilized discrimination and factor detection in Geodetector to analyze the explanatory power of different drivers on the spatial heterogeneity of carbon sink potential.
Figures 2, 3 respectively illustrate the overall changes in total area and transfer directions of various LULC types from 2000 to 2020 and in 2030 under different scenarios. From 2000 to 2020, the area of cropland, grassland, water bodies, and unused land decreased, while the area of forestland and construction land increased. During the period from 2000 to 2010, the area of cropland decreased, while the areas of forestland increased. This was mainly due to the implementation of the national policy of the Grain for Green Project (Zhao A. Z. et al., 2019a), which resulted in a notable transfer of cropland to forestland. Additionally, the rapid process of urbanization led to a large-scale encroachment of cropland for construction purposes. From 2010 to 2020, the area of forestland continued to increase, while the area of cropland further decreased. This can be attributed to the further development of the Grain for Green Project and the strong promotion of the “Three-North' Shelterbelt by the government (Mu et al., 2017), which led to a continuous transfer of cropland to forestland. According to the set features of potential LULC scenarios in 2030, S1 continued the LULC change characteristics from 2000 to 2020, with a continuous decrease in cropland and grassland areas and a consistent increase in forestland and construction land. In S2, driven by socio-economic development as a force for LULC change, the areas of cropland and construction land experienced increases, while the areas of forestland and grassland decreased accordingly. In S3, agricultural land and urban land were strictly restricted, and ecological land saw development, mainly reflected in the increase of forestland and grassland areas.
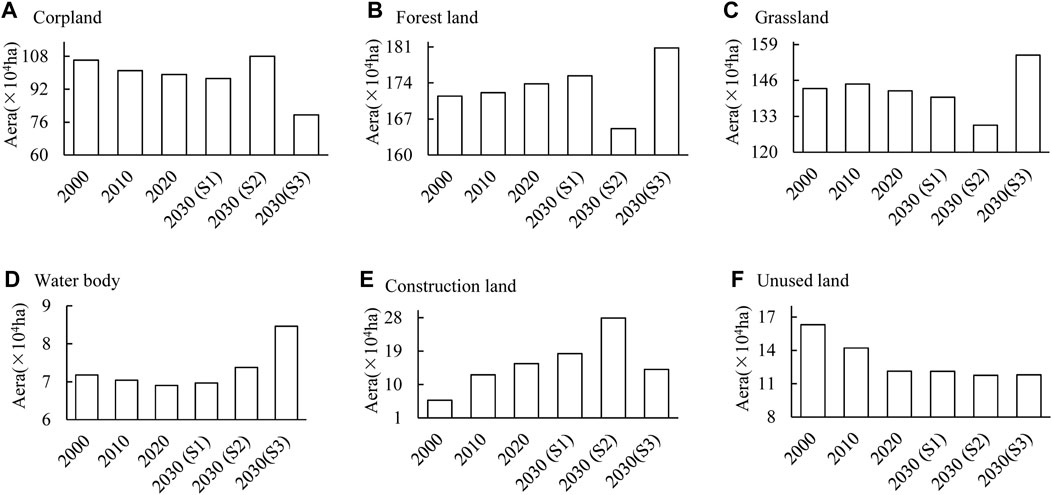
Figure 2. The LULC area change from 2000 to 2030. (A) Corpland, (B) Forest land, (C) Grassland, (D) Water body, (E) Construction land, (F) Unused land.
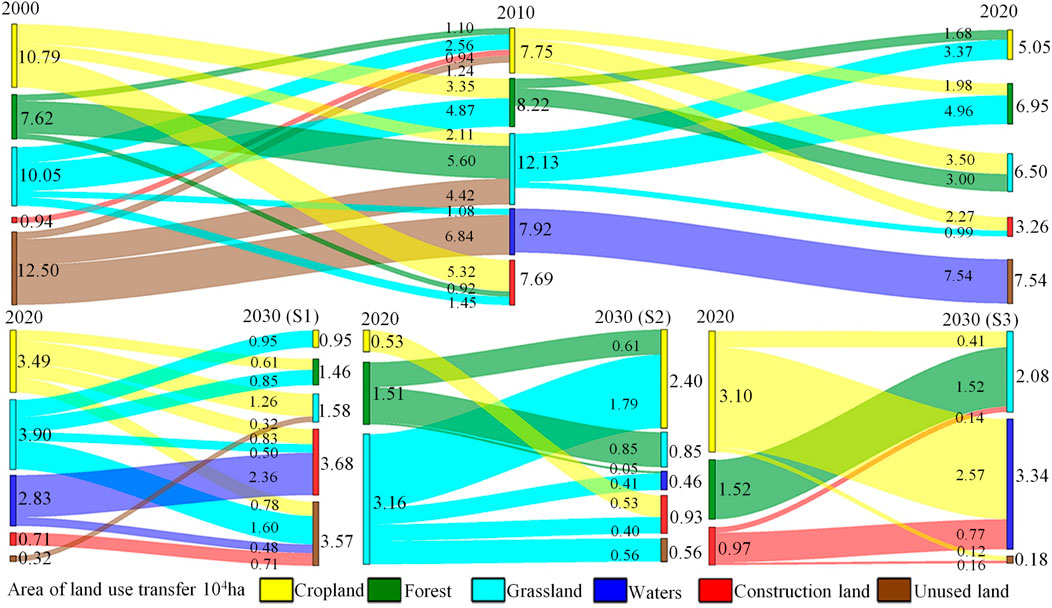
Figure 3. Sankey map of LULC type transfer from 2000 to 2030.
From the spatial distribution perspective (Figure 4), cropland is primarily distributed in the upstream and downstream areas of the basin, specifically in the North China Plain. Grassland is mainly located in the higher-altitude Inner Mongolia Plateau region in the upstream of the basin. Forestland is distributed in the Yan Mountain range in the middle reaches of the basin, while construction land is mainly concentrated in the urban clusters in the middle and lower reaches of the basin. In the LULC scenarios for 2030, in S1 and S2, there was a notable expansion of construction land in the central and southern regions of the basin, while grassland exhibited varying degrees of degradation. In S3, grassland in the northern and central parts experienced recovery.
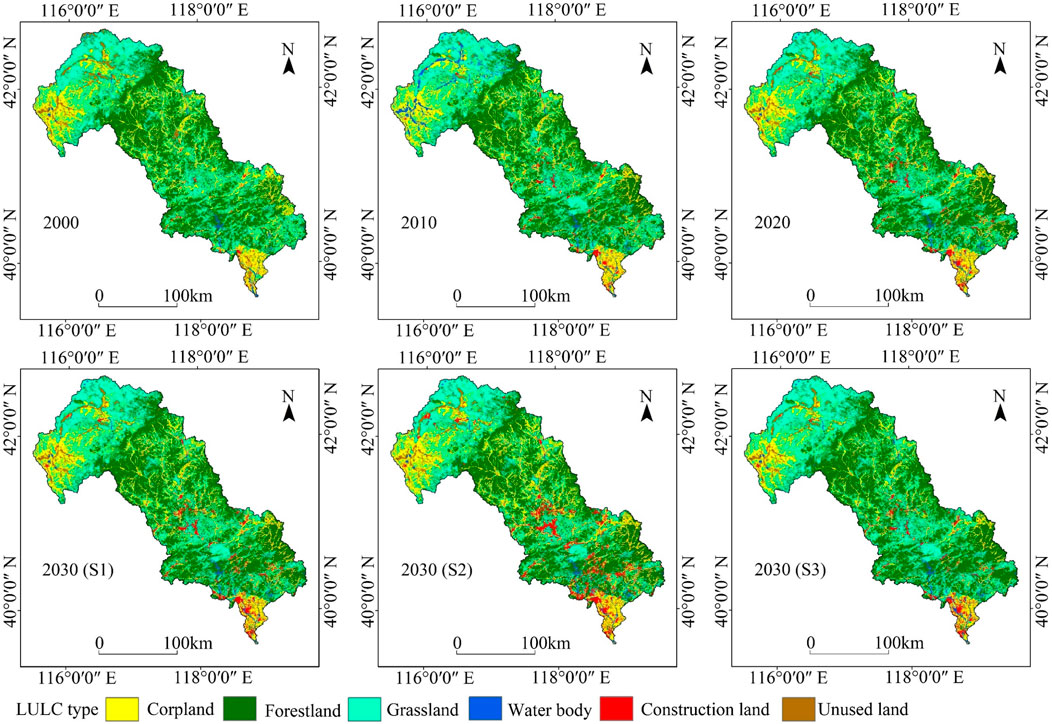
Figure 4. Spatial distribution of LUCC from 2000 to 2030.
Figure 5 presents carbon storage and its changes from 2000 to 2030. In the years 2000, 2010, and 2020, carbon storage was 588.79 × 10⁶ t, 588.06 × 10⁶ t, and 591.17 × 10⁶ t, respectively, showing an overall weak trend of change. In 2030, compared to 2020, in S1, carbon storage was 592.39 × 10⁶ t, with a small change. In S2, carbon storage underwent a decrease to 569.03 × 10⁶ t, with a change rate of −22.14%. In S3, carbon storage increased markedly to 608.14 × 10⁶ t, with a change rate of 16.97%.

Figure 5. The carbon storage changes from 2000 to 2030.
The spatial distribution of carbon storage in the Luan River Basin exhibited a pattern of higher values in the middle region of the basin and lower values in the northern and southern parts (Figure 6). This spatial distribution pattern remained relatively stable over time with minimal changes. The areas with high carbon storage in the Luan River Basin were concentrated in the middle region, specifically in the Yan Mountains. This region experienced slower urban development and lower land development, resulting in higher vegetation coverage.
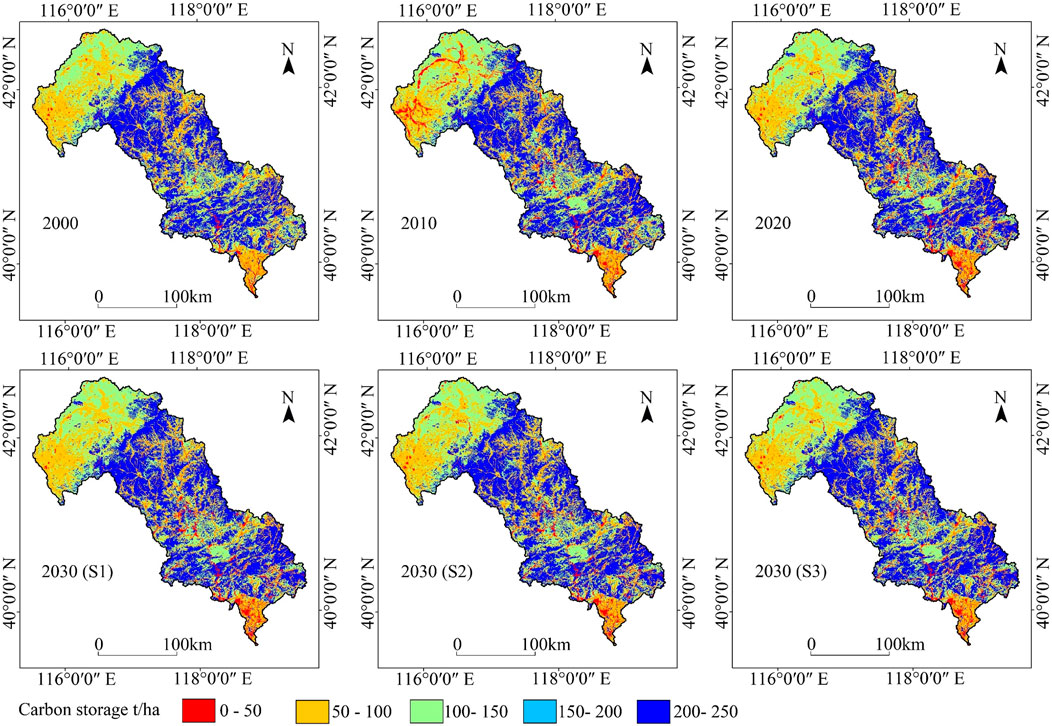
Figure 6. Spatial distribution of carbon storage from 2000 to 2030.
Conversely, the areas with low carbon storage were concentrated in the northern and southern parts. The northern part, belonging to the southern edge of the Inner Mongolia Plateau, had higher altitudes and lower precipitation. It was economically developed in agriculture and animal husbandry, featuring widespread cropland and grassland. The southern part, mainly situated in the northern part of the North China Plain forming the Luan River Delta, had a flat terrain, high urbanization level, intense land development and utilization, dense population, and high demand for construction land. This region included parts of the Bohai Sea urban agglomerations where ecological space was notably encroached upon due to urbanization. Consequently, areas with high carbon storage, such as forestland, cropland, and grassland, were relatively scarce and scattered in this urbanized region. Taking into account the changes in LULC structure in the Luan River Basin, the spatial distribution pattern of carbon storage was closely related to the LULC types in the region. LULC changes had a substantial impact on regional carbon storage, with ecological land playing a more prominent role in the variation of carbon storage.
To explore spatial autocorrelation, Moran’s I values were calculated and found to be 0.5912 (2020), 0.5833 (2010), 0.5921 (2020), 0.5933 (2030-S1), 0.5929 (2030-S2), and 0.5934 (2030-S3). All the computed results are greater than 0, indicating that there is a certain degree of spatial clustering in carbon storage across the Luan River Basin. The distribution of carbon storage hot spots in the Luan River Basin shows minimal variation, with hot spots predominantly found in the middle and upper reaches of the basin, while cold spots are concentrated in the upstream and downstream regions (Figure 7). In 2030, the scenario S3 showed the largest increase in the area of carbon storage hot spots, while the scenario S1 had the smallest increase in the area of carbon storage hot spots.
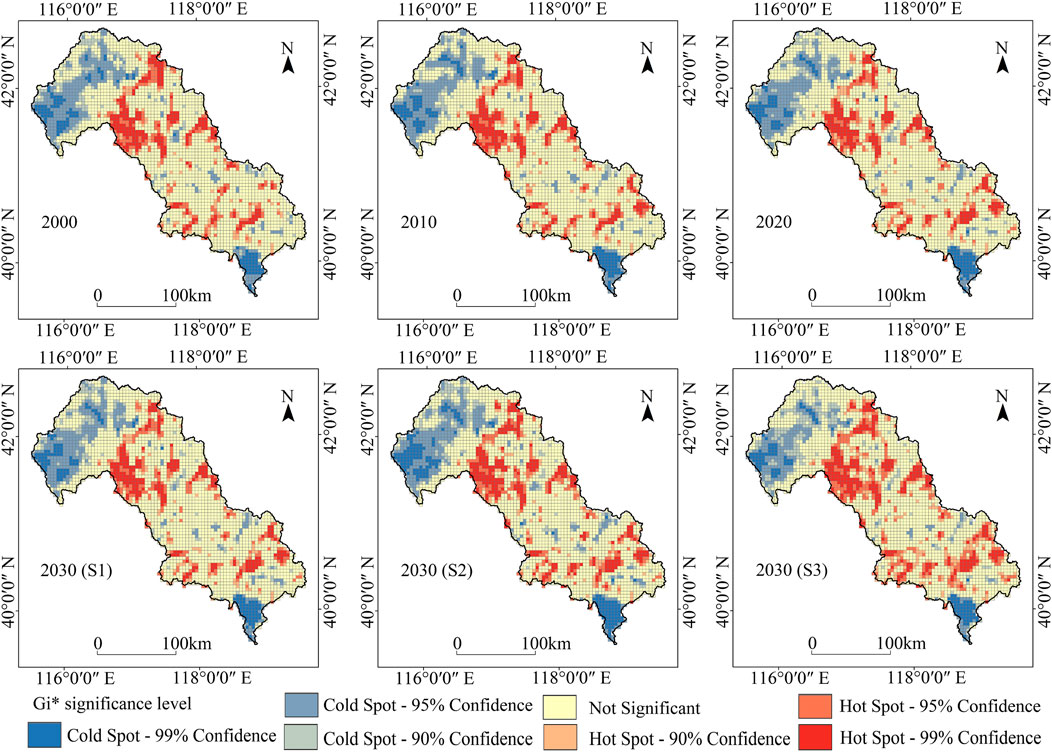
Figure 7. Hot spot distribution of carbon storage from 2000 to 2030 in the Luan River Basin.
Figure 8 illustrates the proportion and changes in carbon storage of various LULC types from 2000 to 2030 under different scenarios. The sum of carbon storage in forestland, grassland, and cropland exceeded 96%, making them the main contributors to the basin’s carbon storage, while water bodies contributed less than 0.5%. The changes in carbon storage in each period indicated a increase in carbon storage in construction land from 2000 to 2010 and 2010 to 2020, with the most noticeable decrease in carbon storage in unused land. In 2030 under different scenarios, there was a increase in carbon storage in construction land in S1 and S2, while the carbon storage in cropland for S1 and grassland for S2 decreased markedly. The carbon storage in water bodies increased markedly in S3, while the carbon storage in cropland decreased notably.

Figure 8. Carbon storage percentage and change rate for each LULC type.
The transfer of carbon storage between different LULC types (Figure 9) showed that from 2000 to 2010, the increase in carbon storage mainly came from the conversion of cropland and grassland to forestland, while the decrease was mainly due to the conversion from forestland to grassland. From 2010 to 2020, the increase in carbon storage mainly came from the conversion of grassland to forestland, while the decrease was mainly due to the conversion from forestland to grassland and cropland.
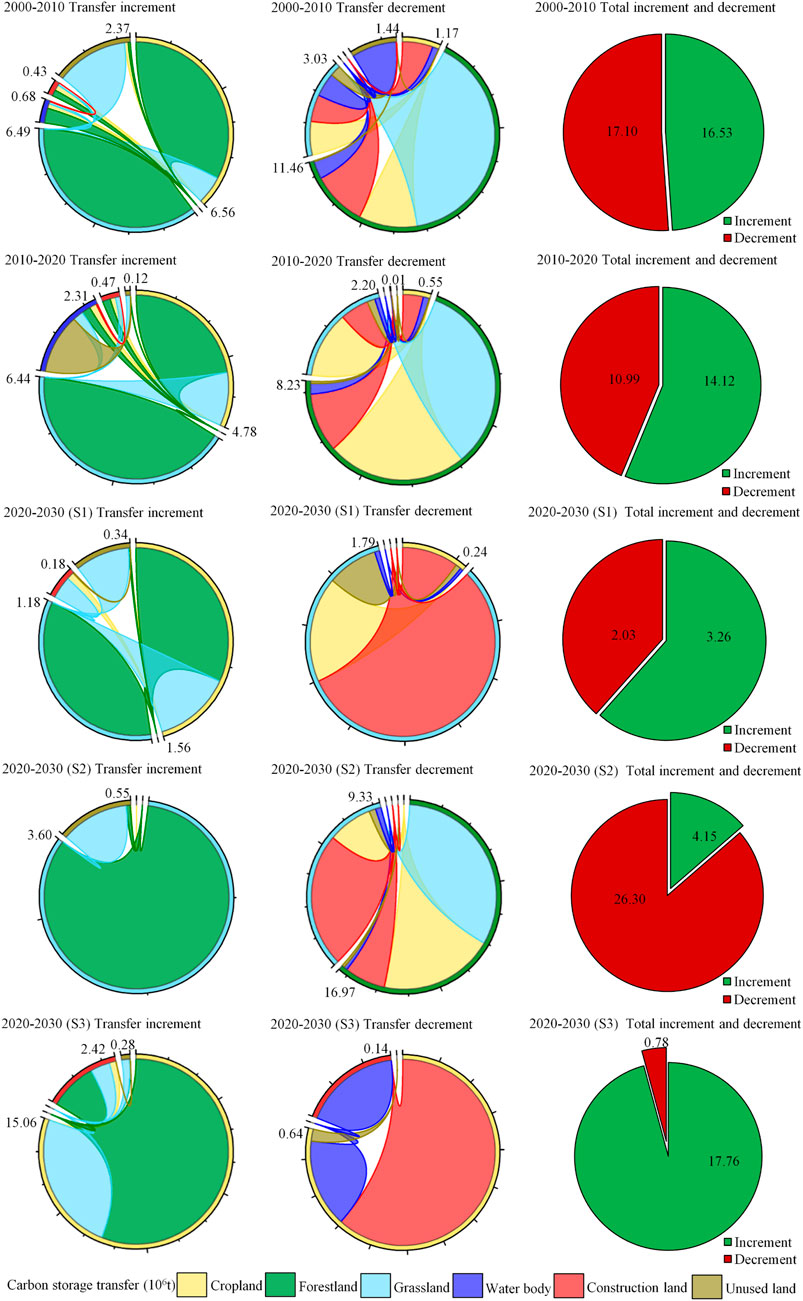
Figure 9. Carbon storage transfers between LULC types from 2000 to 2030.
From 2020 to 2030, the increase in carbon storage in S1 mainly came from the conversion of cropland and grassland to forestland, while the decrease was mainly due to the conversion from grassland to construction land. The increase in carbon storage in S2 and S3 mainly came from the conversion of grassland and cropland to forestland. The conversion from forestland to cropland and grassland to construction land was the main reason for the decrease in carbon storage in S2. The main reason for the decrease in carbon storage in S3 was the conversion from cropland to construction land. Overall, the increase in carbon storage at each period mainly came from the conversion of other LULC types to forestland, while the conversion from forestland, grassland, and cropland to other low carbon density LULC types was the main reason for the decrease in carbon storage.
At the sub-basin scale, the rate of carbon storage changes between each scenario in 2030 and the year 2020 was calculated (Figure 10). The sub-basins with an average carbon storage change rate exceeding 10% are classified as high carbon sink potential areas (H), those ranging from −10% to 10% are categorized as medium carbon sink potential areas (M), and those below −10% are designated as low carbon sink potential areas (L). By comparing the three scenarios, this study found that the high carbon sink potential area was the largest in S3. This was mainly due to ecological activities such as vegetation restoration and intensive LULC in some sub-basins, increasing the area of forestland and grassland, and consequently an increase in regional carbon storage. On the other hand, the S2 had the smallest high carbon sink potential area, mainly due to drastic LULC changes, extensive vegetation destruction, and continuous expansion of construction land, leading to a reduction in carbon sink areas and a decline in carbon storage.
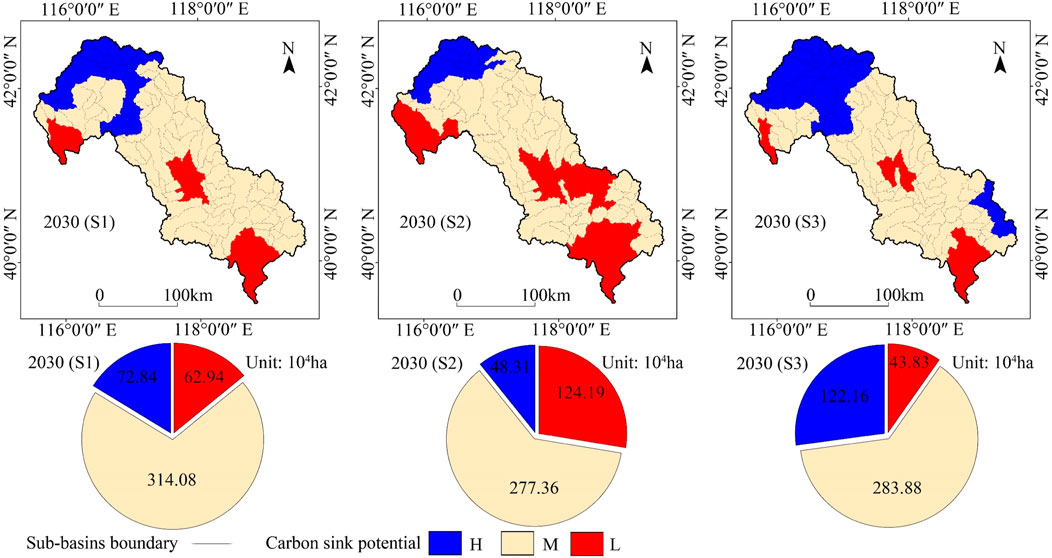
Figure 10. Carbon sink potential distribution and area proportions in different scenarios in 2030.
Based on the carbon sink potential under three potential LULC scenarios in 2030, the Luan River Basin is divided into seven carbon sink potential zones (Table 5). The High Growth Zone (Z1), located in the northern part of the basin, exhibits consistently high carbon sink potential under all scenarios, with a change rate ranging from 13.99% to 21.37%, indicating stable growth in carbon storage in this region. The Moderate Growth Zone (Z2) shows relatively high carbon sink potential under S1 and S3, with a change rate of 10.78%–14.18%. However, excessive expansion of cropland and urban land areas may impact the stability of carbon storage growth in this zone. The Low Growth Zone (Z3) only exhibits high carbon sink potential under S3, with a change rate of 7.66%–13.72%, indicating that an increase in forestland and grassland areas will effectively enhance carbon storage in this region.
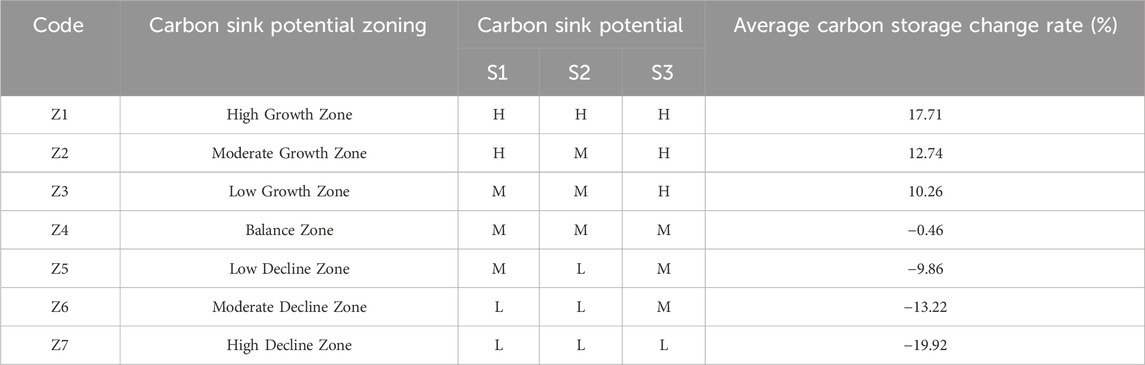
Table 5. Characteristics of carbon sink potential zoning in 2030.
The Balance Zone (Z4), located in the central part of the basin, shows a moderate level of carbon sink potential under all scenarios, with a change rate ranging from −9.45% to 12.17%. This suggests that carbon storage in this zone tends to stabilize, with relatively minor impacts from future LULC changes. The Low Decline Zone (Z5) has lower carbon sink potential under S2, with a change rate of −11.77% to −7.31%, indicating a slight declining trend in carbon storage due to excessive expansion of cropland and urban land areas. The Moderate Decline Zone (Z6) exhibits lower carbon sink potential under S1 and S2, with a change rate of −15.11% to −11.07%. However, an increase in forestland and grassland areas will alleviate the decline in carbon storage in this zone. The High Decline Zone (Z7), mainly located in the central and southern parts of the basin, shows consistently lower carbon sink potential under all scenarios, with a change rate of −25.22% to −16.22%, indicating a continuous decline in carbon storage in this region (Figure 11).
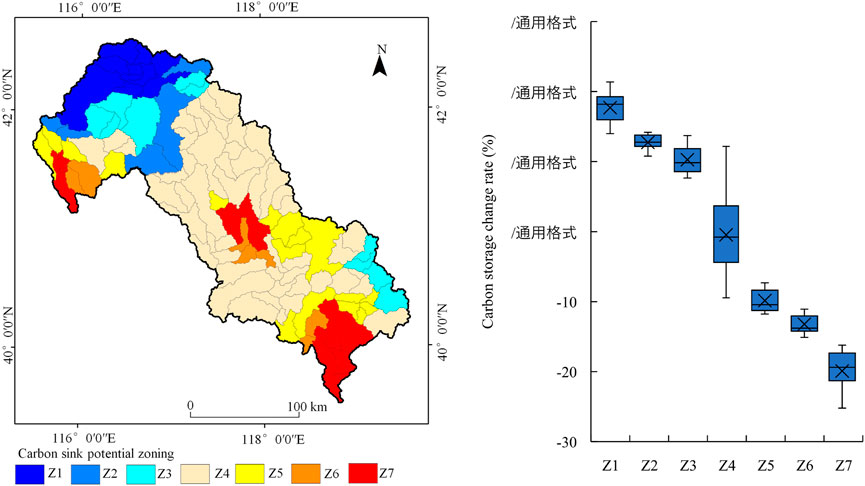
Figure 11. Carbon sink potential zones and the change rate of carbon storage in each zone in 2030.
The spatial auto-correlation analysis (Figure 12) revealed a distribution pattern characterized by clear clustering, with predominant occurrences of High-High (HH) and Low-Low (LL) types of clusters, and only a few instances of High-Low (HL) or Low-High (LH) spatial outliers Supplementary Figure S2).
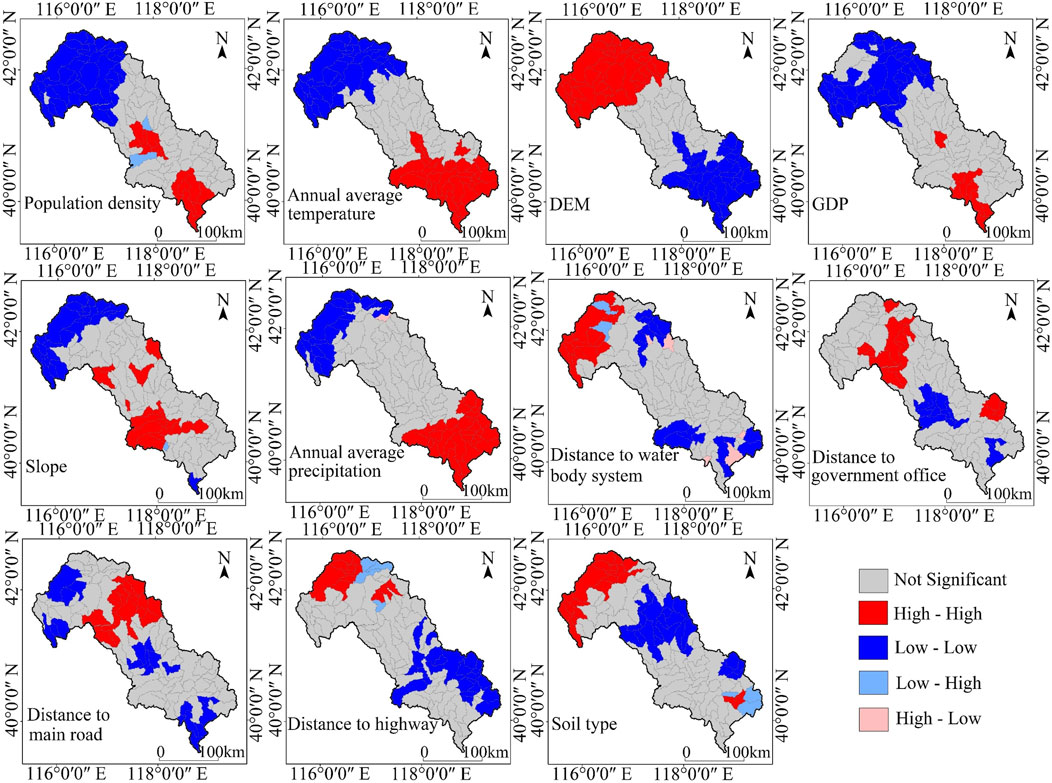
Figure 12. Spatial heterogeneity LISA cluster map of drivers.
Figure 13 illustrates the ranking of the importance of driving factors. Except for factors such as soil type, distance to highway, distance to main road, and distance to government office, all other driving factors are greater than 25%. After screening, the driving factors with relatively high importance are obtained: population density, annual average temperature, DEM, GDP, slope, annual average precipitation, and distance to water body system have relatively high q values, with the q value of population density reaching 0.775. This indicates that natural environmental factors such as population density have strong explanatory power for the spatial distribution of carbon sink potential.
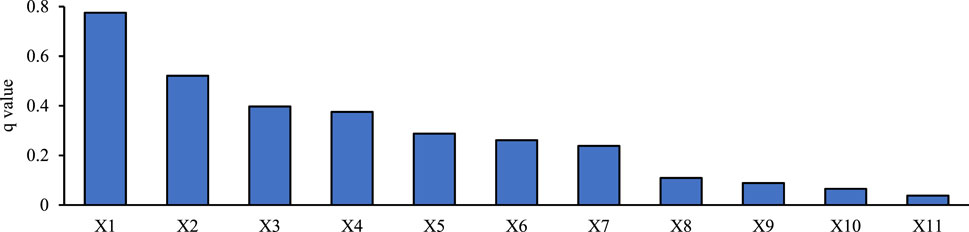
Figure 13. Rank of the importance of drivers. Note.X1: Population density, X2: Annual average temperature, X3: DEM, X4: GDP, X5: Slope, X6: Annual average precipitation, X7: Distance to water body system, X8: Distance to government office, X9: Distance to main road, X10: Distance to highway, X11: Soil type.
This study indicated that the carbon storage in the Luan River Basin showed an overall increasing trend from 2000 to 2020, primarily due to the conversion of cropland and grassland into forestland. These research findings were consistent with the results of some other scholars’ studies. Cui (Cui et al., 2019) showed that although carbon storage in the BTH (Beijing-Tianjin-Hebei) region decreased year by year from 1990 to 2015, there was an increase in the northern part, specifically in the Luan River Basin. He (He et al., 2022) demonstrated through scenario simulations that the main reason for the increase in carbon storage in the BTH region was the expansion of forestland and grassland areas.
Starting from the year 2000, various ecological projects, such as reforestation, protection of natural forests, and afforestation, have been extensively carried out in China. As a result, the forestland vegetation has entered an early stage of succession, leading to a enhancement in carbon storage capacity. With rapid socio-economic development, the expansion of cropland and construction land has led to a decrease in the area of forestland, grassland, and other land types in some areas of the Luan River Basin, resulting in a decline in carbon storage. The lower reaches of the Luan River Basin had lower elevations and gentle slopes, making them suitable for human habitation. However, excessive land development has led to a lower ecological environment quality, consequently reducing carbon storage. In contrast, the middle reaches of the Luan River Basin consisted of higher elevations and steeper slopes in mountainous areas, with less human disturbance and higher vegetation coverage, primarily dominated by forestland. The favorable ecological environment promoted plant growth, leading to higher carbon storage in this region. The upper reaches of the Luan River Basin were characterized by higher elevations, and limited precipitation, and predominantly consisted of shrub forests and grasslands with lower water demands. The rapid development of agriculture and animal husbandry in this area has resulted in a decline in habitat quality, indirectly affecting carbon storage.
Carbon sink potential refers to the potential increase in carbon storage in a given region compared to its historical carbon stocks. Predicting carbon sink potential is beneficial for effective carbon emissions management and plays a crucial role in achieving sustainable development (Meng et al., 2023). This study determined the carbon sink potential of the Luan River Basin for the year 2030 at the sub-basin scale. A sub-basin is a closed area where local surface water and groundwater naturally converge within a watershed. At the sub-basin scale, spatial differences in climate and underlying surface characteristics are relatively small, making it more suitable for managing carbon sink potential compared to administrative divisions. The Luan River Basin is located in the transitional zone between agriculture and animal husbandry in China and is considered an ecologically fragile area. Carbon storage in this region is sensitive to future changes in land-use structures (Vizcaino et al., 2020). Economic development leads to the expansion of agricultural and urban land, resulting in a decline in regional carbon sink potential (He et al., 2016). The increase in ecological land improves regional carbon sink potential but may impact socio-economic development to some extent (Yang et al., 2020). Economic development and population growth should not only pursue speed but also aim for high-quality development, maintaining coordination between the economy and the ecological environment, enhancing the value of regional ecosystem services, and increasing regional carbon sink capacity (Babbar et al., 2021). Therefore, a carbon sink potential zoning based on future land-use changes is conducive to the sustainable development of regional carbon storage services and socio-economics.
This study assessed the carbon sink potential under three typical land-use scenarios for 2030, resulting in the identification of seven carbon sink potential zones. The High Growth Zone exhibited stable growth in carbon storage under all scenarios, but being located in the Inner Mongolia Plateau area, vegetation growth is highly influenced by climate conditions. The Balance Zone, located in the mountainous area in the middle of the basin, has the largest proportion of carbon storage in the basin. With extensive original forests and strict ecological protection policies limiting the conversion of forestland to other LULC types, the carbon storage in this area tends to remain stable. The High Decline Zone showed a declining trend in carbon storage under all scenarios, mainly located in the southern and central parts of the basin, characterized by high population density and economic development. Due to the high proportion of agricultural and construction land, which is expected to further expand in the future, there is a risk of further decline in carbon sink potential in this region. The Moderate Growth Zone and Low Growth Zone, mainly located in the northern part of the basin, feature extensive artificially planted forests and shrubs. They possess a certain potential for improving carbon sequestration and are crucial for raising the upper limit of basin carbon storage (Li et al., 2023; Liu et al., 2023). The Moderate Decline Zone and Low Decline Zone face the risk of declining carbon sink potential, crucial for raising the lower limit of basin carbon storage. This region, mainly located in the central and southern parts of the basin, has a high proportion of agricultural land. Improper measures in the agricultural production process can lead to severe damage to the planting conditions of cultivated land, reducing soil carbon density and, consequently, the carbon sink potential. Although under the policy of returning cropland to forestland, the restoration of vegetation on cultivated land increases both above-ground and below-ground biomass, extensive farming practices still affect the carbon cycling process in cultivated land systems (Wang et al., 2023).
Based on the findings of this study, the following recommendations are provided: The carbon sink potential in the Luan River Basin exhibits uneven spatial distribution, with a significant proportion of forest carbon sinks and high carbon sequestration rates in the upper and middle reaches. Horizontal carbon compensation and trading can be conducted with downstream areas to strengthen low-carbon exchanges and cooperation. While leveraging their own resource advantages for economic benefits, efforts should be made to address potential “ecological deficits' in downstream areas. Conversely, the downstream areas, characterized as low-value carbon sink zones in the Luan River Basin, have fewer forest carbon sinks. Therefore, measures such as afforestation or increasing urban green spaces should be implemented to enhance the region’s carbon sequestration capacity. In future scenario projections, there are considerable differences in the carbon sink potential structure of the Luan River Basin, particularly under S2, where there is a notable decline in carbon sink potential. To address this, optimizing the land use structure for carbon sinks and adjusting the proportions of various carbon sink land types are recommended. Forests are the main contributors to carbon sinks in the Luan River Basin but face the risk of shrinking in size. Planning and establishing forest nature reserves, implementing afforestation programs, and practicing reforestation can stabilize and enhance the carbon sequestration capacity of regional forests. Additionally, grassland resources should be protected to prevent further degradation trends in the northern part of the basin. Unused land, due to its weak carbon sink potential and prevalence in areas unsuitable for large-scale development (such as the Inner Mongolia Plateau), can be managed for sustainable carbon sequestration by restoring vegetation on unused land while simultaneously prioritizing ecological conservation efforts.
Based on the InVEST model to assess carbon storage, the accuracy of its estimates is primarily influenced by input parameters. Selecting appropriate carbon density data is crucial to ensuring the precision of model simulations. In this study, carbon density was corrected based on the research findings of previous scholars. However, due to factors such as climate change and human activities, carbon density values can also change. The correction of carbon density solely based on temperature and precipitation introduces a level of uncertainty (Liu et al., 2021). Therefore, it is necessary to further strengthen the timeliness of acquiring and validating carbon density data, conduct local calibration, perform field measurements of key indicators, accurately estimate regional carbon storage changes, optimize model operating structures, improve model validation accuracy, and ensure the scientific rationality of the data. Based on this foundation, explore internal land structure differences, consider the impact of vegetation temporal scales on carbon storage, select more scientifically reasonable natural and human-driven factors, enhance the predictive accuracy of multi-model simulations, aiming for better maintenance of regional ecosystem carbon balance.
Additionally, while the InVEST model effectively assessed the spatiotemporal changes in carbon storage in the Luan River Basin from 2000 to 2020 and projected scenarios for 2030 in response to land-use changes, it overlooks the impacts of biochemical processes on carbon sequestration capacity. This limitation introduces some errors in the spatial distribution pattern of carbon storage. In future research, a combined macro and micro approach could be employed to provide a data foundation and scientific basis for estimating carbon storage, thereby enhancing the precision of carbon storage assessments.
In this study, we assessed the historical changes in carbon storage in the typical ecologically fragile area, the Luan River Basin. Additionally, we predicted the spatial distribution characteristics of carbon sink potential in 2030 based on three potential land-use scenarios. The main conclusions are as follows:
1) From 2000 to 2020, the main LULC changes were characterized by an increase in forestland and construction land, accompanied by a decrease in cropland. By 2030, under the natural development scenario, the areas of forestland and construction land will continue to increase, while cropland and grassland will continue to decrease. Under the urban development and cropland protection scenario, the areas of forestland and grassland will experience a considerable decrease, while cropland and construction land will witness a notable increase. Under the ecological protection scenario, the areas of cropland and construction land will decrease, while forestland and grassland will see a marked increase.
2) From 2000 to 2020, carbon storage showed a trend of decrease followed by an increase. In 2030, under the ecological protection scenario, carbon storage will increase by 16.97%, while under the urban development and cropland protection scenario, carbon storage will decrease by 22.14%.
3) Changes in carbon storage are mainly related to the conversion between forestland, grassland, cropland, and construction land. The increase in carbon storage is mainly caused by the conversion of cropland, grassland, and construction land to forestland, while the conversion of forestland to grassland and cropland, and grassland to cropland and construction land, are the main reasons for the decrease in carbon storage.
4) The distribution of carbon sink potential exhibits spatial heterogeneity, with high-value areas located in the grasslands and mountainous forests of the northern part of the basin, while low-value areas are predominantly urban land and unused land in the southern part of the basin. Therefore, in the future, actions in the Luan River Basin should be based on an ecological protection scenario, optimizing land use structure, protecting forest land within the basin, limiting excessive expansion of urban land and degradation of cropland while ensuring the quantity of basic farmland, and promoting sustainable development in the Luan River Basin.
The original contributions presented in the study are included in the article/Supplementary Material, further inquiries can be directed to the corresponding author.
YW: Data curation, Formal Analysis, Investigation, Methodology, Project administration, Resources, Software, Supervision, Validation, Visualization, Writing–original draft, Writing–review and editing. JL: Writing–review and editing, Conceptualization, Funding acquisition. LZ: Writing–review and editing, Data curation. ZX: Data curation, Writing–review and editing. YY: Writing–review and editing, Data curation.
The author(s) declare financial support was received for the research, authorship, and/or publication of this article. This work was supported by the Higher Education Science and Technology Research Project for Hebei Province (No. BJK2023105), and the Chengde National Sustainable Development Agenda Innovation Demonstration Zone Construction Science and Technology Special Programme (No. 202202F001).
The authors declare that the research was conducted in the absence of any commercial or financial relationships that could be construed as a potential conflict of interest.
All claims expressed in this article are solely those of the authors and do not necessarily represent those of their affiliated organizations, or those of the publisher, the editors and the reviewers. Any product that may be evaluated in this article, or claim that may be made by its manufacturer, is not guaranteed or endorsed by the publisher.
The Supplementary Material for this article can be found online at: https://www.frontiersin.org/articles/10.3389/fenvs.2024.1380868/full#supplementary-material
Alam, S. A., Starr, M., and Clark, B. J. F. (2013). Tree biomass and soil organic carbon densities across the Sudanese woodland savannah: a regional carbon sequestration study. J. Arid Environ. 89, 67–76. doi:10.1016/j.jaridenv.2012.10.002
Alhameedi, W. M. M., Chen, J., Faichia, C., Nath, B., Alshaibah, B., and Aizari, A. (2022). Geospatial analysis of land use/cover change and land surface temperature for landscape risk pattern change evaluation of baghdad city, Iraq, using CA-markov and ANN models. Sustainability 14, 8568. doi:10.3390/su14148568
Aneseyee, A. B., Soromessa, T., Elias, E., Noszczyk, T., Hernik, J., and Benti, N. E. (2022). Expressing carbon storage in economic terms: the case of the upper Omo Gibe Basin in Ethiopia. Sci. Total Environ. 808, 152166–166. doi:10.1016/j.scitotenv.2021.152166
Babbar, D., Areendran, G., and Sahama, M. (2021). Assessment and prediction of carbon sequestration using Markov chain and InVEST model in Sariska Tiger Reserve, India. J. Clean. Prod. 278, 0959–65296. doi:10.1016/j.jclepro.2020.123333
Bagstad, K. J., Semmens, D. J., Waage, S., and Winthrop, R. (2013). A comparative assessment of decision-support tools for ecosystem services quantification and valuation. Ecosyst. Serv. 5, 27–39. doi:10.1016/j.ecoser.2013.07.004
Boothandford, M. E., Abanades, J. C., Anthony, E. J., Blunt, M. J., Brandani, S., Macdowell, N., et al. (2014). Carbon capture and storage update. Energy & Environ. Sci. 7, 130–189. doi:10.1039/c3ee42350f
Brown, S. (2002). Measuring carbon in forests: current status and future challenges. Environ. Pollut. 116, 363–372. doi:10.1016/s0269-7491(01)00212-3
Cui, L. H., Tang, W. W., Zheng, S., and Singh, R. P. (2023). Ecological protection alone is not enough to conserve ecosystem carbon storage: evidence from Guangdong, China. Land 12, 111–11. doi:10.3390/land12010111
Cui, X. L., Wei, X. Q., Liu, W., Zhang, F., and Li, Z. H. (2019). Spatial and temporal analysis of carbon sources and sinks through land use/cover changes in the Beijing-Tianjin-Hebei urban agglomeration region. Phys. Chem. Earth 110, 61–70. doi:10.1016/j.pce.2018.10.001
Fang, J. Y., Chen, A. P., Peng, C. H., Zhao, S. Q., and Ci, L. (2001). Changes in forest biomass carbon storage in China between 1949 and 1998. Science 292, 2320–2322. doi:10.1126/science.1058629
Gao, L. A., Tao, F., Liu, R. R., Wang, Z. L., Leng, H. J., and Zhou, T. (2022). Multi-scenario simulation and ecological risk analysis of land use based on the PLUS model: a case study of Nanjing. Sustain. Cities Soc. 85, 104055. doi:10.1016/j.scs.2022.104055
Gu, M. L., Ye, C. S., Hu, M. S., Lyu, X., Li, X., Hu, H. P., et al. (2022). Multi-scenario simulation of land use change based on MCR-SD-FLUS model: a case study of Nanchang, China. Trans. Gis 26, 2932–2953. doi:10.1111/tgis.12986
Guo, W., Teng, Y. J., Yan, Y. G., Zhao, C. W., Zhang, W. Q., and Ji, X. L. (2022). Simulation of land use and carbon storage evolution in multi-scenario: a case study in beijing-tianjin-hebei urban agglomeration, China. Sustainability 14, 13436. doi:10.3390/su142013436
He, C. Y., Zhang, D., Huang, Q. X., and Zhao, Y. Y. (2016). Assessing the potential impacts of urban expansion on regional carbon storage by linking the LUSD-urban and InVEST models. Environ. Model. Softw. 75, 44–58. doi:10.1016/j.envsoft.2015.09.015
He, Y. T., Xia, C. Y., Shao, Z., and Zhao, J. (2022). The spatiotemporal evolution and prediction of carbon storage: a case study of urban agglomeration in China's beijing-tianjin-hebei region. Land 11, 858. doi:10.3390/land11060858
Hoque, M. Z., Cui, S., Xu, L., Islam, I., Tang, J., and Ding, S. (2019b). Assessing agricultural livelihood vulnerability to climate change in coastal Bangladesh. Int. J. Environ. Res. Public Health 16, 4552. doi:10.3390/ijerph16224552
Islam, S., Li, Y. C., Ma, M. G., Chen, A. X., and Ge, Z. X. (2021). Simulation and prediction of the spatial dynamics of land use changes modelling through CLUE-S in the southeastern region of Bangladesh. J. Indian Soc. Remote Sens. 49, 2755–2777. doi:10.1007/s12524-021-01402-w
Kiziridis, D. A., Mastrogianni, A., Pleniou, M., Tsiftsis, S., Xystrakis, F., and Tsiripidis, I. (2023). Simulating future land use and cover of a mediterranean mountainous area: the effect of socioeconomic demands and climatic changes. Land 12, 253. doi:10.3390/land12010253
Kulaixi, Z., Chen, Y. N., Li, Y. P., and Wang, C. (2023). Dynamic evolution and scenario simulation of ecosystem services under the impact of land-use change in an arid Inland River Basin in Xinjiang, China. Remote Sens. 15, 2476. doi:10.3390/rs15092476
Li, K. R., Wang, S. Q., and Cao, M. K. (2004). Vegetation and soil carbon storage in China. Sci. China Ser. D-Earth Sci. 47, 49–57. doi:10.1360/02yd0029
Li, L., Zayiti, A., and He, X. (2023). Evaluating the stand structure, carbon sequestration, oxygen release function, and carbon sink value of three artificial shrubs alongside the tarim desert highway. Forests 14, 2137. doi:10.3390/f14112137
Li, M. lin., Qin, Y. b., Zhang, T. B., Zhou, X. B., Yi, G. H., Bie, X. J., et al. (2023). Climate change and anthropogenic activity Co-driven vegetation coverage increase in the Three-North shelter forest region of China. Remote Sens. 15, 1509–1517. doi:10.3390/rs15061509
Li, Y. H., Yao, S., Jiang, H. Z., Wang, H. R., Ran, Q. C., Gao, X. Y., et al. (2022a). Spatial-temporal evolution and prediction of carbon storage: an integrated framework based on the MOP-PLUS-InVEST model and an applied case study in hangzhou, east China. Land 11, 2213–2222. doi:10.3390/land11122213
Li, Y. M., Yang, X., Wu, B. W., Zhao, J. Z., Jiang, W. X., Feng, X. J., et al. (2023). Spatio-temporal evolution and prediction of carbon storage in Kunming based on PLUS and InVEST models. Peerj 11, 152855–e15328. doi:10.7717/peerj.15285
Li, Y. X., Liu, Z. S., Li, S. J., and Li, X. (2022b). Multi-scenario simulation analysis of land use and carbon storage changes in changchun city based on FLUS and InVEST model. Land 11, 647. doi:10.3390/land11050647
Liang, X., Guan, Q. F., Clarke, K. C., Liu, S. S., Wang, B. Y., and Yao, Y. (2021). Understanding the drivers of sustainable land expansion using a patch-generating land use simulation (PLUS) model: a case study in Wuhan, China. Comput. Environ. Urban Syst. 85, 101569. doi:10.1016/j.compenvurbsys.2020.101569
Lin, X. B., MacLachlan, I., Ren, T., and Sun, F. Y. (2019). Quantifying economic effects of transportation investment considering spatiotemporal heterogeneity in China: a spatial panel data model perspective. Ann. Regional Sci. 63, 437–459. doi:10.1007/s00168-019-00937-8
Liu, C., Xu, L. R., Li, D. L., Huang, Y. R., Kang, J. M., Peng, B., et al. (2023). Spatiotemporal variations and determinants of supply–demand balance of ecosystem service in saihanba region, China. Forests 14, 1100–1120. doi:10.3390/f14061100
Liu, K., Zhang, C. Z., Zhang, H., Xu, H., and Xia, W. (2023). Spatiotemporal variation and dynamic simulation of ecosystem carbon storage in the loess plateau based on PLUS and InVEST models. Land 12, 1065. doi:10.3390/land12051065
Liu, X. Y., Wei, M., Li, Z. G., and Zeng, J. (2022). Multi-scenario simulation of urban growth boundaries with an ESP-FLUS model: a case study of the Min Delta region, China. Ecol. Indic. 135, 108538. doi:10.1016/j.ecolind.2022.108538
Liu, Y., Zhang, J., and Zhou, D. (2021). Temporal and spatial variation of carbon storage in the Shule River Basinbased on InVEST model. Acta Ecol. Sin. 41, 4052–4065. doi:10.5846/stxb201911152452
McGuire, A. D., Melillo, J. M., Joyce, L. A., Kicklighter, D. W., Grace, A. L., Moore, B., et al. (1992). INTERACTIONS BETWEEN CARBON AND NITROGEN DYNAMICS IN ESTIMATING NET PRIMARY PRODUCTIVITY FOR POTENTIAL VEGETATION IN NORTH AMERICA. Glob. Biogeochem. Cycles 6, 101–124. doi:10.1029/92gb00219
Meng, X. X., Li, J. H., Jin, M., Su, X. P., and Suo, G. B. (2023). Research on forest carbon sink potential in China. Sustainability 15, 3589. doi:10.3390/su15043589
Mu, Y., Zhang, C. S., Wang, X. Q., Zhang, J. W., and Zong, X. Y. (2017). Analysis on dynamic change of vegetation coverage based on NDVI: a case study of Beijing-Tianjin-Hebei. LAND Reclam. Ecol. FRAGILE AREAS, 179–183. doi:10.1201/9781315166582-35
Neilson, R. P. (1995). A MODEL FOR PREDICTING CONTINENTAL-SCALE VEGETATION DISTRIBUTION AND WATER-BALANCE. Ecol. Appl. 5, 362–385. doi:10.2307/1942028
Piao, S. L., He, Y., Wang, X. H., and Chen, F. H. (2022). Estimation of China's terrestrial ecosystem carbon sink: methods, progress and prospects. Sci. China-Earth Sci. 65, 641–651. doi:10.1007/s11430-021-9892-6
Posner, S., Verutes, G., Koh, I., Denu, D., and Ricketts, T. (2016). Global use of ecosystem service models. Ecosyst. Serv. 17, 131–141. doi:10.1016/j.ecoser.2015.12.003
Sarkodie, S. A., Owusu, P. A., and Leirvik, T. (2020). Global effect of urban sprawl, industrialization, trade and economic development on carbon dioxide emissions. Environ. Res. Lett. 15, 034049. doi:10.1088/1748-9326/ab7640
Sitch, S., Smith, B., Prentice, I. C., Arneth, A., Bondeau, A., Cramer, W., et al. (2003). Evaluation of ecosystem dynamics, plant geography and terrestrial carbon cycling in the LPJ dynamic global vegetation model. Glob. Change Biol. 9, 161–185. doi:10.1046/j.1365-2486.2003.00569.x
Sohl, T. L., and Claggett, P. R. (2013). Clarity versus complexity: land-use modeling as a practical tool for decision-makers. J. Environ. Manag. 129, 235–243. doi:10.1016/j.jenvman.2013.07.027
Tang, X. L., Zhao, X., Bai, Y. F., Tang, Z. Y., Wang, W. T., Zhao, Y. C., et al. (2018). Carbon pools in China's terrestrial ecosystems: new estimates based on an intensive field survey. Proc. Natl. Acad. Sci. U. S. A. 115, 4021–4026. doi:10.1073/pnas.1700291115
Vizcaino, B. Q., Williams, L. G., and Asbjornsen, H. (2020). Biodiversity and carbon storage are correlated along a land use intensity gradient in a tropical montane forest watershed, Mexico. Basic Appl. Ecol. 44, 24–34. doi:10.1016/j.baae.2019.12.004
Wang, H. W., Jin, H. J., Li, X. Y., Zhou, L., Qi, Y., Huang, C. L., et al. (2023a). Changes in carbon stock in the Xing'an permafrost regions in Northeast China from the late 1980s to 2020. Giscience Remote Sens. 60, 1–20. doi:10.1080/15481603.2023.2217578
Wang, J. F., Zhang, T. L., and Fu, B. J. (2016). A measure of spatial stratified heterogeneity. Ecol. Indic. 67, 250–256. doi:10.1016/j.ecolind.2016.02.052
Wang, K., Sun, P. L., Wang, X., Mo, J. X., Li, N., and Zhang, J. T. (2023). Impact of the Grain for green project on the well-being of farmer households: a case study of the mountainous areas of northern Hebei province, China. Land 12, 1257. doi:10.3390/land12061257
Wang, R. Y., Cai, H. A., Chen, L. K., and Li, T. H. (2023b). Spatiotemporal evolution and multi-scenario prediction of carbon storage in the GBA based on PLUS-InVEST models. Sustainability 15, 8421. doi:10.3390/su15108421
Xiang, S. J., Wang, Y., Deng, H., Yang, C. M., Wang, Z. F., and Gao, M. (2022). Response and multi-scenario prediction of carbon storage to land use/cover change in the main urban area of Chongqing, China. Ecol. Indic. 142, 109205–109213. doi:10.1016/j.ecolind.2022.109205
Xu, C. L., Zhang, Q. B., Yu, Q., Wang, J. P., Wang, F., Qiu, S., et al. (2023). Effects of land use/cover change on carbon storage between 2000 and 2040 in the Yellow River Basin, China. Ecol. Indic. 151, 110345. doi:10.1016/j.ecolind.2023.110345
Xu, K. P., Wang, J. N., Wang, J. J., Wang, X. H., Chi, Y. Y., and Zhang, X. (2020). Environmental function zoning for spatially differentiated environmental policies in China. J. Environ. Manag. 255, 109485. doi:10.1016/j.jenvman.2019.109485
Xu, L., He, N. P., and Yu, R. G. (2019). 2010s Chinese terrestrial ecosystem carbon density dataset. China Sci. Data 4, 90–96. doi:10.11922/sciencedb.603
Yang, B., Chen, X., Wang, Z. Q., Li, W., Zhang, C., and Yao, X. (2020). Analyzing land use structure efficiency with carbon emissions: a case study in the Middle Reaches of the Yangtze River, China. J. Clean. Prod. 274, 123076–126526. doi:10.1016/j.jclepro.2020.123076
Yu, X. H., Liang, Z. F., Fan, J. J., Zhang, J. L., Luo, Y. H., and Zhu, X. Y. (2021). Spatial decomposition of city-level CO2 emission changes in Beijing-Tianjin-Hebei. J. Clean. Prod. 296, 126613. doi:10.1016/j.jclepro.2021.126613
Zadbagher, E., Becek, K., and Berberoglu, S. (2018). Modeling land use/land cover change using remote sensing and geographic information systems: case study of the Seyhan Basin, Turkey. Environ. Monit. Assess. 190, 494. doi:10.1007/s10661-018-6877-y
Zeng, S. D., Xia, J., She, D. X., Du, H., and Zhang, L. P. (2012). Impacts of climate change on water resources in the Luan River basin in North China. Water Int. 37, 552–563. doi:10.1080/02508060.2012.709424
Zhang, B. H., and Zhang, J. P. (2009). “Spatial distribution of soil organic carbon density and storage in shandong province, China,” in International research conference of resources utilization and environmental effectiveness, 117–121.
Zhang, F., Yushanjiang, A., and Jing, Y. (2019). Assessing and predicting changes of the ecosystem service values based on land use/cover change in Ebinur Lake Wetland National Nature Reserve, Xinjiang, China. Sci. Total Environ. 656, 1133–1144. doi:10.1016/j.scitotenv.2018.11.444
Zhang, Z. Y., Hormann, G., Huang, J. L., and Fohrer, N. (2023). A random forest-based CA-markov model to examine the dynamics of land use/cover change aided with remote sensing and GIS. Remote Sens. 15, 2128. doi:10.3390/rs15082128
Zhao, A. Z., Zhang, A. B., Liu, J. H., Feng, L. L., and Zhao, Y. L. (2019a). Assessing the effects of drought and "Grain for green" program on vegetation dynamics in China's loess plateau from 2000 to 2014. Catena 175, 446–455. doi:10.1016/j.catena.2019.01.013
Zhao, M. M., He, Z. B., Du, J., Chen, L. F., Lin, P. F., and Fang, S. (2019b). Assessing the effects of ecological engineering on carbon storage by linking the CA-Markov and InVEST models. Ecol. Indic. 98, 29–38. doi:10.1016/j.ecolind.2018.10.052
Keywords: LULC, carbon storage, FLUS model, InVEST model, carbon sink potential, multi-scenario simulation
Citation: Wang Y, Liu J, Zhang L, Xue Z and Yang Y (2024) Projecting the response of carbon sink potential to land use/land cover change in ecologically fragile regions. Front. Environ. Sci. 12:1380868. doi: 10.3389/fenvs.2024.1380868
Received: 02 February 2024; Accepted: 28 May 2024;
Published: 24 June 2024.
Edited by:
Chenxi Li, Xi’an University of Architecture and Technology, ChinaReviewed by:
Yu Zhu, Central South University Forestry and Technology, ChinaCopyright © 2024 Wang, Liu, Zhang, Xue and Yang. This is an open-access article distributed under the terms of the Creative Commons Attribution License (CC BY). The use, distribution or reproduction in other forums is permitted, provided the original author(s) and the copyright owner(s) are credited and that the original publication in this journal is cited, in accordance with accepted academic practice. No use, distribution or reproduction is permitted which does not comply with these terms.
*Correspondence: Jie Liu, bGl1amllMjAwNC0yMDA3QDE2My5jb20=
Disclaimer: All claims expressed in this article are solely those of the authors and do not necessarily represent those of their affiliated organizations, or those of the publisher, the editors and the reviewers. Any product that may be evaluated in this article or claim that may be made by its manufacturer is not guaranteed or endorsed by the publisher.
Research integrity at Frontiers
Learn more about the work of our research integrity team to safeguard the quality of each article we publish.