 Dragoș Huru1
 Alexandra Frățilă (Adam)1Ioana Andrada Gavril (Moldovan)1
 Silvia Elena Iacob2
 Georgiana Raluca Lădaru3*
- 1Department of Economics and Economic Policies, The Bucharest University of Economic Studies, Bucharest, Romania
- 2Department of Economic Doctrines and Communication, The Bucharest University of Economic Studies, Bucharest, Romania
- 3Department of Agrifood and Environmental Economics, The Bucharest University of Economic Studies, Bucharest, Romania
Climate change is a very debated topic among academia, national and international institutions. Therefore, policies and tools for diminishing pollutant emissions are in place in a number of countries. Among them, taxation and renewable energy use seem to be among the most important. This paper aims at testing the impact of certain tools for climate change policy implementation, such as environmental taxes, renewable energy use, real productivity, employment rate taking into consideration the level of economic development and the GINI coefficient, on the greenhouse gas emissions in two important sectors of the economy: industry and commerce. Panel data analysis is used for a cluster of nine developing countries of the European Union that have the per capita GDP at purchasing power parity lower than 80% of the EU average, during 2008–2021. Similar to other studies, the results show a negative relationship between environmental taxation and greenhouse gas emissions in the industrial sector, and a positive one in the commercial sector. The latter is explained by the fact that transport, which is a main pollutant sector, is also one of the most difficult sectors to achieve green transition, given high associated costs. The analysis also shows that renewable energy use discourages the emissions of greenhouse gases, both in the industrial and commercial sectors, so that fostering investment in renewables is an important factor for addressing climate change and promoting a sustainable growth.
1 Introduction
Climate change and the green economy are currently among the most debated topics both on governmental, international and academia agendas. While concerns for sustainable development encompassing environmental goals have been in place since the second part of 20th Century, the latest trends refer to very specific plans, actions and objectives for mitigating the impact of the economic activity on climate change. It has been empirically proven that increase in political globalization has a negative impact on CO2 emissions (Chen et al., 2020), so that international agreements and cooperation are of most importance when it comes to setting targets and establishing strategies in order to foster environmental goals and deal with climate change (Ghidoni et al., 2017).
Therefore, green economy has become a crucial policy framework in many developed and developing economies around the World (Zhang et al., 2022). European Union is known as one of the most vocal promoters of green economy, with European Green Deal aiming at promoting efficient use of resources through circular economy, diminish pollution, protect biodiversity and stop climate change. Therefore, the EU is envisaged to be become the world’s first “climate-neutral bloc” by 2050 (European Commission, 2020). In this context, green transition is one of the most important part of the new economic paradigm at EU level, alongside enhancing resilience and digital transition.
In the context of economic globalization, environmental policies also tend to have a supra-national appliance. Within the EU, environmental policies have gained importance in the last decade and are being accelerated through the European Green Deal and the Recovery and Resilience Facility implementation. However, despite the incentives for harmonization, the EU countries are still in different stages of implementing environmental policies, given different national specificities and issues to be addressed. Under these circumstances, the effects of the policies might turn out differently, so that such measures should be well tailored on the specific problems of each country. Implementing economic, social and environmentally sustainable policies at the private sector level is seen as the best way to raise national welfare, being achieved through dynamic capabilities taken over at microeconomic level (Akkaya and Üstgörül, 2020). Such capabilities could be implemented through strategic leadership, as well as organizational climate, in order to enable firms to cope with rapid changes brought by the innovations aimed at promoting sustainability (Tetik and Akkaya, 2021). Member States in the EU have assumed a binding legal commitment within the European Green Deal, with two key objectives: (i) reduction of net greenhouse gas emissions with at least 55 percent by 2030 compared to 1990 levels (“Fit for 55”) and (ii) achieving the goal of climate neutrality by 2050 (“net zero”). The Green Deal also encompasses an action plan for EU member states to boost the efficient resources exploitation, through a clean and circular economy, restoring biodiversity and reducing pollution. While all sectors of the economy will need to decarbonize, the energy transition is primordial.
Alongside very specific actions embedded in the international agreements, national Governments can always find ways to foster environmental policies through taxes. Environmental taxes can play an important role in incentivizing the reduction of pollutant emissions, while ensuring funds for research and development and implementation of new, environmental–friendly technologies. These taxes are able to affect the climate change through the setting of price mechanism.
In this context, this paper analyses the effectiveness of addressing environmental objectives through governmental policies, especially through environmental taxation, and different tools, such as renewable energy use, real productivity, employment rate taking into consideration the level of economic development and the GINI coefficient. A panel data regression analysis has been conducted on a cluster of some developing EU Member States that have the GDP/capita at purchasing power parity lower than 80% of the EU average. The empirical analysis is focused on two important economic sectors, industry and commerce.
The remaining part of this paper is structured as follows: Section 1 presents the literature review on this topic, Section 2 discusses the data and the methodology, Section 3 presents the results and the last section encompasses conclusions and discussion on policy implication.
2 Literature review
The literature on climate change policy is rather rich, also in the light of the intense institutional debates around it. Many papers present empirical analyses on the relationship between the economic growth and CO2 emissions. For instance, Liobikienė and Butkus (2018) conclude that economic growth is positively correlated with growing greenhouse gas emissions, regardless of the level of economic development. Also, they find that export increases contribute to lower pollution in rich countries, while export represents a challenge in developing countries. Moreover, foreign direct investment is very weakly associated with emissions, regardless the level of development. On the other hand, the share of renewable energy consumption and energy efficiency are found to reduce greenhouse gas emissions in all countries, which leads to the conclusion that they should be good tools for climate change policy implementation, regardless of development level. Likewise, using dynamic ordinary least squares and cointegration techniques, Onofrei et al. (2022) found a long-run relationship between economic growth and CO2 emissions in the EU countries for the period 2000–2017 (on average, a 1% change in GDP leads to 0.072% change in CO2 emissions). The authors also state that the demand for environmental protection and policies intensifies alongside the increase in the income level during economic growth.
Further, the literature on designing and using environmental taxes for changing behaviour towards environmentally friendly direction through legal, market and organizational instruments is vast and growing (Jagers and Hammar, 2009).
Environmental taxes are seen as an important tool in the fight against climate change and its undesired effects (Patuelli et al., 2005; Onofrei et al., 2022). On the other hand, it is considered that the governance of energy/carbon policies, managed in relation to fiscal policies, can impact economic growth and trade (Chakraborty et al., 2023). The literature regarding policies for combating climate change presents a wide range of methodologies for assessing the impact of environmental taxation towards mitigating climate change. For example, He et al. (2023) based their research on several theories (regarding externalities, public goods, collective cooperation and double dividend), using a panel ARDL model. They found that environmental taxes do have a negative effect on reducing pollutant emissions and the frequency of weather phenomena determined by climate change. Their research also showed that environmental technologies and environmental budget influence the process of mitigating climate change and undesired weather events, stressing the role of investment in environmental protection technologies, while collecting environmental taxes.
Gibba and Khan (2023) have studied a wide range of correlations between economic and environmental variables using panel autoregressive distributed lag (ARDL) model for the EU countries, over the period 1990–2020. They find that oil import prices, urbanization, environmental technology and energy consumption promote economic expansion, while investment in IT&C and environmental taxes have a negative impact, both in the short and long-run. On the other hand, similar to other studies, the authors find that energy consumption is positively influenced by economic growth, urbanization and oil import prices but negatively impacted by IT&C investment, environmental taxes and environmental technology.
Environmental taxes are theoretically expected to equalize the marginal cost determined by the reduction of greenhouse gas emissions at the level of the economy and society (Kreiser et al., 2011), also determining the reduction of the overall cost associated with pollution on the long run, thus determining more effective production and sustainable. Imposing environmental taxes determine polluters to find better ways for their activity, having to choose between paying taxes or switching to green technologies for production. However, in practice, environmental taxes are not always designed in such a way to be able to provide equal incentives to polluters, some of them being sometimes exempted or facing little impact from such taxation, while others being more affected. When designing such taxation, governments often pay attention to the potential impact on the competitiveness of affected sectors, or, on the other hand, on low-income social categories that might be affected by price increases determined by those taxes. While international cooperation can tackle the problem of external competitiveness loss, some certain form of compensation measures can address the issue of low-income households (Kreiser et al., 2011). All in all, besides raising budget revenues, environmental taxation has the advantage of encouraging sustainable development and addressing climate change (McEldowney and Salter, 2016).
Many papers analyze the impact of environmental taxation on energy consumption, greenhouse gas emissions, economic growth, or other related variables. Several studies (Baranzini et al., 2000; Van Heeden et al., 2006; Aldy et al., 2008; Jeffrey and Perkins, 2013; Jeffrey and Perkins, 2015) emphasize the role of taxation for optimizing the resource use and allocation, as well as for diminishing greenhouse gas emissions. Andrei et al. (2016) used Granger causality tests in order to determine the influence of environmental taxation upon energy production and consumption, as well as on economic growth in Romania. They found a negative relationship between environmental taxes and economic growth, pollution resources, domestic material consumption and total gross electricity generation. Other researchers (Labandeira et al., 2009) found that green taxation determines the reduction of pollutant emissions, also having a positive impact on the overall output in the economy and social welfare, also diminishing the income gap at social level.
Nanthakumar et al. (2014) studied the effects of carbon taxation on CO2 emissions and economic growth using cointegration and causality analysis for a long period of time (1974–2010) in Malaysia. They concluded upon a bidirectional influence between taxation and CO2 emissions, also finding a Granger positive causality between economic growth and CO2 emissions, on the one hand, and between carbon taxation and economic growth, on the other hand. The authors also found support for the Kuznets׳ theory (inverted U-shaped curve describing the relationship between the economic growth and CO2 emissions) in the case of Malaysia, while contesting the effectiveness of the carbon taxation policy to address CO2 emissions.
While most of the papers in the literature assess the impact of environmental taxes on the overall economy, some tackle the impact on certain economic sectors, similar to this research. A study based on 2004–2020 panel data in China, using the SBM-GML index methodology in order to measure industrial green total factor productivity and econometric methods, found that environmental taxation has a significant positive effect on industrial green transformation, Moreover, the study mentions that credit management is an important factor for restricting pollution from industrial businesses, encouraging green investments and improvement of production processes (Shen and Zhang, 2022). In the same vein, the intensity of environmental regulation is found to have an important impact on green total factor productivity, therefore paving the way for the establishment of an effective environmental regulation for the manufacturing industry (Wang and Yan, 2022). Another research analyzing the impact of environmental taxation for fostering cleaner production technologies in manufacturing and mining industries showed that low levels of taxation are not effective for stimulating green technology and, as the taxation increases, this determines the increase of investments in green technologies. However, if combined with public financing, low taxation can also be effective in promoting green technologies (Tchorzewska et al., 2022). Regarding the industrial sector, it should be noted that innovation and the implementation of robots is seen as a future way for improving process efficiency (Akkaya and Ahmed, 2022) and should go hand in hand with the aims of green transition.
Another important aspect tackled in the literature refers to the way environmental taxes are designed and applied. In this sense, it has been shown that in the case that an environmental tax would be applied to non-CO2 greenhouse gas emissions instead to only CO2, this would greatly affect several sectors, including agriculture, mining of coal, extraction of peat, and food (Gemechu et al., 2012).
As regards the impact of environmental taxes on trade, the literature describes a negative impact for exporting economies where such taxes are applied, given the loss of competitiveness due to increased prices, in cases where competing economies do not apply similar environmental measures due to the lack of/lower environmental objectives (Flannery, 2016). Therefore, international environmental agreements, which usually do not encompass every single economy in the World, could hamper domestic economic activity and have a negative impact on exports (Levinson and Taylor, 2008). Under these circumstances, countries without economic power participating to the global market could find themselves in the situation to consider international climate agreements highly unfavorable and reject them (Llop, 2023).
3 Materials and methods (research methodology and data)
3.1 Data description
Annual data starting from 2008 until 2021 (at the time of writing this research, 2021 is the latest annual data for most of the data), the data source being Eurostat (2023) was used. The research is focused on two different sectors (industrial and commercial sector) on a cluster composed of some countries from European Union that have a Gross Domestic Product (GDP) per capita expressed in purchasing power standards, as percentage of EU-27, for 2021, below 80% of the EU average. Therefore, the cluster proposed is composed of the following countries: Bulgaria, Greece, Croatia, Latvia, Hungary, Poland, Portugal, Romania, Slovakia. The two sectors are based on the following NACE Rev 2:
• Industry except Construction: Mining and quarrying, Manufacturing, Electricity, gas, steam and air conditioning supply; Water supply, sewerage, waste management and remediation activities;
• Wholesale and retail trade, transportation, accommodation and food service activities.
These sectors has been chosen due to the fact that their output has the highest share of the gross value added, in the case of all countries from the panel. In the case of Industry (except construction), the gross value added from this sector as a percentage of total ranges between 15.5% and 27% (Table 1). Greece registers 15.5% of the gross value added from industry, while Slovakia registers 27% of the gross value added from industry in 2021. Regarding wholesale and retail trade, transportation, accommodation and food service activities, the gross value added (GVA) from this sector ranges between 17.4% and 25.2% in 2021. Slovakia registers 17.4% of the gross value added from the commercial sector, while Greece registers 25.2% of the gross value added from the aforementioned sector.
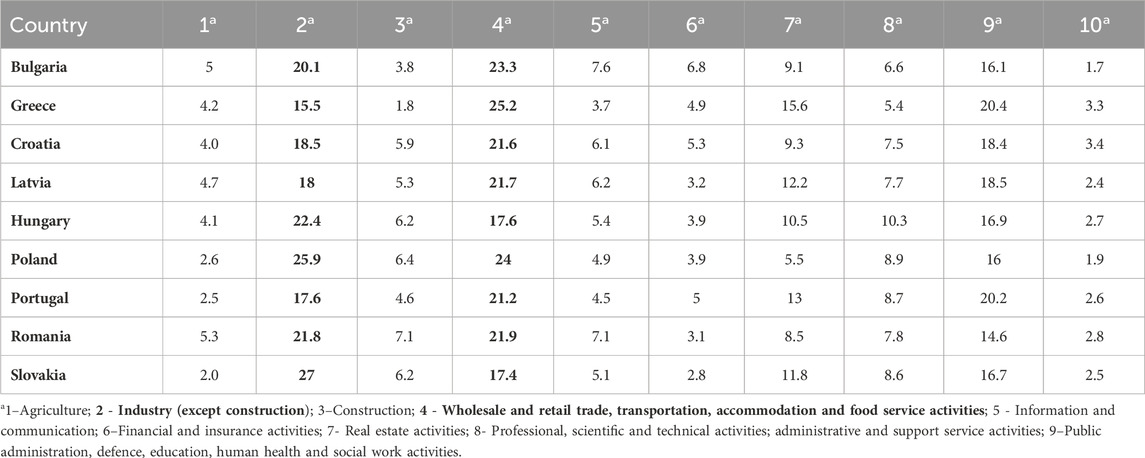
Table 1. Gross value-added by industry breakdown in 2021 (% of total).
It was examined the importance of different tools for climate change policy implementation at industrial (NACE Rev 2: Industry except Construction: Mining and quarrying, Manufacturing, Electricity, gas, steam and air conditioning supply; Water supply, sewerage, waste management and remediation activities) and commercial (NACE Rev 2: Wholesale and retail trade, transportation, accommodation and food service activities) level, such as environmental taxes, renewable energy use, real productivity, employment rate taking into consideration the level of economic development and the GINI coefficient. In this respect it was chosen greenhouse gas emissions as a quantitative indicator for the climate change policy implementation. Table 2 shows a list of the variables that it was used in the empirical analysis.

Table 2. Variables contained in the panel model.
Table 3 shows the descriptive statistics of the variables used in the panel regression model for both sectors.
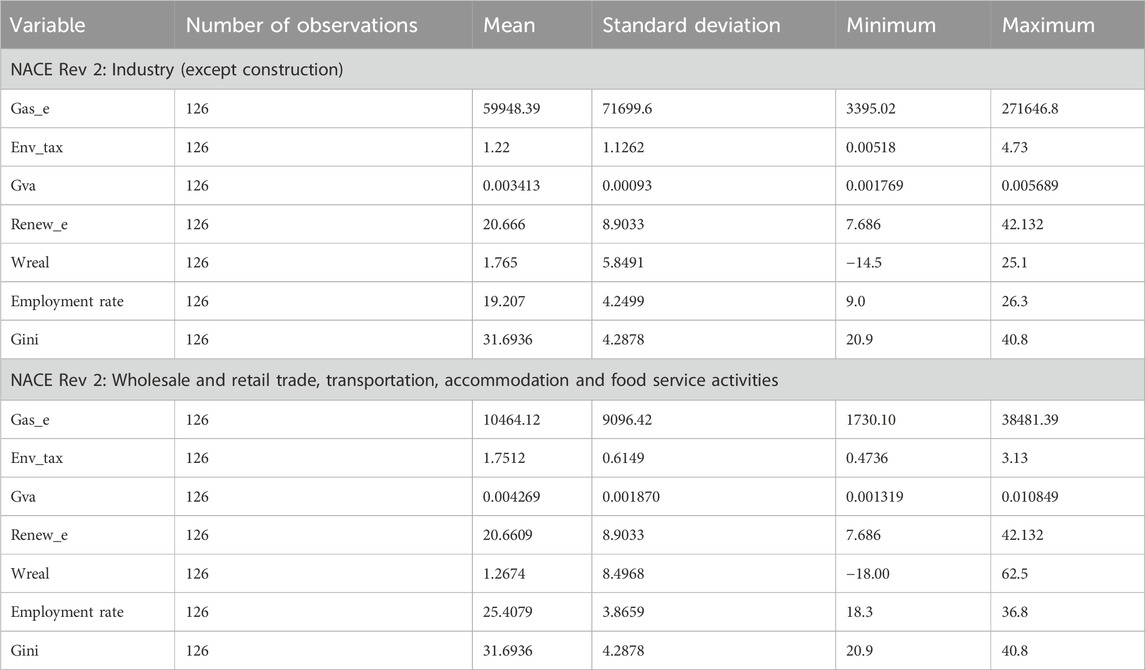
Table 3. Descriptive statistics of variables.
Regarding the industry sector, the standard deviation shows insignificant variations in the GVA per capita at industry level meaning that the countries are similar in terms of economic development. The minimum of GVA per capita is registered in Latvia in 2009 and the maximum is registered in Poland in 2021. In terms of greenhouse gas emissions, the minimum is registered in the case of Latvia in 2020 with 3,395.02 thousand tonnes and the maximum is registered in the case of Poland in 2008 with 271646.8 thousand tonnes. The standard deviation is quite high, so there are some differences between the countries in terms of pollution. In terms of environmental taxes as percent of budgetary revenues, registered in the industrial sector, Poland in 2008 reached the minimum with 0.005%, while Romania in 2016 reached the maximum with 4.73%. Regarding renewable energy use as a share of energy from renewable resources, the standard deviation shows some variations of this indicator, as the minimum is reached in Poland in 2008 with 7.68%, while the maximum is reached in Latvia in 2020 with 42.13%. In terms of dynamics of the real labour productivity per person in the industrial sector, the minimum is registered in the case of Romania in 2012 with −14.5%, while the maximum is reached in Slovakia in 2010 with 25.1%. The standard deviation shows some variations of this indicator, as the coefficient is 5.84. Regarding the employment rate, the standard deviation of 4.24 shows some variations, as the minimum of 4% is registered in Greece in 2017, while the maximum of 26.3% is registered in Slovakia in 2008. In terms of Gini coefficient, Slovakia reached the minimum of 20.9 in 2018 and Bulgaria reached the maximum of 40.8 in Bulgaria in 2009.
Regarding the sector of wholesale and retail trade, transportation, accommodation and food service activities, the standard deviation shows some variations in the GVA per capita at this level meaning that the countries register some differences in terms of gross value added in this sector. The minimum of GVA per capita is registered in Romania in 2011 and the maximum is registered in Bulgaria in 2021. In terms of greenhouse gas emissions, the minimum is registered in the case of Croatia in 2012 with 1730 thousand tonnes and the maximum is registered in the case of Poland in 2021 with 38481.3 thousand tonnes. The standard deviation shows some differences between the countries in terms of pollution. When taking of environmental taxes as percent of budgetary revenues, registered in the commercial sector, Romania in 2008 reached the minimum with 0.47%, while Bulgaria in 2008 reached the maximum with 3.13%. Regarding renewable energy use as a share of energy from renewable resources, the standard deviation shows some variations of this indicator, as the minimum is reached in Poland in 2008 with 7.68%, while the maximum is reached in Latvia in 2020 with 42.13%. In terms of dynamics of the real labour productivity per person in the commercial sector, the minimum is registered in the case of Croatia in 2020 with −18%, while the maximum is reached in Romania in 2012 with 62.5%. The standard deviation shows some variations of this indicator, as the coefficient is 8.49. Regarding the employment rate, the standard deviation of 3.86 shows some small variations, as the minimum of 18.3% is registered in Romania in 2008, while the maximum of 36.8% is registered in Greece in 2019. In terms of Gini coefficient, Slovakia reached the minimum of 20.9 in 2018 and Bulgaria reached the maximum of 40.8 in Bulgaria in 2009.
3.2 Methodology
This paper examines the importance of different tools for climate change policy implementation at industrial and commercial level, such as environmental taxes, renewable energy use, real productivity, employment rate taking into consideration the level of economic development and the GINI coefficient. In this respect, 2 panel regression models during 2008–2021 have been run using Eviews 12. Panel techniques have been used in order to increase the number of observations, as according to Brooks (2008) the problems related to data stationarity are diminished and several tools for mitigating the common problems of the models are available. The econometric analysis was expected to show that environmental taxes and renewable energy sources would have a negative impact on the greenhouse gas emissions, while real labour productivity per person, employment rate and the gross value added would have a positive impact. The data is analyzed in the form of balanced panel data, choosing from three methods: common effect model, fixed effect model and random effect model (Khan et al., 2022). Fixed effect model has been chosen as the result of the Redundant Fixed Effects Test Likelihood Ratio indicated several consistent estimators with this model. Brüderl and Ludwig (2015) offer a detailed methodology of fixed effects models. The estimation method was chosen according to the stationarity of the data. A series is said to be stationary if the mean and autocovariances of the series do not depend on time (IHS Markit, 2020). In other words, it does not have a unit root or it is integrated in order zero -I (0). Roughly speaking, an I (0) process is a moving average with autocovariances that die off sufficiently quickly, a condition which is necessary for stationarity (Hamilton, 1994). In this respect, the stationarity of data has been tested using Levin, Lin and Chu test (LLC), ADF- Fisher Chi-Square and PP-Fischer Chi-Square, using the Schwarz criterion to select the optimal number of lags. It is worth mentioning that these tests are based on the assumption that the series contains a unit root.
A correlation matrix has been used in order to verify the correlation between the variables and to be able to solve any issue of multicollinearity in case it would appear. A correlation matrix is helpful to detect the severity of multicollinearity in the model (Khan et al., 2022). The Estimated Generalized Least Squares (EGLS) method has been used, using fixed effects and Cross - Section SUR as a weighting method on the following equations:
• Industry (except Construction):
where, t = 2008, 2009,…2021; a1 = coefficient of lnGas_et-1; a2 = coefficient of lnEnv_taxt-1; a3 = coefficient of lnGvat; a4 = coefficient of Renew_et; a5 = coefficient of Wrealt-1; a6 = coefficient of Employment ratet-1; a7 = coefficient of lnGinit-1; c0 = constant; ut = error term.
where, t = 2008, 2009,…2021; a1 = coefficient of lnGas_et-1; a2 = coefficient of lnEnv_taxt-1; a3 = coefficient of lnEnv_taxt-1; a4 = coefficient of lnGvat; a5 = coefficient of Renew_et; a6 = coefficient of Wrealt-1; a7 = coefficient of Employment ratet-1; a8 = coefficient of lnGinit-1; c0 = constant; ut = error term.
The Cross–section SUR option estimates a feasible Generalized Least Squares specification correcting for both cross-section heteroskedasticity and contemporaneous correlation (IHS Markit, 2020). Most of the variables are defined by logarithm form in order to ensure that the estimates coefficients are robust to the measurement units of the variables (Mudronja et al., 2020; Frăilă et al., 2021), such as: Greenhouse gas emissions at industry level, Total environmental taxes at industry level, Gross value added by industry breakdown per capita and Gini coefficient of equivalized disposable income.
Finally, for testing the maximum likelihood of the estimators Fischer test has been used for the model validity (probability less than 5%). The significance of estimators (probability less than 5%) and the linearity of the model (R-squared) have been testedusing the correlation matrix for the absence of multicollinearity, also checking for the existence of non-zero standard errors, but not much different from zero (Frăilă et al., 2021). Plus, Jarque Berra test has been used to check if the residuals are normally distributed (probability higher than 5%), while Breusch Pagan LM and Pesaran CD have been used to check for the absence of dependence between cross-section (probability higher than 5%).
4 Results
As mentioned before, the paper examines the importance of different tools for climate change policy implementation at industrial (NACE Rev 2: Industry except Construction: Mining and quarrying, Manufacturing, Electricity, gas, steam and air conditioning supply; Water supply, sewerage, waste management and remediation activities) and commercial (NACE Rev 2: Wholesale and retail trade, transportation, accommodation and food service activities) level, such as environmental taxes, renewable energy use, real productivity, employment rate, also taking into consideration the level of economic development and the GINI coefficient. For this scope, a panel of emerging countries (Bulgaria, Croatia, Greece, Latvia, Hungary, Poland, Portugal, Romania and Slovakia) from European Union during 2008–2021 has been used. The results of the data stationarity are shown in Table 4: some of the variables are stationary in level, while others are stationary in first difference.
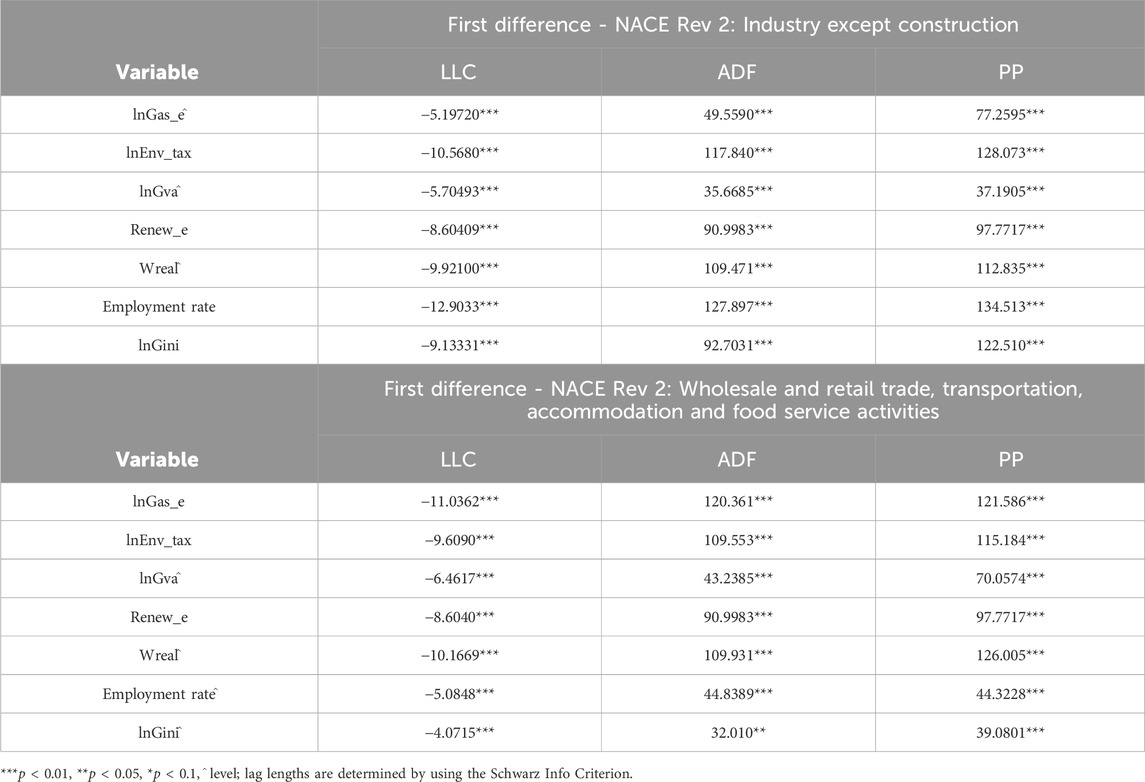
Table 4. Panel unit root tests output.
In order to solve the problem of multicollinearity the correlation matrix has been used, by examining the correlation between the variables. A positive or a negative correlation greater than 0.8 serves as a threshold for a correlation presence (Lovric, 2005). Table 5 shows the correlation coefficients of the variables: all the coefficients are lower than 0.8, meaning that all the variables in the models can be used, as there are no correlation problems. At a closer look, in the case of industrial sector, the highest correlation coefficients are registered between renewable energy sources and greenhouse gas emissions, between employment rate and gross value added and between Gini coefficient and gross value added. In the case of the commercial sector, the highest correlation coefficients are registered between renewable energy sources and greenhouse gas emissions, between Gini coefficient and renewable energy sources and between gross value added and environmental taxes.
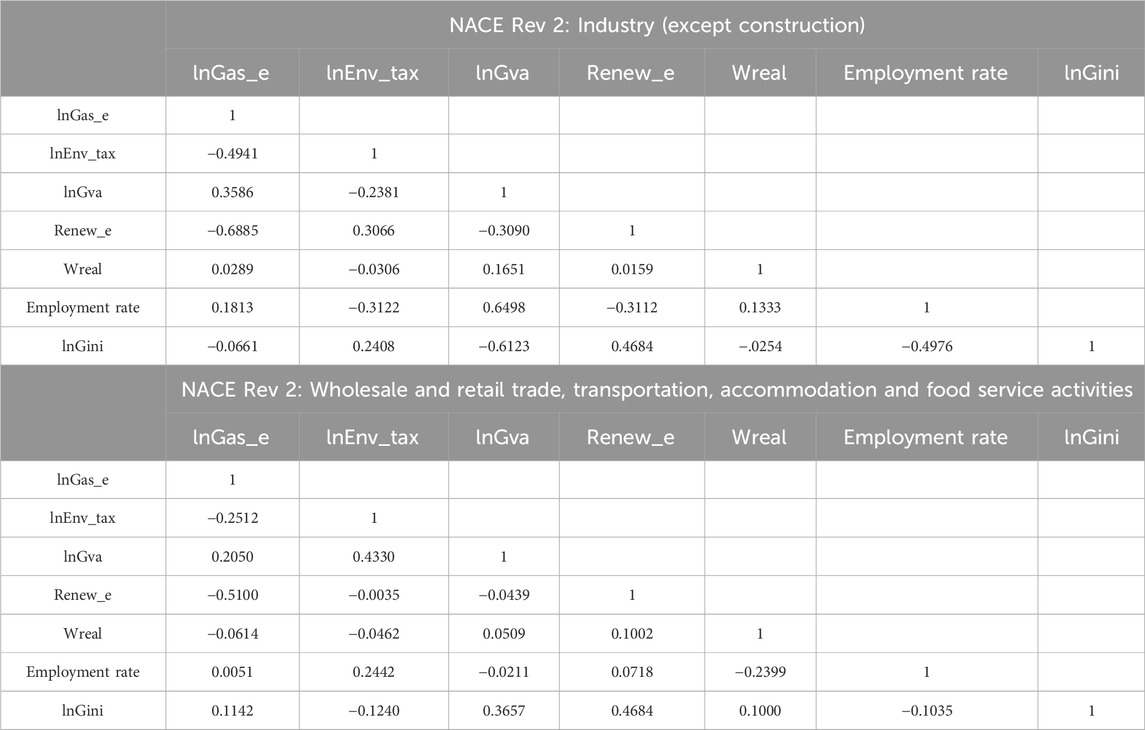
Table 5. Correlation matrix.
Further, the models have been estimated and the empirical results are presented in Table 6. The coefficients are robust and significant, as their specific probability is lower than 5%. R–squared registers high values, meaning that the selected variables are important for greenhouse gases emissions in both sectors. Fixed effects have been used in both models, as indicated by the results of Redundant Fixed Effects Test Likelihood Ratio.
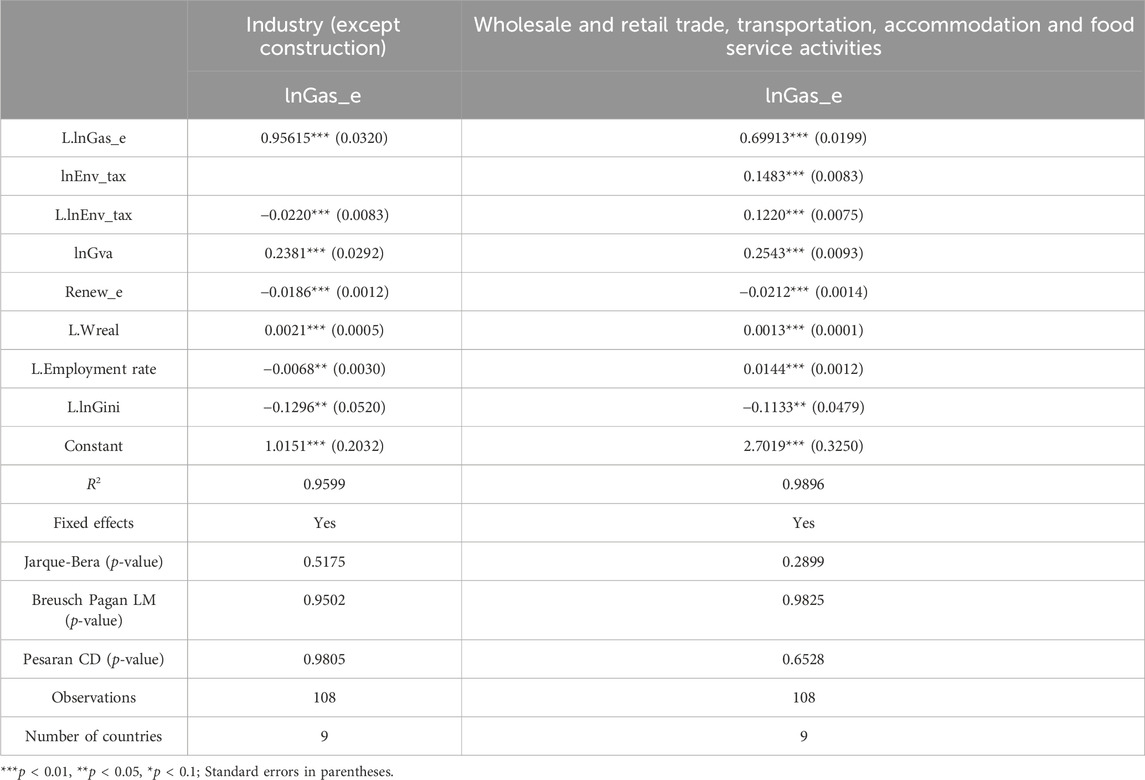
Table 6. Results of the panel regression models.
The empirical results are, generally, in line with expectations, with some exceptions.
In line with previous studies (Baranzini et al., 2000; Van Heeden et al., 2006; Aldy et al., 2008; Kreiser et al., 2011; Jeffrey and Perkins, 2013; Jeffrey and Perkins, 2015; McEldowney and Salter, 2016; He et al., 2023), the findings of the analysis show a negative relationship between environmental taxes and greenhouse gas emissions, as well as a positive relationship between emissions and gross value added, both in industry and commercial sector.
Regarding the industrial sector, an increase of the environmental taxes lagged 1-year by 10 percentage points is found to determine a fall in greenhouse gas emissions, on average, by 0.22%. Likewise, renewable energy sources discourage the emissions of greenhouse gases, with an estimated coefficient of −0.0186. This result indicates that an increase of renewable energy use by 10 percentage points determines a decrease of the greenhouse gas emissions by 0.18%. The results also show that an increase of 10% of the greenhouse gas emissions lagged 1 year generates an increase of 9.56%, on average, of the greenhouse gas emissions. Real labour productivity per person lagged 1 year has a positive impact upon greenhouse gas emissions. In this respect, an increase of 10 percentage points of this indicator generates an increase of 0.021%. Also, the employment rate lagged 1 year has a negative impact upon the greenhouse gas emissions. The estimated coefficient equals −0.0068, statistically significant. The result indicates that an increase of the employment rate by 10 percentage points generates a decrease of 0.068% of the greenhouse gas emissions, most probably as a result of lower economic activity. Regarding the Gini coefficient, it has a negative impact upon the greenhouse gas emissions. Thus, an increase of 10% of the Gini coefficient lagged 1 year generates a decrease of 1.29% of the greenhouse gas emissions.
For the commercial sector, the results show that an increase of 10% of the greenhouse gas emissions lagged 1 year generates an increase of 6.9%, on average, of the greenhouse gas emissions in the current year. In the case of environmental taxes, the result shows an opposite effect as compared to the industrial sector. In this respect, an increase of 10 percentage points in environmental taxes generates an increase of 1.4% of the greenhouse gas emissions in the current year and an increase of 10% of the environmental taxes lagged 1-year is associated to an increase of 1.2% of the emissions. Also, according to research, renewable energy use discourages the emissions of greenhouse gases, with an estimated coefficient of −0.0212. The result indicates that an increase of renewable energy sources by 10 percentage points, the greenhouse gas emissions decrease by 0.21%. The effect is a little bit higher than in the case of industrial sector. This result is similar to the findings of other studies finding a negative impact of the renewable energy implementation on CO2 emissions (Comuk et al., 2023).
Both real labour productivity per person and employment rate, lagged 1 year, have a positive impact upon greenhouse gas emissions. An increase of 10 percentage points of real labour productivity generates an increase of 0.01%, while an increase of the employment rate by 10 percentage points generates an increase of 0.14% of the greenhouse gas emissions. Regarding the Gini coefficient, it has a negative impact upon the greenhouse gas emissions. Thus, an increase of 10% of the Gini coefficient lagged 1 year generates a decrease of 1.13% of the greenhouse gas emissions.
Regarding the tests for normal residuals’ distribution and the absence of dependence between cross-sections, the results can be seen in the afore-mentioned table. The residuals are normally distributed and that there is no dependence between cross-sections in none of the two sectors. According to Jarque-Bera test, a p-value higher than 0.05 confirms the null hypothesis of the test, claiming that the residuals are normally distributed, while according to Breusch Pagan LM and Pesaran CD, a p-value higher than 0.05 confirms the null hypothesis of the test, confirming that there is no dependence between cross-sections.
5 Conclusion
The empirical analysis shows that environmental taxes have a negative influence on greenhouse gas emissions in the industrial sector. However, these two variables are positively associated in the case of the commercial sector. As regards the industrial sector, the negative influence may be explained by the fact that the industrial technologies have a higher tendency to adapt to the most recent green trends. On the other hand, the commercial sector includes the transportation activities, one of the main pollutants. In this respect, the transition to green solutions or technologies is harder to be achieved on the short run and is very likely to happen in a longer period, given very high associated costs which should be transferred entirely in the cost of the transport activity and finally, in the cost of the transported products. For instance, the price for biofuels that may substitute classic pollutant fuels for heavy goods vehicles is almost three times higher than for the classic one. Moreover, if considering technological improvements to the for heavy goods vehicles (e.g., transition to hydrogen trucks), transport companies find it hard to adapt their transport fleet on the short run, regardless the amplitude of the environmental tax changes, given the fact that the cost of the green (low emission) innovative transportation technologies is very high. However, despite the high costs, the change is very likely to happen on the long run, at least in the EU, given the main goal of the European Green Deal. Likewise, important to mention, there is a wide shared opinion among analysts that” green hydrogen will be vital for achieving the goals of Paris Agreement” (Albatayneh et al., 2023), which has as a main objective achieving net-zero carbon emissions by 2050, limiting “the increase in the global average temperature to well below 2°C above pre-industrial levels” and pursuing efforts “to limit the temperature increase to 1.5°C above pre-industrial levels” (United Nations, 2016).
Going further, environmental taxes should be tailored on the pollution specific in every country or area. For instance, as Gemechu et al. (2012) mention, policymakers should choose wisely between an overall greenhouse gas emissions tax or just a tax on CO2 emissions, so that the effect of the policy implementation is the best.
However, apart from the coercive measures that can be applied to reduce pollution, in order to enhance awareness in this respect, governments should also aim at implementing some alternative instruments to bring benefits for citizens while reducing pollution (Nanthakumar et al., 2014) or promoting effective resource allocation and consumption of goods and services.
According to the present research, as expected, renewable energy use discourages the emissions of greenhouse gases, both in the industrial and commercial sectors, so that fostering investment in renewables is an important factor for addressing climate change and promoting a sustainable growth. However, the impact of the renewable energy sources on the emissions of greenhouse gases revealed by empirical analysis is rather weak.
Likewise, the analysis shows a positive, quite significant, relationship between the gross value added and the greenhouse gas emissions in both sectors (similar to Liobikienė and Butkus, 2018; Nanthakumar et al., 2014), meaning that emissions increase alongside economic growth, which leads to the idea that the emerging economies analyzed in this paper have still not implemented a wide range of policy measures aimed at diminishing the greenhouse gas emissions in the industrial and commercial sectors.
As regards the relationship between real labour productivity and greenhouse gas emissions, the results show it to be positive, although the impact is rather low. This relationship is explained by the fact that increasing the labour productivity implies an increasing volume of production (all else equal), and it has already been noted that intensified economic activity in the emerging countries considered will lead to the growth of emission, in the absence of strong policies for green transition.
Lagged employment rate also has a small impact on greenhouse gas emissions in both sectors, but the influence is different between the two: positive in the commercial sector and negative for industry.
Lagged Gini is negatively correlated with the greenhouse gas emissions in both sectors, meaning that increasing inequalities may have an overall positive impact on reducing greenhouse gas emissions. The explanation for this is twofold: higher environmental taxes (which should have a negative impact on emissions) do affect the disposable income of poor people, making them even poorer, and, on the other hand, higher levels of income for the richest quintiles are associated with higher market income, which in turn allows for green investments dedicated to innovative technologies for fostering lower emissions. Therefore, special attention should be paid to the trade-offs and complementarities between environmental taxation as a tool for diminishing climate change and social equity (Cottrell and Falcão, 2018).
The research process faced some constraints, as for some of the variables, the data only have annual frequency, so that the panel data had been used in order to have a consistent database. Plus, there is a limitation of the data, as few data are available at industry level.
Future research could consist in testing the same models for other clusters composed of the other member states of the European Union in order to see if similar results are to be obtained for the developed countries of the EU. Plus, another future research could be the expansion of the present analysis on other sectors in order to see if the results are similar to the industrial sector or to the commercial one.
Data availability statement
The original contributions presented in the study are included in the article/Supplementary material, further inquiries can be directed to the corresponding author.
Author contributions
DH: Writing–original draft. AF: Writing–original draft. IG: Writing–original draft. SI: Data curation, Methodology, Supervision, Writing–review and editing. GL: Funding acquisition, Validation, Visualization, Writing–review and editing.
Funding
The author(s) declare that no financial support was received for the research, authorship, and/or publication of this article.
Conflict of interest
The authors declare that the research was conducted in the absence of any commercial or financial relationships that could be construed as a potential conflict of interest.
Publisher’s note
All claims expressed in this article are solely those of the authors and do not necessarily represent those of their affiliated organizations, or those of the publisher, the editors and the reviewers. Any product that may be evaluated in this article, or claim that may be made by its manufacturer, is not guaranteed or endorsed by the publisher.
References
Akkaya, B., and Ahmed, J. (2022). “VUCA-RR toward industry 5.0,” in Agile management and VUCA-RR: opportunities and threats in industry 4.0 towards society 5.0 (United States: Emerald Publishing Limited), 1–11.
Akkaya, B., and Üstgörül, S. (2020). “Sustainability of SMEs and health sector in a dynamic capabilities perspective,” in Challenges and opportunities for SMEs in industry 4.0 (United States: IGI Global), 43–64.
Albatayneh, A., Juaidi, A., Jaradat, M., and Manzano-Agugliaro, F. (2023). Future of electric and hydrogen cars and trucks: an overview. Energies 16, 3230. doi:10.3390/en16073230
Aldy, J. E., Ley, E., and Parry, I. (2008). A tax-based approach to slowing global climate change. Natl. Tax. J. 61, 493–517. doi:10.17310/ntj.2008.3.09
Andrei, J., Mieilă, M., Popescu, G. H., Nica, E., and Cristina, M. (2016). The impact and determinants of environmental taxation on economic growth communities in Romania. Energies 9 (11), 902. doi:10.3390/en9110902
Baranzini, A., Goldemberg, J., and Speck, S. (2000). A future for carbon taxes. Ecol. Econ. 32, 395–412. doi:10.1016/S0921-8009(99)00122-6
Brooks, C. (2008). Introductory econometrics for finance. Cambridge, UK: Cambridge University Press.
Bruderl, J., and Ludwig, V. (2015). “Fixed-effects panel regression,” in The SAGE handbook of regression analysis and causal inference. Editors H. Best,, and C. Wolf (United States: SAGE Publications Ltd), 20, 327–358. doi:10.4135/9781446288146.n15
Chakraborty, S. K., Damato, A., and Mazzanti, M. (2023). A note on carbon taxes and trade spillovers within Europe. Front. Environ. Econ. 2, 1197592. doi:10.3389/frevc.2023.1197592
Chen, T., Gozgor, G., Koo, C. K., and Lau, C. K. (2020). Does international cooperation affect CO2 emissions? Evidence from OECD countries. Environ. Sci. Pollut. Res. 27 (8), 8548–8556. doi:10.1007/s11356-019-07324-y
Çomuk, P., Akkaya, B., Ercoşkun, S., and Apostu, S. A. (2023). The foreıgn dırect ınvestments, economıc growth, renewable energy and carbon (CO2) emıssıons nexus: an empırıcal analysıs for Turkey and European Unıon Countrıes. Environ. Dev. Sustain., 1–17. doi:10.1007/s10668-023-03382-y
Cottrell, J., and Falcão, T. (2018). A climate of fairness. Environmental taxation and tax justice in developing countries; Vienna institute for international dialogue and cooperation. Available at: https://cadmus.eui.eu/bitstream/handle/1814/60104/STG_WP_2018_Falcao_A%20Climate%20fof%20fairness.pdf?sequence=1&isAllowed=y (Accessed September, 2023).
European Commission (2020). The European green deal. Available at: https://commission.europa.eu/strategy-and-policy/priorities-2019-2024/european-green-deal_en (Accessed September, 2023).
Eurostat (2023). Eurostat database. Available at: https://ec.europa.eu/eurostat/en/web/main/data/database (Accessed September, 2023).
Flannery, B. P. (2016). Carbon taxes, trade, and border tax adjustments. Resour. Future Policy Brief 2, 1–10. Available at: https://policycommons.net/artifacts/4306858/carbon-taxes-trade-and-border-tax-adjustments-brian-p/5117229/ (Accessed September, 2023).
Fratila, A., Gavril, I. A., Nita, S. C., and Hrebenciuc, A. (2021). The importance of maritime transport for economic growth in the European union: a panel data analysis. Sustainability 13, 7961. doi:10.3390/su13147961
Frayila, A., Gavril, I. A., Petrescu, I. E., and Popescu, C. (2022). Structural socio-economic factors enhancing M-commerce: a macroeconomic perspective over three clusters of the EU 27. Econ. Comput. Econ. Cybern. Stud. Res. 4 (56). doi:10.24818/18423264/56.4.22.13
Gemechu, E. D., Butnar, I., Llop, M., and Castells, F. (2012). Environmental tax on products and services based on their carbon footprint: a case study of the pulp and paper sector. Energy Policy 50, 336–344. doi:10.1016/j.enpol.2012.07.028
Ghidoni, R., Calzolari, M., and Casari, M. (2017). Climate change: behavioral responses from extreme events and delayed damages. Energy Econ. 68 (1), 103–115. doi:10.1016/j.eneco.2017.10.029
Gibba, A., and Khan, M. K. (2023). Modeling the causal dynamics among energy consumption, economic growth, and oil import prices: a panel co-integration analysis for EU economies. Front. Environ. Econ. 2, 1114175. doi:10.3389/frevc.2023.1114175
He, P., Zhang, S., Wang, L., and Ning, J. (2023). Will environmental taxes help to mitigate climate change? A comparative study based on OECD countries. Econ. Analysis Policy 78, 1440–1464. doi:10.1016/j.eap.2023.04.032
IHS Markit (2020). EViews 12 user’s guide II. Available at: https://cdn1.eviews.com/EViews%2012%20Users%20Guide%20II.pdf (Accessed on September, 2023).
Jagers, S., and Hammar, H. (2009). Environmental taxation for good and for bad: the efficiency and legitimacy of Sweden's carbon tax. Environ. Polit. 18 (2), 218–237. doi:10.1080/09644010802682601
Jeffrey, C., and Perkins, J. D. (2013) The impact of energy taxes on carbon dioxide emissions in the European union. Iowa, IA, USA: Iowa State University. Working Paper.
Jeffrey, C., and Perkins, J. D. (2015). The association between energy taxation, participation in an emissions trading system, and the intensity of carbon dioxide emissions in the European Union. Int. J. Acc. 50, 397–417. doi:10.1016/j.intacc.2015.10.004
Khan, S., Akbar, A., Nasim, I., Hedvicakova, M., and Bashir, F. (2022). Green finance development and environmental sustainability: a panel data analysis. Front. Environ. Sci. 10, 1039705. doi:10.3389/fenvs.2022.1039705
Kreiser, L., Sirisom, J., Ashiabor, H., and Milne, J. E. (2011). “Environmental taxation and climate change,” in Achieving environmental sustainability through fiscal policy, critical issues in environmental taxation series. Cheltenham, UK: Edward Elgar Publishing.
Labandeira, X., Labeaga, J. M., and Rodriguez, M. (2009). An integrated economic and distributional analysis of energy policies. Energy Policy 37, 5776–5786. doi:10.1016/j.enpol.2009.08.041
Levinson, A., and Taylor, M. S. (2008). Unmasking the pollution haven effect. Int. Econ. Rev. 49 (1), 223–254. doi:10.1111/j.1468-2354.2008.00478.x
Liobikienė, G., and Butkus, M. (2018). The challenges and opportunities of climate change policy under different stages of economic development. Sci. Total Environ. 642, 999–1007. doi:10.1016/j.scitotenv.2018.06.140
Llop, M. (2023). Environmental taxation and international trade in a tax-distorted economy. Economics 17 (1). doi:10.1515/econ-2022-0038
McEldowney, J. F., and Salter, D. (2016). Environmental taxation in the UK: the climate change levy and policy making. Denning Law J. 28, 37–65. doi:10.5750/dlj.v28i0.1276
Mudronja, G., Jugovic, A., and Skalamera-Alilovic, D. (2020). Seaports and economic growth: panel data analysis of EU port regions. J. Mar. Sci. Eng. 8, 1017. doi:10.3390/jmse8121017
Nanthakumar, L., Muhammad, S., and Roshaiza, T. (2014). The link between green taxation and economic growth on CO2 emissions: fresh evidence from Malaysia. Renew. Sustain. Energy Rev. 38, 1083–1091. doi:10.1016/j.rser.2014.07.057
Onofrei, M., Vatamanu, A. F., and Cigu, E. (2022). The relationship between economic growth and CO2 emissions in EU countries: a cointegration analysis. Front. Environ. Sci. 10, 934885. doi:10.3389/fenvs.2022.934885
Patuelli, R., Nijkamp, P., and Pels, E. (2005). Environmental tax reform and the double dividend: a Meta-Analytical Performance Assessment. Ecol. Econ. 55 (4), 564–583. doi:10.1016/j.ecolecon.2004.12.021
Shen, Y., and Zhang, X. (2022). Study on the impact of environmental tax on industrial green transformation. Int. J. Environ. Res. Public Health 19 (24), 16749. doi:10.3390/ijerph192416749
Tchorzewska, K. B., Garcia-Quevedo, J., and Martinez-Ros, E. (2022). The heterogeneous effects of environmental taxation on green technologies. Res. Policy 51 (7), 104541. doi:10.1016/j.respol.2022.104541
Tetik, S., and Akkaya, B. (2021). “Organizational climate and strategic leadership in Industry 4.0,” in Integration and application of business graduate and business leader competency-models (United States: IGI Global), 201–216.
United Nations (2016). The Paris Agreement. Available at: https://unfccc.int/process-and-meetings/the-paris-agreement?gclid=Cj0KCQiA2KitBhCIARIsAPPMEhIG19rlIyMDtxVjys03TfAyLAWApba_BySuVVoSqa_8ih6TM0tiFqUaAkk2EALw_wcB.
Van Heerden, J., Gerlagh, R., Blignaut, J., Horridge, M., Hess, S., Mabugu, R., et al. (2006). Searching for triple dividends in South Africa: fighting CO2 pollution and poverty while promoting growth. Energy J. 27, 113–142. doi:10.5547/issn0195-6574-ej-vol27-no2-7
Wang, L., and Yan, Y. (2022). Environmental regulation intensity, carbon footprint and green total factor productivity of manufacturing industries. Int. J. Environ. Res. Public Health 19 (1), 553. doi:10.3390/ijerph19010553
Keywords: climate change, greenhouse gas emissions, environmental taxation, environmental policies, panel data, regression
Citation: Huru D, Frățilă (Adam) A, Gavril (Moldovan) IA, Iacob SE and Lădaru GR (2024) Policies and tools for climate change policy implementation: a panel data analysis at industrial and commercial level. Front. Environ. Sci. 12:1380342. doi: 10.3389/fenvs.2024.1380342
Received: 01 February 2024; Accepted: 01 May 2024;
Published: 23 May 2024.
Edited by:
Nikolaos (Nick) Voulvoulis, Imperial College London, United KingdomReviewed by:
Mirela Panait, Petroleum & Gas University of Ploieşti, RomaniaCarmen Nastase, Ștefan cel Mare University of Suceava, Romania
Copyright © 2024 Huru, Frățilă (Adam), Gavril (Moldovan), Iacob and Lădaru. This is an open-access article distributed under the terms of the Creative Commons Attribution License (CC BY). The use, distribution or reproduction in other forums is permitted, provided the original author(s) and the copyright owner(s) are credited and that the original publication in this journal is cited, in accordance with accepted academic practice. No use, distribution or reproduction is permitted which does not comply with these terms.
*Correspondence: Georgiana Raluca Lădaru, cmFsdWNhLmxhZGFydUBlYW0uYXNlLnJv