 Ying Peng
 Zhanglin Zhu2
 Xingyu Tan
 Feng Wu
95% of researchers rate our articles as excellent or good
Learn more about the work of our research integrity team to safeguard the quality of each article we publish.
Find out more
ORIGINAL RESEARCH article
Front. Environ. Sci. , 02 July 2024
Sec. Environmental Economics and Management
Volume 12 - 2024 | https://doi.org/10.3389/fenvs.2024.1378103
Resources and the environment are essential for socioeconomic development. A scientific and reasonable evaluation and forewarning of the resource and environmental carrying capacity (RECC) is of great significance for regional sustainable development. Although great progress has made in existing research on RECC, there is still no consensus on the definition, evaluation and forewarning method for RECC. Therefore, this study introduced the novel concepts of pressure, support and adjustment, proposed a theoretical framework of RECC reflecting the interaction between the above three, constructed a new evaluation index system of RECC, evaluated RECC based on the ratio method, identified important influencing factors using obstacle model, and put forward the hierarchical forewarning method of RECC with the threshold of 1. Finally, a case demonstration in regard to Yichang city, with a prominent ecological and economic status as the location of China’s Three Gorges Project, was conducted. The results revealed that: 1) The average pressure, support, and adjustment exhibited overall upward trends. The pressure and adjustment increased from west to east, while the support of central districts was relatively lower. 2) The RECC of Yichang city and counties improved from 2016 to 2021, increasing from west to east, and the differences in the RECC of various counties were remarkable but gradually shrank. 3) The RECC of Yichang city remained at the Non-Alert Level. The number of counties with RECC values at Alert Level II decreased from two to zero, and the number of counties at the Non-Alert Level increased from eight to ten. Xiaoting and Zhijiang, with more RECC values at Alert Level II, should receive more attention. This study is expected to enrich the methodology of RECC evaluation and forewarning, and provide possible implications for economic development and environmental protection planning in Yichang and other cities of the same type.
RECC refers to the maximum support or guarantee capacity of the natural environment for human production and living activities, and is a common and comprehensive concept used to measure the regional capacity of resources and the environment, as well as sustainable development (Lein, 1993). It is widely acknowledged that RECC research dates from the population theory of Malthus that resources are limited and ultimately have a restraining effect on population growth, which has had an extensive and profound influence on later research (Seidl and Tisdell, 1999; Zhang et al., 2018). With rapid socioeconomic development, the conflicts between more frequent human activities due to the growing population and the RECC have become increasingly prominent. Research on how the expanding global population and material economy will interact to adapt to the Earth’s limited carrying capacity in the coming decades in “The Limits to Growth” has triggered widespread discussion (Meadows et al., 1972). In recent years, the constraints of environment and resources have become enormous challenges facing a multitude of countries, especially developing countries that maintain remarkable economic growth rates (Fan et al., 2017). As the world’s largest developing country, China has made tremendous achievements in economic development since its reform and opening up. However, the contradiction between economic development and environmental and resource protection has sharpened, restricting China’s sustainable development (Peng et al., 2016; Jia et al., 2018; Fu et al., 2020). The 14th 5-Year Plan of China issued in 2021 proposed reasonable urban scales and spatial structures coinciding with the RECC, and how to rationally allocate productive forces and promote the coordination between environmental resource protection and economic development in accordance with the RECC has become a critical issue.
In the past century, numerous studies have focused on the evaluation of the RECC. In terms of evaluation objects, researchers’ attention has been paid from the single elements to comprehensive systems (Huang et al., 2023). The single elements include forest resources (Martire et al., 2015), water resources (Wang et al., 2019a; Qin et al., 2023), land resources (Sun et al., 2020), and the atmospheric environment (Li et al., 2019). Comprehensive systems consist of ecosystems, natural resources systems, and environmental systems. Ecosystems mainly include forest, grassland, water network, and meteorological conditions (Wu and Hu, 2020; Shan et al., 2023). Natural resources systems include water resources, soil resources, biological resources and energy resources (Wang and Fu, 2023). Environmental systems include water, atmosphere, soil and biology environment (Świąder et al., 2020). From the perspective of evaluation methods, qualitative evaluation of RECC appears frequently in early studies, while recent studies pay more attention to quantitative evaluation, which involves static evaluation and dynamic prediction. The carrying capacity of the environment was assessed by using a carrying capacity surplus ratio model and a vector of surplus ratio of carrying capacity model (Liu and Borthwick, 2011); the water resources environmental carrying capacity was quantified by the catastrophe progression method (Wang et al., 2022); the machine learning algorithms was used to assess the future environmental carrying capacity in Khulna City (Morshed et al., 2024). It is generally accepted that the index evaluation method based on a variety of models, such as the Pressure-State-Response (PSR) and Driving forces-Pressures-State-Impacts-Responses (DPSIR) is most commonly utilized, and diverse index systems have been constructed in the light of various RECC definitions and connotations, providing a variety of perspectives and schemes for constructing RECC evaluation systems. For example, the PSR framework was used to develop a indicator system representing ecological and environmental pressure, state and response carrying capacity (Wang and Xu, 2015; Chen et al., 2023); the DPSIR framework was used to evaluate the RECC of Shandong Peninsula urban agglomeration (Fan et al., 2023), and water environment carrying capacity of Shanxi Province (Wang and Fu, 2023). Furthermore, the quantification of RECC can not determine whether the pressure from human activities on environmental resource systems exceeds the carrying capacity or not, therefore it is not the ultimate objective of our research on RECC (Zhang et al., 2019). The roles of RECC in guiding and optimizing land spatial development patterns and the allocation of productive forces should be well played to provide a reference for decision-making by judging whether the RECC is within a reasonable range, which is known as forewarning (Tian and Sun, 2018; Su and Yu, 2020). In view of the essential roles of thresholds in forewarning, the RECC index calculated using the index evaluation method is difficult to use as forewarning due to the currently inconclusive RECC threshold. A small number of researchers have explored the evaluation and forewarning methods from the view of mechanics. According to the spring model, RECC was regarded as the resultant force of natural driving forces, social and economic pressure, and the original ecological health, and then the carrying status of the environmental resource system was assessed (Huang et al., 2018). Besides, the urban RECC was defined as the extent to which urban carriers can carry loads, and could be expressed as the ratio of the urban load to the urban carrier, serving as the basis for the urban RECC threshold setting (Shen et al., 2020). These studies developed a new forewarning method from the perspective of force balance. However, the performance of economic and social systems development, such as economic growth, industrial structure adjustment, technological progress, management ability improvement, is often embedded in the forces of other dimensions, instead of being considered as an independent system with its positive regulation effects on RECC. In general, existing studies on RECC primarily focus on the evaluation methods of RECC. Researchers have developed various evaluation index systems according to their understanding of the connotations of RECC, which have expanded the horizons and ideas on this research field. However, the evaluation results are often limited to inter-regional comparisons and can not serve as the basis for determining whether the RECC of a region is overloaded or not. Moreover, there is insufficient research on the forewarning of the RECC.
Therefore, this study innovatively elucidated the connotation of RECC from the perspective of pressure, support and adjustment. The ratio method has the advantage of using the critical value 1 to confirm the size relationship between the numerator and denominator. Consequently, the RECC was quantified and determined whether it was overloaded or not based on the ratio method. Furthermore, a hierarchical forewarning method of RECC with the threshold of 1 was put forward. The main objectives of this study can be summarized as follows: to 1) analyze the interaction and inherent logic between the RECC and environmental resource pressure resulting from socioeconomic development, support provided by environmental resource endowments, and positive adjustments in the RECC due to progress in science and technology, industry, economy, and management; 2) construct a new evaluation index system from the perspective of pressure, support, and adjustment, and quantify the regional RECC and determine whether it is overloaded or not using the ratio method; 3) explore the hierarchical forewarning method with the threshold of 1; 4) conduct a case demonstration with reference to Yichang city; and 5) enrich the RECC research methodology and provide possible implications for economic development and environmental protection planning in Yichang and other cities of the same type.
The RECC is a comprehensive and complex system. Regional and urban carrying capacity is a combination of resources, environment and socio-economic factors (Ren et al., 2021; Tan et al., 2023), which can be reflected by the relationship between the “carrier” (supporting object) and “bearing object” (Wu and Hu, 2020). The “carrier” and “bearing object” can be regarded as the support and pressure respectively. Pressure refers the negative impact of regional urban construction, industrial layout and population agglomeration on local resources, environment and ecology, such as resource consumption, environmental pollution and ecological damage (Elahi et al., 2022; Liu et al., 2023). The support reflects the supporting capacity of regional resource endowment, environmental status, self-purification capacity of ecological environment for economic and social development activities (Xiong et al., 2023), mainly determined by the inherent characteristics and service capacity of the regional natural ecosystem. In addition, the RECC is closely related to the level of regional economic development (Cui et al., 2022), and technical progress will improve the RECC (Shen et al., 2020). With the progress of regional science and technology, adjustment of industrial structure, economic growth, and improvement of management capacity, the efficiency of resource output, the level of environmental pollution control, and the capacity of ecological protection and restoration will continue to be enhanced, forming increments of resource and environment support that exceeds the regional natural resources and the self-purification capacity of the ecological environment. It plays an important role in the RECC and can be regarded as the adjustment. On the whole, the RECC is determined by the relationship between the pressure caused by economic and social development on the natural ecological environment, the support of the natural ecological environment, and the adjustment of technology and economy. The theoretical framework of RECC is shown in Figure 1.

Figure 1. Components of RECC system from the perspective of Pressure-Support-Adjustment.
At present, the RECC evaluation index system has not reached a consensus, resulting in the great differences in evaluation results reported in different studies. It is essential to construct a scientific and reasonable evaluation index system on the basis of well understanding of components of RECC system and their interactions. The index system was constructed according to the connotations of different systems, as shown in Table 1.
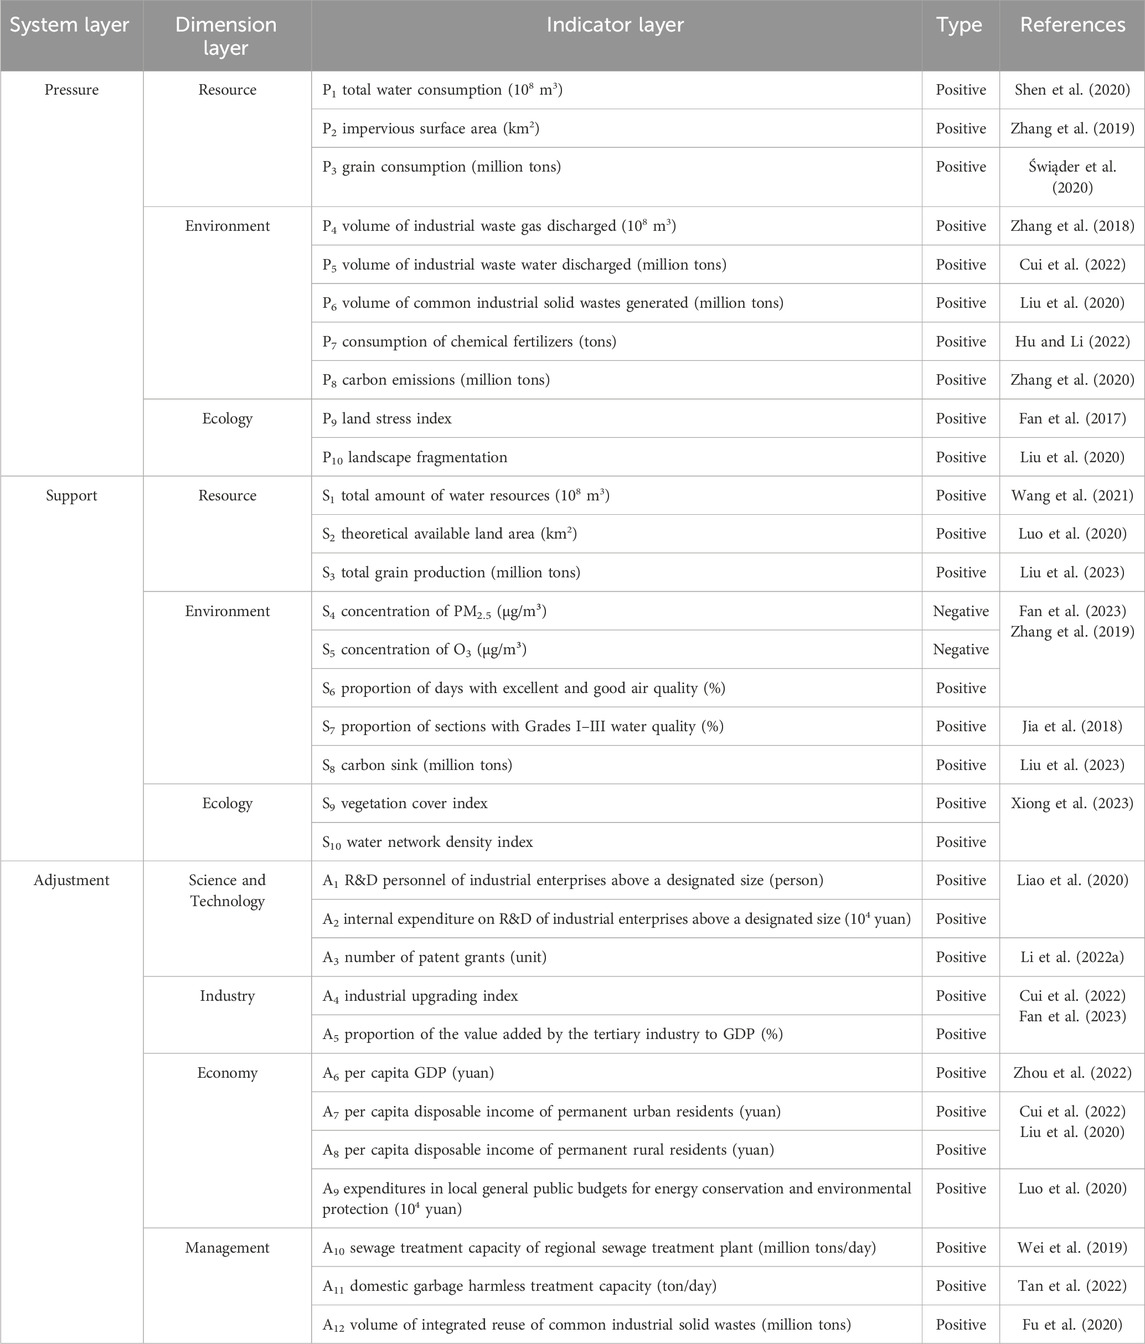
Table 1. RECC evaluation index system.
Pressure includes the resource pressure, the environmental pressure, and the ecological pressure. The resource pressure includes the total water consumption, impervious surface area, and grain consumption, which mainly reflect the pressure of regional development and population agglomeration on the water resources, land resources, and grain resources. Considering both urban and rural areas, the environmental pressure is expressed by the volume of industrial waste gas discharged, volume of industrial waste water discharged, the volume of common industrial solid waste generated, the consumption of chemical fertilizers, and carbon emissions. Ecological pressure mainly reflects the pressure on the ecosystem under human activities, which is expressed by the land stress index and landscape fragmentation.
In response, the supports include resource support, environmental support, and ecological support. In detail, the resource support reflects the main natural resources that a region can provide, which are represented by the total amount of water resources, the theoretical available land area, and the total grain production. The theoretical available land area is obtained by deducting the ecological conservation red line area from the total regional land area. The environmental support reflects the environmental pollution absorption and purification ability, which is expressed by the average annual concentration of PM2.5, the average annual concentration of O3, the proportion of days with excellent and good air quality, the proportion of sections with Grades I-III water quality, and the carbon sink. The ecological support reflects the service capacity of the ecosystem, which is represented by the vegetation cover index and water network density index.
The adjustment includes adjustments in science and technology, industry, the economy, and management. Adjustments in science and technology are reflected by the research and experimental development (R&D) personnel of industrial enterprises above a designated size, the internal expenditure on R&D of industrial enterprises above a designated size, and the number of patent grants. The industrial adjustment is expressed by the industrial upgrading index and the proportion of the value added by the tertiary industry to the gross domestic product (GDP), in which the industrial upgrading index is calculated by the ratio of the output value of the tertiary industry and the secondary industry. The economic adjustment is represented by the per capita GDP, per capita disposable income of permanent urban residents, per capita disposable income of permanent rural residents, and expenditures in local general public budgets for energy conservation and environmental protection. The management adjustment is mainly represented by the sewage treatment capacity of regional sewage treatment plants, the domestic garbage harmless treatment capacity, and the volume of integrated reuse of common industrial solid wastes.
The EWM is an objective weighting method that can avoid the errors and shortcomings of subjective judgments. Therefore, the EWM was selected to determine the weights of evaluation indicators in this study (Jia et al., 2018; Cui et al., 2022). The main steps used in the EWM are described below.
Step 1. Normalized decision matrix
A decision matrix was constructed with m evaluation objects and n evaluation indicators. Due to the differences in the order of magnitude of each indicator, the positive indicators were standardized using Eq. 1 and the negative indicators were standardized using Eq. 2 to eliminate the influence of different magnitudes on the evaluation results. Eqs 1, 2 are calculated as follows:
where
Step 2. The weights of RECC-level evaluation indicators are determined, as shown in Eqs 3–6:
where
The comprehensive index of each evaluation area was calculated using the linear weighted method, as in Eq. 7:
where
The obstacle model has been widely used in diagnosing the main obstacle factors of evaluation index systems (Guo et al., 2018). Thus, this paper introduces the obstacle model to identify the main obstacle factors of each subsystem. The calculation method is shown in Eq. 8:
where
This paper uses the ratio method to calculate the RECC index to describe the relative state of the RECC. The calculation method is shown in Eq. 9:
where
A hierarchical forewarning method with the threshold of 1 was adopted in this paper according to the value of RECC. As shown in Table 2, with

Table 2. RECC forewarning levels and signs.
Yichang city (110°15′E–112°04′E, 29°56′N–31°34′N) is located in the southwest of Hubei Province, China, with a total area of approximately 21,200 km2. The city consists of 13 county-level administrative regions (Yiling, Xiling, Wujiagang, Dianjun, Xiaoting, Yidu, Zhijiang, Dangyang, Yuanan, Xingshan, Zigui, Changyang, and Wufeng) and accounts for approximately 11.4% of Hubei Province (Figure 2). Moreover, Yichang city is situated on the boundary between the second and third levels of stepped terrain in China, which is also the site for two important national projects: the Three Gorges Project and the Gezhouba Project. This is the source area for ensuring water environment security in the middle and lower reaches of the Yangtze River, and an ecologically sensitive area in the Yangtze River Basin. In 2018, President Xi established the principle of promoting well-coordinated environmental conservation and avoiding excessive development for the construction of the Yangtze River Economic Belt in Yichang. Yichang is an important link in the city cluster in the Chengdu-Chongqing region as well as the city cluster along the middle reaches of the Yangtze River. In addition, Yichang is the core city of the Yichang-Jingzhou-Jingmen metropolitan area in Hubei Province. Yichang city has a prominent ecological and economic status, with the important development goal of building a demonstration city for the protection of the Yangtze River, and there is a great theoretical and practical demand for coordinating urban and rural areas as well as resources and the environment to achieve green and sustainable development.
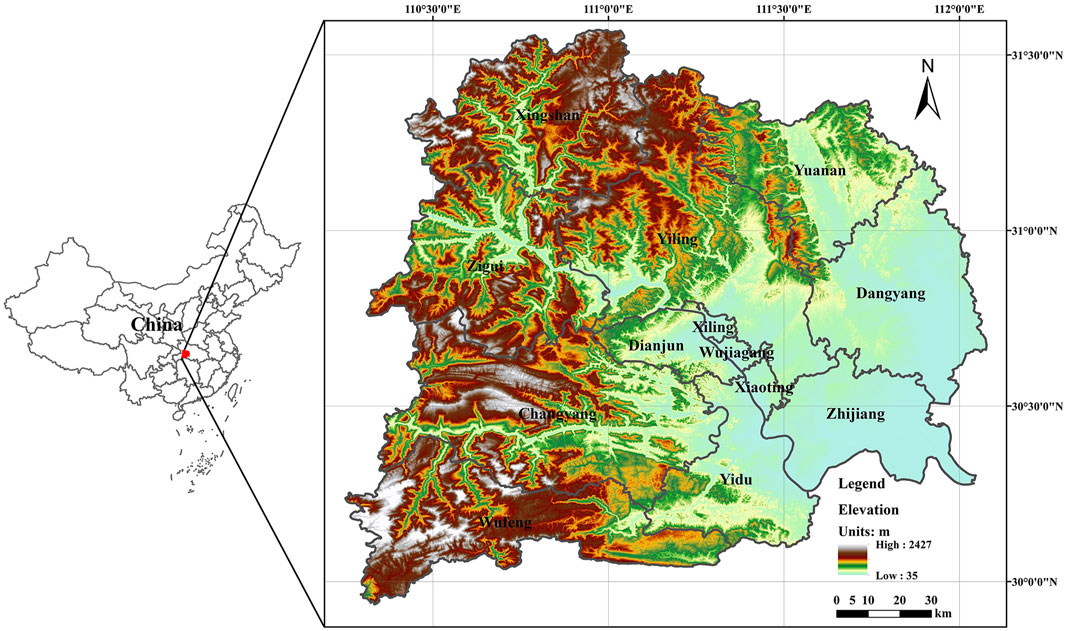
Figure 2. Geographical location of Yichang city.
The socioeconomic data were mainly obtained from the Yichang Statistical Yearbook1, Hubei Rural Statistical Yearbook2, the official website of the National Bureau of Statistics of China3, the official website of the China National Intellectual Property Administration4, and Economic Prediction System (EPS) data platform5. The environmental quality data were mainly obtained from the Ecological and Environmental Status Assessment Report of Hubei Province6 and the Environmental Statistics Database of Hubei Province. The land cover data and the nighttime light remote-sensing data were derived from the datasets of related studies (Wu et al., 2021; Yang and Huang, 2021). In addition, a small amount of missing data was completed by interpolation.
The temporal variations of the pressure index in the counties (county-level cities and districts) of Yichang city are shown in Figure 3A. The pressure index displayed an overall rise with fluctuations, rising from 0.2562 in 2016 to 0.2685 in 2021, for an increase of 4.80%. The changes in the pressure index of counties can be divided into three types in accordance with their characteristics, namely, overall declines with fluctuations, overall increases with fluctuations, and initial increases followed by decreases. The temporal variations of the pressure index in Xiaoting, Xingshan, and Dangyang manifested overall declines with fluctuations, with decreases of 6.38%, 29.07%, and 16.77%, respectively. The ecological pressure of Xiaoting, Xingshan, and Dangyang all increased, whereas the resource and environmental pressure both decreased, and the declines of environmental pressure were the largest with decreases of 12.27%, 46.52%, and 28.94%, respectively, contributing more to the decreases in the pressure index. The temporal variations of the pressure index in Dianjun, Wujiagang, Yiling, Yuanan, Wufeng, Yidu, and Zhijiang indicated overall increases with fluctuations, with greater increases of 33.07%, 20.54%, 17.59%, and 17.21%, respectively, while the resource pressure slightly decreased in Dianjun and Yuanan, and the pressure of three subsystems in other counties all increased greatly, resulting in the overall rises in the pressure index. The temporal variations of the pressure index in Xiling, Changyang, and Zigui showed initial increases followed by decreases. Furthermore, the pressure index of Xiling increased by 10.86% in 2021 compared to 2016, while those of Changyang and Zigui decreased by 11.07% and 1.67%, respectively. The increases in pressure of three subsystems in Xiling induced the rising pressure index. However, the slight increases in ecological pressure in Changyang and Zigui did not seem to have effects, and the decreases in resource and environmental pressure made major contributions to the drops of pressure. The pressure subsystem index of counties is displayed in Figure 3B. The environmental pressure index curve was mostly located outside the resource and environment pressure index curves in 2016, indicating that the environmental pressure index was higher than the resource and ecological pressure indices in most counties. The relative positions of the resource, environment and ecology pressure curves remained stable up to 2021, manifesting the consistent large contribution of environmental pressure to environmental resource pressure.
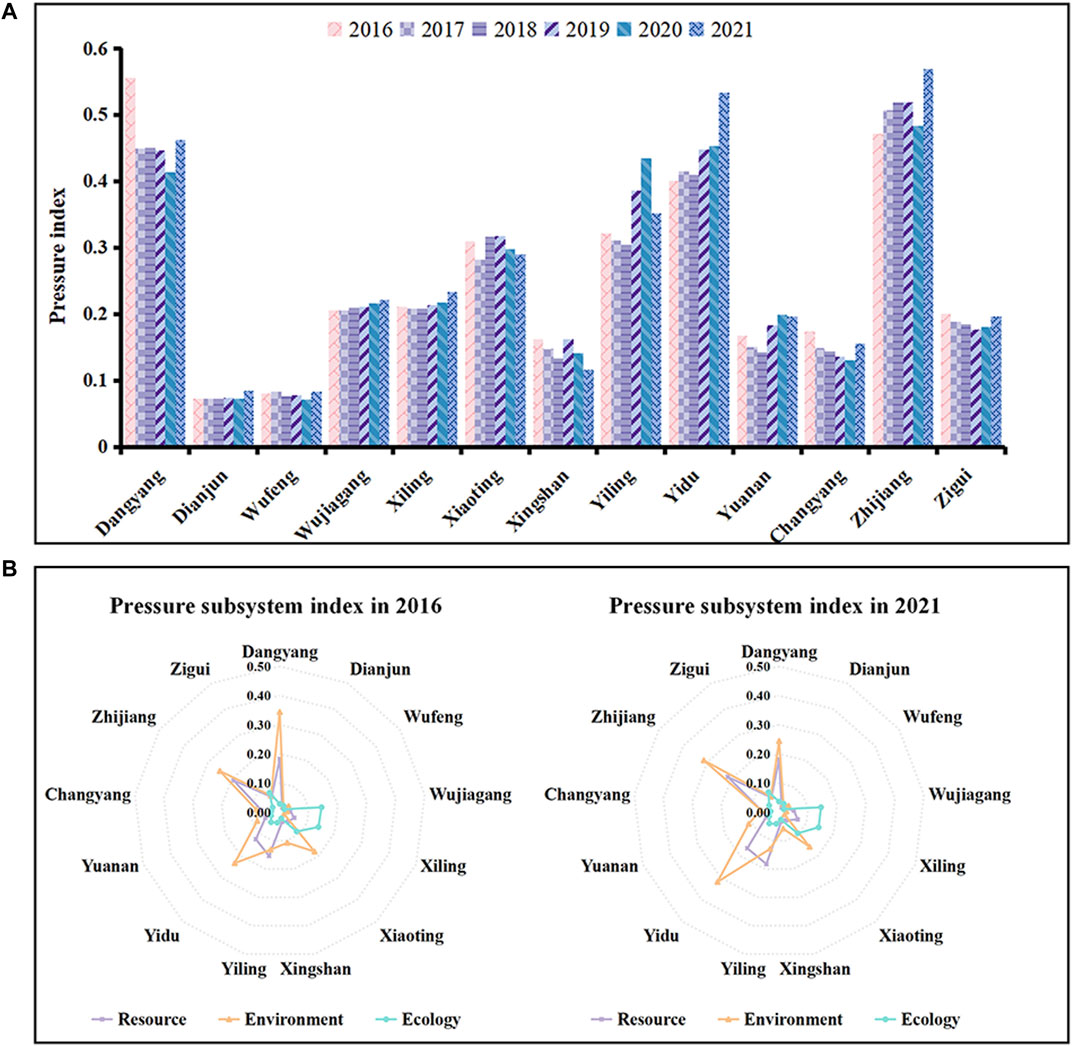
Figure 3. The pressure index of all county-level administrative regions of Yichang city. (A) Represents the pressure index of all county-level administrative regions of Yichang city from 2016 to 2021. (B) Represents the pressure subsystem index of all county-level administrative regions of Yichang city in 2016 and 2021.
The spatial patterns of the pressure index of Yichang city in 2016 and 2021 are displayed in Figure 4. It was found that the spatial distribution of the pressure index of Yichang city increased overall from west to east. Higher pressure index values of Dangyang, Zhijiang, and Yidu in the east were consistently identified due to the greater resource and environmental pressure in these areas. For example, in 2021, Zhijiang, Dangyang, and Yidu ranked first, third, and fourth in resource pressure and second, third, and first in environmental pressure, respectively. Lower pressure index values of Xingshan, Changyang, and Wufeng in the western area were persistently found as a result of their lower resource and ecological pressure. For example, Wufeng and Xingshan ranked second and third from the bottom in terms of the resource pressure index, respectively, while Xingshan, Changyang, and Wufeng were ranked as the bottom three in terms of ecological pressure in 2021. In 2016 and 2021, the average pressure indices of Dangyang, Zhijiang, and Yidu in the eastern area were 3.4 and 4.4 times higher than those of Xingshan, Changyang, and Wufeng in the western area, respectively.
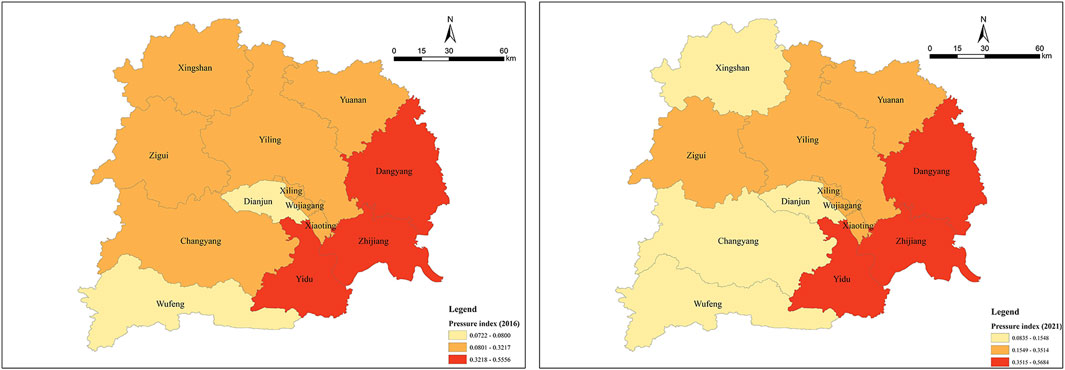
Figure 4. Spatial distribution of pressure index of Yichang city in 2016 and 2021.
From the perspective of time trends (Figure 5A), the support index of Yichang city increased from 0.3867 to 0.4005 from 2016 to 2021, indicating that the supporting force improved. The temporal changes of the support index in all county-level administrative regions presented the same characteristics, which showed a trend of declining-rising-declining, with 2019 and 2020 as the breakpoint. The support indices of Changyang, Wufeng, and Yidu decreased by 3.02%, 1.44%, and 1.33%, respectively; although the environmental and ecological support indices in these regions increased, the resource support indices declined by 17.05%, 14.88%, and 15.52%, respectively, resulting in an overall decline in the support index. The support indices of other county-level administrative regions increased, Wujiagang and Xiling had larger increases at 34.61% and 15.04%, respectively, mainly because of the great contributions of environmental support. The environmental support indices of Wujiagang and Xiling increased by 209.61% and 199.40%, respectively, indicating that the environmental governance in the central districts had obvious achievements. Radar diagrams of subsystem indices are shown in Figure 5B. The environmental support index curve was mostly located inside the resource support index curve in 2016, manifesting that the resource support index in most regions was higher than the environmental support index. However, the environmental support index curve mostly extended to the outside of the resource support curve in 2021, suggesting that the environment support index of most areas was higher than the resource with the effective environmental governance, and the contribution degree of environment support was continuously improved. In contrast, the changes in the ecological support index were not obvious.
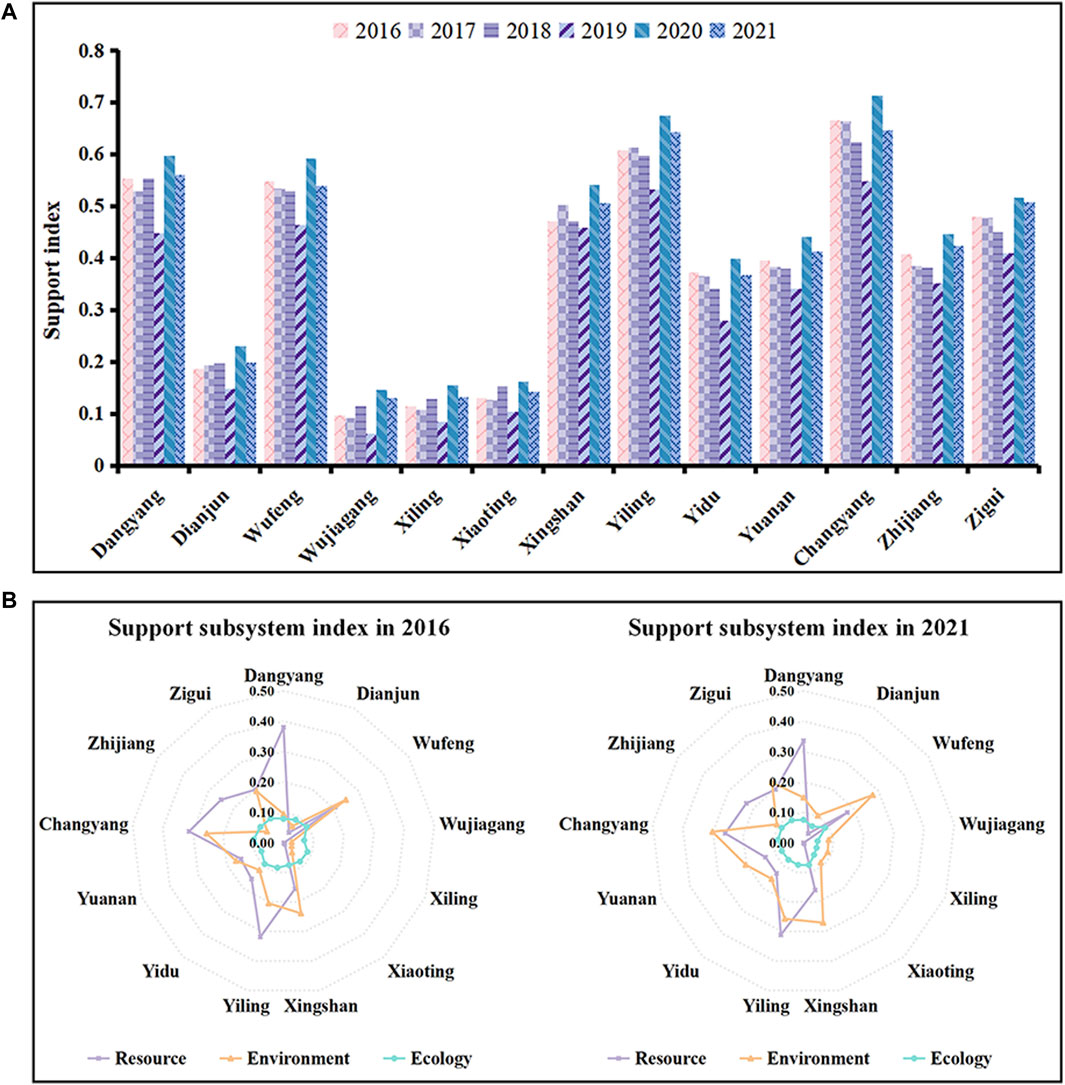
Figure 5. The support index of all county-level administrative regions of Yichang city. (A) Represents the support index of all county-level administrative regions of Yichang city from 2016 to 2021. (B) Represents the support subsystem index of all county-level administrative regions of Yichang city in 2016 and 2021.
From the perspective of spatial distribution characteristics (Figure 6), the support index of all county-level administrative regions generally presented the pattern of high in the west and low in the east, and the support indices of Yiling, Dangyang, Changyang, and Wufeng were in the high-value range, mainly because these regions had comparative advantages in resource support and environmental support. For example, the resource support indices of Dangyang, Yiling, Changyang, and Wufeng ranked first, second, third, and sixth in 2021, respectively; the environmental support indices of Changyang, Wufeng, and Yiling ranked first, second, and fourth, respectively; and the ecological support indices of Wufeng and Changyang ranked first and third, respectively. The values of support indices of Dianjun, Xiaoting, Xiling, and Wujiagang were relatively lower due to their poor resource, environmental, and ecological support. For example, the resource, environmental, and ecological support indices of Dianjun, Xiaoting, Xiling, and Wujiagang ranked in the bottom in 2021. Changyang always had the highest support index, while Wujiagang always had the lowest support index. The ratio between the values of Changyang and Wujiagang decreased from 6.87 to 4.95, with a large but shrinking difference.
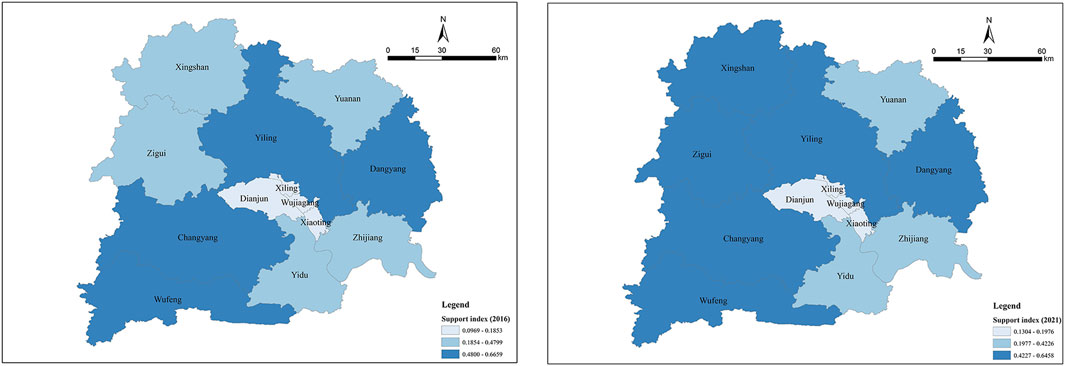
Figure 6. Spatial distribution of support index of Yichang city in 2016 and 2021.
The trend of the adjustment index is shown in Figure 7A. The adjustment index of Yichang city increased from 0.1668 to 0.2769 from 2016 to 2021, indicating an overall improvement in the adjustment capability. The temporal variation characteristics of the adjustment index in various regions were almost consistent with upward trends, except for in Xingshan. In detail, the adjustment index of Xingshan decreased by 5.47% because of the large decline in the science and technology, and management adjustment indices. The increases of the adjustment index in Zhijiang and Yidu were 151.58% and 107.49%, respectively. Scientific and technological innovation had a significant positive effect on the RECC of Zhijiang (the scientific and technological adjustment index increased by 175.20%), while the environmental management effect of Yidu was prominent (the management adjustment index increased by 142.21%). In addition, the radar chart of the adjustment subsystem index values in 2016 and 2021 (Figure 7B) showed that the industry adjustment index curve was mostly inside the technology, economy, and environmental management adjustment index curves from 2016 to 2021, indicating that the values of the industry adjustment index in most regions were significantly lower than those of the other three adjustment subsystem indices, and the development level of green industrialization and industrial greenization should be further improved. Some sharp spikes appeared in the curves of the technology and environmental management adjustment indices, indicating a polarization trend in the process of technological innovation and environmental management development in various regions.
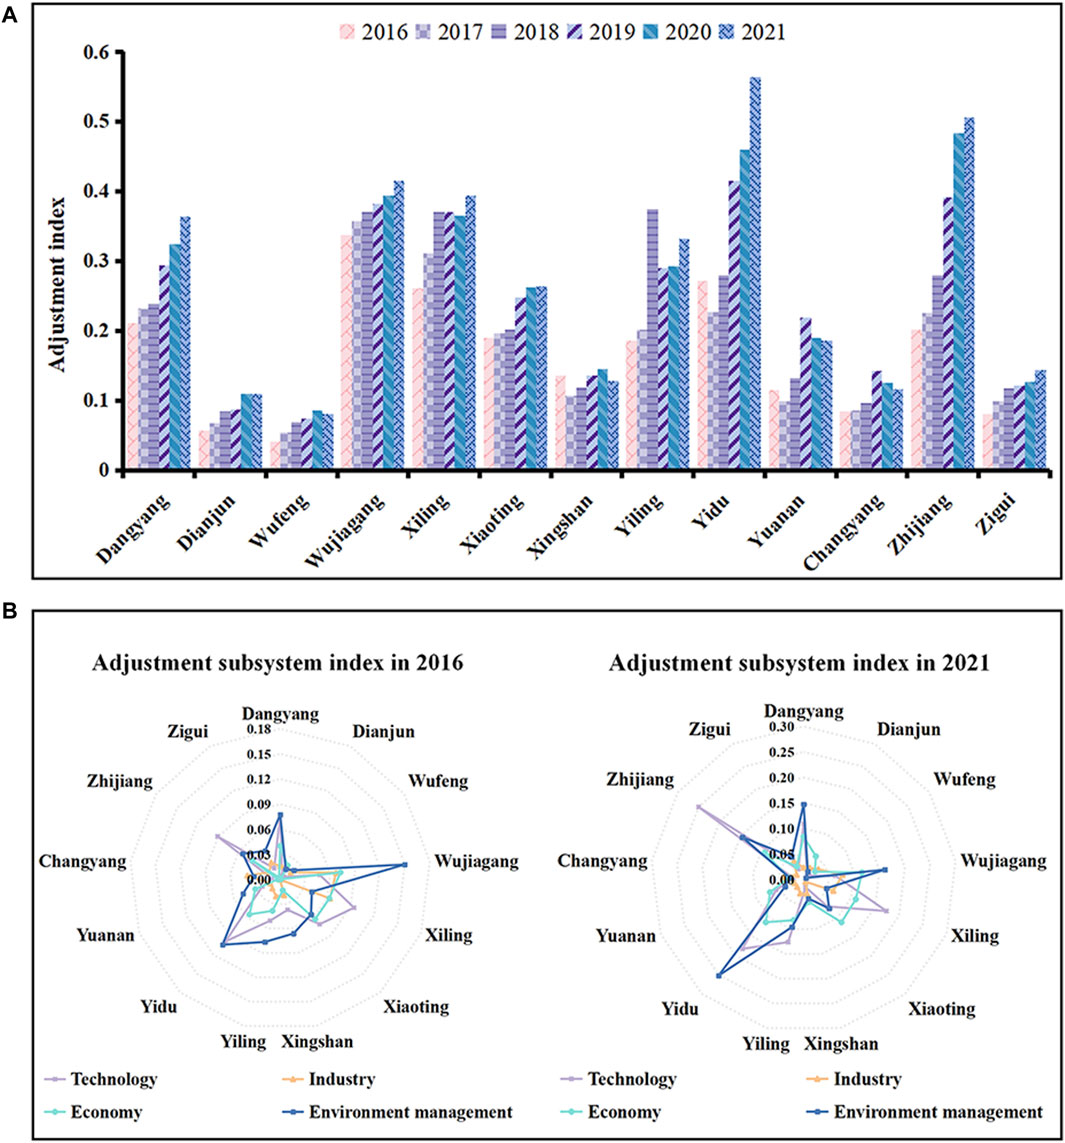
Figure 7. The adjustment index of all county-level administrative regions of Yichang city. (A) Represents the adjustment index of all county-level administrative regions of Yichang city from 2016 to 2021. (B) Represents the adjustment subsystem index of all county-level administrative regions of Yichang city in 2016 and 2021.
In terms of spatial distribution characteristics (Figure 8), the spatial distribution pattern of the adjustment index values in Yichang city was lower in the west and higher in the east. Yidu and Zhijiang had high adjustment values due to their advantages in environmental management and technology adjustment. For example, in 2021, Yidu and Zhijiang not only ranked first and fourth in the environmental management adjustment index, but also ranked second and first in the technology adjustment index, respectively. Xingshan, Zigui, Changyang, Wufeng, and Dianjun in the west of Yichang city, as well as Yuanan, were low-value areas of adjustment, mainly because there were low technology, economy, and environmental management adjustment index values in these areas. For example, Xingshan, Changyang, Wufeng, and Dianjun ranked among the bottom five in terms of the technology, economy, and environmental management adjustment indices in 2021. In summary, Yidu was the region with the highest adjustment index, while Wufeng was the region with the lowest adjustment index. The ratio of the highest and lowest index values increased from 6.56 to 6.96, manifesting significant differences with slight expanding trends.
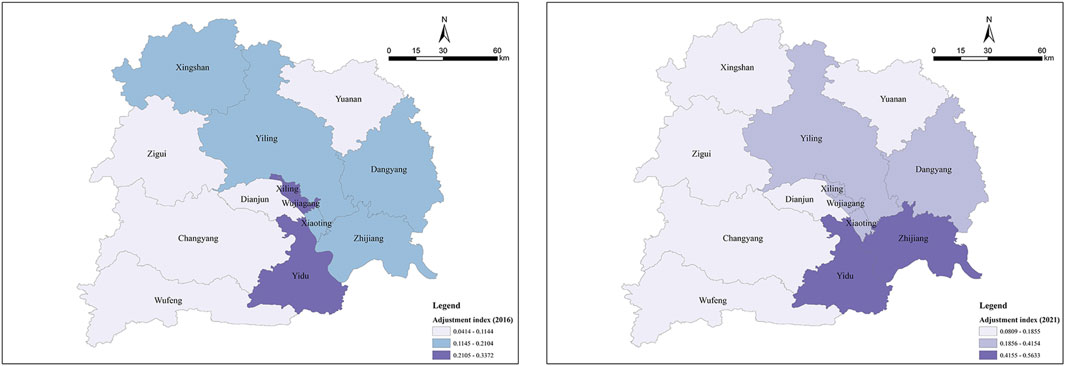
Figure 8. Spatial distribution of adjustment index of Yichang city in 2016 and 2021.
To identify the main obstacle factors in each subsystem, this study introduced the obstacle model to calculate the obstacle degree of all indices of all regions from 2016 to 2021. The factors with top three obstacle degree were selected as major obstacle factors; then, according to the occurrence frequency of these major obstacle factors, the top three indicators were selected as the main obstacle factors of different regions. If some indicators had the same frequency, further screening was conducted according to the average obstacle degree of each indicator in different years. The results are shown in Table 3.
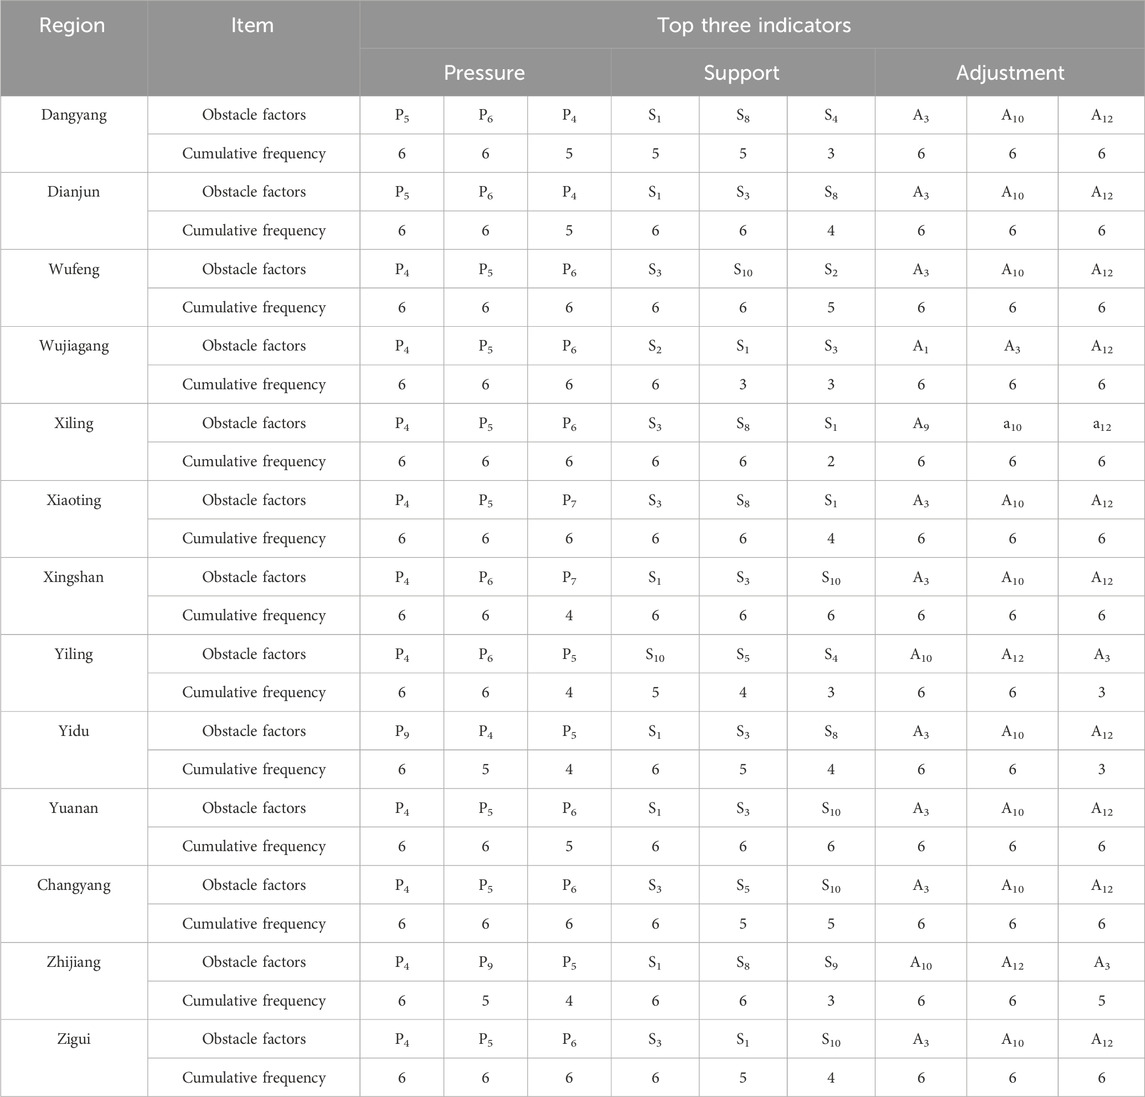
Table 3. Main obstacle factors and frequencies in all county-level administrative regions.
Firstly, the main obstacle factors of the pressure subsystems can be divided into the following two types: the mixed dominance of the environmental pressure and ecological pressure indicators, and the pure dominance of environmental pressure indicators. In detail, Yidu and Zhijiang, with high pressure indices, belonged to the former type, and their main obstacle factors were volume of industrial waste gas discharged (P4), volume of industrial waste water discharged (P5), and the land stress index (P9). The remaining 11 regions had the latter type of obstacle factors. The major obstacle factors of Xiaoting and Xingshan were volume of industrial waste gas discharged (P4), volume of industrial waste water discharged (P5), the volume of common industrial solid waste generated (P6), and the consumption of chemical fertilizers (P7), while the main obstacle factors of Dangyang, Yiling, Wujiagang, Xiling, Dianjun, Yuanan, Changyang, Zigui, and Wufeng were volume of industrial waste gas discharged (P4), volume of industrial waste water discharged (P5), and volume of common industrial solid waste generated (P6). Secondly, the main obstacle factors of the support subsystem exhibited contiguous and similar characteristics. The main obstacle factors in the central districts of Yichang city were almost the same, including the total amount of water resources (S1), theoretical available land area (S2), total grain production (S3), and carbon sink (S8), which were concentrated in the resource support and environmental support categories. The RECC improvement of Xingshan and Zigui in the northwest and Yuanan in the north of Yichang city was greatly constrained by resource and ecological support, with the main obstacle factors being the total amount of water resources (S1), total grain production (S3), and water network density index (S10). The main obstacle factors of Dangyang and Zhijiang in the east were similar, and included the total amount of water resources (S1) and the carbon sink (S8). The common obstacle factors of Wufeng and Changyang in the southwest were the total grain production (S3) and water network density index (S10). In addition, the improvement of the RECC of Yiling was greatly constrained by the indicators of the water network density index (S10), the concentration of O3 (S5), and the concentration of PM2.5 (S4); these indicators were mainly concentrated in environmental air quality. Thirdly, the main obstacle factors of the adjustment subsystem in various regions were generally consistent, consisting of the number of patent grants (A3), sewage treatment capacity of regional sewage treatment plants (A10), and volume of integrated reuse of common industrial solid wastes (A12); these indicators were concentrated in technology adjustment and environmental management adjustment.
From the perspective of time trend (Figure 9), the average RECC of all county-level administrative regions in Yichang city decreased from 0.4731 to 0.3872 from 2016 to 2021, indicating that the overall RECC of Yichang city displayed a trend of improvement, and the RECC of every county-level administrative region showed a downward trend. Xingshan, Dangyang, and Xiaoting ranked as the top three in Yichang city, with decrease rates of 32.16%, 31.19%, and 26.24%, while the decrease rates of Wufeng and Yuanan were relatively lower at 0.94% and 0.42%, respectively. The average support index value of all county-level administrative regions increased from 0.3867 to 0.4005, exhibiting a rate of 3.57%, and the average value of adjustment increased from 0.1668 to 0.2769, with a rate of 66.03%. At the same time, the average value of pressure increased from 0.2562 to 0.2685.
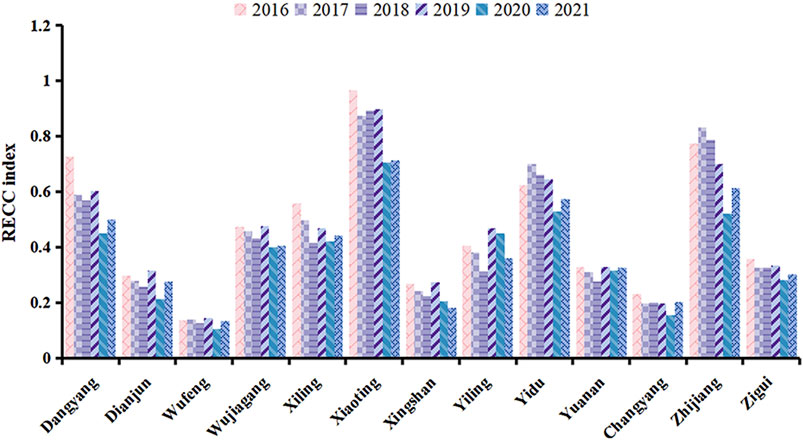
Figure 9. RECC index of all county-level administrative regions of Yichang city.
From the perspective of spatial distribution characteristics (Figure 10), the RECC of each county-level administrative region displayed a consistent pattern of being high in the east and low in the west. In 2016, Xiaoting, Zhijiang, and Dangyang constituted the high-value area with RECC values of 0.9670, 0.7744, and 0.7271, respectively, ranking as the top three in Yichang city. In 2021, Xiaoting, Zhijiang, Yidu, and Dangyang constituted the high-value area with RECC values of 0.7133, 0.6126, 0.5735, and 0.5003, respectively, ranking as the top four in Yichang city. The states of RECC in these regions were relatively poor, and the gaps between regions were large. However, the RECC in those regions with high values decreased significantly, and the ratio of the highest RECC value to the lowest RECC value narrowed from 7.12 to 5.30 from 2016 to 2021, indicating that the RECC of county-level administrative regions exhibited an overall improvement.
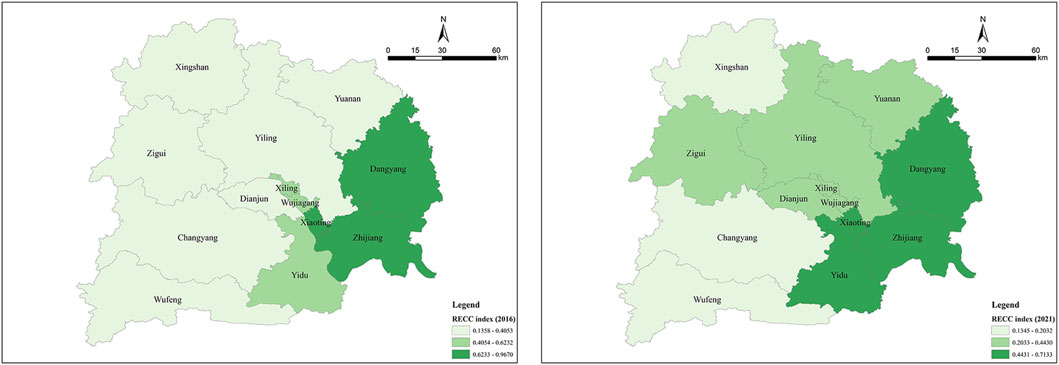
Figure 10. Spatial distribution of RECC index of Yichang city in 2016 and 2021.
The trend of RECC in each year and the hierarchical forewarning are shown in Figures 11, 12. The RECC of Yichang city remained at the Non-Alert Level (RECC ≤ 0.5) from 2016 to 2021, and there was still a large gap from the critical value, indicating that the pressure on the resources and environment of Yichang city was within the tolerable range of support and adjustment. In 2021, the RECC of Xiaoting, Zhijiang, Yidu, and Dangyang belonged to Alert Level I. Although the RECC conditions in these regions were relatively good, it should be noted that the RECC of Xiaoting (0.7133) was close to the limit of Alert Level II. Overall, the trends of RECC warning levels could be roughly divided into two types. The first type was relatively stable, and included the regions of Changyang, Dianjun, Wufeng, Wujiagang, Xingshan, Yidu, Yiling, Yuanan, and Zigui. Among these regions, the RECC of Yidu always belonged to Alert Level I, while the other eight regions belonged to the Non-Alert Level. The second type exhibited progressive improvement, and included the regions of Dangyang, Xiaoting, Xiling, and Zhijiang. Among these regions, the RECC of Xiling and Dangyang declined from Alert Level I to the Non-Alert Level, and the alert levels of Xiaoting and Zhijiang were downgraded from Alert Level II to Alert Level I.
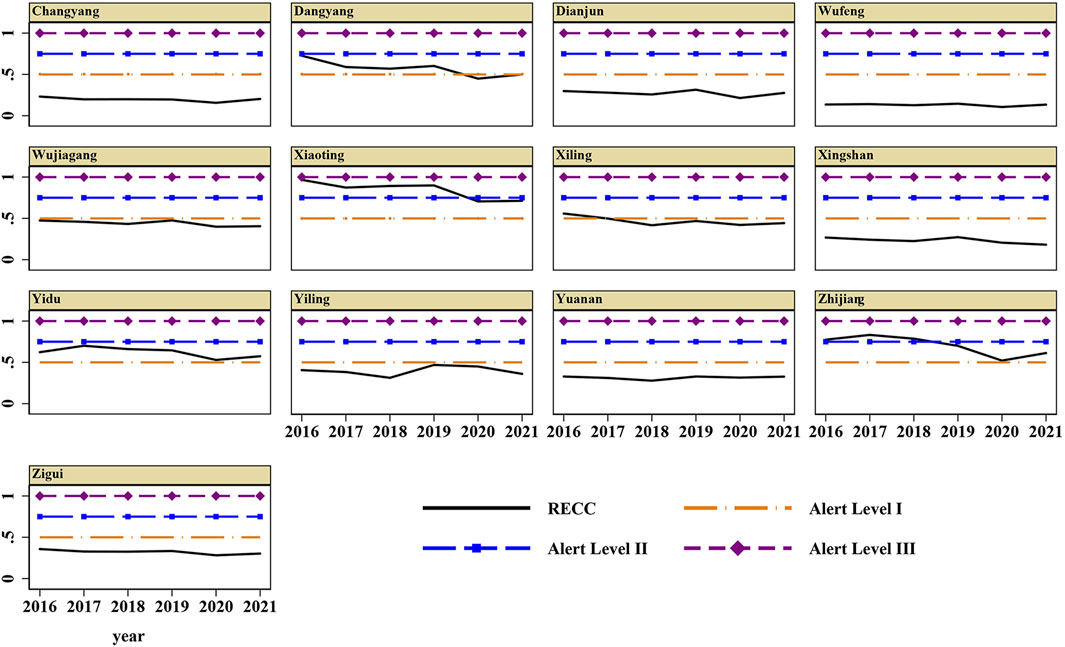
Figure 11. RECC index trends of all county-level administrative regions of Yichang city from 2016 to 2021.
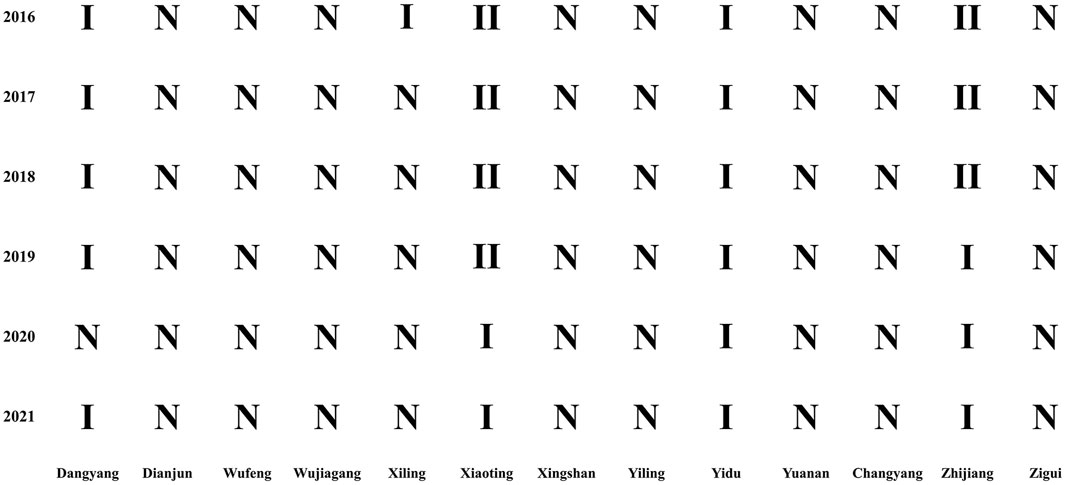
Figure 12. RECC alert levels of all county-level administrative regions of Yichang city.
In terms of the changes in the number of regions with different warning levels, the number of warning areas decreased from two to zero, while the number of Non-Alert Level areas increased from eight to nine. In 2021, all counties and cities in Yichang city were below the limit of Alert Level II, which implied that the resource and environment pressure was tolerable. The main reasons for this finding are as follows. Firstly, Yichang city adhered to the concept of green and low-carbon development, promoted the adjustment of its industrial structure, and strengthened technological innovation and the construction of environmental infrastructure, resulting in an increased level of resource utilization and environmental quality. Secondly, the continuous improvement of scientific research and investment in environmental protection led to increasing trends in support and adjustment. Finally, under the influence of the COVID-19 pandemic, production and living activities in the city were greatly affected, the ambient air quality was significantly improved, and the environmental support was also enhanced to a certain extent. Only Xiaoting and Zhijiang ever reached Alert Level II, with frequencies of four and three, respectively, indicating special attention in need.
From the perspective of temporal variation, the interference of human production and living activities on the resource and environmental systems inevitably intensified with the progress of economy and society (Zhang et al., 2019). This led to increasing resource consumption, ecological destruction, and environmental pollution, which exerting greater pressure on the resource and environmental systems (Ma et al., 2017; Wang et al., 2019b). Concurrently, with the intensification of ecological protection and restoration, advancement in technology, industrial development, and improvement in economy and management, the support and adjustment demonstrated increasing trends, which to some extent confirmed the previous findings of scholars (Wu and Hu, 2020). The increments in the support and adjustment exceeded that in the pressure, resulting in an overall decrease in the RECC of Yichang city. Due to the reduction in the extent of resource consumption, ecological destruction, and environmental pollution, as well as synchronous improvements in regional resource environmental conditions and environmental governance capabilities, there were substantial declines in the RECC values for Xingshan, Dangyang, and Xiaoting, and their improvement rates of RECC ranked the top three in Yichang. In contrast, due to the negligible changes in the pressure and support with relatively lower adjustment, the improvement rates of RECC of Wufeng and Yuanan ranked at the bottom two within the city. In particular, the outbreak of COVID-19 at the end of 2019 had a major impact on the economic and social development of Hubei Province (Ke and Hsiao, 2022), the reduction in the intensity of production and living activities led to a notable decrease in the pressure on the resource and environmental systems caused by resource consumption and environmental pollution. Meanwhile, the significant improvement in the regional resource and environmental conditions resulted in a substantial increase in the support (Firozjaei et al., 2021). With the minimal variation of adjustment, the RECC value of Yichang city in 2020 saw a significant decrease compared to 2019, indicating a marked improvement in the resource and environmental carrying status. However, after 2020, as production and living activities gradually resumed, the pressure on the resource and environmental systems increased, while the support diminished, resulting in a slight rise in the RECC.
From the spatial distribution, Xingshan, Zigui, Changyang and Wufeng in the west are mountainous counties endowed with excellent resource and environmental conditions, exhibiting significantly higher support compared to the central and eastern regions. Xiaoting, Zhijiang, Dangyang, and Yidu in the central and eastern areas are the agglomeration zones for the pillar chemical industry and population, so these regions experienced higher resource consumption, ecological destruction, and environmental pollution compared to the west (Zhu et al., 2020), leading to greater pressure on the resource and environmental systems. The RECC index of all county-level administrative regions increased from west to east. The agglomeration of population and chemical industry in the central and eastern areas also promoted advancements in technology, economy and management. For instance, in 2021, the GDP of Yidu, Zhijiang, Dangyang and Yiling in the central and eastern areas ranked at the top four within the city, fostering the improvement of adjustment. The increasing adjustment in the eastern region gradually narrowed the gap of RECC values between the eastern and western regions.
The average RECC values of 13 county-level administrative regions in Yichang city from 2016 to 2021 were all less than 0.5, belonging to the Non-Alert Level, which can be attributed to much higher the support and adjustment than pressure due to the improvement in ecological environment quality, industrial structure upgrading, and advancement in science and technology. There is still room for improvement in population and industrial agglomeration in Yichang city, on the premise that the pressure does not exceed the support and adjustment, and seeks a dynamic balance between economic development and ecological environmental protection. From 2016 to 2021, the number of regions at the Non-Alert Level increased from eight to ten. In 2021, the RECC values of 13 county-level administrative regions in Yichang city were all below Alert Level II, and those of Dangyang, Xiaoting, Yidu and Zhijiang were at Alert Level I. It should be noted that Xiaoting and Zhijiang were at Alert Level II in previous years.
To reduce the forewarning levels of RECC values of these regions, some measures should be implemented. The higher RECC values in Zhijiang and Yidu can be attributed to their higher pressure index but lower support index. The main obstacle factors of pressure system of Zhijiang and Yidu are volume of industrial waste gas discharged, volume of industrial waste water, and land stress index. Therefore, Zhijiang and Yidu should accelerate the transformation and upgrading of industries, as well as the promotion of cleaner production in industrial parks, and enterprises, to reduce the emission of pollutants (Gao et al., 2020; Li Q. et al., 2022; Cui et al., 2022). Moreover, it is essential to alleviate the pressure on the ecology system by strengthening the conservation and intensive use of land resources and the control of soil erosion. As the main obstacle factors of support system of Zhijiang are total amount of water resources, carbon sink, and vegetation cover index, Zhijiang needs to improve the coverage of forest and urban green space to enhance the capacity of carbon sink and water conservation. The main obstacle factors of support system of Yidu are total amount of water resources, total grain production, and carbon sink, so it is necessary for Yidu to promote afforestation and reinforce protection of agricultural land. The higher pressure index and lower adjustment index of Dangyang result in its higher RECC value. The main obstacle factors of pressure system of Dangyang are volume of industrial waste water discharged, volume of industrial waste gas discharged and volume of common industrial solid wastes generated. Accordingly, Dangyang should improve the level of industry greening and reduce the emission of industrial pollutants. In addition, it is crucial for Dangyang to promote scientific and technological innovation, accelerate the upgrading of sewage treatment facilities, improve sewage collection and treatment capacity, and create a complete industrial chain for the comprehensive utilization of common industrial solid wastes resulting from its main obstacle factors of adjustment system. The lower support and adjustment index lead to the higher RECC value of Xiaoting. The main obstacle factors of support system are total amount of water resources, total grain production, and carbon sink. As a result, it is imperative to enhance afforestation and greening initiatives to improve water retention capacity and carbon sequestration capabilities (He and Xie, 2019; Lu et al., 2022; Zhu et al., 2023). Meanwhile, Xiaoting needs to pay more attention to the development of ecological agriculture and agricultural land conservation (Li Z. et al., 2022; Long et al., 2022; Zhang et al., 2022; Xiong et al., 2023; Zhu et al., 2023). In regard to the adjustment, greater emphasis should be placed on the cultivation of innovative subjects, industry-academia-research collaboration, the improvement of environmental infrastructure, and the comprehensive utilization of common industrial solid wastes based on its main obstacle factors. With respect to those regions consistently in the Non-Alert Level, persistent efforts in many ways should be made to reduce the pressure on resources and environment in the process of development, enhance the protection of ecological and environmental elements, expand the increment of resources and environment support, resulting in high-quality development of economy and society.
This study introduced the novel concepts of pressure, support and adjustment, innovatively formed a theoretical RECC framework from the perspective of pressure, support, and adjustment, constructed a new evaluation index system of RECC, and proposed a quantitative method of RECC based on the ratio method and hierarchical forewarning method of RECC with the threshold of 1. Furthermore, a case demonstration in regard to Yichang city, with a prominent ecological and economic status as the location of China’s Three Gorges Project, was conducted. The main conclusions are as follows.
(1) The average pressure, support, and adjustment indices all showed overall upward trends, and the pressure and adjustment indices increased from west to east, while the support index was higher in the western area and lower in the central districts. This indicated that counties with higher levels of economic development withstood greater environmental resource pressure, while their adjustment was greater, indicating larger support increments.
(2) The major obstacle factors of different systems varied between counties. In the pressure system, the major obstacle factors of Yidu and Zhijiang were environmental and ecological pressure indices, while those of other counties were the environmental pressure index. In the support system, the major obstacle factors of central and eastern areas were resource and environmental support indices, those of Yiling were ecological and environmental support indices, and those of other counties were resource and ecological support indices. In the adjustment system, the major obstacle factors were concentrated in technology and environmental management adjustment indices.
(3) The RECC of Yichang city and its counties improved from 2016 to 2021, and the gap between RECC of various counties gradually shrank. The RECC of counties increased from west to east, and those of Xiaoting, Zhijiang, Yidu, and Dangyang in the eastern area were high owing to strong economic development activities and low environmental resource endowments.
(4) The RECC of Yichang city remained at the Non-Alert Level, with values all less than or equal to 0.5 from 2016 to 2021. In 2021, the RECC values of all counties were at the Non-Alert Level or Alert Level I, demonstrating that there was still room for economic and societal development in terms of resources and the environment. Moreover, the number of counties whose RECC values were at Alert Level II decreased from two to zero, while the number of counties whose RECC values were in the Non-Alert Level increased from eight to ten. The RECC values of Xiaoting and Zhijiang were at Alert Level II four and three times, respectively, indicating that attention should be paid to these counties.
The evaluation and forewarning of RECC is a complex and systematic process. This study may have overlooked several important indices due to the unavailability of county-level data. Moreover, the evaluation of RECC in this study is based on historical data, with no future projections. In particular, although this study analyzed the changes in RECC after the outbreak of the COVID-19 pandemic, it was not regarded as a factor to explore its impact on RECC. Therefore, the improvement of the evaluation index system, the application of multi-source data, the identification of influencing fators, and the prediction of RECC should receive more attention in future research.
The original contributions presented in the study are included in the article/Supplementary Material, further inquiries can be directed to the corresponding author.
YP: Conceptualization, Funding acquisition, Investigation, Methodology, Project administration, Resources, Writing–original draft. ZZ: Data curation, Formal Analysis, Investigation, Software, Visualization, Writing–review and editing. XT: Data curation, Formal Analysis, Software, Visualization, Writing–review and editing. XL: Data curation, Formal Analysis, Investigation, Writing–review and editing. JL: Data curation, Visualization, Writing–review and editing. LX: Formal Analysis, Validation, Writing–review and editing. FW: Conceptualization, Investigation, Methodology, Project administration, Writing–original draft, Writing–review and editing.
The author(s) declare financial support was received for the research, authorship, and/or publication of this article. This work is jointly supported by the Environmental Protection Scientific Research Project of Hubei Province (2023) and Knowledge Innovation Program of Wuhan-Basic Research (NO.2023020201020451).
The authors declare that the research was conducted in the absence of any commercial or financial relationships that could be construed as a potential conflict of interest.
All claims expressed in this article are solely those of the authors and do not necessarily represent those of their affiliated organizations, or those of the publisher, the editors and the reviewers. Any product that may be evaluated in this article, or claim that may be made by its manufacturer, is not guaranteed or endorsed by the publisher.
Chen, J., Huang, X., Jing, Y., Wen, Z., and Zang, C. (2023). Spatial and temporal variation and driving factors of ecological carrying capacity in the Pan-Pearl River Basin, China. Ecol. Indic. 151, 110318. doi:10.1016/j.ecolind.2023.110318
Cui, Z., Wang, Z. G., Zhang, X. R., Wang, Y. Y., and Zhang, M. (2022). Evaluation of regional environmental carrying capacity and its obstacle indicators diagnosis: evidence from three major urban agglomerations in China. Front. Environ. Sci. 10, 1015158. doi:10.3389/fenvs.2022.1015158
Elahi, E., Khalid, Z., and Zhang, Z. (2022). Understanding farmers’ intention and willingness to install renewable energy technology: a solution to reduce the environmental emissions of agriculture. Appl. Energy 309, 118459. doi:10.1016/j.apenergy.2021.118459
Fan, J., Wang, Y., Ouyang, Z., Li, L., Xu, Y., Zhang, W., et al. (2017). Risk forewarning of regional development sustainability based on a natural resources and environmental carrying index in China. Earth’s Future 5 (2), 196–213. doi:10.1002/2016EF000490
Fan, W., Song, X., Liu, M., Shan, B., Ma, M., and Liu, Y. (2023). Spatio-temporal evolution of resources and environmental carrying capacity and its influencing factors: a case study of Shandong Peninsula urban agglomeration. Environ. Res. 234, 116469. doi:10.1016/j.envres.2023.116469
Firozjaei, M. K., Fathololomi, S., Kiavarz, M., Arsanjani, J. J., Homaee, M., and Alavipanah, S. K. (2021). Modeling the impact of the COVID-19 lockdowns on urban surface ecological status: a case study of Milan and Wuhan cities. J. Environ. Manag. 286, 112236. doi:10.1016/j.jenvman.2021.112236
Fu, J., Zang, C., and Zhang, J. (2020). Economic and resource and environmental carrying capacity trade-off analysis in the Haihe River basin in China. J. Clean. Prod. 270, 122271. doi:10.1016/j.jclepro.2020.122271
Gao, C., Gao, C., Song, K., and Fang, K. (2020). Pathways towards regional circular economy evaluated using material flow analysis and system dynamics. Resour. Conservation Recycl. 154, 104527. doi:10.1016/j.resconrec.2019.104527
Guo, M., Bu, Y., Cheng, J., and Jiang, Z. (2018). Natural gas security in China: a simulation of evolutionary trajectory and obstacle degree analysis. Sustainability 11 (1), 96. doi:10.3390/su11010096
He, Y., and Xie, H. (2019). Exploring the spatiotemporal changes of ecological carrying capacity for regional sustainable development based on GIS: a case study of Nanchang City. Technol. Forecast. Soc. Change 148, 119720. doi:10.1016/j.techfore.2019.119720
Hu, A., and Li, Q. (2022). A pressure-state-response-support framework for assessing regional water environmental carrying status. Front. Environ. Sci. 10, 1023180. doi:10.3389/fenvs.2022.1023180
Huang, A., Tian, L., Li, Q., Li, Y., Yu, J., Gao, Y., et al. (2023). Land-use planning serves as a critical tool for improving resources and environmental carrying capacity: a review of evaluation methods and application. Int. J. Environ. Res. Public Health 20 (3), 2370. doi:10.3390/ijerph20032370
Huang, Q. S., Zhao, Y., Xu, X. Y., Wang, G. Q., Wang, H. R., and Gu, Q. W. (2018). Evaluation of resources and environmental carrying capacity based on spring model——taking Chen Barag Banner in Inner Mongolia as an example. J. Nat. Resour. 33 (1), 173–184. doi:10.11849/zrzyxb.20161250
Jia, Z., Cai, Y., Chen, Y., and Zeng, W. (2018). Regionalization of water environmental carrying capacity for supporting the sustainable water resources management and development in China. Resour. Conservation Recycl. 134, 282–293. doi:10.1016/j.resconrec.2018.03.030
Ke, X., and Hsiao, C. (2022). Economic impact of the most drastic lockdown during COVID-19 pandemic—the experience of Hubei, China. J. Appl. Econ. 37 (1), 187–209. doi:10.1002/jae.2871
Lein, J. K. (1993). Applying expert systems technology to carrying capacity assessment: a demonstration prototype. J. Environ. Manag. 37 (1), 63–84. doi:10.1006/jema.1993.1005
Li, C., Li, H., Feng, S., Liu, X., and Guo, S. (2019). A study on the spatiotemporal characteristics and change trend of the atmospheric environmental carrying capacity in the Jing-Jin-Ji region, China. J. Clean. Prod. 211, 27–35. doi:10.1016/j.jclepro.2018.11.045
Li, Q., Wu, J., Su, Y., Zhang, C., Wu, X., Wen, X., et al. (2022b). Estimating ecological sustainability in the Guangdong-Hong Kong-Macao Greater Bay Area, China: retrospective analysis and prospective trajectories. J. Environ. Manag. 303, 114167. doi:10.1016/j.jenvman.2021.114167
Li, Z., Chen, Y., Zhang, L., Wang, W., and Wu, J. (2022a). Coupling coordination and spatial-temporal characteristics of resource and environmental carrying capacity and high-quality development. Front. Environ. Sci. 10, 971508. doi:10.3389/fenvs.2022.971508
Liao, S., Wu, Y., Wong, S. W., and Shen, L. (2020). Provincial perspective analysis on the coordination between urbanization growth and resource environment carrying capacity (RECC) in China. Sci. Total Environ. 730, 138964. doi:10.1016/j.scitotenv.2020.138964
Liu, R., Pu, L., and Huang, S. (2023). Simulation of coastal resource and environmental carrying capacity in the Yangtze River delta coastal zone based on shared socioeconomic pathways. Front. Mar. Sci. 10, 1008231. doi:10.3389/fmars.2023.1008231
Liu, R. Z., and Borthwick, A. G. (2011). Measurement and assessment of carrying capacity of the environment in Ningbo, China. J. Environ. Manag. 92 (8), 2047–2053. doi:10.1016/j.jenvman.2011.03.033
Liu, Z., Ren, Y., Shen, L., Liao, X., Wei, X., and Wang, J. (2020). Analysis on the effectiveness of indicators for evaluating urban carrying capacity: a popularity-suitability perspective. J. Clean. Prod. 246, 119019. doi:10.1016/j.jclepro.2019.119019
Long, X., Wu, S., Wang, J., Wu, P., and Wang, Z. (2022). Urban water environment carrying capacity based on VPOSR-coefficient of variation-grey correlation model: a case of Beijing, China. Ecol. Indic. 138, 108863. doi:10.1016/j.ecolind.2022.108863
Lu, L., Lei, Y., Wu, T., and Chen, K. (2022). Evaluating water resources carrying capacity: the empirical analysis of Hubei Province, China 2008-2020. Ecol. Indic. 144, 109454. doi:10.1016/j.ecolind.2022.109454
Luo, W., Ren, Y., Shen, L., Zhu, M., Jiang, Y., Meng, C., et al. (2020). An evolution perspective on the urban land carrying capacity in the urbanization era of China. Sci. Total Environ. 744, 140827. doi:10.1016/j.scitotenv.2020.140827
Ma, X., Wang, Y., and Wang, C. (2017). Low-carbon development of China’s thermal power industry based on an international comparison: review, analysis and forecast. Renew. Sustain. Energy Rev. 80, 942–970. doi:10.1016/j.rser.2017.05.102
Martire, S., Castellani, V., and Sala, S. (2015). Carrying capacity assessment of forest resources: enhancing environmental sustainability in energy production at local scale. Resour. Conservation Recycl. 94, 11–20. doi:10.1016/j.resconrec.2014.11.002
Meadows, D., Randers, J., and Meadows, D. (1972). Limits to growth. New York: The New American Library.
Morshed, S. R., Esraz-Ul-Zannat, M., Fattah, M. A., and Saroar, M. (2024). Assessment of the future environmental carrying capacity using machine learning algorithms. Ecol. Indic. 158, 111444. doi:10.1016/j.ecolind.2023.111444
Peng, J., Du, Y., Liu, Y., and Hu, X. (2016). How to assess urban development potential in mountain areas? An approach of ecological carrying capacity in the view of coupled human and natural systems. Ecol. Indic. 60, 1017–1030. doi:10.1016/j.ecolind.2015.09.008
Qin, J., Niu, J., and Niu, W. (2023). Research on water resource carrying capacity of capital water conservation functional zone. Front. Environ. Sci. 10, 1108631. doi:10.3389/fenvs.2022.1108631
Ren, Y., Shen, L., Wei, X., Wang, J., and Cheng, G. (2021). A guiding index framework for examining urban carrying capacity. Ecol. Indic. 133, 108347. doi:10.1016/j.ecolind.2021.108347
Seidl, I., and Tisdell, C. A. (1999). Carrying capacity reconsidered: from Malthus’ population theory to cultural carrying capacity. Ecol. Econ. 31 (3), 395–408. doi:10.1016/s0921-8009(99)00063-4
Shan, S. Y., Xu, H. J., Qi, X. L., Chen, T., and Wang, X. D. (2023). Evaluation and prediction of ecological carrying capacity in the qilian mountain national park, China. J. Environ. Manag. 339, 117856. doi:10.1016/j.jenvman.2023.117856
Shen, L., Shu, T., Liao, X., Yang, N., Ren, Y., Zhu, M., et al. (2020). A new method to evaluate urban resources environment carrying capacity from the load-and-carrier perspective. Resour. Conservation Recycl. 154, 104616. doi:10.1016/j.resconrec.2019.104616
Su, Y., and Yu, Y. Q. (2020). Dynamic early warning of regional atmospheric environmental carrying capacity. Sci. Total Environ. 714, 136684. doi:10.1016/j.scitotenv.2020.136684
Sun, M., Wang, J., and He, K. (2020). Analysis on the urban land resources carrying capacity during urbanization——a case study of Chinese YRD. Appl. Geogr. 116, 102170. doi:10.1016/j.apgeog.2020.102170
Świąder, M., Szewrański, S., and Kazak, J. K. (2020). Environmental carrying capacity assessment—the policy instrument and tool for sustainable spatial management. Front. Environ. Sci. 8, 579838. doi:10.3389/fenvs.2020.579838
Tan, F., Wang, F., and Niu, Z. (2023). Multiscale disparity and spatial pattern of comprehensive carrying capacity in the Yangtze River Economic Belt, China. Ecol. Indic. 148, 110119. doi:10.1016/j.ecolind.2023.110119
Tan, S., Liu, Q., and Han, S. (2022). Spatial-temporal evolution of coupling relationship between land development intensity and resources environment carrying capacity in China. J. Environ. Manag. 301, 113778. doi:10.1016/j.jenvman.2021.113778
Tian, Y., and Sun, C. (2018). A spatial differentiation study on comprehensive carrying capacity of the urban agglomeration in the Yangtze River Economic Belt. Regional Sci. Urban Econ. 68, 11–22. doi:10.1016/j.regsciurbeco.2017.10.014
Wang, H., Xu, Y., Suryati Sulong, R., Ma, H., and Wu, L. (2021). Comprehensive evaluation of water carrying capacity in Hebei Province, China on principal component analysis. Front. Environ. Sci. 9, 761058. doi:10.3389/fenvs.2021.761058
Wang, T., and Xu, S. (2015). Dynamic successive assessment method of water environment carrying capacity and its application. Ecol. Indic. 52, 134–146. doi:10.1016/j.ecolind.2014.12.002
Wang, X., Zhang, S., Tang, X., and Gao, C. (2022). Research on water resources environmental carrying capacity (WRECC) based on support-pressure coupling theory: a case study of the Guangdong-Hong Kong-Macao Greater Bay Area. J. Environ. Manag. 320, 115805. doi:10.1016/j.jenvman.2022.115805
Wang, Y., Duan, F., Ma, X., and He, L. (2019b). Carbon emissions efficiency in China: key facts from regional and industrial sector. J. Clean. Prod. 206, 850–869. doi:10.1016/j.jclepro.2018.09.185
Wang, Y., Wang, Y., Su, X., Qi, L., and Liu, M. (2019a). Evaluation of the comprehensive carrying capacity of interprovincial water resources in China and the spatial effect. J. Hydrology 575, 794–809. doi:10.1016/j.jhydrol.2019.05.076
Wang, Z., and Fu, X. (2023). Scheme simulation and predictive analysis of water environment carrying capacity in Shanxi Province based on system dynamics and DPSIR model. Ecol. Indic. 154, 110862. doi:10.1016/j.ecolind.2023.110862
Wei, X., Wang, J., Wu, S., Xin, X., Wang, Z., and Liu, W. (2019). Comprehensive evaluation model for water environment carrying capacity based on VPOSRM framework: a case study in Wuhan, China. Sustain. Cities Soc. 50, 101640. doi:10.1016/j.scs.2019.101640
Wu, X., and Hu, F. (2020). Analysis of ecological carrying capacity using a fuzzy comprehensive evaluation method. Ecol. Indic. 113, 106243. doi:10.1016/j.ecolind.2020.106243
Wu, Y., Shi, K., Chen, Z., Liu, S., and Chang, Z. (2021). Developing improved time-series DMSP-OLS-like data (1992-2019) in China by integrating DMSP-OLS and SNPP-VIIRS. IEEE Trans. Geoscience Remote Sens. 60, 1–14. doi:10.1109/TGRS.2021.3135333
Xiong, J., Wang, X., Zhao, D., and Wang, J. (2023). Spatiotemporal evolution for early warning of ecological carrying capacity during the urbanization process in the Dongting Lake area, China. Ecol. Inf. 75, 102071. doi:10.1016/j.ecoinf.2023.102071
Yang, J., and Huang, X. (2021). The 30 m annual land cover dataset and its dynamics in China from 1990 to 2019. Earth Syst. Sci. Data 13 (8), 3907–3925. doi:10.5194/essd-13-3907-2021
Zhang, F., Wang, Y., Ma, X., Wang, Y., Yang, G., and Zhu, L. (2019). Evaluation of resources and environmental carrying capacity of 36 large cities in China based on a support-pressure coupling mechanism. Sci. total Environ. 688, 838–854. doi:10.1016/j.scitotenv.2019.06.247
Zhang, L., Nie, Q., Chen, B., Chai, J., and Zhao, Z. (2020). Multi-scale evaluation and multi-scenario simulation analysis of regional energy carrying capacity—case study: China. Sci. Total Environ. 734, 139440. doi:10.1016/j.scitotenv.2020.139440
Zhang, M., Liu, Y., Wu, J., and Wang, T. (2018). Index system of urban resource and environment carrying capacity based on ecological civilization. Environ. Impact Assess. Rev. 68, 90–97. doi:10.1016/j.eiar.2017.11.002
Zhang, Z., Hu, B., and Qiu, H. (2022). Comprehensive evaluation of resource and environmental carrying capacity based on SDGs perspective and Three-dimensional Balance Model. Ecol. Indic. 138, 108788. doi:10.1016/j.ecolind.2022.108788
Zhou, Y., Liu, Z., Zhang, B., and Yang, Q. (2022). Evaluating water resources carrying capacity of Pearl River Delta by entropy weight-TOPSIS model. Front. Environ. Sci. 10, 967775. doi:10.3389/fenvs.2022.967775
Zhu, M., Shen, L., Tam, V. W., Liu, Z., Shu, T., and Luo, W. (2020). A load-carrier perspective examination on the change of ecological environment carrying capacity during urbanization process in China. Sci. Total Environ. 714, 136843. doi:10.1016/j.scitotenv.2020.136843
Keywords: resource and environmental carrying capacity, pressure, support, adjustment, forewarning
Citation: Peng Y, Zhu Z, Tan X, Liu X, Liao J, Xiang L and Wu F (2024) Evaluation and forewarning of the resource and environmental carrying capacity from the perspective of pressure-support-adjustment: a case study of Yichang city, China. Front. Environ. Sci. 12:1378103. doi: 10.3389/fenvs.2024.1378103
Received: 22 February 2024; Accepted: 14 June 2024;
Published: 02 July 2024.
Edited by:
Naser Valizadeh, Shiraz University, IranReviewed by:
Liang Yuan, China Three Gorges University, ChinaCopyright © 2024 Peng, Zhu, Tan, Liu, Liao, Xiang and Wu. This is an open-access article distributed under the terms of the Creative Commons Attribution License (CC BY). The use, distribution or reproduction in other forums is permitted, provided the original author(s) and the copyright owner(s) are credited and that the original publication in this journal is cited, in accordance with accepted academic practice. No use, distribution or reproduction is permitted which does not comply with these terms.
*Correspondence: Feng Wu, ZmVuZ3d1QHdodS5lZHUuY24=
Disclaimer: All claims expressed in this article are solely those of the authors and do not necessarily represent those of their affiliated organizations, or those of the publisher, the editors and the reviewers. Any product that may be evaluated in this article or claim that may be made by its manufacturer is not guaranteed or endorsed by the publisher.
Research integrity at Frontiers
Learn more about the work of our research integrity team to safeguard the quality of each article we publish.