 Bohua Zheng
 Kui Chen3
- 1Weather Modification Office of Xinjiang Uygur Autonomous Region, Urumqi, China
- 2Xinjiang Weather Modification Engineering Technology Research Centre, Urumqi, Xinjiang, China
- 3Emergency Management College, Nanjing University of Information Science and Technology, Nanjing, China
A statistical analysis is conducted on the hourly precipitation at 105 national meteorological stations in the Xinjiang region of China from 2011 to 2020. The purpose of this analysis is to determine the total quantity of precipitation during the warm and cold seasons, as well as the precipitation frequency at each station. The results of the analysis indicate that there is a more pronounced inter-annual variation in precipitation during the warm and cold seasons in Xinjiang, where the total amount of precipitation during the warm season is significantly higher than that during the cold season, with the warm season experiencing at least twice as much precipitation. In terms of the inter-annual incremental amount of precipitation, both the warm and cold seasons exhibit a trend of increasing and then decreasing over the years. However, the curvature change is more prominent in the cold season compared to the warm season, suggesting that the inter-annual variation in precipitation during the warm season remains relatively stable. The spatial distribution characteristics of the total precipitation in Xinjiang indicate that warm-season precipitation is more scattered, while cold-season precipitation is mainly concentrated in the northern region of the territory. This pattern holds true at low, medium, medium–high, and high altitudes. The cumulative precipitation during the warm season is always higher than that in the cold season, and this difference becomes more prominent with increasing altitude. This indicates that warm-season precipitation in Xinjiang is closely related to its complex topographic structure, particularly the convective weather generated by topographic clouds. On the other hand, precipitation in the cold season is mainly concentrated in the low- and medium-altitude stations, and there is not much correlation between precipitation and altitude. Precipitation is mainly affected by the mesoscale and the direct influence of large-scale weather systems. Analysis of precipitation in extreme moments reveals that during the warm season, extreme precipitation events occur mainly from the evening to early morning (19:00–03:00 the next day), accounting for 75.24% of the 105 stations. In contrast, during the cold season, extreme precipitation events occur between 03:00 and 18:00, corresponding to 74.29% of the stations. The relationship between precipitation and altitude differs in the warm and cold seasons. In the warm season, there is a linear relationship between precipitation and altitude, with a slope of 0.72 and a correlation coefficient of 0.52, indicating that precipitation increases with increasing altitude. However, in the cold season, the linear relationship between precipitation and altitude is very inconspicuous, with a slope of −0.05 and a correlation coefficient of −0.05, suggesting that there is no significant relationship between precipitation and altitude during this season. These findings provide valuable insights into the changing patterns of precipitation gradients at different altitudes and seasons in Xinjiang. This information can be used for the site selection of smokestack operations in high-altitude areas and for ground and air weather modification operations in low-altitude areas. Additionally, these data contribute to the understanding of precipitation patterns in Xinjiang, further improving the effectiveness of weather modification efforts and increasing the utilization of airborne water resources.
1 Introduction
Changes in weather events, including extreme temperatures and rainfall, result from excessive emissions from the agricultural, livestock, and industrial sectors (Peng et al., 2019; Abbas et al., 2021; Ehsan et al., 2022; Abbas et al., 2023a; Elahi et al., 2023). In particular, precipitation is an important component of the global hydrological cycle. The United Nations Intergovernmental Panel on Climate Change (IPCC) in the Sixth Assessment Synthesis Report (IPCC, 2023) clearly pointed out that due to human activities and high-speed industrial development in recent years leading to a yearly increase in the concentration of greenhouse gases, the average global surface temperature increased by approximately 1.09°C in just 10 years (2011–2020), global warming will certainly accelerate the hydrological cycle, extreme precipitation events are bound to become more frequent (Adnan et al., 2022; Awais Naeem et al., 2022; Muhammad et al., 2022; Wijeratne Vithana et al., 2022; Abbas et al., 2023b; Waheed et al., 2023), and the average precipitation will increase slightly. With global warming, precipitation events are often prone to intensifying in some regions. This study investigates the long-term trend of annual and daily extreme precipitation in China during 1960–2010 based on daily observations from 539 meteorological stations and data from a land cover map with impervious information (Li et al., 2019). Alaska observes very large differences in precipitation throughout the state; Southeast Alaska experiences consistently wet conditions, while northern Arctic Alaska observes very dry conditions (Wendler et al., 2017). Using daily precipitation records from 151 stations, the Mann–Kendall nonparametric test, and the rotated empirical orthogonal function, this study examined trends in precipitation and precipitation extremes and underlying mechanisms in the U.S. Great Basin during 1951–2013 (Xue et al., 2017). A record-breaking heavy-rainfall event that occurred in Zhengzhou, Henan Province, during 19–21 July 2021 is simulated using the Weather Research and Forecasting Model, and the large-scale precipitation efficiency (LSPE) and cloud microphysical precipitation efficiency (CMPE) of the rainfall event are analyzed based on the model results (Lei et al., 2023). Analysis of precipitation trends and the observed trends in precipitation concentration can be useful tools for the identification of natural hazards. This study aimed to analyze the trends in precipitation and precipitation concentration at the seasonal and annual levels in Mexico from 1960 to 2010 (Nunez-Gonzalez Gerardo, 2020). Based on the hourly precipitation data from four observation stations in Xining city from June to September during 2005–2011, the temporal and spatial distribution characteristics of short-time precipitation are analyzed (Liang and Yongling, 2023). The impacts of climate change are being felt in Louisiana in the form of changing weather patterns that have resulted in changes in frequencies of occurrence and magnitude of floods, hurricanes, and tornadoes, among others, resulting in flooding (Yaw et al., 2022). This study investigates the possible causes for the precipitation of Guangdong during the dragon-boat rain period (DBRP) in 2022, which is remarkably more than the climate state, and reviews the successes and failures of the prediction in 2022 (Dong et al., 2023).
Blizzards are one of the most important weather disasters during winter in northern China, which have a serious impact on transportation, power communication, agriculture and animal husbandry, and urban development, restricting its efficient development. Northern Xinjiang is a frequent snowfall area in China, situated in the Yili River Valley, Tacheng, Altay, and the northern slopes of the Tian Shan Mountains along the main economic zone (Wang et al., 2020). The blizzard weather on three dates, namely, 8 December 2014, 11 December 2015, and 23 January 2021, showed that the amount of daily snowfall in Urumqi exceeded the historical extremes since 1990; the characteristics of these snowfalls, including quantity, intensity, thickness, and duration, have not only had a huge impact on individuals’ lives but have also restricted the efficient and sustainable development of the northern economic zone in Xinjiang. Therefore, they have become one of the most concerning weather and climate events for the government and public every winter, and they are also the subject of focus and difficulty for the meteorological department’s forecasting efforts. Urumqi, as the capital city of Xinjiang, is a pivotal transportation hub on the Silk Road, the absolute core of commerce, trade, and logistics; a center of culture, science, and education; and an important gateway for opening to the outside world in western China. With the triumph of the 20th National Congress of the Communist Party of China (CPC), economic and social development has stepped up to a new level, and China’s meteorological industry has gradually pushed forward high-quality development, which has put forward a higher demand for precise monitoring, accurate forecasting, and fine service; however, due to the limitations of the instrumentation of solid precipitation observation in winter, relevant research on the characteristics of the change of the hourly snowfall in winter is still relatively little, which is not enough for the scientific and technological support of the snowfall prediction service and the numerical model evaluation and test.
The southern Tianshan region of Xinjiang is located in the Eurasian hinterland, centered on the Tarim Basin, surrounded by mountains on three sides (the Kunlun Mountains in the foothills, the Pamir Plateau in the west, and the Tien Shan Mountains in the north), with complex topography and geomorphology. The region is uniquely influenced by the special atmospheric circulation and water vapor conditions, and precipitation in the southern region has its uniqueness. Although the inter-annual precipitation amount is less than 60.0 mm, the variability of precipitation is high, and short-term heavy precipitation occurs from time to time (Yang and Liu, 2018). During 24–28 June 2019, in Bazhou, Hotan, and other places, more than 50 observation stations reported heavy rainfall. The Hotan national observation station’s daily precipitation broke through the historical extreme. During 14–15 January 2020, Turpan city in Shanshan County ushered in the New Year’s first snowfall, and the snowfall amount reached 10.5 mm, which is the largest snowfall value for the county in more than 40 years. The county of Kumtag Desert was covered with a layer of white snow, and the desert turned into a “sea of snow,” exceptionally crystalline and magnificent. During 13–14 May 2021, Tazhong station in the southern region of Xinjiang reported a 12-h precipitation amount of 34.0 mm, the first in history, while breaking the spring and monthly maximum daily precipitation extremes. As the Tianshan region in southern Xinjiang is in the Eurasian hinterland, coupled with fragile ecosystems and vegetation area elimination, once a natural calamity occurs, it is often easy to trigger landslides, urban flooding, snowmelt flash floods, and other disasters, which cause irreversible and serious impacts on the safety of human lives and properties and socio-economic development (Wang and Xu, 2021; Lü et al., 2021).
Many scholars in China have carried out a lot of research on the formation mechanism of snowstorms. A blizzard is the result of a multi-scale system configuration and kinetic–thermal and water vapor conditions (Huang and Hairong, 2007; Zhao et al., 2010; Chen and Cui, 2012; Zhang et al., 2013; Zhao et al., 2013; Liu et al., 2018). For snowstorms in Northeast China, studies have shown that the direct cause of snowstorms is the low vortex, with the southeast rapids or low-level easterly providing water vapor transport (Liu et al., 2013; Xu et al., 2015; Yang et al., 2018). Snowstorms in North China are established to maintain convective unstable laminar knots, form convergences, and produce uplift in the presence of sufficient water vapor provided by the southwest rapids (Huang and Hairong, 2007; Zhao et al., 2010; Chen and Cui, 2012; Zhang et al., 2013; Zhao et al., 2013; Liu et al., 2018; Yang and Liu, 2018; Wang et al., 2020; Wang and Xu, 2021; Lü et al., 2021; Yaw et al., 2022; Dong et al., 2023). The systems affecting snowstorms in northern Xinjiang are the Central Asian long-wave trough, Central Asian low eddies, Ural long-wave trough, and Western Siberian trough (Yang et al., 2020). In recent years, climate change in southern Xinjiang and the short-term heavy precipitation in summer have directly affected the “Belt and Road” construction pattern. Heavy-rainfall research is not only a major scientific issue in climate change but also an urgent need for a national strategy that is more related to national security and socio-economic stability and development. Since the 1990s, the arid zone on the northwestern side of the Qinghai–Tibetan Plateau has been changed to a warm and humid type, especially in Xinjiang, and the increase in the number of heavy-rainfall events caused by the disaster accounted for approximately 40% of the meteorological disasters in Xinjiang (Yafeng et al., 2002; Yang et al., 2011).
In the last decade, the rapid development of meteorological observation equipment, meteorological grid big data, and high spatial and temporal resolution applications has sprung up, enabling researchers to better understand and analyze the detailed characteristics of precipitation and extreme precipitation in different regions. However, at present, weather and climate models still face limitations in forecasting short-term heavy precipitation. So, with the help of high temporal and spatial precipitation resolution, we can not only improve the numerical model test and evaluation but also conduct in-depth investigations into the characteristics of extreme precipitation changes in the north and south of Xinjiang and their impact on the mechanism. Through the universal law, we can provide better service to forecasting products, reduce secondary disasters due to short-term precipitation, and maximize the protection of people’s lives and safety. Second, combining the spatial and temporal patterns of change in precipitation and its path is more conducive to the development of weather modification rain (snow) operations, such as aircraft and groundwater work operations. By exploring different seasonal patterns of change in the precipitation gradient, particularly in the three major mountain systems in Xinjiang (Altai Mountains, Tian Shan Mountains, and Kunlun Mountains), we can better understand the distribution characteristics of precipitation gradients. The reasonable play of the deployment of man-made shadow operation equipment (mountainous areas of the smokestacks) can be more efficient to enhance the conversion rate of airborne cloud water resources, improve the modernization of the level of operation of artificial weather impact for disaster prevention, mitigation, and restoration of ecological environmental protection, and provide a strong guarantee.
2 Data and methods
2.1 Data source
The hour-by-hour precipitation data used in the article are obtained after strict quality control by the National Information Center. The scope of the data includes hourly precipitation data from 105 national surface meteorological observation stations in Xinjiang, spanning the entire decade from 2011 to 2020. Among these stations, 57 are located in the Tian Shan Mountain and its northern region (northern Xinjiang), while the remaining 48 stations are located in the southern part of the Tianshan Mountain (southern Xinjiang) (Figure 1). The 105 national ground meteorological stations in Xinjiang are selected reasonably. First, only national ground meteorological stations that are currently installing and operating solid-state precipitation automatic observation instruments are included; second, the data from this equipment have only begun to enter the operational data system on a large scale since 2011, so the hour-by-hour precipitation data from the national meteorological ground stations in Xinjiang for the period of 2011–2020 are selected for the statistical analysis and study. All the hour-by-hour data are screened to exclude any observed anomalous values and missing observations.
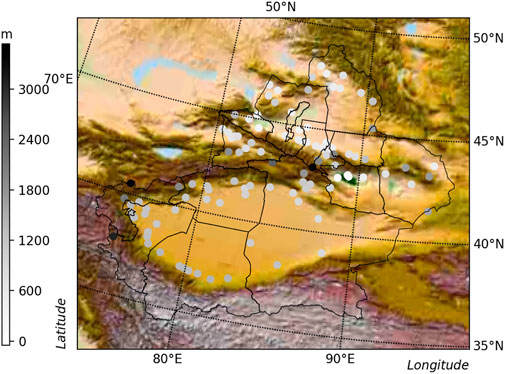
Figure 1. Spatial distribution of the 105 meteorological stations in Xinjiang.
2.2 Research methods
First, the warm season is defined as May–September each year, and the cold season is defined as October of each year to April of the following year; the daily precipitation R is considered the cumulative total of precipitation ≥0.1 mm from 20:00 of the previous day to 20:00 of the current day; the hourly precipitation refers to the cumulative total of precipitation from a certain point to the next point in 1 h. If the hourly precipitation is ≥0.1 mm, it will be recorded as one hourly precipitation frequency, and the precipitation intensity is the ratio of hourly precipitation to the corresponding hourly precipitation frequency; continuous precipitation events with hourly precipitation ≥10.0 mm are defined as short-term heavy precipitation events; continuous precipitation events with hourly precipitation are defined as short-term strong precipitation events. The precipitation intensity is the ratio of the hourly precipitation amount to the corresponding hourly precipitation frequency; a continuous precipitation event with an hourly precipitation amount of ≥10.0 mm is defined as a short-duration heavy-precipitation event. The 105 national meteorological ground observatories throughout the territory are categorized according to the altitude of each station in order of 26 at low altitude (below 600 m), 24 at medium altitude (600–1,000 m), 28 at medium–high altitude (1,000–1,300 m), and 27 at high altitude (above 1,300 m).
The hourly precipitation of 105 national meteorological stations in Xinjiang, China, from 2011 to 2020 is statistically calculated to find out the total amount of cold and warm seasonal precipitation and the frequency of precipitation for all the stations that meet the required hourly requirements. The average number of months in different seasons is calculated for each station, the ratio of which is to get the PA and PF of each station, and then PI = PA/PF is obtained; as for the daily change in PA and PF, the precipitation and precipitation hours of each station are also counted, and the maximum PA and PF of each station are counted according to the corresponding moments of the PA and PF of each station. For the daily changes in PA and PF, the precipitation amount and hours of precipitation at each station are counted first, and according to the moments corresponding to the PA and PF at each station, the extreme moments corresponding to the maximum PA and PF at each station are counted. The trend of precipitation paths in cold and warm seasons in northern and southern Xinjiang is plotted in combination with the moments of the strongest precipitation in the daily changes. Second, 105 national stations throughout the territory are divided into four echelons according to altitude, and PA and PF corresponding extreme values and extreme moments are fitted to different station altitudes to analyze whether seasonal differences exist, analyze the changing principle of the precipitation gradient in different seasons at different altitudes, match the line similarity and classify them, and discuss whether their correlations are consistent with the changes in the precipitation gradient.
3 Results and analysis
3.1 Basic characteristics of precipitation in warm and cold seasons in Xinjiang
In order to better understand the characteristics of precipitation distribution and its gradient change in Xinjiang, we first understand the inter-annual variation characteristics of total precipitation in the last 10 years. Figures 2A, B show that the annual variation of precipitation in warm and cold seasons in Xinjiang is obvious. The total precipitation in the warm season is significantly higher than that in the cold season, and the precipitation in the warm season is at least twice that in the cold season. The maximum value (310.7 mm) in the warm season appeared in 2016, and the minimum value was 170.7 mm in 2014. The cold season maximum also occurred in 2016, but the minimum was only 57.6 mm in 2014. From the perspective of the annual change rate of the total precipitation in the warm and cold seasons, the change rate of total precipitation in the warm season reached extreme values (57.60% and −33.76%) in 2014 and 2015. The maximum value of the change rate of the total precipitation in the cold season appeared in 2012, the peak value reached 63.49%, and the minimum value was −22.81% in 2020. According to the change rate of the total precipitation in the cold season, there is no obvious correlation between the annual change rates of the warm and cold seasons, so it is concluded that there are some differences in the precipitation in the warm and cold seasons, which should be discussed separately. According to the curve fitting calculation of the inter-annual water increase in the warm and cold seasons in Xinjiang in the past 10 years by using the Polyfit function, it is found that the overall trend of the warm and cold seasons increased first and then decreased, and the peak value appeared in 2015 or 2016, but the curvature change is significantly higher in the cold season than in the warm season, indicating that the inter-annual change trend of precipitation in the warm season is relatively stable.
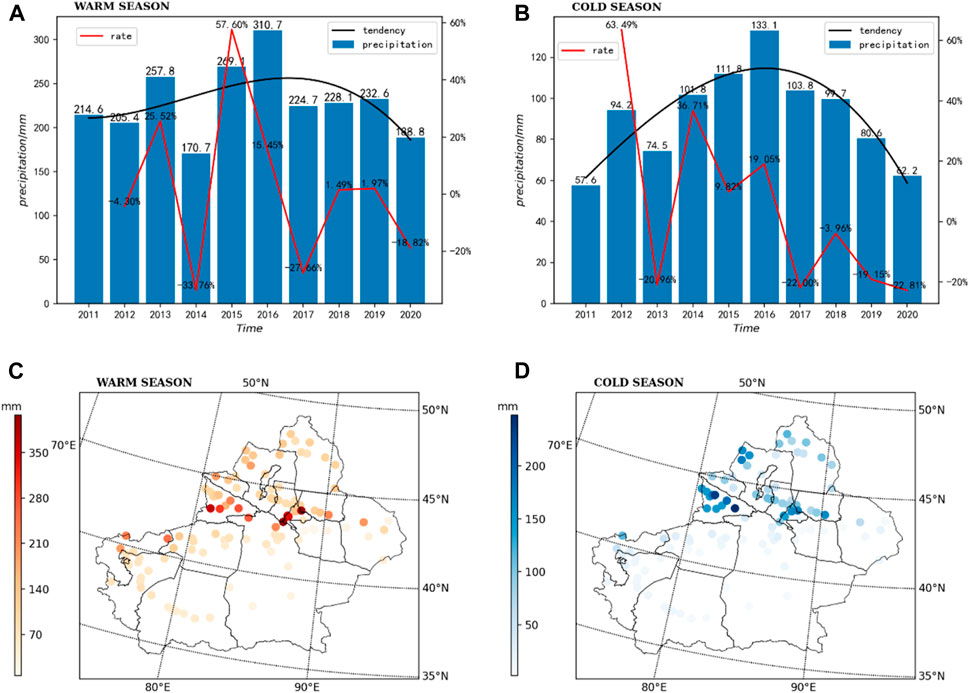
Figure 2. Inter-annual variation and distribution of the total precipitation in Xinjiang.
The spatial distribution of total precipitation in the whole Xinjiang region (Figures 2C, D) shows that the distribution of the warm season is relatively decentralized and that of the cold season is mostly concentrated in the northern Xinjiang region. The top three precipitation totals in the warm season are found in Urumqi Tianshan Daxigou, Changji Tianchi, and Urumqi Xiaoquzi meteorological stations, with the cumulative precipitation exceeding 370.0 mm, and the top three accounted for 10.22% of the total; the maximum value of the total precipitation in the cold season is found in Yili Xinyuan, with 248.0 mm, and the second to fourth peaks (in Yining County, Nilgor, and Yining) are all in the Yili area, with the top three accounting for 10.27% of the total precipitation. The proportion of the first three peaks is 10.27%. Combined with the above spatial distribution of precipitation, for the different characteristics of the warm and cold seasons, weather modification water augmentation work in the above areas can be appropriately increased, such as ground-launched rocket and high-altitude artillery operations in the warm season and aerial aircraft operations in the cold season, which not only improves the conversion rate of water resources from aerial clouds but also enhances the comprehensive capability of fine-tuning the scientific and technological modernization of weather modification operations.
The 105 national meteorological ground observation stations in the whole territory are categorized according to their altitude: 26 low-altitude stations (below 600 m), 24 medium-altitude stations (600–1,000 m), 28 medium–high-altitude stations (1,000–1,300 m), and 27 high-altitude stations (above 1,300 m). From Figures 3A–D, it is easy to conclude that the cumulative precipitation in the warm season is always higher than that in the cold season from 2011 to 2020, irrespective of whether it is at low, middle, middle–high, or high altitudes, and the proportion of precipitation in the warm season is especially obvious with the increase in altitude. The percentages of warm-season precipitation for the four categories of different elevation stations are 61.13%, 58.50%, 78.57%, and 81.81%, respectively, which further indicates that the warm-season precipitation is closely related to the complex topographic structure of Xinjiang, especially the strong convective weather generated by topographic clouds, which is directly generated in small-to-medium-scaled systems and has the characteristics of strong localization, suddenness, and rainfall. The average annual precipitation in the cold season at the four different altitude stations is 103.3 mm (38.87%), 137.5 mm (41.50%), 49.6 mm (21.43%), and 74.6 mm (18.19%), and the precipitation in the cold season is mainly concentrated in the low- and middle-altitude stations, which is mainly influenced by the mesoscale and large-scale weather systems. On the other hand, although the proportion of cold-season precipitation at the high-altitude stations is very small, only half of that at the low-altitude stations, the precipitation value is much higher than half of that at the low-altitude stations, which indicates that the cold-season precipitation is not directly affected by the elevation rise and fall, and the precipitation and its proportion further illustrate the difference between the warm- and cold-season precipitation.
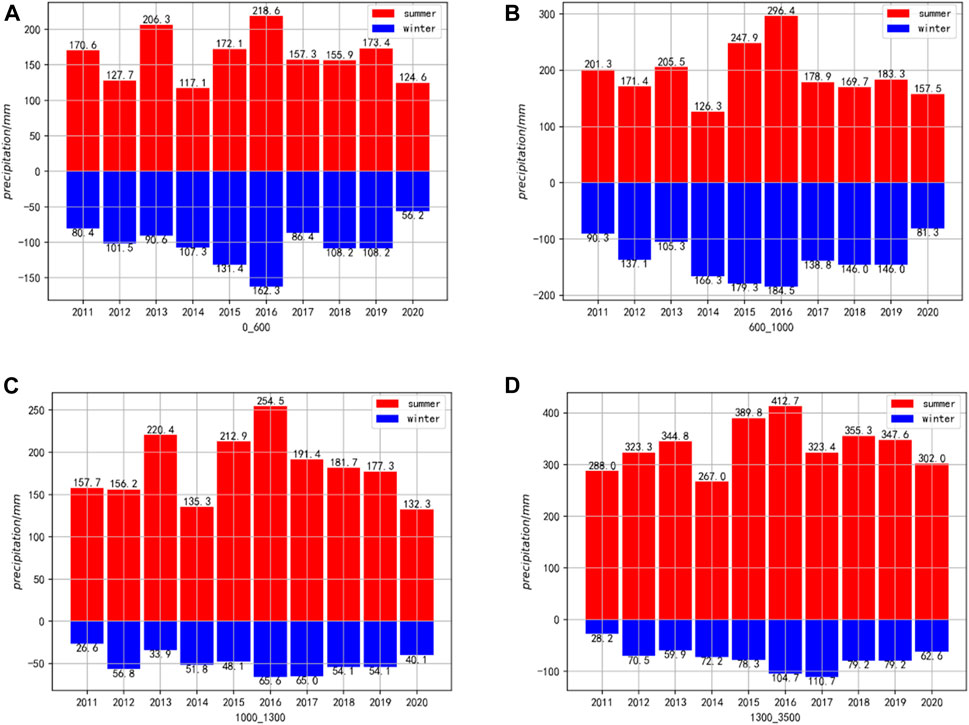
Figure 3. Inter-annual variability of precipitation totals at different altitudes in Xinjiang during the warm and cold seasons.
3.2 Characteristics of precipitation in warm and cold seasons in Xinjiang
From the statistical distribution of the extreme moments corresponding to the hour-by-hour precipitation maximum at each station across the territory, it can be concluded that there are more obvious differences between the warm (Figure 4A) and cold (Figure 4C) seasons of precipitation across the territory. Overall, the warm-season precipitation moments are mainly concentrated from the evening to early morning (19:00–03:00 the next day), accounting for 75.24% of the 105 stations, while the cold-season precipitation moments are significantly different, with the extreme values occurring during 03:00–18:00 in the corresponding stations accounting for 74.29% of the total number of stations. In the northern region of Xinjiang, the peak of precipitation in Yili Kazakh Autonomous State (“Yili State”), Bortala Mongol Autonomous State (“Bo State”), and Shihezi City is mainly concentrated in the period from 19:00–23:00, while in Tacheng State and Altay State, the peak occurred slightly earlier, in the late afternoon and early evening. The warm-season precipitation trend in the northern Xinjiang region generally develops from west to east; the warm-season precipitation in the southern regions of Kizilsu Kyrgyz Autonomous State (“Kizilsu” for short), Aksu, and Hotan still mainly focuses on the evening to early morning hours, and the overall trend of precipitation in the southern Xinjiang region is not obvious compared with that in the northern Xinjiang region due to the special topography of the region and the relative lack of centralized distribution of the stations. In most areas of northern Xinjiang, the peak of cold-season precipitation is in the daytime, and the peak of cold-season precipitation in Altay, which is known as “China’s snow capital,” is 06:00–15:00, while the cold-season precipitation in Urumqi is mainly in the evening, and the precipitation trend is similar to that of the warm season in northern Xinjiang in the cold season. The trend in southern Xinjiang is still not obvious, but the spectrum of precipitation duration is significantly higher than the warm season in the cold season. The distribution of the cold season is significantly higher than that of the warm season, indicating that the duration of precipitation in the cold season is greater than that in the warm season.
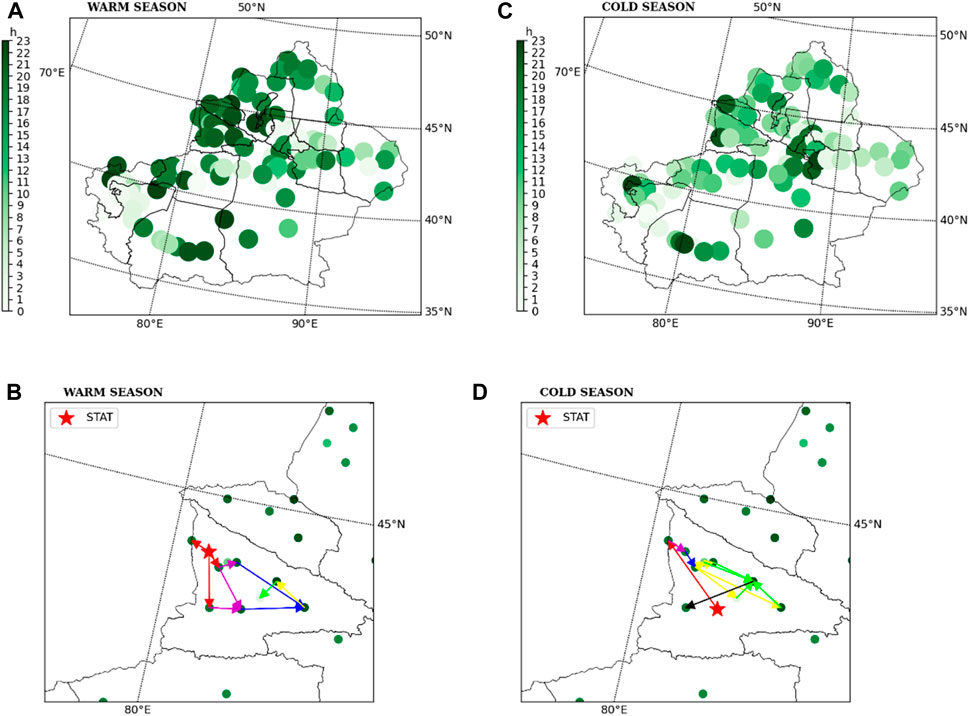
Figure 4. Distribution of extreme precipitation moments in warm and cold seasons in Xinjiang.
Yili State is located in the northwestern corner of Xinjiang, China, with a mild and humid climate, a temperate continental climate, and mountains to the north, south, and east, constituting the geomorphological profile of “three mountains and two valleys,” with superior natural conditions and, therefore, with obvious advantages for the development of the agricultural and animal husbandry industries. The river valley is nearly 360 km long from east to west and 275 km wide from north to south, presenting a semi-enclosed topography (opening toward the west), which is conducive to the formation of precipitation in the valley, with the annual precipitation having the highest value in Xinjiang, making it the wettest region in Xinjiang. The frequent influence of the westerly wind belt system leads to the frequent occurrence of localized precipitation in the warm season and large-scale continuous precipitation in the cold season. Understanding the characteristics of precipitation and the path of precipitation in the region is not only beneficial to the local meteorological forecast service but also plays an important role in guiding ground-based weather modification and water augmentation in the warm season and snow-boosting aircraft operations in the cold season. In this paper, ten national-level ground meteorological observation stations in Yili State, Xinjiang, are chosen, and based on the hourly cumulative precipitation extreme moments, it is found that the precipitation moments in the warm season (Figure 4A) are very concentrated, with eight precipitation moments in the range of 19:00–23:00. The starting station (Figure 4B), Huocheng station, is at an elevation of 624.3 m, and the paths of precipitation are mainly from the west to the east, moving from low elevation to high elevation. Similar to the warm season, the precipitation in the cold season is also concentrated in the range of 07:00–12:00, accounting for nine ground meteorological observation stations, with the starting station (Figure 4D), Tekes Station, at an altitude of 1,210.6 m. In addition to the starting point, the path of precipitation is mainly from west to east, but the direction of movement can be considered to be moving from high altitude to low altitude. Combined with the concentrated precipitation in the warm and cold seasons, weather modification augmentation work is carried out scientifically and effectively; taking into account the precipitation paths in the warm and cold seasons, the layout of the smokestack operation is optimized to effectively improve the service capacity of the local weather modification. Compared with other means of operation, ground-based smokestacks have the advantages of low operating costs, are not subject to the limitations of airspace, and have a small coefficient of danger.
3.3 Spatial and temporal distribution characteristics of precipitation days in warm and cold seasons in Xinjiang
The daily variation of warm and cold season precipitation in Xinjiang is extremely obvious. The warm-season precipitation hour-by-hour daily changes (Figure 5A) show a “V" type change, in which the high-altitude station is particularly prominent, and the whole-day full-time precipitation is greater than the low-, medium-, and medium–high-altitude stations. At the high-altitude station, precipitation reached a maximum value of 10.4 mm at 20:00, and at 12:00, there is a minimum value of 4.7 mm, a difference of approximately 1.2 times. It is not difficult to discover that its value is still higher than the maximum value of the remaining three stations. The low-, medium-, and medium–high-altitude stations’ hour-by-hour changes are extremely distinctive. The difference is approximately 1.2 times, and it is not difficult to realize that its value is still higher than the maximum value of the remaining three stations; the hour-by-hour change trend of the low-, medium-, and medium–high-altitude stations is generally consistent with the fluctuating change, and the minimum value of precipitation occurs at 14:00 or 15:00 in the afternoon. From the viewpoint of the four types of stations’ afternoon precipitation change, all of them have experienced a rapid increase in precipitation, and the rate of increase at the high-altitude station is the most significant. Compared with the warm-season precipitation change pattern, the cold-season daily variability characteristic pattern (Figure 5B) is an inverted “V" type. The four types of stations’ time change principle is very similar, but the different altitude stations’ precipitation by time difference is obvious, and the altitude is not directly proportional to the value of the order from low to high as follows: medium–high-, high-, low-, and medium-altitude stations are very different from the warm season;
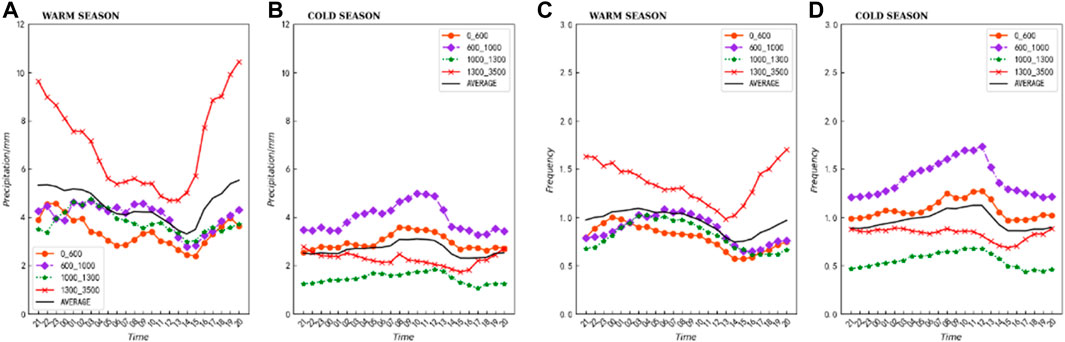
Figure 5. Temporal and spatial distributions of cold- and warm-season precipitation days in Xinjiang.
for medium-altitude stations in the cold season, precipitation maximum values appear at 10:00 and 17:00 with values of 5.0 mm and 3.3 mm, respectively, with the values in the warm season being very different; for medium-altitude stations in the cold season, precipitation maximum values appear at 10:00 and 17:00 with values of 5.0 mm and 3.3 mm, respectively, with the values in the warm season being very different. The values in descending order are medium–high-, high-, low-, and middle-altitude stations, which are very distinct from those in the warm season. The highest values of precipitation at the middle-altitude stations in the cold season occur at 10:00 and 17:00, respectively, with values of 5.0 mm and 3.3 mm, which is a difference of approximately 0.6 times. From the analysis of precipitation frequency distribution in the warm and cold seasons (Figures 5C, D), the daily variation of precipitation frequency is basically consistent with the daily variation of precipitation, and there still exists a “V”-type or inverted “V”-type characteristic. The high-elevation stations still dominate the warm season, with the all-day full-time precipitation frequency still larger than that in the other three stations. The frequency of precipitation is still greater than that in the other three stations, and the maximum and minimum precipitation frequencies occur at 20:00 and 13:00, respectively, 1.7 times and 0.9 times, with a difference of approximately 0.9 times, which is very similar to the time-to-time change of precipitation. The daily trend of precipitation frequency and precipitation at each altitude station is almost the same in the cold season, and the precipitation frequency at the middle-altitude station is still higher than that of the other three stations. The maximum frequency occurs at 12:00 and 19:00, respectively, with a difference of approximately 0.9 times. 19:00, respectively, 1.7 and 1.2 times, a difference of about 0.4 times. Comprehensively, although the difference between the daily time-varying precipitation in the warm and cold seasons at each altitude station is obvious and the time-varying precipitation in the warm season is obviously higher than that in the cold season, the difference in the daily variation of precipitation frequency is not large. The amplitude of the average number of times is relatively stable, which also indicates that precipitation in the warm season has a higher contribution rate compared with that in the cold season and that under the condition of the same number of times of precipitation, the output in the warm season is greater than that in the cold season. The contribution rate of precipitation can be taken as a starting point. From the precipitation contribution rate as a starting point, it is possible to set up more artificial water-boosting operation bases at high-altitude stations in the warm season, carry out artificial ground water-boosting operations for longer durations in combination with the concentrated precipitation periods, or appropriately increase the number of ground smokers in high-altitude areas so as to promote the maximization of the effect and benefit of AIW work in disaster prevention and mitigation, increase water resources, and increase agricultural production.
3.4 Variation characteristics of precipitation gradient in warm and cold seasons in Xinjiang
As different regions are located in climatic conditions with relatively large differences, factors such as temperature, humidity, wind direction, wind speed, and other factors will have a direct impact on the size of precipitation. Xinjiang has the most complex topography and geomorphology in China. Its mountain and basin terrain is dominated by the Altai Mountains in the north, the Tianshan Mountains in the central part, and the Kunlun Mountains in the southern part. The basins between these mountains are unique because of their topography and geomorphology, earning them the name “three mountains sandwiched between the two basins.” These mountains are located between the Talimu Basin, the Tianshan Mountains, and the Kunlun Mountain system. In its territory, Xinjiang encompasses both the lowest point in China, Aydin Lake, which lies 155 m below sea level, and the world’s second-highest peak, Chogori Peak, towering at an elevation of 8,611 m. Far away from the sea, the deep inland has become synonymous with Xinjiang, and the north and south mountain blockade makes it difficult to reach either the Pacific Ocean or Arctic Ocean water vapor, so the lack of water resources seriously restricts the development of Xinjiang’s various undertakings. Complex geomorphology and topographic elevation changes lead to the rise or fall of the air, which is one of the main reasons directly affecting the precipitation amount and precipitation gradient.
Linear regression in statistics is a process of fitting data utilizing a linear relationship between one or more independent variables and one or more dependent variables, describing the relationship between the variables through a linear fitting for explaining and predicting the dependent variable. The
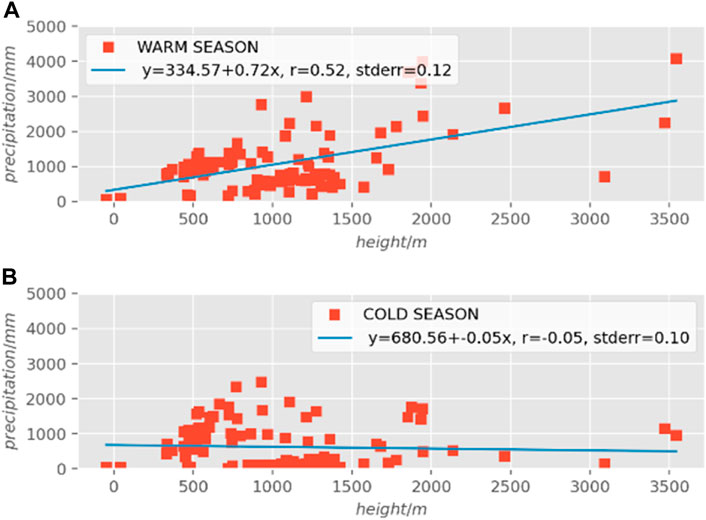
Figure 6. Characteristics of the overall precipitation gradient changes in the cold and warm seasons in Xinjiang.
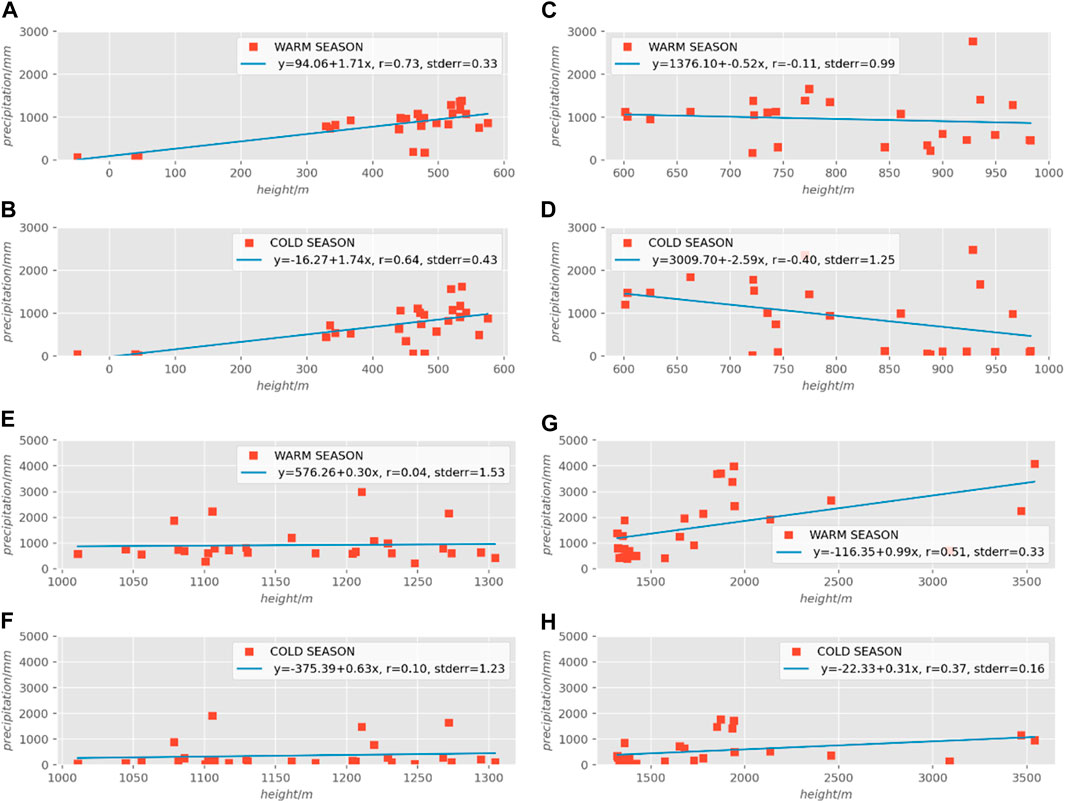
Figure 7. Characteristics of the cold- and warm-season precipitation gradient changes at different altitudes in Xinjiang.
4 Discussion and conclusion
Restricted by the weather and climate models at the level of short-term heavy-precipitation forecast, the use of high temporal and spatial precipitation resolution can not only improve numerical model verification and assessment but also enable an in-depth investigation of the extreme precipitation feature changes and their impact mechanism in China’s Xinjiang’s northern and southern regions. By understanding universal principles, we can provide better service to forecasting products and reduce the occurrence of secondary disasters caused by short-term precipitation. The next aim of this research will be to extend the time-series data in such studies to capture and analyze trends more accurately. In this paper, based on the statistical analysis of hour-by-hour precipitation at 105 national meteorological stations in the Xinjiang region of China from 2011 to 2020, the total amount of precipitation in the cold and warm seasons as well as the frequency of precipitation at each station are acquired. Through analysis, it is concluded that the inter-annual trend of precipitation in the warm and cold seasons in the Xinjiang region is more obvious, the total amount of precipitation in the warm season is obviously higher than that in the cold season, the value in the warm season is at least twice as much as that in the cold season, and the maximum and minimum values in the warm and cold seasons both appear in 2016 and 2014, respectively; from the perspective of inter-annual incremental precipitation, the overall trend of the warm season and the cold season is to increase first and then decrease, and the inter-annual incremental precipitation in warm and cold seasons of the Xinjiang region in the last 10 years is calculated with a curve fitting. A curve fitting of the inter-annual water increment in the warm and cold seasons in Xinjiang over the past 10 years was performed, and it was found that the overall trend of the warm and cold seasons was increasing and then decreasing, but the curvature change was obviously higher in the cold season than in the warm season, which indicated that the inter-annual trend of precipitation in the warm season was relatively stable. The spatial distribution characteristics of the total precipitation in the whole territory illustrate that the distribution in the warm season is relatively decentralized, and the distribution in the cold season is mostly concentrated in the northern region. Combined with the spatial distribution of precipitation and in view of the different characteristics of the warm and cold seasons, it is possible to appropriately increase ground-launched rocket and anti-aircraft operations during the warm season and airborne aircraft operations during the cold season in the above-mentioned areas so as to improve the conversion rate of airborne cloud water resources. Regardless of low, medium, medium–high, or high altitudes, cumulative precipitation in the warm season is always higher than that in the cold season, and the proportion of warm-season precipitation is especially obvious with the increase in altitude, indicating that the warm-season precipitation is closely related to the complex topographic structure of Xinjiang, especially the strong convective weather generated by topographic clouds; the cold-season precipitation is mainly concentrated in the low- and medium-altitude stations, and the correlation between precipitation and elevation is not significant and is mainly directly affected by mesoscale and large-scale weather systems. The precipitation in the cold season is mainly concentrated in the low- and middle-elevation stations, with little correlation between precipitation and elevation, and is mainly affected by the direct influence of mesoscale and large-scale weather systems. From the statistics of extreme precipitation moments, the warm-season precipitation moments are mainly concentrated in the evening to early morning (19:00–03:00 the next day) period, accounting for 75.24% of the 105 stations, while the cold-season precipitation moments are significantly different, with the extreme values occurring at 03–18 h, corresponding to 74.29% of the total number of stations.
The 105 ground meteorological stations in Xinjiang have a linear relationship between precipitation and altitude in the warm season, with a slope of 0.72 and a correlation coefficient (
Data availability statement
The original contributions presented in the study are included in the article/Supplementary Material; further inquiries can be directed to the corresponding author.
Author contributions
BZ: writing–original draft and writing–review and editing. KC: writing–review and editing. BL: writing–review and editing. YL: conceptualization and writing–review and editing. LS: data curation and writing–review and editing. HF: data curation, methodology, and writing–review and editing.
Funding
The author(s) declare that financial support was received for the research, authorship, and/or publication of this article. This work was supported by Xinjiang Autonomous Region Key Research and Development Program Projects (2023B03019-1 and 2023B03019-2), China Meteorological Administration Innovative Development Special project (CXFZ2024J034).
Conflict of interest
The authors declare that the research was conducted in the absence of any commercial or financial relationships that could be construed as a potential conflict of interest.
Publisher’s note
All claims expressed in this article are solely those of the authors and do not necessarily represent those of their affiliated organizations, or those of the publisher, the editors, and the reviewers. Any product that may be evaluated in this article, or claim that may be made by its manufacturer, is not guaranteed or endorsed by the publisher.
References
Abbas, A., Bhatti, A. S., Safi, U., Waheed, U., Muhammad, W., Zhao, C., et al. (2023b). Projection of precipitation extremes over south asia from CMIP6 GCMs. J. Arid Land 15 (3), 274–296. doi:10.1007/s40333-023-0050-3
Abbas, A., Zhao, C., Ullah, W., Ahmad, R., Muhammad, W., and Zhu, J. (2021). Towards sustainable farm production system: a case study of corn farming. Sustainability 13 (16), 9243. doi:10.3390/su13169243
Abbas, A., Zulqarnain, M., Amir, I., Khurram, Y., and Zhao, C. (2023a). Assessing the factors of economic and environmental inefficiency of sunflower production in Pakistan: an epsilon-based measure model. Front. Environ. Sci. 11. doi:10.3389/fenvs.2023.1186328
Adnan, A., Safi, U., Waheed, U., Muhammad, W., Xin, D., Zhao, C., et al. (2022). Evaluation and projection of precipitation in Pakistan using the coupled model intercomparison project phase 6 model simulations. Int. J. Climatol. 42 (13), 6665–6684. doi:10.1002/joc.7602
Awais Naeem, S., Muhammad, W., Muhammad, A., Adnan, A., Ijaz, A., Eun, L. J., et al. (2022). Shifting of meteorological to hydrological drought risk at regional scale. Appl. Sci. 12 (11), 5560. doi:10.3390/app12115560
Chen, T., and Cui, C. (2012). The frontal structure and precipitation mechanism in the 6 January 2010 heavy snowfall event happening in north Xinjiang. Meteorol. Mon. 38 (8), 921–931.
Dong, S., Yang, S., Liu, W., Ya-min, H., and Ming-sheng, W. (2023). Analysis of precipitation anomaly and a failed prediction during the dragon-boat rain period in 2022. J. Trop. Meteorology 29 (1), 115–127. doi:10.46267/j.1006-8775.2023.009
Ehsan, E., Zainab, K., and Zhang, Z. (2022). Understanding farmers’ intention and willingness to install renewable energy technology: a solution to reduce the environmental emissions of agriculture. Appl. Energy 309. doi:10.1016/J.APENERGY.2021.118459
Elahi, E., Li, G., Han, X., Zhu, W., Liu, Y., Cheng, An, et al. (2023). Decoupling livestock and poultry pollution emissions from industrial development: a step towards reducing environmental emissions. J. Environ. Manag. 350, 119654. doi:10.1016/j.jenvman.2023.119654
Huang, H., and Hairong, Xu (2007). Diagnostic analysis on a snowstorm event occurred of Xinjiang in fall. Plateau Meteorol. 26 (3), 624–629.
IPCC (2023). AR6 Synthesis Report: climate change 2023 [M/OL]. [2023-03-20]. Available at: https://https://www.ipcc.ch/report/ar6/syr/downloads/report/IPCC_AR6_SYR_FullVolume.pdf.
Lei, Y. I. N., Fan, PING, and Jiahua, M. A. O. (2023). Shuanggen JIN, analysis on precipitation efficiency of the “21.7” henan extremely heavy rainfall event. Adv. Atmos. Sci. 40 (3), 374–392. doi:10.1007/S00376-022-2054-X
Li, W., He, X., Scaioni, M., Yao, D., Mi, C., Zhao, J., et al. (2019). Annual precipitation and daily extreme precipitation distribution: possible trends from 1960 to 2010 in urban areas of China. Geomatics, Nat. Hazards Risk 10 (1), 1694–1711. doi:10.1080/19475705.2019.1609604
Liang, X. U., and Yongling, S. U. (2023). Spatial and temporal distribution of different grades of short-time precipitation in xining city. Meteorological Environ. Stud. 14 (1), 21–23.
Liu, J., Li, Na, and Chen, C. (2018). The frontal structure and analysis on mesoscale cloud characteristic during a warm zone blizzard process in north Xinjiang. Plateau Meteorol. 37 (1), 158–166.
Liu, Y., Ren, G., Yu, H., and Kang, H. (2013). Climatic characteristics of intense snowfall in China with its variation. J. Appl. Meteorological Sci. 24 (3), 304–313.
Lü, X., Zhou, Y., Yu, X., Yu, B., and Wang, J. (2021). Temporal and spatial variation characteristics of rainstorm flood disaster loss in Xinjiang during 1961—2019. Desert Oasis Meteorology 15 (4), 42–49.
Muhammad, W., Tahira, K., Adnan, A., Ijaz, A., and Zeeshan, J. (2022). Impact of meteorological drought on agriculture production at different scales in Punjab, Pakistan. J. Water Clim. Change 13 (1), 113–124. doi:10.2166/wcc.2021.244
Nunez-Gonzalez Gerardo (2020). Analysis of the trends in precipitation and precipitation concentration in some climatological stations of Mexico from 1960 to 2010. Nat. Hazards 104 (2), 1747–1761. doi:10.1007/s11069-020-04244-w
Peng, B., Huang, Q., Elahi, E., and Guo, W. (2019). Ecological environment vulnerability and driving force of yangtze river urban agglomeration. Sustainability 11 (23), 6623. doi:10.3390/su11236623
Waheed, U., Karim, A., Sami, U., Rehman, A.Ur, Tehmina, B., Wang, G., et al. (2023). An increasing trend in daily monsoon precipitation extreme indices over Pakistan and its relationship with atmospheric circulations. Front. Environ. Sci. 11. doi:10.3389/fenvs.2023.1228817
Wang, X., and Xu, W. (2021). Spatial distribution and temporal variation characteristics of rainstorm flood disasters with different intensities in southern Xinjiang from 1980 to 2019. J. Glaciol. Geocryol. 43 (6), 1818–1828.
Wang, Y., Zhao, Z., Yan, J., Tang, Y., and Cai, Y. (2020). Spatial and temporal distribution characteristics and its classification of snow disaster in Xinjiang. Arid. Land Geogr. 43 (3), 577–583.
Wendler, G., Gordon, T., and Stuefer, M. (2017). On the precipitation and precipitation change in Alaska. Atmosphere 8 (12), 253. doi:10.3390/atmos8120253
Wijeratne Vithana, P. I. S., Gang, Li, Sajid, M. M., and Adnan, A. (2022). Assessing the impact of long-term ENSO, SST, and IOD dynamics on extreme hydrological events (EHEs) in the kelani river basin (KRB), Sri Lanka. Atmosphere 14 (1), 79. doi:10.3390/atmos14010079
Xu, L., Zhou, H., Du, L., and Bao, Z. (2015). Spatial-temporal change trend of precipitation in northwest China during 1951—2008. J. Desert Res. 35 (3), 724–734.
Xue, T., Tang, G., Lin, S., Wu, Y., Liu, Y., and Dou, Y. (2017). Long-term trends in precipitation and precipitation extremes and underlying mechanisms in the U.S. Great Basin during 1951-2013. J. Geophys. Res. D. Atmos. JGR 122 (12), 6152–6169. doi:10.1002/2017jd026682
Yafeng, S., Yongping, S., and Ruji, Hu (2002). Preliminary study on signal, impact and foreground of climatic shift from warm-dry to warm-humid in Northwest China. J. Glaciol. Geocryol. 24 (3), 219–226.
Yang, L., Chen, F., Chou, S., Li, J., and Zeng, Y. (2018). Xinjiang heavy snowfall yearbooks [M] (Beijing: China Meteorological Press).
Yang, L., and Liu, J. (2018). Some advances of water vapor research in Xinjiang. J. Nat. Disasters 27 (2), 1–13.
Yang, L., Xia, Li, and Zhang, G. (2011). Some advances and problems in the study of heavy rain in Xinjiang. Clim. Environ. Res. 16 (2), 188–198.
Yang, X., An, D., Zhou, H., and Zhao, Y. (2020). Daily variation of winter precipitation in ili River Valley of Xinjiang from 2012 to 2017. J. Glaciol. Geocryol. 42 (2), 1033–1041.
Yaw, A., Twumasi John, B., Namwamba Zhu, H., Merem, E. C., Loh, P. M., Asare-Ansah, A. B., et al. (2022). Analysis of precipitation trends and prediction in selected cities in the southeast Louisiana. Atmos. Clim. Sci. 12 (4), 698–727. doi:10.4236/acs.2022.124039
Zhang, J., Cui, C., and Chen, C. (2013). Study on water vapor characteristic of typical heavy snowstorm case in northern Xinjiang. Plateau Meteorol. 32 (4), 1115–1125.
Zhao, J., Yang, X., Lin, X., Zhang, Y., and Guo, J. (2013). Analysis on multi-scale system configuration and district of a disaster snowstorm. Plateau Meteorol. 32 (1), 201–210.
Keywords: precipitation, spatial–temporal distribution, gradient, increased water potential, Xinjiang (China)
Citation: Zheng B, Chen K, Li B, Li Y, Shi L and Fan H (2024) Climate change impacts on precipitation and water resources in Northwestern China. Front. Environ. Sci. 12:1377286. doi: 10.3389/fenvs.2024.1377286
Received: 27 January 2024; Accepted: 05 April 2024;
Published: 26 April 2024.
Edited by:
Yong Xue, China University of Mining and Technology, ChinaReviewed by:
Debashis Nath, Sun Yat-Sen University, ChinaAdnan Abbas, Nanjing University of Information Science and Technology, China
Copyright © 2024 Zheng, Chen, Li, Li, Shi and Fan. This is an open-access article distributed under the terms of the Creative Commons Attribution License (CC BY). The use, distribution or reproduction in other forums is permitted, provided the original author(s) and the copyright owner(s) are credited and that the original publication in this journal is cited, in accordance with accepted academic practice. No use, distribution or reproduction is permitted which does not comply with these terms.
*Correspondence: Bin Li, YnRsaWJpbkAxMjYuY29t