
95% of researchers rate our articles as excellent or good
Learn more about the work of our research integrity team to safeguard the quality of each article we publish.
Find out more
ORIGINAL RESEARCH article
Front. Environ. Sci. , 26 July 2024
Sec. Social-Ecological Urban Systems
Volume 12 - 2024 | https://doi.org/10.3389/fenvs.2024.1376213
 Banafsha Javeed1Qamer Ridwan2Delin Huang1*
 Zishan Ahmad Wani3*
 Sazada Siddiqui4Habab Merghani Yassin4Gehan Ahmed Mohamed Othman4
In the present study, a bibliometric analysis of the published literature on Ecological Niche Modelling (ENM) topic from 1992 to 2023 was carried out using Web of Science (WoS) as a data source. Analysis of the data was carried out using bibliometrix tool in R software. Additionally, VOS Viewer software was used to provide visualization of the bibliometric analysis through network maps. The results of the study revealed that a total of 3, 595 scholarly documents in the English language were published on ENM from 1992–2023, originating from 564 sources. Furthermore, a significant increase in publications was observed over the years. A total of 13,122 authors have contributed to the field, with “Peterson AT” from the University of Kansas being the most prolific author. Journal of Biogeography emerges as the most relevant source with 290 documents published, while Ecography as the most cited source with 8,485 citations. Collaboration analysis revealed that only 109 documents were single-authored, with an average of 5.07 co-authors per document and an international co-authorship rate of 50.96%. Additionally, our analysis shows that the USA leads in Multiple Country Publications (MCP). The development of sophisticated software tools and algorithms coupled with remote sensing data has democratized ENM research, enabling scientists from diverse backgrounds to contribute to the field’s growth. However, like any other model ENMs have some limitations and thus the entire procedure used to create an ENM must be reliable, transparent, and repeatable in order for it to be used effectively in conservation, management and decision-making.
The ecological niche of a species, originally defined as the set of ecological conditions allowing a species to survive and reproduce without an external support (Grinnell, 1917), later evolved to describe the functional role of a species within a community (Elton, 2001). It has been observed that ecological niches and distribution pattern of different species are being significantly affected by the changing climatic conditions (Wani et al., 2022). The species have been shown to shift their existing locations due to climatic alterations and many of the species have been predicted to lose their suitable habitats in near future (Hamid et al., 2019; Wani et al., 2022). To understand the dynamics of species distribution and ecological niches, a widely used technique in ecology and biogeography is ecological niche modelling (ENM) (Peterson et al., 2015), which has diverse applications, such as identifying suitable habitats for species (Guisan and Zimmermann, 2000), predicting the impacts of climate change on species’ distributions (Pearson et al., 2007), assessing the invasiveness of non-native species (Jiménez-Valverde et al., 2011), and aiding in conservation planning (Guisan et al., 2013). ENM holds great promise for enabling adaptive conservation efforts and ultimately contributing to biodiversity protection (Guisan et al., 2013). The models used in ENM are essentially statistical algorithms that link geographic data on species presence or absence to environmental factors defining their habitat. Assessing environmental conditions in relation to species ecology is a fundamental step in understanding present, historical, and future species distribution ranges. ENM typically employs climatic variables along with other abiotic and occasionally biotic factors (Sillero et al., 2021a; Franklin, 2023).
Bibliometric research focuses on exploring new trends, deciphering potential areas in a particular research discipline, and investigating the contribution of journals, authorship networks, institutes, and countries based on constructing the intellectual structure over the time (Huy et al., 2022). There are three types of bibliometric indicators: 1) Quantity indicators that measure the productivity of a particular researcher or research group. The simplest method is to count the number of articles published by a particular author or research group during a certain time period. 2) Performance or quality indicators that measure the quality of a journal, researcher, or research group. How often an article, an author, or a journal is cited by others is an indication of performance—the higher the number of citations, the higher the level of performance. 3) Structural indicators that measure connections between publications, authors, or research fields (Durieux and Gevenois, 2010). Structural indicators in a bibliometric study encompass co-citation networks, research collaboration analyses, and co-word occurrences. Bibliometric studies have been conducted across various ecological research topics, including deforestation (Aleixandre-Benavent et al., 2018), ecological restoration (Guan et al., 2019), biological invasions (Qiu and Chen, 2009), soil health (Liu et al., 2020), endangered plants (Xu et al., 2022), and human-wildlife conflict (Ridwan et al., 2023). With the advent of climate change, ENM studies are being undertaken by ecologists in different parts of the world in order to understand the niche dynamics of different species in response to changing climatic scenarios (Gilani et al., 2020; Kolanowska and Jakubska-Busse, 2020; Melo-Merino et al., 2020; Zhu et al., 2020; Wani et al., 2023). Consequently, a lot of scientific documents on ENM are being published in different scientific outlets such as journals, books, and conference proceedings. In order to measure the quantity, quality and structural connections of the scientific publications in the field of ENM, bibliometrics, expressed through various indicators can be a crucial and important tool (Durieux and Gevenois, 2010). Therefore, to understand the research trends, pattern, major contributors, research collaboration, etc., in the field of ENM, a bibliometric analysis of the published literature on ENM was carried out in the present study. All the three indicators (Quantity, performance and structural) were analyzed during the present study. The findings of the study will aid the researchers working in field of ecology to gain insights of the ENM research trends and to find suitable publication and working platforms to better express their research ideas in the field of ecology particularly in niche modelling of species.
In the present study, we utilized the Web of Science (WoS) core collection platform owned by Clarivate Analytics as our primary data source due to its high reliability and inclusivity of data (Goyal and Kumar, 2021; Malapane et al., 2022). Data was searched and retrieved on 29th August 2023 using a specific string of keywords viz., “Niche Modelling” OR “Habitat Suitability Modelling” Or “Species Distribution Modelling” OR “Ecological Niche Modelling” to extract articles from the WoS spanning the time period from 1992 to 2023. The search query explored titles, abstracts, keywords, authors, affiliations, sources and citations. The search data was saved and exported in bibtex as well as plaintext formats to be used in bibliometrix and VOS viewer analysis, respectively. Given that articles serve as a critical representation of research trends and constitute a substantial portion of the literature, we exclusively relied on articles as our primary data source for conducting the analysis.
For the comprehensive analysis of our data, Bibliometrix tool in R was used. This tool is open source software programmed in the R language and was developed by Massimo Aria and Corrado Cuccurullo (Aria and Cuccurullo, 2017). Bibliometrix offers a wide range of functionalities for bibliometric analysis. Data was analyzed for publications outputs, most relevant sources, authors, countries and affiliations, most cited sources, authors, countries and affiliation, most globally cited documents, country production, collaborations analysis and keyword analysis. In addition, we used the VOS Viewer (version 1.6.14) to conduct cluster analysis, specifically focusing on co-citation networks (Van Eck and Waltman, 2010). The data analysis covered various bibliometric indicators, including quantitative indicators, performance indicators, and structural indicators. Forty highly cited publications from the global perspectives were selected and included within the study for a full-text reading to produce a comprehensive contextual review of ENM.
In the present study, based on WoS data, it was revealed that a total of 3,595 scholarly documents (in English language) have been published on the topic of ENM over a span of 32 years, ranging from 1992 to 2023. These documents were published in 564 different sources, including journals, books, and proceedings. These scholarly documents include research articles (3,337), review articles (124), proceeding papers (25), data papers (8), editorials (18), letters (10) and others. These documents collectively cited a total of 135,404 references. Notably, there has been a substantial increase in the number of publications over the years. Figure 1 illustrates the growth of research publications on the topic of ENM from 1992 to 2023. This substantial increase in publications began around 2001, marking a significant turning point in the field. Before 2001, there was a relatively modest level of research activity in the field of ENM. In 1992, there was only one publication on this topic, whereas in 2022, there were 378 publications. The highest number of publications was recorded in the year 2021, with 389 publications. The annual growth rate for publications on ENM is calculated to be approximately 19.45%. The substantial increase in ENM publications, especially since 2001, likely signifies its critical role in addressing contemporary global challenges like climate change. The development of sophisticated software tools and algorithms such as BioMod, Maxent, Generalized Linear Model and Random Forest has democratized ENM research, enabling scientists from diverse backgrounds to contribute to the field’s growth (Bobrowski et al., 2021; Wani et al., 2022). Furthermore, the integration of remote sensing technologies has expanded ENM applications, enhancing our understanding of the environment and species distributions (Jetz et al., 2012; Leitao and Santos, 2019; Regos et al., 2022). Remote sensing data allow measuring vegetation condition, ecosystem productivity, and seasonality all of which might be used in ENMs. These measurements are now available over time series thus expanding the possibilities to model species distributions over time. Upcoming sensors are expected to provide even better and more diverse measurements at finer spatial, temporal and spectral resolutions. The integration of such remotely sensed information in ENMs can lead to global mapping of biodiversity change and thus aim at effective conservation actions (Prasad et al., 2015). Publication output is an important quantitative indicator of research advancement within a specific field of study (Ridwan et al., 2023). Nevertheless, it is essential to exercise caution when employing it as a sole metric for comparing authors or research groups. Although the quantity of publications can indicate the productivity of an author or research group, it does not necessarily provide insights into the quality of the articles produced (Durieux and Gevenois, 2010).
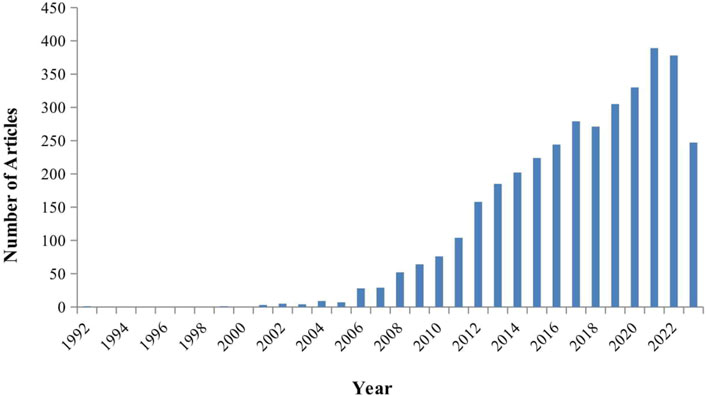
Figure 1. Annual scientific production of documents on the topic of ENM 1992-August 2023.
The authorship analysis conducted in the present study has identified a total of 13,122 authors who have made significant contributions to the field of ENM through their research documents. Among these authors, only 91 have authored single-authored documents, while substantial 13, 031 have collaborated on multi-authored documents. “Peterson AT,” a distinguished professor at the University of Kansas Lawrence, United States, has emerged as the leading contributor with a remarkable 37 publications to his name. Professor Peterson works on a broad spectrum of topics including ecology, biogeography, and evolutionary biology. Following closely to him is “Guisan, A,” a professor at the University of Lausanne, Switzerland, specializing in niche modelling, habitat suitability, and distribution modeling, with 31 publications. “Roedder D,” working as an associate professor and curator of Herpetology at the Leibniz Institute for Biodiversity Change Analysis (LIB)–Research Museum Alexander Koenig, Germany, has authored 26 publications. Furthermore, “Thuiller, W,” a Research Director at Grenoble Alps University, France, known for his work in biogeography, ecology, and biostatistics, has 25 publications to his name, and “Svenning, JC,” a Professor at Aarhus University, Denmark, working in the section for Eco-informatics and Biodiversity (ECOINF) and the Centre for Biodiversity Dynamics in a Changing World (BIOCHANGE), has contributed 24 publications (Table 1).
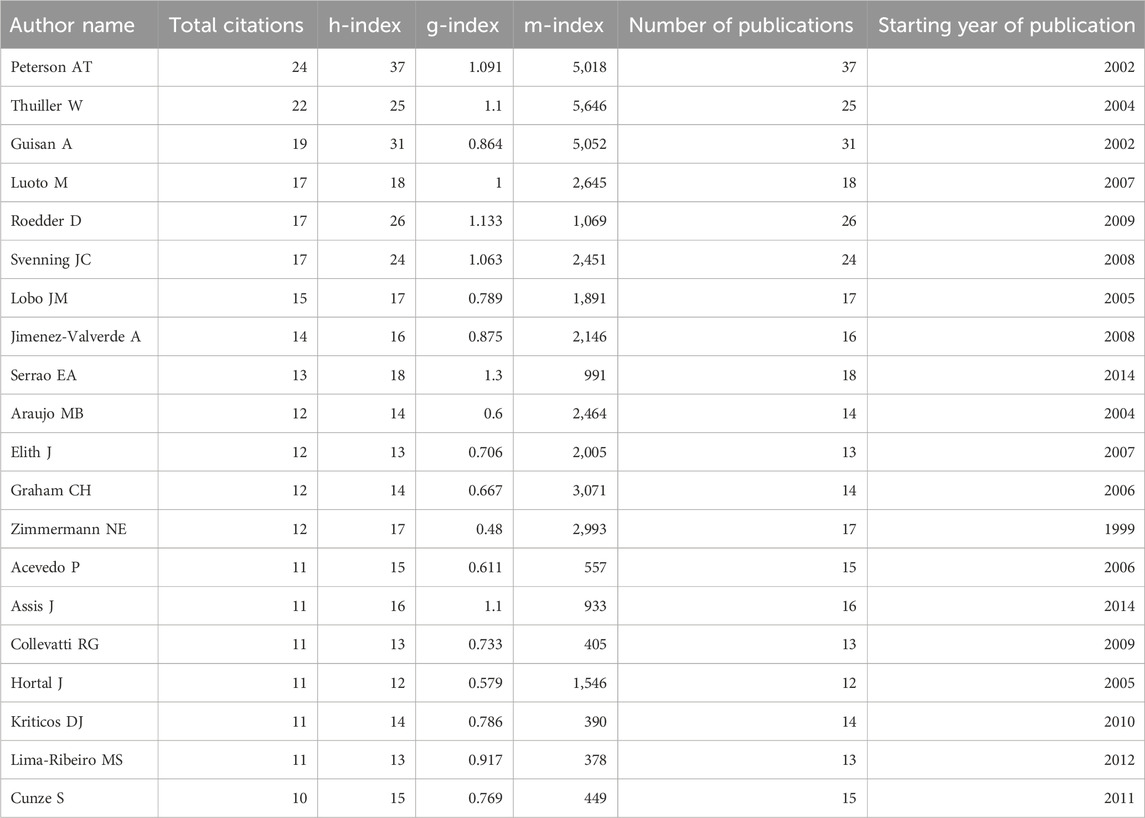
Table 1. Top twenty most productive and highly cited authors.
Lotka’s productivity law, introduced by Alfred J. Lotka in 1926, characterizes the distribution of publication frequency among authors in a given field (Lotka, 1926). According to this law, the distribution is typically uneven, with a small number of highly productive authors responsible for the majority of articles (Ridwan et al., 2023). The relationship can be described as inversely proportional, meaning that as the number of works contributed increases, the number of authors contributing to that level of output decreases (López-Montero et al., 2022). Applying Lotka’s Law to our findings, it becomes evident that 81.8% of authors have contributed only one publication, while 10.6% have authored two publications. Furthermore, 3.7% have authored three publications, 1.5% contributed with four publications and 2.4% have contributed more than four publications (Table 2). This distribution aligns with Lotka’s law where a small number of authors are highly productive, while the majority has lower publication output.
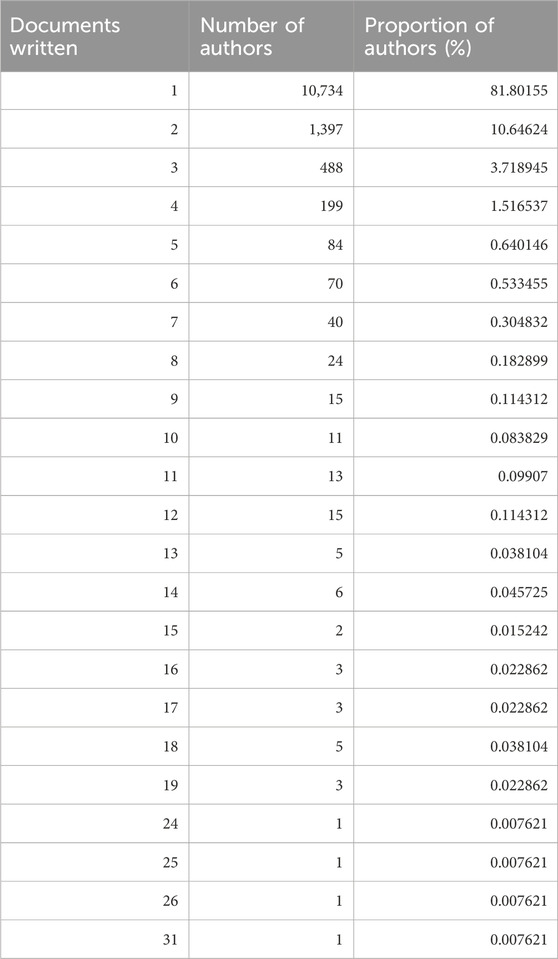
Table 2. Distribution of authors and the corresponding number of documents authored in accordance with Lotka’s Law.
On the basis of number of documents published, out of the total 564 sources on the topic of ENM, the most relevant source is “Journal of Biogeography,” in which maximum number of documents (290) was published, it is followed by “Diversity and Distributions” (214 documents), “Molecular Ecology” (115 documents), “PLOS ONE” (102 documents) and “Global Ecology and Biogeoghraphy” (93 documents) (Figure 2). The Journal of Biogeography is a peer-reviewed, renowned scientific journal that focuses on research at the intersection of biology and geography, with a strong emphasis on scientific significance and broad general interest. The journal seeks to publish papers that investigate patterns and mechanisms that influence biodiversity across various temporal and spatial scales, ranging from the distant past to the future and from local to global perspectives. The Journal of Biogeography was founded in 1974 and is closely affiliated with two sister journals, Global Ecology and Biogeography and Diversity and Distributions. These three journals, while interconnected, maintain distinct yet complementary areas of focus within the expansive domain of biogeography. ENM often deals with both historical and predictive aspects of species distributions, making the “Journal of Biogeography” “Global Ecology and Biogeography” and “Diversity and Distributions” ideal outlets for research on this subject. The journal “Molecular Ecology” specializes in the molecular and genetic aspects of ecology, evolution, behavior and conservation, making it particularly relevant for ENM studies that incorporate genetic data. The journal “PLOS ONE” is known for its interdisciplinary approach and open-access publishing model. While it covers a wide range of scientific fields, including biology, it is also relevant to ENM research due to its inclusivity and willingness to publish research from various domains.
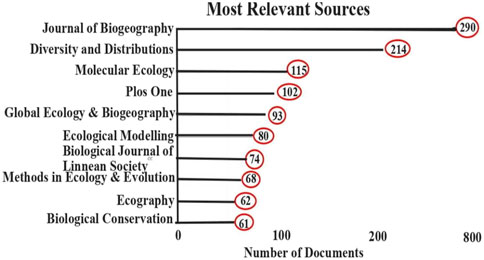
Figure 2. Top most relevant and productive journals from 1992–2023.
Bradford’s law of scattering describes how literature pertaining to a particular subject is distributed across various journals (Bradford, 1934). According to Bradford’s Law, a set of core journals, known as “Bradford’s core” emerges as central to that subject. These core journals typically contain a significant number of articles and receive substantial citations, signifying their importance (Borgohain et al., 2021). Applying Bradford’s Law to our study, we identified that among a total of 564 sources, only eleven journals were classified as core sources, as shown in Figure 3. This finding suggests that these eleven journals likely encompass a substantial proportion of articles pertaining to the topic of ENM. Conversely, the remaining sources are likely to have lower relevance or frequency of articles on this specific subject, emphasizing the concentration of valuable literature within the core journals.
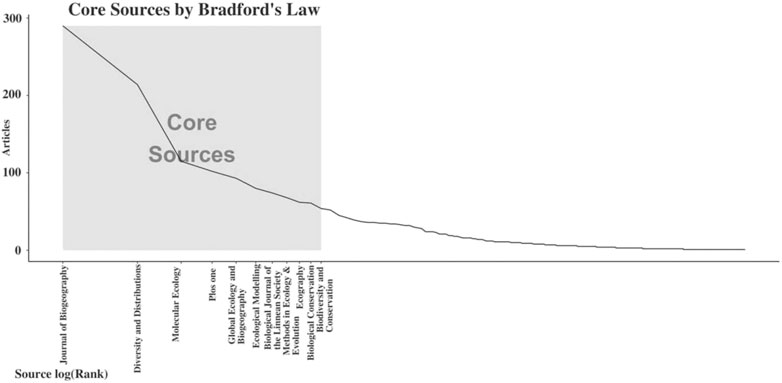
Figure 3. Bradford’s law showing the most basic and core sources.
When analyzing country-wise document production, it is evident that the United States stands as the most prolific contributor with a substantial output of 2,215 documents. Following the United States, the United Kingdom closely trails with 1,290 documents, followed by Australia with 1,180, Brazil with 1,136, China with 1,054, Spain with 1,052, Germany with 1,014, and France with 804 (Figure 4). This information may be helpful for gaining insights about the global distribution of research activity within the field of ENM.
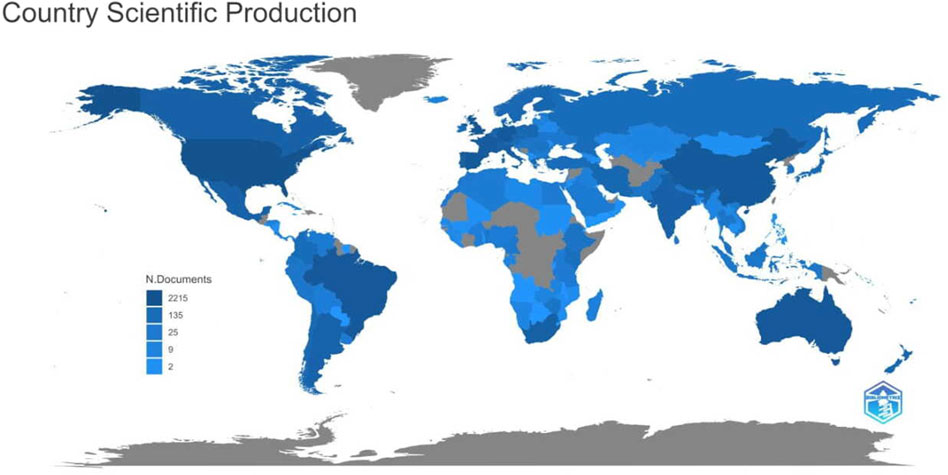
Figure 4. Global scientific production on ENM studies.
Figure 5 presents a comprehensive overview of the top twenty prominent affiliations of corresponding authors. Notably, the “National Autonomous University of Mexico” emerges as the leading institution, demonstrating its significant contribution with a total of 158 documents. It is closely followed by the “University of Kansas” with 157 documents, the “University of Porto” with 138, the “University of Helsinki” with 123, and the “University of Lausanne” with 118 documents. This ranking facilitates precise comparisons among institutions with respect to the global reach of their publication patterns, their frequency of publishing in peer-reviewed sources, their presence in esteemed journals within the specific discipline, and the distribution of their publications across scientific research and high-level synthetic literature (Ridwan et al., 2023).
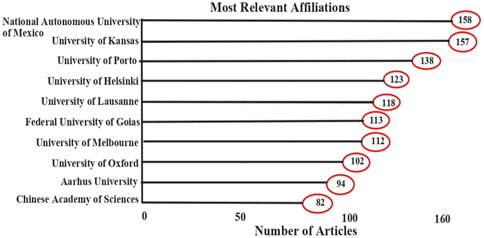
Figure 5. Top 20 most relevant affiliations.
Research has evolved to prioritize collaboration as the central catalyst for knowledge creation, spanning a broad array of academic domains. This shift towards collaborative research is observed across a wide spectrum of academic disciplines. Importantly, collaborative research tends to yield results that receive higher citation rates, and this collaborative advantage has been progressively increasing over time (Paphawasit and Wudhikarn, 2022). Based on collaboration analysis it was observed that among a total of 3,595 documents, only 109 have been authored by a single individual. On average, there are 5.07 co-authors per document, with an international co-authorship rate of 50.96%. Additionally, our analysis reveals that the United States leads in Multiple Country Publications (MCP), followed by the United Kingdom, Australia, China, and Spain (Figure 6). Figure 7 visually represents the countries involved in publishing articles on ENM studies and illustrates the degree of collaboration among them. The intensity of the blue color corresponds to the number of publications by each country, while the thickness of the pink lines represents the level of collaboration between countries.

Figure 6. Most relevant countries on ENM studies.
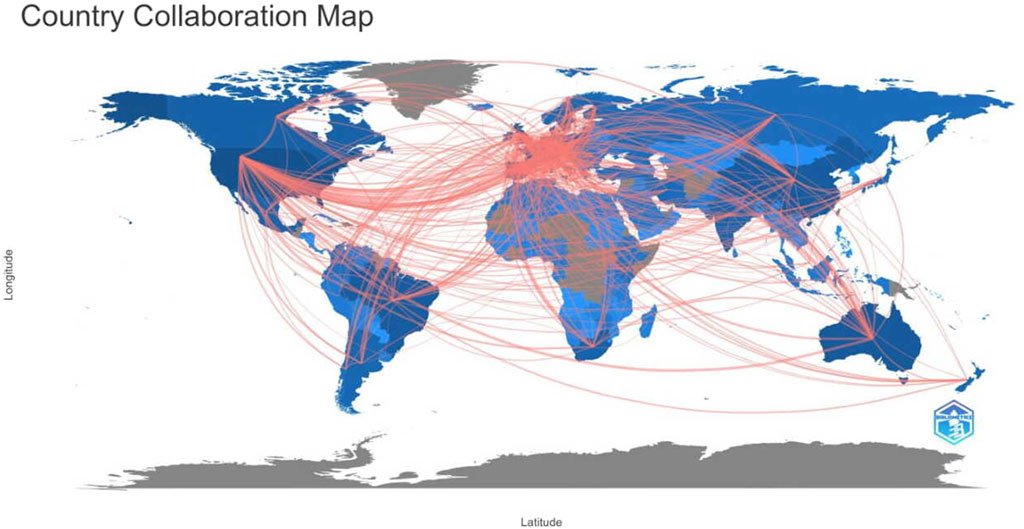
Figure 7. Country collaboration map on ENM studies.
The fundamental qualitative measure of influence for an article, journal, or region is typically the number of times it has been cited. However, it’s important to note that citation count is influenced by factors such as the number of articles and the publication year and should not be solely relied upon as an independent metric (Xiao et al., 2022). Citation analysis offers valuable insights into a specific research field. Firstly, it allows us to identify the most influential authors and publications that have a significant impact on that field (Gundolf and Filser, 2013). Secondly, it unveils the knowledge flow and communication connections among authors. Lastly, by examining the connections between cited and citing works, we can explore how a knowledge domain evolves and changes over time (Pournader et al., 2020). The high number of citations received by a publication indicates its importance and substantial contributions to the research area. Analyzing citations of publications also helps in identifying pertinent works and monitoring their popularity and development over time (Rejeb et al., 2022).
In the field of ENM, from 1992–2023, it was revealed that on an average, each document has received 31.41 citations. The most globally cited documents on ENM include Pearson et al. (2007), Liu et al. (2005), and Karger et al. (2017) (Table 3). The top most cited article by Pearson et al. (2007) revolves around the development and testing of a novel jackknife validation approach to predict the distribution of 13 secretive leaf-tailed gecko species (Uroplatus spp.) in Madagascar, even when the available occurrence records for these species are limited (ranging from 4 to 23 occurrences). They utilized environmental data and two modelling approaches (Maxent and GARP) and found that the Maxent model performed well with sample sizes as low as five occurrences, while GARP was less effective, especially with very limited data. The study emphasizes that models with small sample sizes indicate regions with similar environmental conditions to known occurrences rather than precise species ranges. While this approach offers valuable insights for guiding field surveys and discovering unknown populations, it also recognizes the need for cautious interpretation and highlights the potential for overestimating predictive power with larger sample sizes.
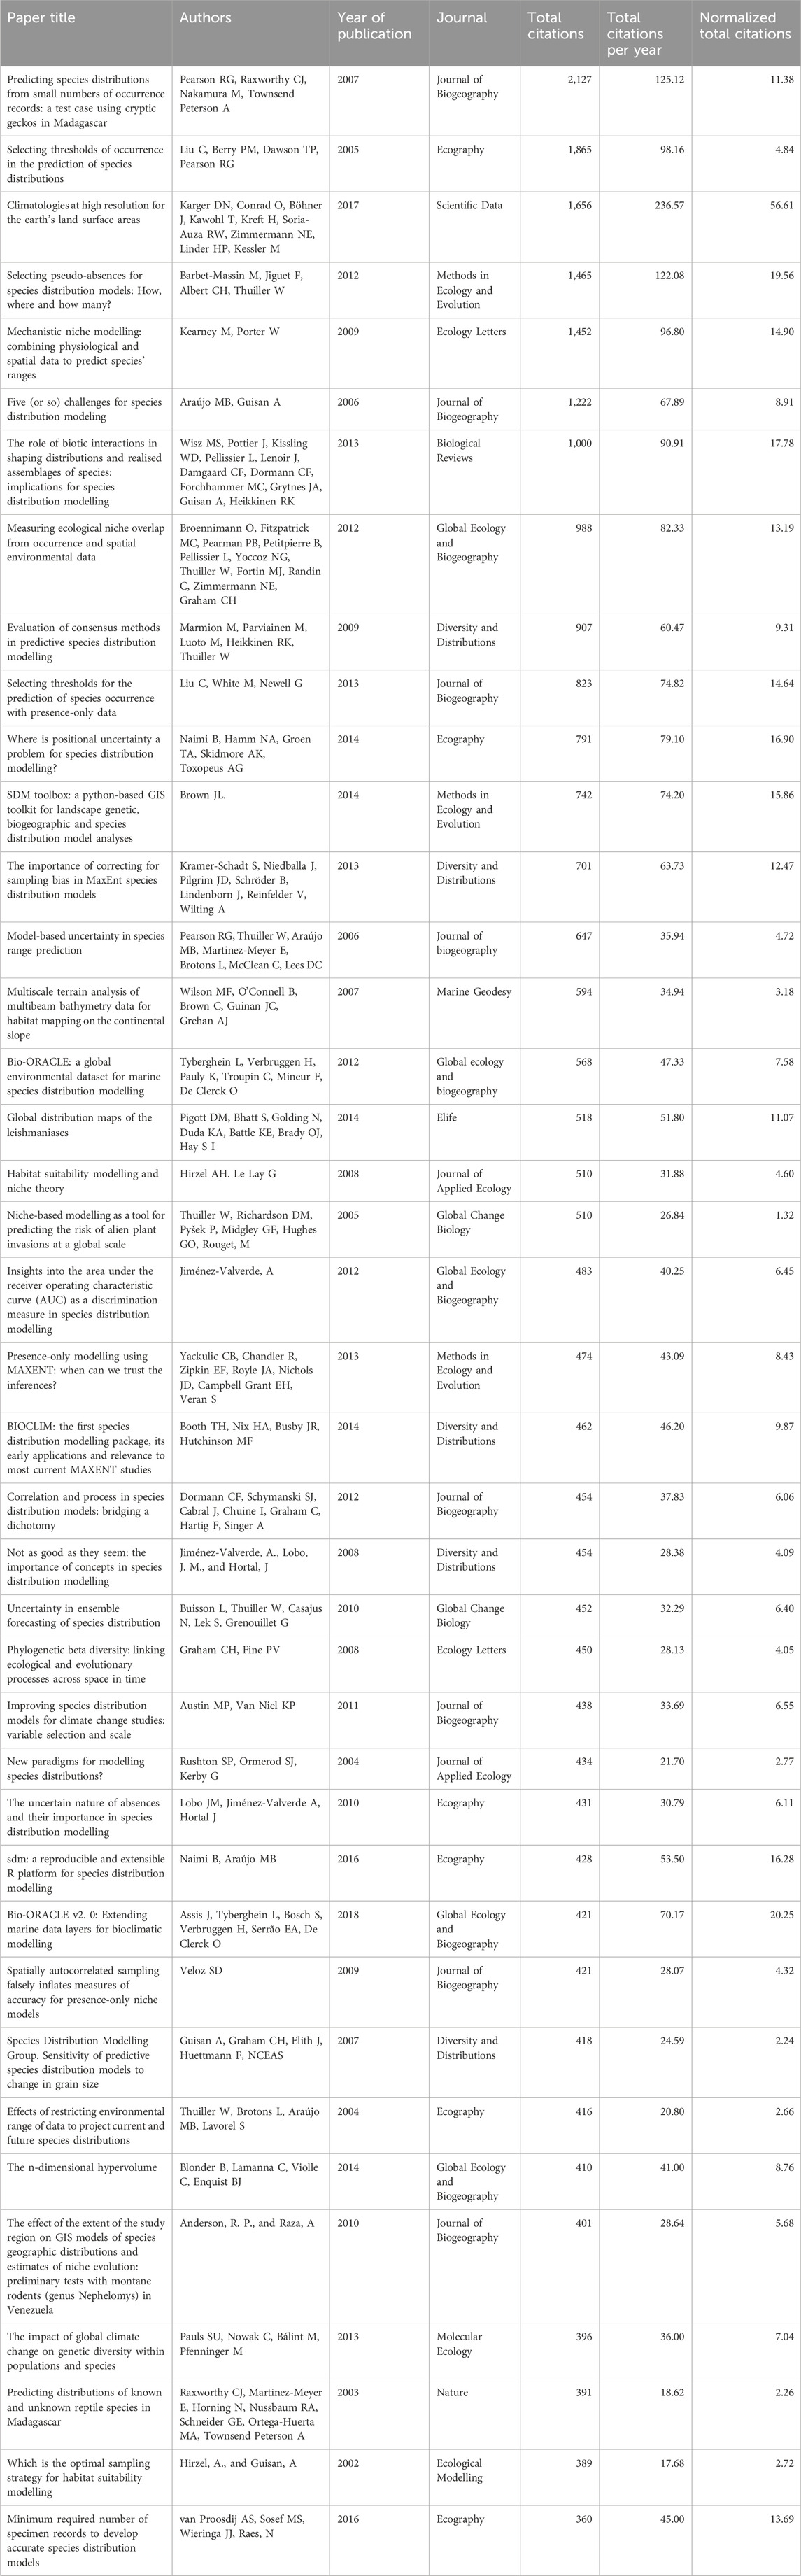
Table 3. Top forty most cited documents related to ENM.
Liu et al. (2005) addresses the critical issue of selecting appropriate thresholds when converting species distribution modeling results from probabilistic predictions to binary presences and absences. This article compares twelve different threshold determination approaches using two European species and artificial neural networks. The evaluation of modeling results employs four indices: sensitivity, specificity, overall prediction success, and Cohen’s kappa statistic. The findings highlight that several effective approaches include the prevalence approach, average predicted probability/suitability approach, and three sensitivity-specificity combined methods, such as sensitivity-specificity sum maximization, sensitivity-specificity equality, and the approach based on the shortest distance to the top-left corner (0,1) in ROC plot. In contrast, the commonly used kappa maximization approach is less effective, and the fixed threshold approach is the least favorable. Furthermore, the study recommends using datasets with a prevalence of 50% for model building whenever possible. It often leads to optimal thresholds satisfying multiple criteria simultaneously, simplifying the threshold selection process.
Karger et al. (2017) introduces the CHELSA dataset (Climatologies at high resolution for the earth’s land surface areas), which provides high-resolution temperature and precipitation estimates for the Earth’s land surface. These data are derived by downscaling the ERA-Interim climatic reanalysis to a 30-arc-second resolution. The temperature estimation is based on statistical downscaling of atmospheric temperatures, while the precipitation estimation incorporates factors like wind patterns, valley orientation, and boundary layer height, followed by bias correction. The dataset covers monthly temperature and precipitation climatology for the period from 1979 to 2013. Comparisons with other established gridded datasets and station data from the Global Historical Climate Network demonstrate the accuracy of the CHELSA algorithm. On comparison of the performance of new climatologies, the study shows that using CHELSA data can improve the precision of species distribution modelling or ecological niche modelling (ENM), particularly in predicting species ranges, and highlights its superior performance in predicting precipitation patterns compared to other products.
During the present study it was revealed that among the authors, “Thuiller W” stands out with the highest impact, having received 5,646 citations and possessing an h-index of 22, a g-index of 25, and an m-index of 1.1. Following closely are “Pearson RJ” with 5,059 citations, an h-index of 6, a g-index of 6, and an m-index of 0.31, “Guisan A” with 5,052 citations, an h-index of 19, a g-index of 3, and an m-index of 0.864, and “Peter AT” with 5,018 citations, an h-index of 24, a g-index of 37, and an m-index of 1.091 (Table 1). The “h-index,” first introduced by Jorge Hirsch in 2005, serves as a valuable metric for assessing a scientist’s contribution and impact. It signifies that a researcher has authored H papers, each of which has been cited at least H times (Hirsch, 2005). The h-index can be applied not only to evaluate an individual researcher’s influence but also to assess the impact of a collection of publications with a substantial quantity (Bornmann and Daniel, 2007). However, it may have limitations and inaccuracies when applied to a small set of articles. The “g-index,” proposed as an enhancement of the h-index, identifies the largest rank (when papers are arranged in descending order of citation count) at which the first g papers have at least g2 citations combined (Egghe, 2006). It places more emphasis on highly cited articles while retaining the positive aspects of the h-index, offering a better overall representation of achievements than the h-index (Egghe, 2006). The “m-index” represents another variation of the h-index, emphasizing the h-index in relation to the time of the researcher’s initial publication (Zaki et al., 2023).
The USA ranks at the top with 19,899 citations, followed by the Australia (13,777 citations), United Kingdom + (9,010 citations), Spain (7,550), and Switzerland (7,383 citations) (Supplementary Figure S1). Among the sources, the journal Ecography stands out to be the most cited source with 8,485 citations, it is followed by Ecological Modelling with 7,084 citations, and Journal of Biogeoghraphy with 7,025 citations (Supplementary Figure S2). The highest citation count of the journal Ecography highlights its influential role in advancing ecological and biodiversity research. Ecography is a peer-reviewed journal owned by the Nordic Society of Oikos, specializes in publishing groundbreaking articles that contribute significantly to the advancement of knowledge concerning ecological and biodiversity patterns in both spatial and temporal dimensions. While the journal welcomes papers centered on conservation and restoration, it places emphasis on their integration with ecological theory and the communication of broader, generalized insights rather than relying solely on individual case studies. The second most cited journal “Ecological Modelling,” focuses on the publication of innovative mathematical models and systems analyses that effectively describe ecological processes. It also highlights novel applications of these models in the context of environmental management, showcasing its significance in bridging the gap between ecological research and practical environmental solutions.
Co-citation relationships occur when two papers are cited together in another document, and this method is widely utilized in bibliometric analysis to explore the intellectual structure of influential research in a specific field (Xiao et al., 2022). The frequency of co-citations reflects the similarity between two articles in terms of their overarching research domain (Goyal and Kumar, 2021). In this study, a total of 287 documents met the co-citation threshold of 50, indicating that these articles were cited together in the reference lists of 50 or more different publications. These documents were subsequently grouped into five clusters within the co-citation network (Figure 8). Cluster 1 (Red) comprises 120 documents, Cluster 2 (Blue) has 84, Cluster 3 (Green) contains 70, Cluster 4 (Yellow) has 9, and Cluster 5 (Violet) include 4 documents. Documents within the same cluster shared a common thematic focus that distinguished them from those in other clusters, facilitating a thematic analysis of the co-citation network (Xu et al., 2018). In Figure 8, the documents in cluster 1 (Red) primarily center on diverse methods, particularly focusing on models associated with ENM. This cluster showcases a wide spectrum of methodologies and approaches employed to tackle the intricate challenge of modelling species distributions in the face of shifting climatic conditions. The articles in the cluster address various dimensions of the modelling process, encompassing aspects like model selection, validation, uncertainty reduction, and the utilization of distinct modelling techniques, including ensemble modelling and genetic algorithms (Anderson and Martnez-Meyer, 2002; Araujo et al., 2005a; Araujo et al., 2005b; Araujo and New, 2007). The documents in Cluster 2 (Blue) focus on reconstructing evolutionary trends and inferring phylogenies. The focus of the documents in Cluster 3 (Green) is the model accuracy and robustness and provides a set of best-practice standards for better species distribution model predictions for use in biodiversity assessments. The documents in Cluster 4 (Yellow) primarily centre at measuring ecological niche overlaps between native and non-native species, particularly the invasive species. The fifth cluster (Violet) primarily consists of documents focusing on Maximum Entrophy (MaxEnt) models.

Figure 8. Co-citation network of documents related to ENM.
It is important to note that while articles within the same cluster share topic similarity, this does not imply agreement in their findings; publications are clustered based on thematic similarities, but their viewpoints can still be contradictory (Rejeb et al., 2022).
Keyword analysis is a valuable tool for identifying broader research trends and directions within a specific field. This method involves the collection of keywords from all relevant publications, enabling the discovery of primary areas of focus and emerging themes in research (Ridwan et al., 2023). In the present study, we examined the original author keywords used in each publications related to ENM. These author-assigned keywords serve as indicators of the main themes within research articles (Goyal and Kumar, 2021). A comprehensive total of 9,417 keywords were documented by authors to categorize their studies from 1992 to 2023. Figure 9 shows the word cloud of the keywords used in publications on ENM. In a word cloud, the size of each keyword reflects its frequency of usage in the scientific documents. The larger the size of the keyword, the more frequently it appears in the publications. For example, the most frequently used keyword based on its size the word cloud is “climate-change” followed by “conservation,” “distributions,” ‘biodiversity,” and “diversity” and so on. The word cloud reveals that “climate change,” “conservation,” “distributions,” “biodiversity,” and “diversity” are the predominant themes and cornerstones of ENM research. This suggests that a significant portion of ENM studies is dedicated to exploring the impact of climate change on ecological niches and species distributions and the prominence of the keyword “conservation” implies that researchers are deeply invested in understanding how ENM can contribute to conservation efforts, possibly by predicting species distributions and informing conservation strategies. Moreover, “Distributions” being a sizable keyword signifies the fundamental aspect of ENM and studying species distributions. “Biodiversity” and “diversity” being substantial keywords highlight the importance of these ecological concepts within the context of ENM. Researchers are likely exploring how ecological niche modelling can contribute to our understanding of biodiversity patterns and the preservation of species diversity.
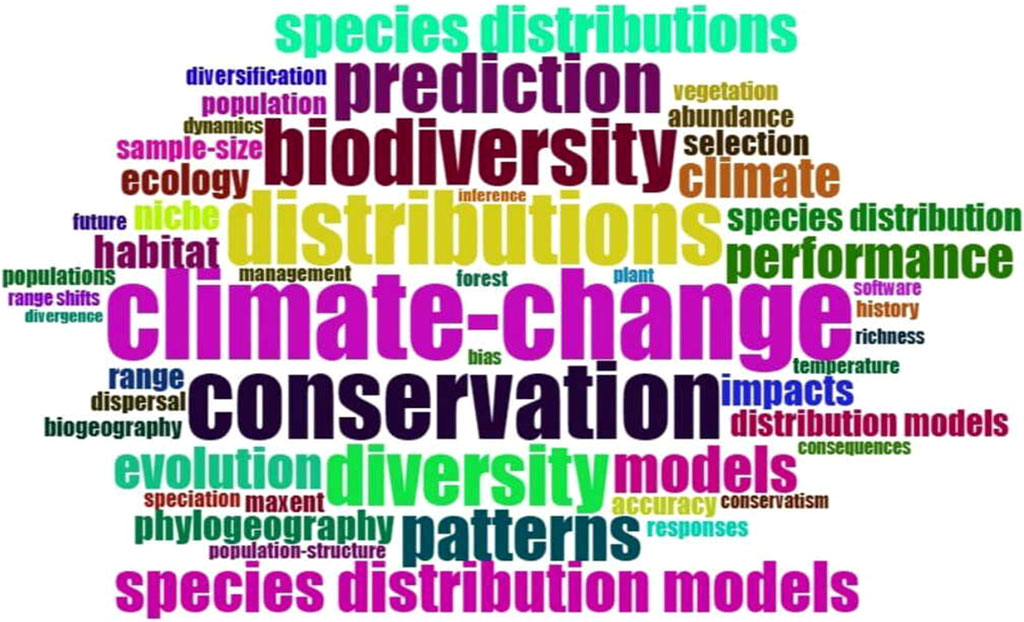
Figure 9. Word cloud of keywords used in ENM studies from 1992–2023.
In the era of climate change, Ecological Niche Modelling (ENM) has become an indispensable tool for studying species distribution patterns and habitat preferences. In the present study, a bibliometric analysis of the published literature in the field of ENM was carried out. Bibliometric studies help in identifying the most trending topics, prolific authors, sources, countries, and institutes within a specific field of study. Our extensive bibliometric analysis spanning from 1992 to 2023 reveals the growing global interest in ENM research. With 3,595 scholarly documents from 564 sources, ENM has gained prominence in addressing ecological questions. Notably, authors like Dr. Peterson AT and Dr. Thuiller W have made substantial contributions, while journals like “Journal of Biogeography” and “Ecography” have played pivotal roles. Among countries, the USA leads in both productivity and citations, fostering international collaboration. “Climate change” emerges as the dominant keyword, highlighting its significance in shaping ENM studies. This analysis aids in understanding the evolving landscape of ENM research, crucial for biodiversity conservation in a changing world.
Methods for estimating distributional areas of species based on correlations between known occurrences and environmental variables have been developed over the past 20 years (Peterson and Soberón, 2012). With hundreds of papers now being published yearly using these methodologies, their use has exploded since the beginning of 21st century (Lobo et al., 2010). Furthermore, abiotic variables like climate, elevation, land use, and soil type have traditionally been the only ones that ENMs have been able to use. These data can be obtained for free from a variety of sources, which has caused a surge in ecological niche modelling studies over the past few decades (Sillero et al., 2021a). However, ENMs have restrictions and conditions to take into account in order to produce better predictions.
a) Study area: One of the fundamental aspects to consider in ENM is defining the study area. The size and extent of the study area significantly influence model predictions and measures of goodness of fit (Sillero et al., 2021a). Utilizing biogeographical regions as the study area can help standardize analyses and facilitate comparisons across studies (Sillero, 2010). Additionally, researchers should avoid areas where the species cannot disperse effectively (Anderson and Martinez-Meyer, 2010) and where frequency distribution curves of critical environmental variables are truncated (Sillero et al., 2021a).
b) Occurrence Data: The quality and quantity of occurrence data directly impact the accuracy of ENM predictions. Common errors in occurrence data include erroneous identifications, missing or incorrect coordinates, positional errors, and duplicated records (Sillero et al., 2021a). To mitigate these issues, thorough data cleaning procedures are necessary. This involves visually inspecting species records on a map, removing duplicated records (Sillero and Carretero, 2013), and eliminating occurrences without coordinates. Furthermore, ensuring that all points fall within the defined study area is essential to prevent biased niche estimates (Sillero et al., 2021a).
c) Absence/Pseudoabsence/Background Data: Choosing appropriate absence, pseudoabsence, or background data is crucial for ENM accuracy. The spatial distribution of these data points profoundly influences model outcomes. Real absences obtained through fieldwork are preferred; however, in their absence, species atlases can be utilized to select pseudoabsences from grid cells without presences. It is essential to acknowledge that different absence choices capture different subsets of the species’ niche, such as realized distribution or potential distribution, depending on the absence selection strategy (Sillero et al., 2021a).
d) Environmental Data: Selecting relevant environmental variables and managing their collinearity is paramount in ENM. While increasing the number of variables can improve model accuracy, collinearity poses challenges. To address this, researchers should limit the number of variables introduced into the model, ensuring that it is less than the number of species records. Additionally, identifying and excluding highly correlated variables, typically with a correlation higher than −0.7 or −0.8, helps prevent overfitting and ensures the biological relevance of selected predictors (Sillero et al., 2021a).
Further, humans are rarely included in models of biological systems, despite being one of the most important elements influencing contemporary biological processes. Thus, ENMs are complex model systems, sensitive to number of presence, absences, pseudo-absences, randomly generated background points, buffer areas, outliers in datasets and environmental variations. The lack of consistency in ensuring that models satisfy all statistical assumptions when applied is currently the most significant recurring problem in correlative ENMs. Future research should concentrate on certain problems that still require improvement. It is necessary to develop new validation techniques that are not based on the confusion matrix, especially for algorithms that do not account for absences. The use of null models in the validation process ought to be made commonplace. Additionally, more research is required to define the differences between modelling approaches because there might not be a “best algorithm” if each algorithm represents a different approximation of a species’ ecological niche. To obtain better species physiological datasets useful for mechanistic models, more standardized methods are required. Additionally, combining correlative and mechanistic models will increase the process-based nature of ENMs, which is crucial for more accurately determining the causal links between the environment and species distributions. The effectiveness of developing species-specific models will rise as continental and global efforts are made to enhance species’ occurrence data, available predictors, and computational platforms.
To ensure that models can effectively and efficiently inform conservation and management decisions across both jurisdictional boundaries and a range of legal and social contexts, it is still necessary to address SDMs’ high sensitivity to data inputs and methodological choices. ENMs lack expert intuition, especially when methodological choices are not grounded in pertinent natural history knowledge; variation in the quality of input data and model-development choices can result in significant differences in the predicted distributions; careful model output interpretation is required when differentiating correlative representations of potential versus actual distributions. The entire procedure used to create an ENM must be reliable, transparent, and repeatable in order for it to be used effectively in decision-making (Morisette et al., 2017). Making decisions regarding the input data, the modelling procedures, and the representation of model outputs are just a few of the many choices that must be made when estimating and interpreting species distribution models (Sofaer et al., 2019). Modelled responses to environmental variables, mapped model predictions, and performance evaluations (including a list of strengths and weaknesses) should all be carefully examined and not taken as gospel. For model results to be useful in making critical decisions, support for the interpretation of model outputs should be available to those without technical expertise in species distribution modelling.
The original contributions presented in the study are included in the article/Supplementary Material, further inquiries can be directed to the corresponding authors.
BJ: Conceptualization, Data curation, Formal Analysis, Investigation, Methodology, Software, Writing–original draft. QR: Writing–review and editing. DH: Project administration, Resources, Supervision, Validation, Writing–review and editing. ZW: Writing–review and editing. SS: Funding acquisition, Writing–review and editing. MY: Writing–review and editing. GO: Writing–review and editing.
The author(s) declare financial support was received for the research, authorship, and/or publication of this article. The authors extend their appreciation to the Deanship of Research and Graduate Studies at King Khalid University for funding this work through Large Research Project under grant number (RGP2/49/45).
The authors declare that the research was conducted in the absence of any commercial or financial relationships that could be construed as a potential conflict of interest.
All claims expressed in this article are solely those of the authors and do not necessarily represent those of their affiliated organizations, or those of the publisher, the editors and the reviewers. Any product that may be evaluated in this article, or claim that may be made by its manufacturer, is not guaranteed or endorsed by the publisher.
The Supplementary Material for this article can be found online at: https://www.frontiersin.org/articles/10.3389/fenvs.2024.1376213/full#supplementary-material
Aleixandre-Benavent, R., Aleixandre-Tudó, J. L., Castelló-Cogollos, L., and Aleixandre, J. L. (2018). Trends in global research in deforestation. A bibliometric analysis. Land use policy 72, 293–302. doi:10.1016/j.landusepol.2017.12.060
Anderson, R. P., and Martınez-Meyer, E. (2004). Modeling species’ geographic distributions for preliminary conservation assessments: an implementation with the spiny pocket mice (Heteromys) of Ecuador. Biol. Conserv. 116 (2), 167–179. doi:10.1016/s0006-3207(03)00187-3
Araújo, M. B., and New, M. (2007). Ensemble forecasting of species distributions. Trends Ecol. Evol. 22 (1), 42–47. doi:10.1016/j.tree.2006.09.010
Araujo, M. B., Pearson, R. G., Thuiller, W., and Erhard, M. (2005a). Validation of species–climate impact models under climate change. Glob. change Biol. 11 (9), 1504–1513. doi:10.1111/j.1365-2486.2005.01000.x
Araújo, M. B., Whittaker, R. J., Ladle, R. J., and Erhard, M. (2005b). Reducing uncertainty in projections of extinction risk from climate change. Glob. Ecol. Biogeogr. 14 (6), 529–538. doi:10.1111/j.1466-822x.2005.00182.x
Aria, M., and Cuccurullo, C. (2017). bibliometrix: an R-tool for comprehensive science mapping analysis. J. Inf. 11 (4), 959–975. doi:10.1016/j.joi.2017.08.007
Bobrowski, M., Weidinger, J., Schwab, N., and Schickhoff, U. (2021). Searching for ecology in species distribution models in the Himalayas. Ecol. Model. 458, 109693. doi:10.1016/j.ecolmodel.2021.109693
Borgohain, D. J., Verma, M. K., Nazim, M., and Sarkar, M. (2021). Application of Bradford’s law of scattering and Leimkuhler model to information science literature. Manage 15, 197–212. doi:10.1080/09737766.2021.1943041
Bornmann, L., and Daniel, H. D. (2007). What do we know about the h index? J. Am. Soc. Inf. Sci. Technol. 58 (9), 1381–1385. doi:10.1002/asi.20609
Durieux, V., and Gevenois, P. A. (2010). Bibliometric indicators: quality measurements of scientific publication. Radiology 255 (2), 342–351.
Egghe, L. (2006). Theory and practise of the g-index. Scientometrics 69 (1), 131–152. doi:10.1007/s11192-006-0144-7
Franklin, J. (2023). Species distribution modelling supports the study of past, present and future biogeographies. Journal of Biogeography.
Gilani, H., Goheer, M. A., Ahmad, H., and Hussain, K. (2020). Under predicted climate change: distribution and ecological niche modelling of six native tree species in Gilgit-Baltistan, Pakistan. Ecol. Indic. 111, 106049. doi:10.1016/j.ecolind.2019.106049
Goyal, K., and Kumar, S. (2021). Financial literacy: a systematic review and bibliometric analysis. Int. J. Consumer Stud. 45 (1), 80–105. doi:10.1111/ijcs.12605
Grinnell, J. (1917). The niche-relationships of the California thrasher. Auk 34, 427–433. doi:10.2307/4072271
Guan, Y., Kang, R., and Liu, J. (2019). Evolution of the field of ecological restoration over the last three decades: a bibliometric analysis. Restor. Ecol. 27 (3), 647–660. doi:10.1111/rec.12899
Guisan, A., Tingley, R., Baumgartner, J. B., Naujokaitis-Lewis, I., Sutcliffe, P. R., Tulloch, A. I. T., et al. (2013). Predicting species distributions for conservation decisions. Ecol. Lett. 16 (12), 1424–1435. doi:10.1111/ele.12189
Guisan, A., and Zimmermann, N. E. (2000). Predictive habitat distribution models in ecology. Ecol. Model. 135 (2-3), 147–186. doi:10.1016/s0304-3800(00)00354-9
Gundolf, K., and Filser, M. (2013). Management research and religion: a citation analysis. J. Bus. Ethics 112, 177–185. doi:10.1007/s10551-012-1240-7
Hamid, M., Khuroo, A. A., Charles, B., Ahmad, R., Singh, C. P., and Aravind, N. A. (2019). Impact of climate change on the distribution range and niche dynamics of Himalayan birch, a typical treeline species in Himalayas. Biodivers. Conservation 28, 2345–2370. doi:10.1007/s10531-018-1641-8
Hirsch, J. E. (2005). An index to quantify an individual’s scientific research output. Proc. Natl. Acad. Sci. U. S. A. 102 (46), 16569–16572. doi:10.1073/pnas.0507655102
Huy, L. D., Truong, N. L., Hoang, N. Y., Nguyen, N. T. H., Nguyen, T. T., Dang, L. T., et al. (2022). Insight into global research on health literacy and heart diseases: a bibliometric analysis. Front. Cardiovasc. Med. 9, 1012531. doi:10.3389/fcvm.2022.1012531
Jetz, W., McPherson, J. M., and Guralnick, R. P. (2012). Integrating biodiversity distribution knowledge: toward a global map of life. Trends Ecol. Evol. 27 (3), 151–159. doi:10.1016/j.tree.2011.09.007
Jimenez-Valverde, A., Peterson, A. T., Soberon, J., Overton, J. M., Aragón, P., and Lobo, J. M. (2011). Use of niche models in invasive species risk assessments. Biol. Invasions 13 (12), 2785–2797. doi:10.1007/s10530-011-9963-4
Karger, D. N., Conrad, O., Böhner, J., Kawohl, T., Kreft, H., Soria-Auza, R. W., et al. (2017). Climatologies at high resolution for the earth’s land surface areas. Sci. data 4 (1), 170122–170220. doi:10.1038/sdata.2017.122
Kolanowska, M., and Jakubska-Busse, A. (2020). Is the lady’s-slipper orchid (Cypripedium calceolus) likely to shortly become extinct in Europe? insights based on ecological niche modelling. PLoS One, 15, e0228420.
Leitão, P. J., and Santos, M. J. (2019). Improving models of species ecological niches: a remote sensing overview. Front. Ecol. Evol. 7, 9. doi:10.3389/fevo.2019.00009
Liu, C., Berry, P. M., Dawson, T. P., and Pearson, R. G. (2005). Selecting thresholds of occurrence in the prediction of species distributions. Ecography 28 (3), 385–393. doi:10.1111/j.0906-7590.2005.03957.x
Liu, Y., Wu, K., and Zhao, R. (2020). Bibliometric analysis of research on soil health from 1999 to 2018. J. soils sediments 20, 1513–1525. doi:10.1007/s11368-019-02519-9
Lobo, J. M., Jiménez-Valverde, A., and Hortal, J. (2010). The uncertain nature of absences and their importance in species distribution modelling. Ecography 33, 103–114. doi:10.1111/j.1600-0587.2009.06039.x
López-Montero, R., García-Navarro, C., Delgado-Baena, A., Vela-Jiménez, R., and Sianes, A. (2022). Life stories: unraveling the academic configuration of a multifaceted and multidisciplinary field of knowledge. Front. Psychol. 13, 960666. doi:10.3389/fpsyg.2022.960666
Lotka, A. J. (1926). The frequency distribution of scientific productivity. J. Wash. Acad. Sci. 16 (12), 317–323.
Malapane, O. L., Musakwa, W., Chanza, N., and Radinger-Peer, V. (2022). Bibliometric analysis and systematic review of indigenous knowledge from a comparative african perspective: 1990–2020. Land 11 (8), 1167. doi:10.3390/land11081167
Melo-Merino, S. M., Reyes-Bonilla, H., and Lira-Noriega, A. (2020). Ecological niche models and species distribution models in marine environments: a literature review and spatial analysis of evidence. Ecol. Model. 415, 108837. doi:10.1016/j.ecolmodel.2019.108837
Morisette, J. T., Cravens, A. E., Miller, B. W., Talbert, M., Talbert, C., Jarnevich, C., et al. (2017). Crossing boundaries in a collaborative modelling workspace. Soc. Nat. Resour., 1–10.
Paphawasit, B., and Wudhikarn, R. (2022). Investigating patterns of research collaboration and citations in science and technology: A case of Chiang Mai University. Administrative Sciences 12 (2), 71.
Pearson, R. G., Raxworthy, C. J., Nakamura, M., and Townsend Peterson, A. (2007). ORIGINAL ARTICLE: predicting species distributions from small numbers of occurrence records: a test case using cryptic geckos in Madagascar. J. Biogeogr. 34 (1), 102–117. doi:10.1111/j.1365-2699.2006.01594.x
Peterson, A. T., Papes¸, M., and Soberon, ´ J. (2015). Mechanistic and correlative models of ecological niches. Eur. J. Ecol. 1, 28–38. doi:10.1515/eje-2015-0014
Peterson, A. T., and Soberón, J. (2012). Species distribution modeling and ecological niche modeling: getting the concepts right. Natureza Conservação 10 (2), 102–107. doi:10.4322/natcon.2012.019
Prasad, N., Semwal, M., and Roy, P. S. (2015). Remote sensing and GIS for biodiversity conservation. Recent Advances in Lichenology: Modern Methods and Approaches in Biomonitoring and Bioprospection, Vol. 1, 151–179.
Pournader, M., Shi, Y., Seuring, S., and Koh, S. L. (2020). Blockchain applications in supply chains, transport and logistics: a systematic review of the literature. Int. J. Prod. Res. 58 (7), 2063–2081. doi:10.1080/00207543.2019.1650976
Qiu, H., and Chen, Y. F. (2009). Bibliometric analysis of biological invasions research during the period of 1991 to 2007. Scientometrics 81 (3), 601–610. doi:10.1007/s11192-008-2207-4
Regos, A., Gonçalves, J., Arenas-Castro, S., Alcaraz-Segura, D., Guisan, A., and Honrado, J. P. (2022). Mainstreaming remotely sensed ecosystem functioning in ecological niche models. Remote Sens. Ecol. Conservation 8 (4), 431–447. doi:10.1002/rse2.255
Rejeb, A., Rejeb, K., Abdollahi, A., Keogh, J. G., Zailani, S., and Iranmanesh, M. (2022). Smart city research: a bibliometric and main path analysis. JDIM 4 (3), 343–370.
Ridwan, Q., Wani, Z. A., Anjum, N., Bhat, J. A., Hanief, M., and Pant, S. (2023). Human-wildlife conflict: a bibliometric analysis during 1991–2023. Reg. Sustain. 4 (3), 309–321. doi:10.1016/j.regsus.2023.08.008
Sillero, N. (2010). Modelling suitable areas for Hyla meridionalis under current and future hypothetical expansion scenarios. Amphibia-reptilia 31 (1), 37–50. doi:10.1163/156853810790457948
Sillero, N., Arenas-Castro, S., Enriquez-Urzelai, U., Vale, C. G., Sousa-Guedes, D., Martínez-Freiría, F., et al. (2021a). Want to model a species niche? A step-by-step guideline on correlative ecological niche modelling. Ecol. Model. 456, 109671. doi:10.1016/j.ecolmodel.2021.109671
Sillero, N., and Carretero, M. A. (2013). Modelling the past and future distribution of contracting species. The Iberian lizard Podarcis carbonelli (Squamata: lacertidae) as a case study. Zoologischer Anzeiger-A J. Comp. Zoology 252 (3), 289–298. doi:10.1016/j.jcz.2012.08.004
Sofaer, H. R., Jarnevich, C. S., Pearse, I. S., Smyth, R. L., Auer, S., Cook, G. L., et al. (2019). Development and delivery of species distribution models to inform decision-making. BioScience 69 (7), 544–557. doi:10.1093/biosci/biz045
Van Eck, N., and Waltman, L. (2010). Software survey: VOSviewer, a computer program for bibliometric mapping. scientometrics 84 (2), 523–538. doi:10.1007/s11192-009-0146-3
Wani, Z. A., Ridwan, Q., Khan, S., Pant, S., Siddiqui, S., Moustafa, M., et al. (2022). Changing climatic scenarios anticipate dwindling of suitable habitats for endemic species of himalaya—predictions of ensemble modelling using aconitum heterophyllum as a model plant. Sustainability 14 (14), 8491. doi:10.3390/su14148491
Wani, Z. A., Satish, K. V., Islam, T., Dhyani, S., and Pant, S. (2023). Habitat suitability modelling of Buxus wallichiana Bail.: an endemic tree species of Himalaya. Vegetos 36 (2), 583–590. doi:10.1007/s42535-022-00428-w
Xiao, Z., Hu, S., Xu, W., Wang, S., Mo, W., Deng, H., et al. (2022). A bibliometric analysis of NLRP3 inflammasome in acute lung injury/acute respiratory distress syndrome from 2010 to 2021. Front. Immunol. 13, 1053658. doi:10.3389/fimmu.2022.1053658
Xu, J., Xiao, P., Li, T., and Wang, Z. (2022). Research Progress on endangered plants: a bibliometric analysis. Biodivers. Conservation 31 (4), 1125–1147. doi:10.1007/s10531-022-02392-y
Xu, X., Chen, X., Jia, F., Brown, S., Gong, Y., and Xu, Y. (2018). Supply chain finance: a systematic literature review and bibliometric analysis. Int. J. Prod. Econ. 204, 160–173. doi:10.1016/j.ijpe.2018.08.003
Zaki, H., Fernandez, D., Dastane, O., Aman, A., and Sanusi, S. (2023). Virtual reality in digital marketing: research agenda based on bibliometric reflection. MIP 41 (4), 505–524.
Keywords: species distribution, climate change, ecological niche, conservation, decision-making
Citation: Javeed B, Ridwan Q, Huang D, Wani ZA, Siddiqui S, Yassin HM and Othman GAM (2024) Ecological niche modelling: a global assessment based on bibliometric analysis. Front. Environ. Sci. 12:1376213. doi: 10.3389/fenvs.2024.1376213
Received: 25 January 2024; Accepted: 07 June 2024;
Published: 26 July 2024.
Edited by:
Martin Siegert, University of Exeter, United KingdomReviewed by:
Gyan Prakash Sharma, University of Delhi, IndiaCopyright © 2024 Javeed, Ridwan, Huang, Wani, Siddiqui, Yassin and Othman. This is an open-access article distributed under the terms of the Creative Commons Attribution License (CC BY). The use, distribution or reproduction in other forums is permitted, provided the original author(s) and the copyright owner(s) are credited and that the original publication in this journal is cited, in accordance with accepted academic practice. No use, distribution or reproduction is permitted which does not comply with these terms.
*Correspondence: Delin Huang, ZGxodWFuZzEwMzBAMTYzLmNvbQ==; Zishan Ahmad Wani, emlzaGFud2FuaTc4NkBnbWFpbC5jb20=
Disclaimer: All claims expressed in this article are solely those of the authors and do not necessarily represent those of their affiliated organizations, or those of the publisher, the editors and the reviewers. Any product that may be evaluated in this article or claim that may be made by its manufacturer is not guaranteed or endorsed by the publisher.
Research integrity at Frontiers
Learn more about the work of our research integrity team to safeguard the quality of each article we publish.