 Xing Gao1,2,3†
 Meiran Zhao
 Zhongyuan Guo
94% of researchers rate our articles as excellent or good
Learn more about the work of our research integrity team to safeguard the quality of each article we publish.
Find out more
ORIGINAL RESEARCH article
Front. Environ. Sci., 13 March 2024
Sec. Land Use Dynamics
Volume 12 - 2024 | https://doi.org/10.3389/fenvs.2024.1374383
This article is part of the Research TopicDynamics of Land Use and Carbon Emissions in the Context of Carbon Neutrality and Carbon PeakingView all 14 articles
Carbon pooling and release occur all the time in all corners of the earth, where the land use factor is key to influencing the realization of carbon peaking and neutrality. Land use patterns and carbon emissions change under different scenarios and analyzing the correlation will help formulate scientific land use policies for the future. In this study, through remote sensing data, we investigated the changes in land use patterns and carbon emissions in the Baiyangdian basin in China from 2000 to 2020 and analyzed the carbon conduction effect with the help of a land transfer matrix. The geographical simulation and optimization system-future land use simulation (GeoSOS-FLUS) and Markov models were used to predict the land use changes and carbon emissions under the four different scenarios for the region in 2035. The results indicated that 1) the net land use carbon emissions increased from 52,163.03 × 103 to 260,754.91.28 × 103 t from 2000 to 2020, and the carbon source-sink ratio exhibited a general uptrend; 2) the net carbon emissions due to terrestrial transfers increased over time. The carbon conduction effects due to the transfer of forests, grasslands, water areas, and unused lands to built-up lands also showed a rising trend, albeit the latter two exhibited only small changes; 3) in 2035, the net carbon uptake under the four development scenarios was predicted to be 404,238.04 × 103, 402,009.45 × 103, 404,231.64 × 103, and 404,202.87×103 t, respectively, with all values much higher than that of the study area in 2020. The maximum carbon sink capacity was 817.88 × 10³ t under the double-carbon target scenario, and the maximum carbon source emission was 405,033.61 × 103 t under the natural development scenario. The above results provide an essential reference for low carbon-based urban land use regulations for the Baiyangdian basin and other similar projects in the future.
Global climate change poses a significant threat to sustainable development and the survival of humans (Rong et al., 2022). The terrestrial carbon system is an important component of the global carbon cycle, which plays a critical role in mitigating global warming by effectively regulating the regional climate through the absorption and release of greenhouse gases from the atmosphere (Yu et al., 2022). Land use activities primarily affect the carbon cycle of the ecosystem (Mendelsohn and Sohngen, 2019), with their carbon emissions being second only to the burning of fossil fuels (Wang Z. et al., 2022). Thus, regulating land use activities to reduce carbon emissions is an important means of promoting carbon neutrality from a practical perspective (Carpio et al., 2021). Therefore, several studies have aimed to demonstrate how carbon emissions from land use can help achieve a range of low carbon development goals, particularly carbon peak and neutrality (Yang and Liu, 2022).
Most studies on land use carbon emissions focus on accounting, mechanisms and consequences, projections, and impact factors (Le Quéré et al., 2012; Houghton and Nassikas, 2017; Yu et al., 2022). The accounting of land use carbon emissions mainly involves assessing the emissions by using bookkeeping, the Intergovernmental Panel on Climate Change (IPCC) inventory, the Carnegie-Ames-Stanford approach (CASA) model, the global production efficiency model (GLO-PEM), and the integrated valuation of ecosystem services and tradeoffs (InVEST) model (Piao et al., 2022; Raihan et al., 2022; Walker et al., 2022). Houghton and Nassikas (2017) used a bookkeeping model and estimated the average global net carbon fluxes induced by land use and coverage change (LUCC) from 2006 to 2015 to be 1.11 ± 0.35 Pg C yr–1; Ghosh et al. (2022) proposed a method to establish a low-carbon city by extensively analyzing land use carbon emissions and sequestration potential using the InVEST model. Regarding the land use carbon emission effects, it primarily investigates the impact of vegetation and soil carbon storage, as well as the dynamic evolution characteristics (Wang et al., 2020; Wolswijk et al., 2022). Affuso and Hite (2013) showed that participatory decision-making on land use can triple the net energy value of biofuels and reduce carbon emissions by 20%; Ghorbani et al. (2023) showed that soil carbon storage and atmospheric carbon dioxide (CO2) emissions were directly affected by the changes in the soil characteristics and land use; rising pastures and forests increased the soil organic carbon and microbial biomass carbon in both topsoil and subsoil. For the prediction of land use carbon emissions, Cellular Automata-Markov (CA-Markov), Conversion of Land Use and its Effects at Small regional extent (CLUE-S), Future Land Use Simulation (FLUS), and Patch-generating Land Use Simulation (PLUS) models were used to predict the land use spatial layout for carbon emission analysis (Wang H. et al., 2022; Wu et al., 2022). Liu et al. (2018) used a system dynamics approach to establish a multi-perspective integrated measurement model to quantitatively predict new towns on a sector-by-sector basis. They showed that cities need to rely on regional green spaces to mitigate carbon emissions; Yao et al. (2023) proposed a bottom-up cadastral land scale carbon emission prediction framework based on vector cellular automata. Although the aforementioned works serve as excellent examples for the study of land use carbon emissions, only a few studies have focused on carbon emission conduction due to the change in land type (Li et al., 2023). Investigating the effects of land type changes on carbon emissions under various scenarios can provide new perspectives to formulate appropriate land regulation and carbon emission reduction policies (Ke Y. et al., 2022). However, most of the existing research is based on past land use data, and there remains a lack of studies predicting changes in future land use patterns under multiple scenarios and the resultant carbon emissions (Chuai et al., 2019).
Therefore, the objectives of this study were 1) Based on the land use data, combined with the carbon emission estimation model, obtain the carbon emission characteristics of the Baiyangdian basin from 2000 to 2020. 2) Use the land transfer matrix to analyze the carbon transfer effect caused by land use transfer in each period 3) Predict the land use pattern under four different development scenarios in 2035, as well as the resulting carbon emissions, to provide a reference for the city to assess the pressure of carbon emission reduction (Harper et al., 2018).
The rest of the paper is as follows: Section 2 presents an overview of the study area and data sources, Section 3 describes the empirical methodology, Section 4 is the results and analyses section, and Section 5 provides the discussion and conclusions.
The Xiong’an New Area, China, as a hub to relieve Beijing of non-capital functions, is critical to accelerating the synergistic development of the Beijing-Tianjin-Hebei region, with its land use changes being typical of the current era (Zhou et al., 2021). The Baiyangdian basin, as the ecological hinterland of the Xiong’an New Area, is a prime example of healthy synergies between the carbon system and the development of the city (Li et al., 2008; Zhao et al., 2021; Xia et al., 2023). The study area is situated in the northern part of the North China Plain, between 113°45′–116°26′ eastern longitudes and 37°51′–40°39′ northern latitudes (Figure 1), which belongs to a warm-temperate monsoon climate. The Baiyangdian basin in this study refers to the administrative area of Hebei Province flowing through nine branches such as the Zuma Long River, the Cao River, and the Zhao Wang Xin River, involving 35 counties (cities and districts) under the jurisdiction of Baoding City, Zhangjiakou City, Shijiazhuang City and Cangzhou City, with a total land area of 34,353.07 km2. The basin exhibits an intricate geography, with highlands in the west (mountains) and lowlands in the east (plains). The mountainous area mainly comprises forests and grasslands (17.79% and 19.69% of the total basin area, respectively), and the plains are primarily cultivable land (46.25% of the total basin area).
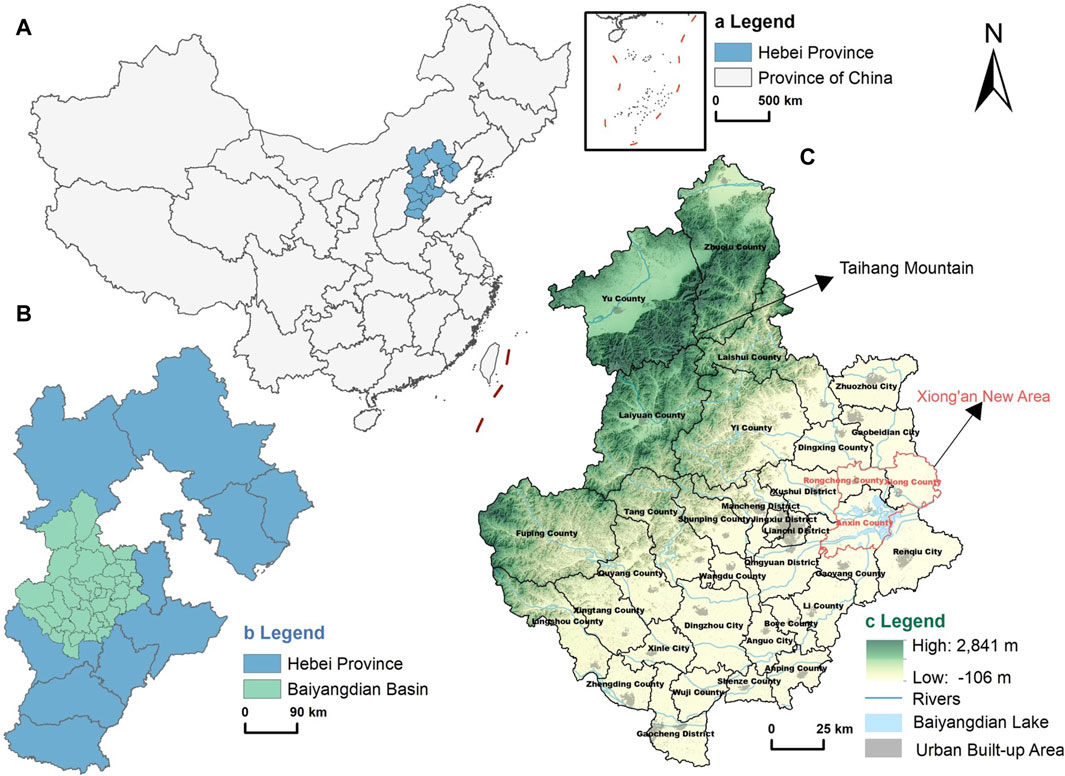
FIGURE 1. Spatial location of the study area. (A) China scope; (B) Hebei Province; (C) Baiyangdian Basin.
In this study, we employed remote sensing image data, Digital Elevation Model (DEM) data, slope data, meteorological data, and fossil energy data as follows:
(1) The Landsat4-5/Thematic Mapper (TM) and Landsat8/Operational Land Imager (OLI) remote sensing images used in this study were obtained from the Chinese Academy of Sciences Geospatial Data Cloud (https://www.gscloud.cn/). The data identifiers and dates of the selected images are LT51230332000145BJC00 2000-05-24, LT51230322010156IKR00 2010-06-05, and LC81230332020120LGN00 2020-4-29, respectively. Concerning previous classification standards and combined with research needs, the land was divided into cultivable land, forest, grassland, built-up land, unused land, and water area, with a 30-m spatial resolution.
(2) The DEM data were obtained from the Chinese Academy of Sciences Geospatial Data Cloud (https://www.gscloud.cn/), and further, the slope data was extracted from the DEM data, with an initial resolution of 30 m.
(3) Annual average precipitation and average temperature for the basin study area were collected from the China Meteorological Data Network (https://data.cma.cn/), the spatial resolution is 0.5° × 0.5°.
(4) Data on the consumption of the eight main fossil energy sources used to indirectly estimate carbon emissions from built-up land were obtained from the statistical yearbooks of counties and cities and the National Bureau of Statistics (http://www.stats.gov.cn/) for the years 2000–2020. The corresponding energy carbon emission coefficients were the missing values recommended by the Intergovernmental Panel on Climate Change (IPCC).
Carbon sinks include grasslands, forests, unused lands, and water areas (Guo and Fang, 2021). Cultivable land can act as both a carbon source and sink due to its different functions (Ma and Wang, 2015). Therefore, this paper accurately measured the carbon emission values for these five land use types by the direct estimation method. Equation 1 is calculated as follows:
where i = 1, 2, 3, 4, and 5 represent cultivatable land, forest, grassland, water area, and unused land, respectively (Yue et al., 2020);
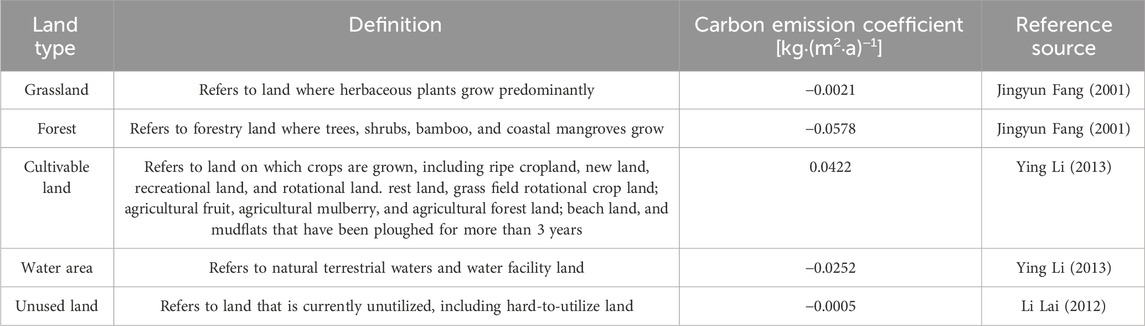
TABLE 1. Land use carbon emission coefficients.
Carbon emissions from built-up land occur mainly from human activities and the energy production and industrial processes they host (Zhang et al., 2021). This paper indirectly estimated the carbon emissions of the eight main fossil fuel sources through their consumption. Equation 2 is calculated as follows:
where
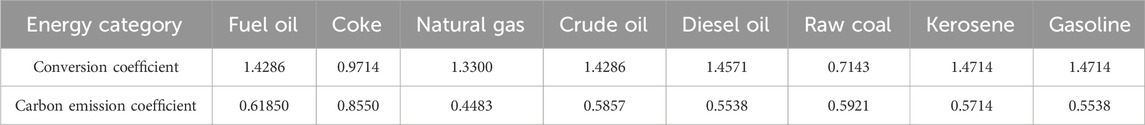
TABLE 2. Standard coal conversion and carbon emission coefficients for the energy sources.
According to the principle of indicator system construction, this paper selects five indicators, including population, carbon emission intensity, gross domestic product (GDP), historical carbon emissions, and the proportion of the tertiary industry, to construct the Baiyangdian Basin Carbon Emission Indicator System from the perspective of fairness, efficiency, and feasibility (Table 3). The entropy value technique was initially applied to calculate the weights of individual indicators. Subsequently, this method was supplemented by a total carbon emission measurement model to ultimately quantify the indirect carbon emissions originating from the different land types in the study region (Tang et al., 2022).
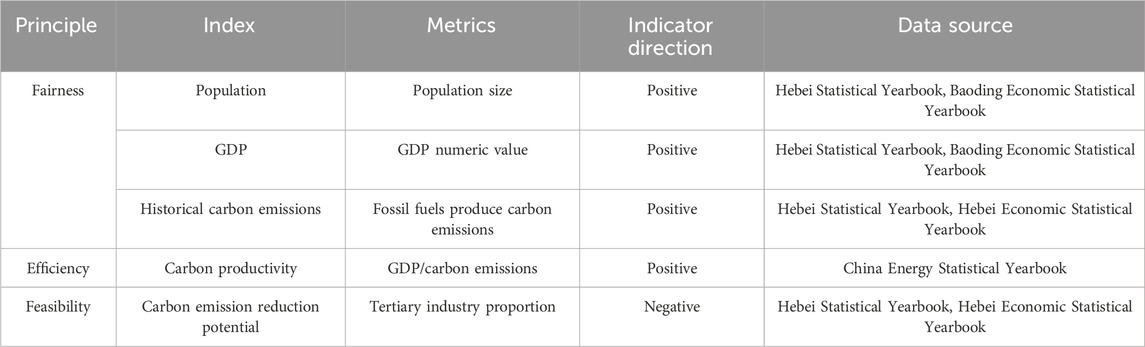
TABLE 3. Indicator system for the allocation of carbon emissions.
Land use changes can cause carbon transfer, which is defined as the carbon conduction effect of land use carbon emissions. Two factors, the difference between the level of carbon sequestration and carbon emissions following a change in land class and the area of change, mainly determine the amount of carbon emissions they transmit (Qiao et al., 2016). The area of land class conversion can be calculated from a land use transfer matrix indicating the amount of change and the direction of transfer, and its Eq. 3 is:
where N is the number of land use types; and
This paper considers the built-up land within the Baiyangdian basin to be spatially homogeneous, neglecting the carbon emission differences that may arise in distinct spatial scenarios per unit area. Therefore, during the study period T1∼T2, the carbon emissions transferred from built-up land to the other types of land can be calculated by Eq. 5:
In contrast, Eq. 6 is used to calculate the transfer of carbon emissions from other land types to built-up land:
Where
In this study, the GeoSOS-FLUS model was used to simulate future land use change in the Baiyangdian basin. The model has two main components, scenario setting and model building (Sun et al., 2021). As a resource on which human activity depends, changes in land use and spatial distribution characteristics essentially depend on a tradeoff between economic development and ecological protection. Therefore, based on previous studies and specific planning policies of each city in the Baiyangdian basin, we established four development scenarios, namely, natural development, balanced development, cultivable land protection, and double-carbon target, and analyzed their effects (Tao et al., 2015; Hong et al., 2021; Wang Z. et al., 2022). The different scenario settings and corresponding scenario descriptions are shown in Table 4.
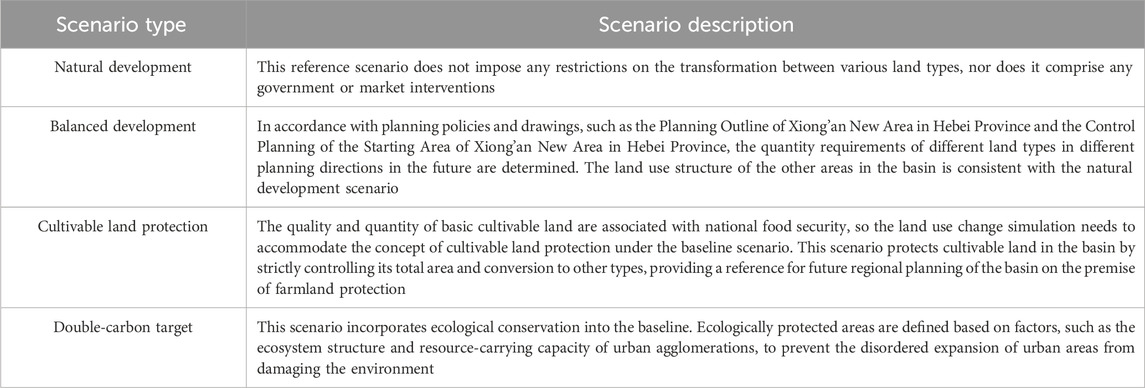
TABLE 4. Land use change rules for different scenarios.
The GeoSOS-FLUS model includes the following two framework contents:
(1) The study identified six key factors, namely, elevation, slope, temperature, precipitation, distance to the road, and distance to the railway, responsible for driving land use changes in the Baiyangdian basin. To evaluate the probability of each land use type suitability, we employed an artificial neural network (ANN) algorithm (Wang et al., 2019). To verify the accuracy of the calculations, we simulated a land use distribution map for 2020 using the land use types of the study region in 2010 and matched the findings with the land use distribution map for the same year. The Kappa coefficient is 0.7464 and has an overall accuracy of 84.20%, demonstrating good simulation results.
(2) The model sampled the first-stage land use distribution data and proposed an adaptive inertia competitive roulette mechanism to simulate the land use scenario distribution. A degree of uncertainty and complexity in land use conversion remained, influenced by a variety of factors. Due to the application of the sampling method and competitive mechanism, the proposed model could effectively avoid error transmission, along with the adverse effects of uncertainty and complexity. In other words, the GeoSOS-FLUS model exhibited good accuracy and enabled the simulation predictions to be consistent with the actual data.
The Markov process can predict the possible state of an event at any particular instance in the future according to the current state of the event by following the “no aftereffect” principle (Yang et al., 2020). In this study, the transfer probability matrix was solved by a Markov process according to the change relation of time series to make an energy knot prediction. The Markov model was employed to predict future land use patterns in the Baiyangdian basin energy structure based on historical energy data from 2000 to 2020. Let us assume that at time m, the state vector of the energy consumption structure in the basin can be expressed as Eq. 7:
where Sr(m), Sc(m), So(m), Sg(m), Sk(m), Sd(m), Sf(m), and Sn(m) are the proportions of raw coal, coke, crude oil, gasoline, kerosene, diesel, fuel oil, and natural gas in energy consumption, respectively. The transition matrix at time m∼m+1 can be expressed as Eq. 8:
where
where
Based on the calculations, Table 5 shows land use carbon emissions in the Baiyangdian basin for the years 2000, 2010, and 2020. The net land use carbon emissions in the basin were found to steadily increase over the past two decades, with a total amount of 208,591.88 × 103 t and an average annual increase of 10,429.59 × 103 t. Grasslands, forests, water areas, and unused lands acted as carbon sinks, increasing the total carbon absorption by 9.59 × 10³ t. The combined carbon emissions from cultivable and built-up lands as carbon sources increased by 208,601.48 × 103 t. The carbon source emission to sink absorption ratio in the basin increased, especially reaching the highest value of 330.21 in 2020, 4.9 times higher than in 2000. This indicated that the carbon sources in the basin were continuously rising, and the carbon sink was continuously declining.
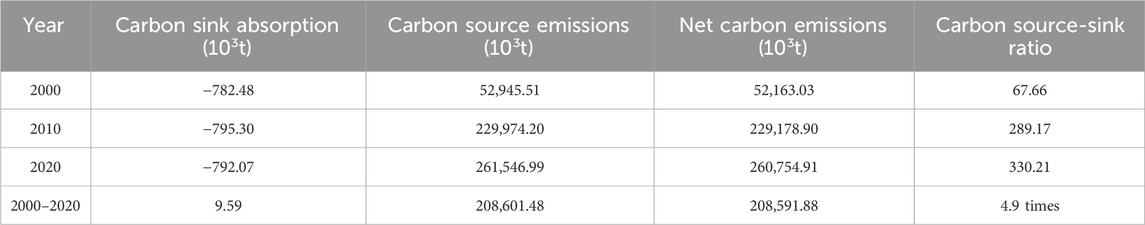
TABLE 5. Changes in carbon source emissions, sink absorption, and its ratio in the Baiyangdian basin.
Specifically, carbon emissions from built-up lands were on an upward trend, along with carbon sequestration in forests and water areas were on an upward trend, other land types steadily declined as carbon sources or sinks (Figure 2). In the case of building sites, from 2000 to 2010, rapid urbanization, enhanced land intensification, and a mass of cultivable lands, forests, and grasslands were transformed into built-up lands, resulting in an expansion trend of built-up land, which is manifested in the fact that the rate of transferring in is 18.5 times higher than the rate of transferring out. The land use dynamic attitude (k) reached 0.0087, with the land area expanding by 268.36 km2. This increase accounted for 94.52% of carbon emissions in 2000, rising to 98.72% in 2020, representing the largest contribution to carbon emissions (Figure 2). Due to the minimal net conversion of land from other categories to built-up land within their respective land usage dynamics between 2000 and 2010, the proportion of carbon emissions attributed to built-up land was the lowest during the entire research period, in 2020 (Table 6). The area of cultivated land has been decreasing from 2000 to 2010, with 637.45 km2 of cultivated land being transferred out at a rate 12.67 times faster than the rate of transfer in, making it the land category with the largest reduction in area share of any land category.
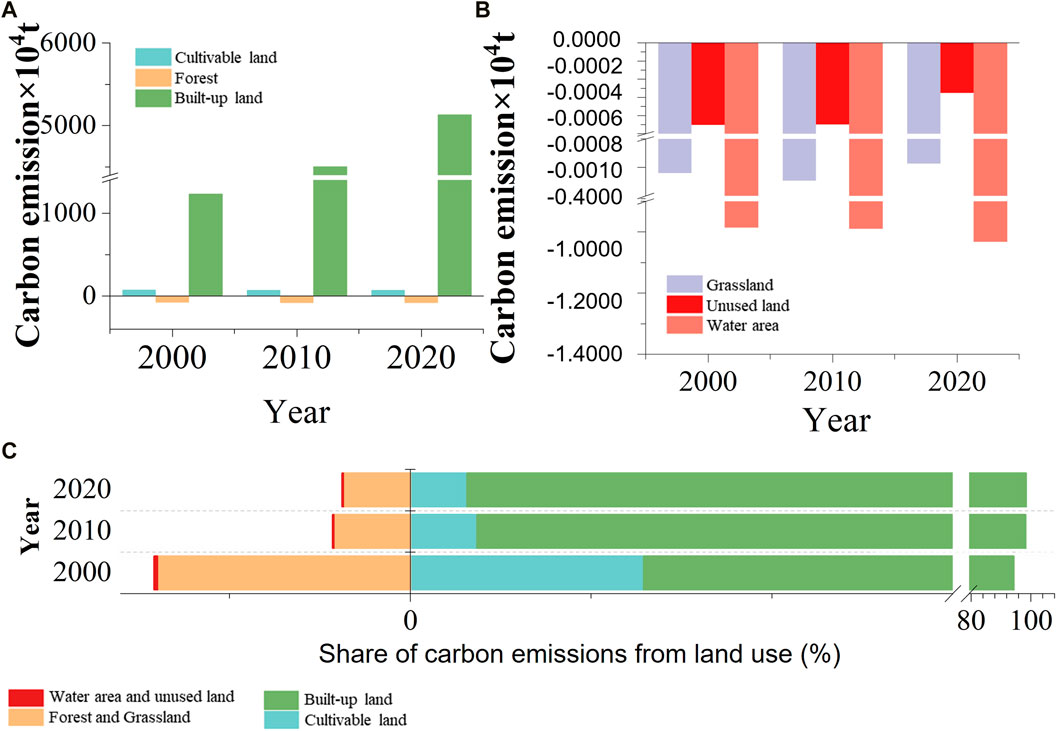
FIGURE 2. Change and proportion of carbon emissions from land use. (A,B) Land use carbon emissions; (C) Proportion of carbon emissions.
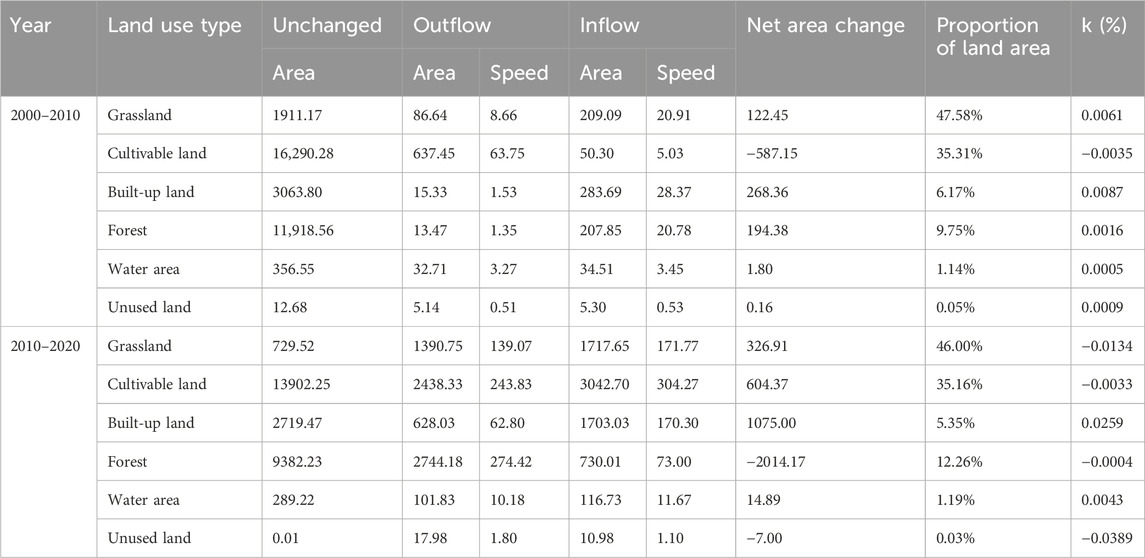
TABLE 6. Land use changes in the Baiyangdian basin from 2000 to 2020.
Among the carbon sinks, grassland and unused land demonstrated a marginal reduction in carbon sequestration, with the corresponding proportion decreasing from 0.54% in 2000 to 0.49% in 2020 (Figure 2B). The fluctuating trends in the carbon uptake ratios of grasslands and unused lands could be attributed to their continued transfer to built-up and cultivable lands. In 2000–2010, 86.64 km2 of grassland and 5.14 km2 of unused land were transferred, and in 2010–2020, 1,390.75 km2 of grassland and 17.98 km2 of unused land were transferred.
To determine the carbon emissions after each stage of land type transfer, we combined the land use transfer matrix with the carbon source/sink capacity of the land type. The values with an asterisk in Table 7 indicate the net carbon emissions from land use transfer at each period of the study period and increased over time. Throughout the entire study period, carbon emissions were determined by the carbon source category. The key role of built-up land was highlighted by the study’s finding that built-up land accounted for most carbon emissions from total carbon sources. The transfer of cultivable lands and grasslands to built-up lands had the most significant effect on carbon transfer through the conversion of carbon sinks into sources. This impact is due to the release of carbon stored in the soil, ecosystem, and biomass. This transformation of cultivated land and grassland into built-up land accounted for 84.05% of the total carbon emissions (Table 7). The carbon conduction from cultivable to built-up land was 1.02 × 10³ t from 2000 to 2010, which increased to 42.44 × 10³ t from 2010 to 2020. The carbon conduction from forests, and grasslands, to built-up land also showed an increasing trend. The carbon conduction effect caused by water area and unused land transfer is the same as that caused by grassland cultivation, which also shows an increasing trend.
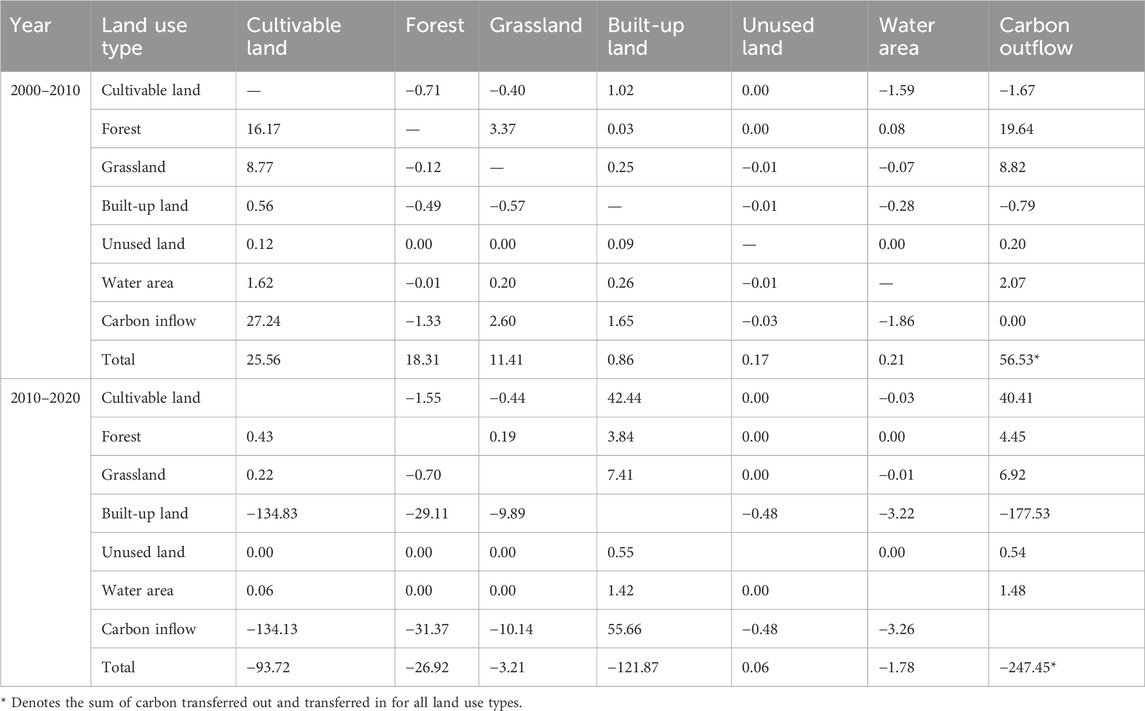
TABLE 7. Carbon conduction effect of land type transfer in the Baiyangdian basin from 2000 to 2020 (103 t).
In this paper, four scenarios were simulated using the GeoSOS-FLUS model for the prediction of the Baiyangdian basin land use in 2035 (Figure 3). The 2035 balanced development, cultivable land protection, and double-carbon target scenarios were largely consistent, but with differences in certain regions.
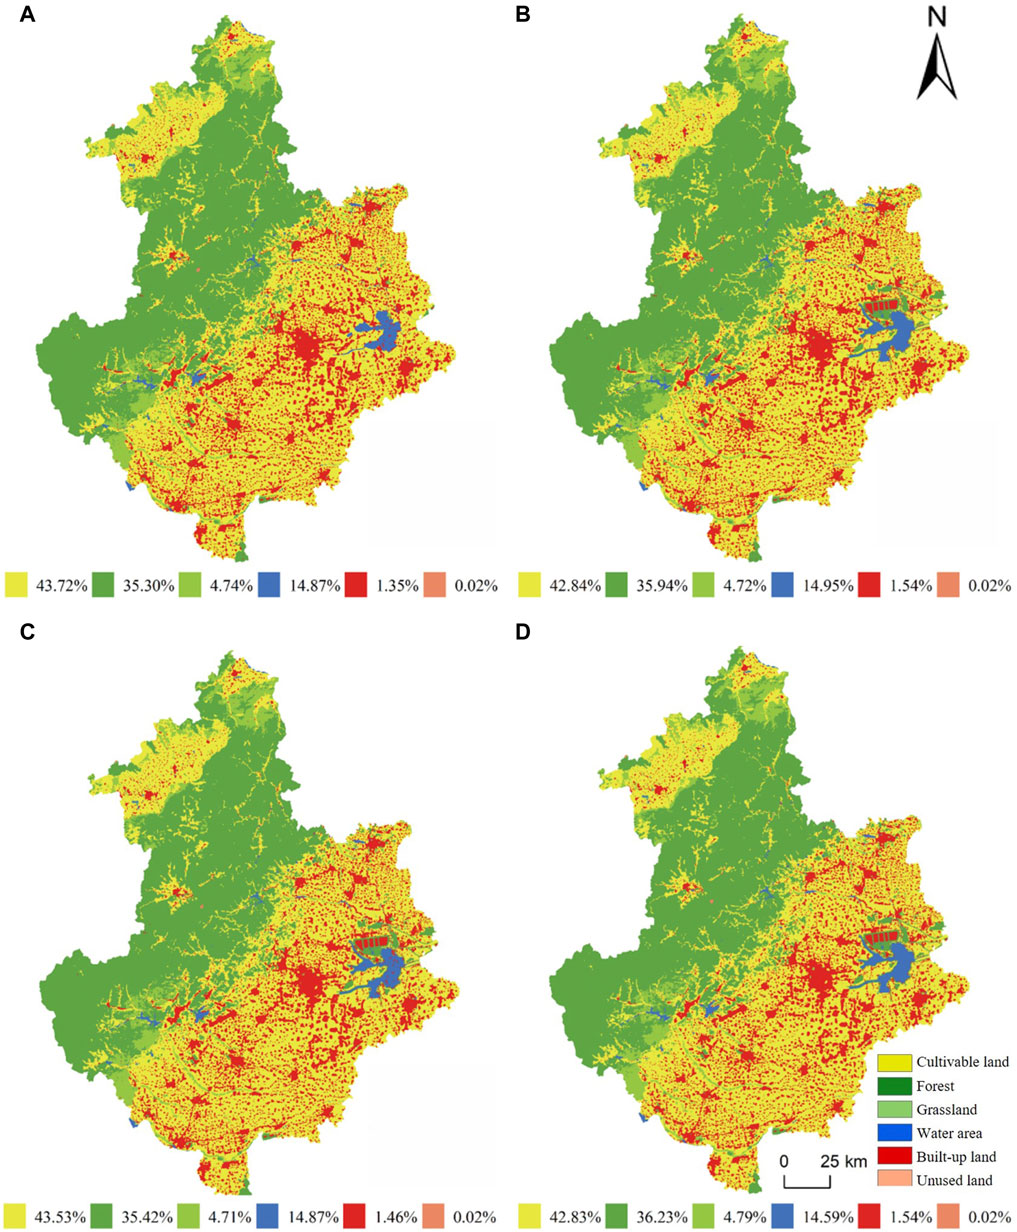
FIGURE 3. Land use change simulation for the Baiyangdian basin in 2035 under different scenarios (The total land area is 34,353.07 km2). (A) Natural development; (B) Balanced development; (C) Cultivable land protection; (D) double-carbon target.
In the natural development scenario, the area of forests, water area, grasslands, cultivable lands, and unused lands in 2035 was 12,118.94, 462.03, 1626.05, 15,009.93, and 10.98 km2, respectively. Compared to 2020, the water area increased by 54.17 km2 at most; the forest area increased by 39.68 km2; and the cultivable land reduced by 5.03%, with a reduction of 795 km2. In the balanced development scenario, compared to 2020, the area of built-up lands, forests, and water bodies increased by 918.30, 260.43, and 119.7 km2, respectively. Accordingly, the area of the cultivable lands and grasslands was reduced by 1096.82 km2 and 218.22 km2, respectively. As urbanization converts large parts of farmlands, food security will be further threatened if the focus remains only on economic development. In the cultivable land protection scenario, the built-up land area was relatively small, close to 5104.76 km2. Compared with the natural development scenario, the area of forests and grasslands increased by 41.48 and 38.61 km2, respectively, while the area of cultivable lands and grassland decreased by 65.88 and 10.43 km2, respectively, indicating a severe deterioration of the Baiyangdian basin ecology. This also suggested that even in the cultivable land protection scenario, only a small portion of cultivable land, grassland, and water area were expanded. It also demonstrated the need to place a higher priority on environmental preservation, rather than economic development in the Baiyangdian basin. In the double-carbon target scenario, the area of cultivable lands, forests, grasslands, water area, unused lands, and built-up lands changed to 14705.15 km2, 12438.86 km2, 1615.62 km2, 527.85 km2, 6.17 km2, and 5007.5 km2, respectively. In comparison to 2020, the grassland area decreased by 190.96 km2 and the carbon-emitting cultivable land decreased by 1099.78 km2. Moreover, the area of water area rose by 119.99 km2, while that of the forests expanded by 359.6 km2 (Table 8).
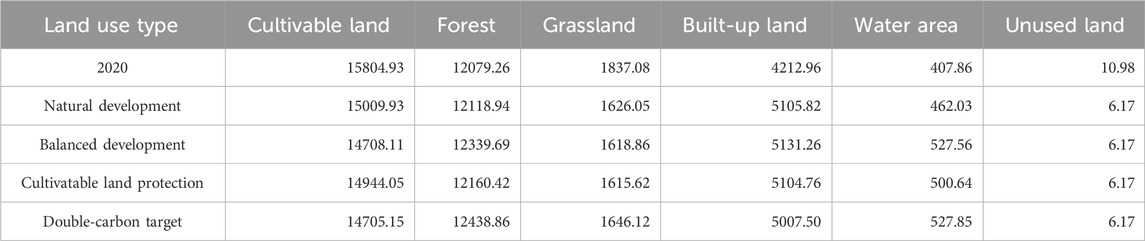
TABLE 8. Area of each land use type under multi-scenario modeling (km2).
The cultivable land carbon emissions in the Baiyangdian Basin in 2020 were calculated to be 666.97 × 10³ t, compared to which the emissions in the four scenarios set in 2035 were predicted to decrease slightly (Table 9). In particular, the cultivable land carbon emissions for the balanced development and double-carbon target scenarios were likely to decrease more about 7%. Regarding the carbon sinks, the maximum carbon uptake of the forests under the double-carbon target scenario was 801.26 × 10³ t, an increase of 3.1% compared with that in 2020, followed by 794.68 × 10³ t under the balanced development scenario. The carbon uptake of grasslands remained largely unchanged, with an average value was about 3.5 × 10³ t. Water areas exhibited the largest carbon uptake in the double-carbon target scenario. Compared with 2020, the water area carbon emissions increased for all four scenarios, with a growth ratio of 23.71%. The unused land area was relatively small, which also remained largely unchanged. The predicted results for the different scenarios are shown in Table 9.
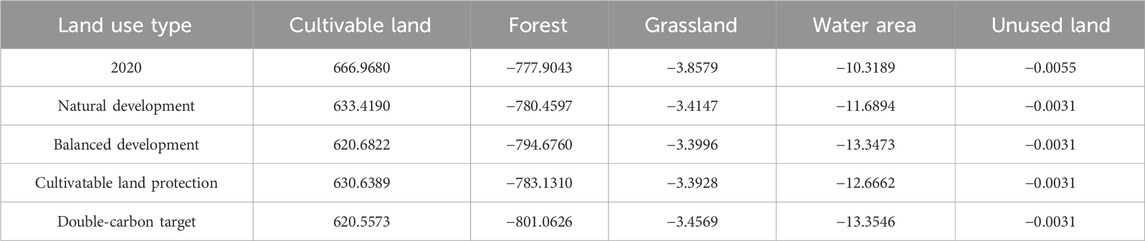
TABLE 9. Prediction results of direct carbon emissions from land use under multi-scenario simulation (103t).
We chose the energy consumption data of the Baiyangdian basin in 2019 as the initial value and combined it with the average transfer probability matrix P obtained by Eq. 9. We subsequently utilized the Markov model for forecasting the energy composition in 2020 and verified the accuracy by comparing the predictions with the actual data (Figure 4).
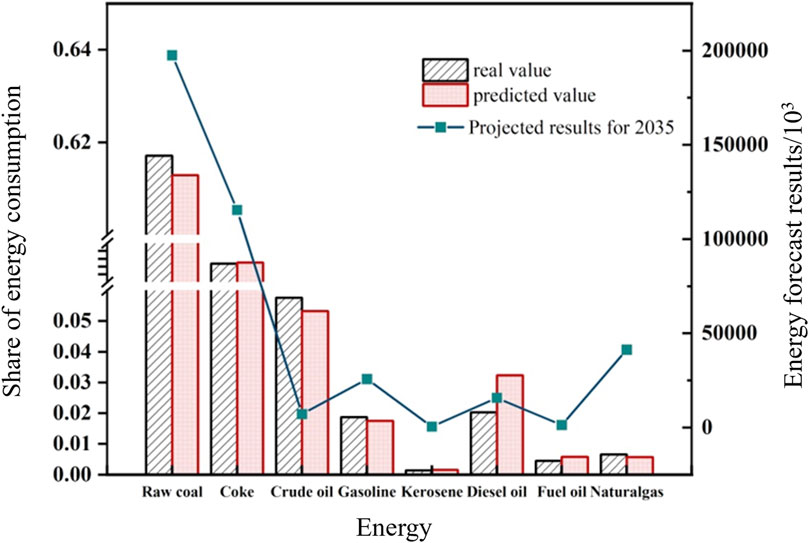
FIGURE 4. Share of energy consumption in the Baiyangdian Basin by energy source and projections.
According to Eq. 9, the model effect coefficient
Using the carbon emissions data from 2000 to 2020 for the Baiyangdian basin, we employed the grey prediction GM (1,1) model to forecast the 2035 emissions and assess the model precision. The carbon emissions due to built-up lands in the basin in 2035 were expected to reach 404,400.19 × 103 t.
In this study, we built a Markov model to forecast total terrestrial carbon emissions in the Baiyangdian basin (Table 10). The land use carbon sinks were primarily related to the land type area, and the carbon sources were primarily related to the continuous growth of energy consumption. Compared with 2020, the net land use carbon emissions in the basin were predicted to increase in 2035 for the four scenarios by 143,483.14 × 103, 143,454.55 × 103, 143,476.74 × 103, and 143,447.97 × 103 t, respectively. All values were much higher than the net carbon emissions of the study area in 2020. In the natural development scenario, the carbon source emission peaked at 405,033.61 × 103 t, increasing by 143,486.62 × 103 t, about 55.03%. The lowest carbon sink absorption out of the four scenarios was 795.57 × 10³ t, with a slight increase of 3.48 × 10³ t compared with 2020. In the balanced development and cultivable land protection scenarios, carbon emissions increased significantly, carbon sink absorptions increased by 19.34 × 10³ t and 7.11 × 10³ t, and carbon source emissions increased by 143,473.89 × 103 t and 143,483.84 × 103 t, respectively. In the double-carbon target scenario, the lowest carbon source emission was 405,020.75 × 103 t and the highest carbon sink absorption was 817.88 × 10³ t in the fourth scenario, which has a significant increase compared to the other three scenarios. Generally, land use carbon emissions in the natural development scenarios were the highest, followed by the balanced development, cultivable land protection, and double-carbon target scenarios. Therefore, it is worth thinking about how to balance carbon emission and absorption in the Baiyangdian Basin to achieve healthy development (Chuai et al., 2016).
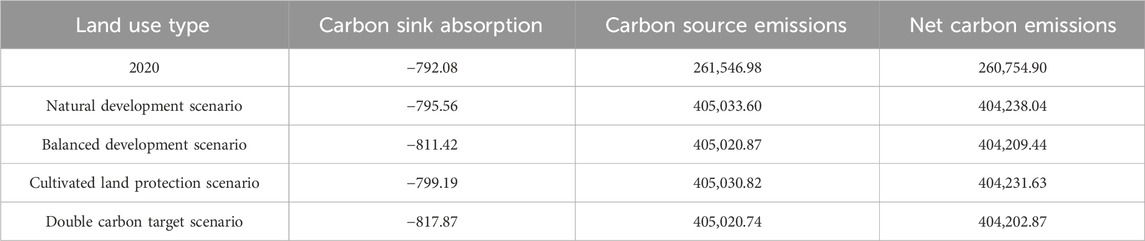
TABLE 10. Total land use carbon emissions prediction results under multi-scenario simulations (103 t).
The macro-scale carbon sinks in the study area could be rapidly accounted for using the direct carbon emission coefficients of the different land types. The relevant national-scale or regional studies by Fang Jingyun and other scholars (2023) served as the basis for the direct carbon emission coefficients of land use employed in this study. The next step should be to improve the monitoring of ecosystem carbon fluxes across countries and the investigation of carbon density across the various land types to correct the coefficients in a localized manner. Additionally, the GeoSOS-PLUS model combines the transformation, as well as pattern analysis strategies, which can effectively uncover the causes of land type changes and compare the simulation results for various scenarios. This can offer guidance for decision-making and future policy planning. In contrast to Zhou et al. (2020) who used the conventional CA-Markov model to simulate the land use in the built-up land of the urban Shanghai area, our experimental results demonstrated that the GeoSOS-PLUS model significantly improved the simulation and predictions of land use patterns in the Baiyangdian basin, with an overall accuracy of 99%. This addressed the issue of the conventional CA model not adequately accounting for the connection between the influencing variables and spatial changes.
Based on the goal of carbon neutrality, this study makes the following suggestions:
a) The government should strictly regulate the unchecked growth of built-up in developing areas; moderately resume plowing in forests, lakes, and grasslands; and boost the capacity of forests as carbon sinks. They must realize the concept of increasing sinks and reducing sources through the creation of rational and scientific land use policies.
b) Improving the industrial and energy consumption structures; investing more in clean energy resources; and creating a green, diversified energy supply system should be prioritized.
c) When creating the national “dual carbon” roadmap, the unbalanced distribution of regional carbon sources and sinks must be considered and objectively examined for their growth potential.
It should be noted that this paper uses fixed coefficients to calculate carbon emissions, and the coefficients can be optimized by combining the localized measured data or by using multi-source remote sensing image data to improve the accuracy of the calculation. When analyzing the transmission effect of carbon emissions, this paper does not consider the difference in carbon emission coefficients of the same land use type in different counties and cities, and the same land type in different regions may have differences in carbon emission capacity due to factors such as the degree of land intensification. In the future, we will carry out in-depth research on the refinement of the carbon transmission effect due to the internal transformation of land use types. In addition, there is a long way to go to achieve the goal of “double carbon,” and the carbon emission accounting and prediction model established for the characteristics of China’s land use has clarified the important paths affecting China’s carbon emissions from land use and has been widely applied in cities in the central and eastern parts of China as well as in northern China. For regions outside of China, it is necessary to combine regional characteristics, add more factors describing land characteristics, and continuously improve the accuracy of the model, which can also be committed to the study of carbon emissions in other regions.
In this study, we first analyzed the land use carbon emissions and subsequent transmissions caused by land use changes in the Baiyangdian basin. We then simulated four scenarios based on the GeoSOS-FLUS model, namely, natural development, balanced development, cultivable land protection, and double-carbon target (Yang et al., 2022), and finally predicted the land use carbon emissions in the Baiyangdian basin in 2035 using a Markov model. The double-carbon target scenario further illustrated the critical position of ecological conservation (Ke N. et al., 2022). In general, from the new direction of carbon emission control, combined with regional land use, our study makes outstanding contributions to regional land rational planning and ecological protection (Chen et al., 2022). The primary conclusions of the study are as follows:
1. The ratio of the Baiyangdian basin carbon source emission to sink absorption has been steadily increasing, especially rapidly in 2020, reaching a maximum of 330.21, 4.9 times higher than in 2000. This shows that the carbon sources (sinks) are consistently rising (declining). Over the past 20 years, the net land use carbon emissions in the basin increased by 208,591.88 × 103 t, with an average yearly rise of 10,429.59 × 103 t.
2. The net carbon emissions from land transfer in the basin exhibit a clear rising trend between 2000 and 2020. The carbon conduction effect due to forests and grasslands being converted to built-up land also shows an increasing trend, whereas the reverse transfer from built-up land to carbon sinks increases only slightly.
3. After simulating four scenarios in the Baiyangdian basin in 2035, it was found that the net land use carbon emissions under the natural development, balanced development, cultivable land protection, and double-carbon target scenarios are predicted to be 404,238.04 × 103, 402,009.45 × 103, 404,231.64 × 103, and 404,202.87 × 103 t, respectively, much higher than the values in 2020. However, carbon emissions from cultivable lands show a decreasing trend; the rate of increase of carbon emissions from built-up lands slowed down, and the carbon absorption by forests and grasslands gradually increased. These trends establish the carbon source-sink ratio as a highly suitable parameter for the future planning of ecological vs economic development.
The original contributions presented in the study are included in the article/supplementary material, further inquiries can be directed to the corresponding author.
XG: Writing–original draft, Writing–review and editing. MiZ: Writing–original draft, Writing–review and editing. MnZ: Writing–original draft, Writing–original draft. ZG: Writing–review and editing. XL: Writing–review and editing. ZY: Writing–review and editing.
The authors declare that financial support was received for the research, authorship, and/or publication of this article. This project is supported by the National Natural Science Foundation of China (NSFC): Research on Safety Resilience Evaluation of Critical Infrastructure Systems in Urban Cities and Optimization of Operation (72374063); the National Natural Science Foundation of China (NSFC): Realization Mechanisms, Influencing Factors and Optimization of Urban Ecosystem Service Delivery: A Case Study of Beijing and its Surrounding Areas (42371279); the Social Science Foundation of Hebei Province: Research on Optimization of Ecological Spatial Pattern and Quality Improvement of Baiyangdian Basin Based on Multi-source Data (HB22GL030) Funding Support.
The authors declare that the research was conducted in the absence of any commercial or financial relationships that could be construed as a potential conflict of interest.
All claims expressed in this article are solely those of the authors and do not necessarily represent those of their affiliated organizations, or those of the publisher, the editors and the reviewers. Any product that may be evaluated in this article, or claim that may be made by its manufacturer, is not guaranteed or endorsed by the publisher.
Affuso, E., and Hite, D. (2013). A model for sustainable land use in biofuel production: an application to the state of Alabama. Energy Econ. 37, 29–39. doi:10.1016/j.eneco.2013.01.003
Ali, G., Pumijumnong, N., and Cui, S. (2018). Valuation and validation of carbon sources and sinks through land cover/use change analysis: the case of Bangkok metropolitan area. Land use policy 70, 471–478. doi:10.1016/j.landusepol.2017.11.003
Carpio, A., Ponce-Lopez, R., and Lozano-García, D. F. (2021). Urban form, land use, and cover change and their impact on carbon emissions in the Monterrey Metropolitan area, Mexico. Urban Clim. 39, 100947. doi:10.1016/j.uclim.2021.100947
Chen, H., Qi, S., and Tan, X. (2022). Decomposition and prediction of China's carbon emission intensity towards carbon neutrality: from perspectives of national, regional and sectoral level. Sci. Total Environ. 825, 153839. doi:10.1016/j.scitotenv.2022.153839
Chuai, X., Huang, X., Qi, X., Li, J., Zuo, T., Lu, Q., et al. (2016). A preliminary study of the carbon emissions reduction effects of land use control. Sci. Rep. 6, 36901. doi:10.1038/srep36901
Chuai, X., Yuan, Y., Zhang, X., Guo, X., Zhang, X., Xie, F., et al. (2019). Multiangle land use-linked carbon balance examination in Nanjing City, China. Land Use Policy 84, 305–315. doi:10.1016/j.landusepol.2019.03.003
Chuai, X. W., Lai, L., Huang, X. J., Zhao, R., Wang, W., and Chen, Z. (2012). Temporospatial changes of carbon footprint based on energy consumption in China. J. Geogr. Sci. 22 (1), 110–124. (in Chinese). doi:10.1007/s11442-012-0915-4
Fang, J., Chen, A., Peng, C., Zhao, S., and Ci, L. (2001). Changes in forest biomass carbon storage in China between 1949 and 1998. Science 292, 2320–2322. doi:10.1126/science.1058629
Ghorbani, M., Amirahmadi, E., Konvalina, P., Moudry, J., Kopecky, M., and Hoang, T. N. (2023). Carbon pool dynamic and soil microbial respiration affected by land use alteration: a case study in humid subtropical area. Land 12, 459. doi:10.3390/land12020459
Ghosh, S., Dinda, S., Das Chatterjee, N., Dutta, S., and Bera, D. (2022). Spatial-explicit carbon emission-sequestration balance estimation and evaluation of emission susceptible zones in an Eastern Himalayan city using Pressure-Sensitivity-Resilience framework: an approach towards achieving low carbon cities. J. Clean. Prod. 336, 130417. doi:10.1016/j.jclepro.2022.130417
Guo, X., and Fang, C. (2021). Integrated land use change related carbon source/sink examination in jiangsu province. Land 10, 1310. doi:10.3390/land10121310
Harper, A. B., Powell, T., Cox, P. M., House, J., Huntingford, C., Lenton, T. M., et al. (2018). Land-use emissions play a critical role in land-based mitigation for Paris climate targets. Nat. Commun. 9, 2938. doi:10.1038/s41467-018-05340-z
Hong, C., Burney, J. A., Pongratz, J., Nabel, J. E., Mueller, N. D., Jackson, R. B., et al. (2021). Global and regional drivers of land-use emissions in 1961–2017. Nature 589, 554–561. doi:10.1038/s41586-020-03138-y
Houghton, R. A., and Nassikas, A. A. (2017). Global and regional fluxes of carbon from land use and land cover change 1850–2015. Glob. Biogeochem. Cycles 31, 456–472. doi:10.1002/2016gb005546
Ke, N., Lu, X., Zhang, X., Kuang, B., and Zhang, Y. (2022a). Urban land use carbon emission intensity in China under the “double carbon” targets: spatiotemporal patterns and evolution trend. Environ. Sci. Pollut. Res. 30 (7), 18213–18226. doi:10.1007/s11356-022-23294-0
Ke, Y., Xia, L., Huang, Y., Li, S., Zhang, Y., Liang, S., et al. (2022b). The carbon emissions related to the land-use changes from 2000 to 2015 in Shenzhen, China: implication for exploring low-carbon development in megacities. J. Environ. Manag. 319, 115660. doi:10.1016/j.jenvman.2022.115660
Le Quéré, C., Andres, R. J., Boden, T., Conway, T., Houghton, R. A., House, J. I., et al. (2012). The global carbon budget 1959–2011. Earth Syst. Sci. Data Discuss. 5, 165–185. doi:10.5194/essd-5-165-2013
Li, W., Chen, Z., Li, M., Zhang, H., Li, M., Qiu, X., et al. (2023). Carbon emission and economic development trade-offs for optimizing land-use allocation in the Yangtze River Delta, China. Ecol. Indic. 147, 109950. doi:10.1016/j.ecolind.2023.109950
Li, Y., Ge, Y. X., and Liang, Y. (2013). Relationship between agricultural carbon emissions and agricultural gross value of output. Chin. J. Agric. Resour. Regional Plan. 34, 60–65. doi:10.7621/cjarrp.1005-9121.20130310
Li, Y., Huang, X., Zhen, F., Zhang, H. L., Qi, Y. W., and Wang, T. (2008). Simple sequence repeat analysis of genetic diversity in primary core collection of peach (Prunus persica). Trans. Chin. Soc. Agric. Eng. 24 (2), 102–110. doi:10.1111/j.1744-7909.2007.00598.x
Liebmann, H., and Kuder, T. (2012). Pathways and strategies of urban regeneration-deindustrialized cities in eastern Germany. Eur. Plan. Stud. 20, 1155–1172. doi:10.1080/09654313.2012.674348
Liu, L. Y., Zheng, B. H., and Bedra, K. B. (2018). Quantitative analysis of carbon emissions for new town planning based on the system dynamics approach. Sustain. Cities Soc. 42, 538–546. doi:10.1016/j.scs.2018.08.006
Lu, X., Zhang, Y., Li, J., and Duan, K. (2022). Measuring the urban land use efficiency of three urban agglomerations in China under carbon emissions. Environ. Sci. Pollut. Res. 29, 36443–36474. doi:10.1007/s11356-021-18124-8
Ma, X., and Wang, Z. (2015). Progress in the study on the impact of land-use change on regional carbon sources and sinks. Acta Ecol. Sin. 35, 5898–5907. doi:10.5846/stxb201312112932
Mendelsohn, R., and Sohngen, B. (2019). The net carbon emissions from historic land use and land use change. J. For. Econ. 34, 263–283. doi:10.1561/112.00000505
Piao, S., He, Y., Wang, X., and Chen, F. (2022). Estimation of China’s terrestrial ecosystem carbon sink: methods, progress and prospects. Sci. China Earth Sci. 65, 641–651. doi:10.1007/s11430-021-9892-6
Qiao, W. F., Mao, G. X., Wang, Y. H., et al. (2016). Research on urban expansion and land use change in Nanjing over the past 32 years. Journal of Geo-information Science 18(2), 200–209. doi:10.3724/SP.J.1047.2016.00200
Raihan, A., Muhtasim, D. A., Farhana, S., Hasan, M. A. U., Pavel, M. I., Faruk, O., et al. (2022). Nexus between economic growth, energy use, urbanization, agricultural productivity, and carbon dioxide emissions: new insights from Bangladesh. Energy Nexus 8, 100144. doi:10.1016/j.nexus.2022.100144
Rong, T., Zhang, P., Zhu, H., Jiang, L., Li, Y., and Liu, Z. (2022). Spatial correlation evolution and prediction scenario of land use carbon emissions in China. Ecol. Inf. 71, 101802. doi:10.1016/j.ecoinf.2022.101802
Sun, Q., Qi, W., and Yu, X. (2021). Impacts of land use change on ecosystem services in the intensive agricultural area of North China based on Multi-scenario analysis. Alexandria Eng. J. 60, 1703–1716. doi:10.1016/j.aej.2020.11.020
Tang, W., Cui, L., Zheng, S., and Hu, W. (2022). Multi-scenario simulation of land use carbon emissions from energy consumption in shenzhen, China. Land 11, 1673. doi:10.3390/land11101673
Tao, Y., Li, F., Wang, R., and Zhao, D. (2015). Effects of land use and cover change on terrestrial carbon stocks in urbanized areas: a study from Changzhou, China. J. Clean. Prod. 103, 651–657. doi:10.1016/j.jclepro.2014.07.055
Walker, W. S., Gorelik, S. R., Cook-Patton, S. C., Baccini, A., Farina, M. K., Solvik, K. K., et al. (2022). The global potential for increased storage of carbon on land. Proc. Natl. Acad. Sci. 119 (23), e2111312119. doi:10.1073/pnas.2111312119
Wang, H., Jin, Y., Hong, X., Tian, F., Wu, J., and Nie, X. (2022a). Integrating IPAT and CLUMondo models to assess the impact of carbon peak on land use. Land 11, 573. doi:10.3390/land11040573
Wang, W., Wang, W., Xie, P., and Zhao, D. (2020). Spatial and temporal disparities of carbon emissions and interregional carbon compensation in major function-oriented zones: a case study of Guangdong province. J. Clean. Prod. 245, 118873. doi:10.1016/j.jclepro.2019.118873
Wang, Y., Shen, J., Yan, W., and Chen, C. (2019). Backcasting approach with multi-scenario simulation for assessing effects of land use policy using GeoSOS-FLUS software. MethodsX 6, 1384–1397. doi:10.1016/j.mex.2019.05.007
Wang, Z., Li, X., Mao, Y., Li, L., Wang, X., and Lin, Q. (2022b). Dynamic simulation of land use change and assessment of carbon storage based on climate change scenarios at the city level: a case study of Bortala, China. Ecol. Indic. 134, 108499. doi:10.1016/j.ecolind.2021.108499
Wolswijk, G., Barrios Trullols, A., Hugé, J., Otero, V., Satyanarayana, B., Lucas, R., et al. (2022). Can mangrove silviculture Be carbon neutral? Remote Sens. 14, 2920. doi:10.3390/rs14122920
Wu, Z., Zhou, L., and Wang, Y. (2022). Prediction of the spatial pattern of carbon emissions based on simulation of land use change under different scenarios. Land 11, 1788. doi:10.3390/land11101788
Xia, C., Zhang, J., Zhao, J., Xue, F., Li, Q., Fang, K., et al. (2023). Exploring potential of urban land-use management on carbon emissions-A case of Hangzhou, China. Ecol. Indic. 146, 109902. doi:10.1016/j.ecolind.2023.109902
Yang, B., Chen, X., Wang, Z., Li, W., Zhang, C., and Yao, X. (2020). Analyzing land use structure efficiency with carbon emissions: a case study in the Middle Reaches of the Yangtze River, China. J. Clean. Prod. 274, 123076. doi:10.1016/j.jclepro.2020.123076
Yang, S., Fu, W., Hu, S., and Ran, P. (2022). Watershed carbon compensation based on land use change: evidence from the Yangtze River Economic Belt. Habitat Int. 126, 102613. doi:10.1016/j.habitatint.2022.102613
Yang, X., and Liu, X. (2022). Carbon conduction effect and temporal-spatial difference caused by land type transfer in Chang-Zhu-Tan urban agglomeration from 1995 to 2018. Acta Ecol. Sin. 42, 338–347. doi:10.1016/j.chnaes.2022.02.004
Yang, X., and Liu, X. Z. (2023). Path analysis and mediating effects of influencing factors of land use carbon emissions in Chang-Zhu-Tan urban agglomeration. Technol. Forecast. Soc. Change 188, 122268. doi:10.1016/j.techfore.2022.122268
Yao, Y., Sun, Z. H., Li, L. L., Cheng, T., Chen, D. S., Zhou, G. X., et al. (2023). CarbonVCA: a cadastral parcel-scale carbon emission forecasting framework for peak carbon emissions. Cities 138, 104354. doi:10.1016/j.cities.2023.104354
Yu, Z., Chen, L., Tong, H., Chen, L., Zhang, T., Li, L., et al. (2022). Spatial correlations of land-use carbon emissions in the Yangtze River Delta region: a perspective from social network analysis. Ecol. Indic. 142, 109147. doi:10.1016/j.ecolind.2022.109147
Yue, C., Ciais, P., Houghton, R. A., and Nassikas, A. A. (2020). Contribution of land use to the interannual variability of the land carbon cycle. Nat. Commun. 11, 3170. doi:10.1038/s41467-020-16953-8
Zhang, D., Wang, Z., Li, S., and Zhang, H. (2021). Impact of land urbanization on carbon emissions in urban agglomerations of the middle reaches of the Yangtze River. Int. J. Environ. Res. Public Health 18, 1403. doi:10.3390/ijerph18041403
Zhang, J., Zhang, A., Dong, J., and Basin, E. (2014a). Carbon emission effect of land use and influencing factors decomposition of carbon emission in Wuhan urban agglomeration. Resour. Environ. Yangtze Basin 23, 595–602. doi:10.11870/cjlyzyyhj201405001
Zhang, M., Zhang, Z., Huang, X. J., et al. (2014b). Design and development of gis and rs-based land use carbon balance accounting module. Bulletin of Surveying and Mapping 2, 101–103. doi:10.13474/j.cnki.11-2246.2014.0065
Zhao, C., Gong, J., Zeng, Q., Yang, M., and Wang, Y. (2021). Landscape pattern evolution processes and the driving forces in the wetlands of lake Baiyangdian. Sustainability 13, 9747. doi:10.3390/su13179747
Zhou, L., Dang, X. W., Sun, Q. K., and Wang, S. H. (2020). multi-scenario simulation of urban land change in Shanghai by random forest and CA-Markov model. Sustain. Cities Soc. 55, 102045. doi:10.1016/j.scs.2020.102045
Keywords: land use, carbon source-sink ratio, carbon conduction effects, Markov prediction, Baiyangdian basin
Citation: Gao X, Zhao M, Zhang M, Guo Z, Liu X and Yuan Z (2024) Carbon conduction effect and multi-scenario carbon emission responses of land use patterns transfer: a case study of the Baiyangdian basin in China. Front. Environ. Sci. 12:1374383. doi: 10.3389/fenvs.2024.1374383
Received: 22 January 2024; Accepted: 05 March 2024;
Published: 13 March 2024.
Edited by:
Chenxi Li, Xi’an University of Architecture and Technology, ChinaReviewed by:
Stanley Mubako, California Department of Water Resources, United StatesCopyright © 2024 Gao, Zhao, Zhang, Guo, Liu and Yuan. This is an open-access article distributed under the terms of the Creative Commons Attribution License (CC BY). The use, distribution or reproduction in other forums is permitted, provided the original author(s) and the copyright owner(s) are credited and that the original publication in this journal is cited, in accordance with accepted academic practice. No use, distribution or reproduction is permitted which does not comply with these terms.
*Correspondence: Meiran Zhao, emhhb21yX2FuQDEyNi5jb20=
†These authors have contributed equally to this work and share first authorship
Disclaimer: All claims expressed in this article are solely those of the authors and do not necessarily represent those of their affiliated organizations, or those of the publisher, the editors and the reviewers. Any product that may be evaluated in this article or claim that may be made by its manufacturer is not guaranteed or endorsed by the publisher.
Research integrity at Frontiers
Learn more about the work of our research integrity team to safeguard the quality of each article we publish.