 Kanchan Mishra
 Bharat Choudhary
 Kathryn E. Fitzsimmons
- Department of Geosciences, University of Tübingen, Tübingen, Germany
Lake Balkhash is Asia’s third-largest lake and an endorheic basin. The lake and its contributing tributaries provide essential water and ecosystem services to the surrounding population, particularly in the Kazakh region. With approximately 2.5 million people living in the areas such as Almaty oblast, Zhetisu oblast, several districts of Karagandy oblast, and Abay province, monitoring and maintaining the lake’s health and water quality is essential for the sustainable management of water resources. The hydrology of Lake Balkhash has been significantly impacted in recent decades by a warming climate, landuse landcover changes, and water-consuming economic activities, the latter of which are driven by population growth and expansion. Turbidity—the measurement of water clarity—serves as a major indicator of water health. Here, we analyze spatial and temporal variability in turbidity across Lake Balkhash by mapping the normalized difference turbidity index (NDTI) based on Landsat data for 1991–2022. We consider major exploratory variables such as precipitation, near-surface temperature, wind speed and direction, water level, and landuse landcover (LULC) within the catchment. We find an overall decrease in turbidity over interannual and seasonal timescales. We observe significant negative correlations between NDTI, near-surface temperature, and water level at both scales but no clear relationship between turbidity and precipitation or wind variables. Among the LULC variables, grassland and bareland near Lake Balkhash showed a positive correlation with NDTI but have spatially decreased over time. Conversely, shrubland and wetland exhibit a negative correlation with NDTI; however, this has spatially increased with time. Our results highlight the significant impact of rising temperatures, anthropogenically influenced water levels, and the LULC variables on turbidity. The turbidity dynamics, in turn, influence the circulation, oxidation, and overall health of Lake Balkhash’s water. Therefore, the study emphasizes that the warming climate and alterations in the lake’s hydrology have a considerable impact on water quality. This suggests that monitoring water health alone may not suffice to mitigate the impacts of climate change and human activities. However, a more comprehensive approach is needed to sustainably manage and conserve dryland water resources.
1 Introduction
The world’s drylands are predicted to experience more severe change than many other regions in a warming world (IPCC, 2019). In particular, anthropogenic climate change is likely to alter precipitation patterns, increase evaporation rates, and cause more frequent and prolonged droughts (Cherednichenko et al., 2019; Farooq et al., 2023), leading to substantial hydrological shifts. These changes are further exacerbated by human activities such as intensification and change in land use and water consumption associated with accelerating population growth and associated engineering in the form of dams and hydrologic diversions (Richey et al., 2015; Wurtsbaugh et al., 2017; Rodell et al., 2018; Wang et al., 2018). The resulting alteration of dryland hydrological systems will have profound implications for the socio-ecological functioning of these regions (de Vente et al., 2006; Gordon et al., 2008; Hagenlocher et al., 2018), particularly since drylands overwhelmingly lie within the less affluent and less resilient global south (Lucatello and Huber-Sannwald, 2020). Furthermore, compared to their counterparts in humid regions, dryland catchments are also more vulnerable to the impact of pollutants (Williams, 2000; Karthe, 2018), largely due to the relative scarcity of water, sensitivity to fluctuations in water level, and potential for aeolian redistribution of sediment (Sala et al., 2016). Given these challenges, dryland water security is increasingly of global concern. Larger lakes, reservoirs and aquifers in particular require careful and comprehensive strategies for the conservation of water quality, since they represent more sizeable resources with greater potential environmental and socio-economic impact.
Monitoring the health of water bodies is essential for effective water resource management and security, and environmental conservation. Traditionally, the monitoring of water quality (WQ) has relied on in-situ measurements. These are, however, time-consuming and associated with high costs, susceptibility to human errors, instrumental limitations, and often discontinuous data collection in both spatial and temporal domains (Baban, 1993; Gholizadeh et al., 2016). In situ monitoring is even more difficult to accomplish in remote areas and developing countries. By contrast, satellite remote-sensing techniques provide the potential for cost-effective synoptic and multi-temporal viewing of surface water extent and continuous WQ assessment over space and time (Dekker et al., 2001; Gao, 2008; Wu et al., 2017; Mishra and Kumar, 2021). Recently developed models predict WQ parameters by exploiting spectral ratios and indices from satellite data (Gitelson et al., 1993; Tyler et al., 2006; Teodoro et al., 2008; Newcomer et al., 2014; Garg et al., 2017), and have been used to demonstrate the correlation of remotely sensed data with suspended load in the water column (Ohashi et al., 2016; Fischer et al., 2017; Molekoa et al., 2022), meteorological (e.g., precipitation, temperature and discharge) and biological factors (e.g., algal blooms, zooplanktons and phytoplankton, and presence of pathogens) (Wass et al., 1997; Hamilton and Luffman, 2009; Gao and Josefson, 2012; Göransson et al., 2013).
In this study, we use remote sensing techniques to map water turbidity in one of the largest lake catchments in Arid Central Asia (ACA): Lake Balkhash in south-eastern Kazakhstan. Water turbidity is a commonly used, optically sensitive parameter for assessing overall water health (Kulkarni, 2011). It is essentially a measure of water cloudiness due to suspended particles and can be used to assess short-term sediment influx from tributary inflow, change in land use and increased erosion, as well as sediment transport dynamics and sedimentation potential in water bodies. Turbidity directly impacts lacustrine ecosystems by reducing sunlight penetration, thereby affecting the aquatic food chain. Elevated turbidity levels also complicate water treatment processes, raising concerns about water safety for human consumption. It is therefore reflects broader environmental changes, and hence monitoring this parameter offers a lens to gauge the health and anthropogenic impact on the entire catchment (Kulkarni, 2011; Göransson et al., 2013). Since it is an optical parameter readily derived from remote sensing data, the metrics of water turbidity enable us to continuously monitor water quality and its response to climatic and anthropogenic changes over space and time for as long as satellite data have been available. Several recent studies demonstrated the efficacy of remote sensing-derived assessment of water turbidity in both temperate and dryland endorheic lakes to identify the impact of both climatic change and anthropogenic interventions within the respective catchments (Fischer et al., 2017; Chaudhari et al., 2018; Elhag et al., 2019; Gaines et al., 2022). By adopting this approach to a catchment in the arid global south, we aim to establish a cost-effective baseline on which future studies can expand, incorporating additional parameters as needed.
Our geographical focus is Lake Balkhash in ACA. ACA region hosts some of the world’s largest endorheic catchments, including the Aral Sea, Tarim Basin and the Ile-Balkhash basin (Karthe, 2018; Wang et al., 2018). Lake Balkhash is the third largest lake in Asia, with an area of 17,000 km2 and a catchment size of 115,000 km2. It hosts over 2.5 million people in the Kazaks region, including Almaty oblast, Zhetisu oblast, several districts of Karagandy oblast, and Abay province (https://taldau.stat.gov.kz/ru/GeoStatistics) who largely depend on fishing, agriculture and mining for their livelihoods (Allouche, 2007; Thevs et al., 2017; Duan et al., 2020), all of which require water resources. Over the last few decades, human activities have impacted the hydrology and ecosystem of Lake Balkhash and its catchment (Mischke et al., 2020). The construction of the Kapchagay reservoir, on the Ile River (Kazakhstan) and associated irrigation water diversions in 1970 resulted in a net loss of two-thirds of the total lake inflow (Nurtazin et al., 2019). This situation is further aggravated by the constructions two major dams on Kash and Tekes river, and dozens of smaller reservoirs the upstream tributary if Ile river (Chinese territory) (Pueppke et al., 2018a; Fitzsimmons et al., 2020). The subsequent increase in human population in the catchment, which has accelerated since land use intensification associated with Chinese Belt and Road initiatives, has significantly increased both surface and groundwater consumption for industrial and domestic use (De Boer et al., 2021). Extended periods of droughts (e.g., in the year 2000, 2008, 2010, 2012, 2014, and 2021) have further reduced the availability of surface water and inflow to the lake (Dubovyk et al., 2019; De Boer et al., 2021; Farooq et al., 2023). At the same time, there has been an increase in the amount of sediments, salts, and other solutes entering the system; these remain and become concentrated due to evaporation, increasing salinity and pollution (Kaushal et al., 2021; Abdelbaki, 2022) using point source datasets. Despite these observations, very limited in-situ measurements of suspended-load sediments (Krupa et al., 2020; Mischke, 2020; Myrzakhmetov et al., 2022) provide a limited WQ metric for Lake Balkhash.
The aim of this study is therefore to investigate spatio-temporal variations in Lake Balkhash WQ for the period 1991–2022 using the metric of turbidity derived from remote-sensing time-series datasets. We also interrogate the effects of climate and people on lake water turbidity and speculate on their respective impacts on lake ecology and ecosystem services. We aim to demonstrate the potential of remote sensing-based indices to efficiently and cost effectively analyse WQ and its causal factors in areas where in situ data collection is challenging. For the Balkhash region specifically, our study will help to develop appropriate water resource management strategies in the context of anthropogenic climate change.
2 Data and methods
2.1 Study area
The study focuses on Lake Balkhash, the terminal lake within the endorheic Ile-Balkhash basin (Figure 1). The upper parts of the catchment lie within western China; the lower parts and the lake itself are situated in south-eastern Kazakhstan. The lake occupies an average area of −17,000 km2 (Pueppke et al., 2018a), while the entire catchment spans 115,000 km2 (De Boer et al., 2021). Lake Balkhash has an average width of 30 km, reaching a maximum width of −74 km in the western section (Sala et al., 2016). Lake Balkhash is divided into distinct western and eastern sub-basins by the approximately 3.5 km wide Uzynaral strait (Figure 1). The western part of the lake contains fresh water and is shallow, with depths ranging from 3 to 11 m (Mischke, 2020; Myrzakhmetov et al., 2022). The eastern lake sub-basin is saline and substantially deeper, reaching depths of 26 m.
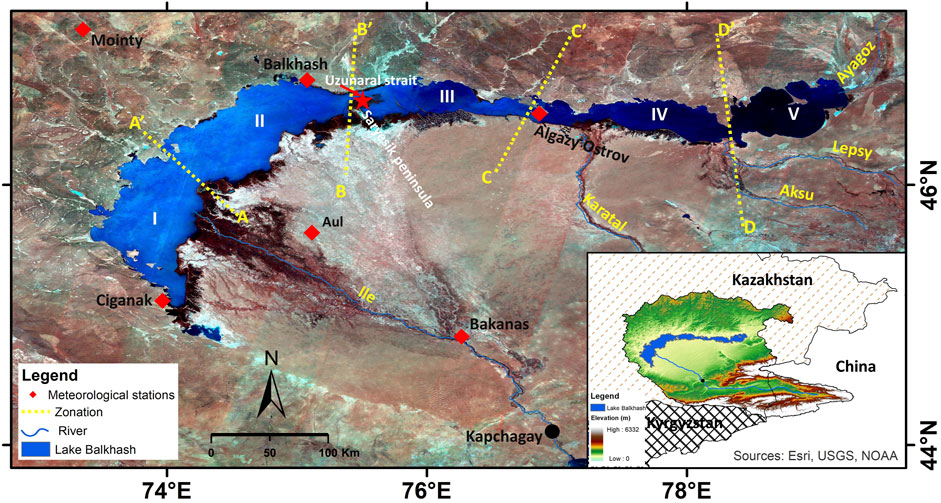
Figure 1. Map shows the study area of Lake Balkhash, Kazakhstan. The lake is divided into 5 major zones denoted by Roman numerals I–V in white to define the morphometric partitions based on the Bathymetric level (Reference: 42). Uzunaral strait (red star ★ mark) divides the Lake Balkhash into two-halves (IPCC, 2019): Western part comprised of zones I and II. They are freshwater zones, majorly fed by the Ile River. The Ile River forms a large inland delta comprising Ramsar wetlands of international importance (Farooq et al., 2023); Eastern part comprises of zones III, IV and V, which are brackish in nature. Karatal, Aksu and Lepsy river contribute to zone IV and Ayagoz River debouches in zone V, with no surface inflow today. The red diamond mark (♦) shows the meteorological stations available for the data of wind speed/directions around Lake Balkhash.
Inflow to the lake is dominated by the Ile River (or Ili River) (De Boer et al., 2021), which flows into the western sub-basin through a large (8,000 km2) delta system. The Ile River originates from the partially glaciated high altitude Chinese Tien Shan mountains and flows westward through south-eastern Kazakhstan (Tang et al., 2019). The Ile River delta serves as a natural hydrological regulator through short-lived wet and dry periods and plays a critical role in the ecological balance of the lake system (Dostay et al., 2012; Myrzakhmetov et al., 2022). The eastern lake sub-basin is fed by smaller rivers such as the Karatal, Aksu and Lepsy, which derive from the largely glacierised northern Tien Shan (Zhetysu Alatau) in eastern Kazakhstan (Kaldybayev et al., 2016). A small amount of freshwater enters the eastern sub-basin from the Ile-recharged western part. The waters of the eastern part of the lake are more saline than the western sub-basin due to a net reduction in water flow (−24.28%) compared to the average between 1936 and 1969 (Mukhitdinov et al., 2020); in particular, the Ayagoz River, which used to enter the lake from the north, as well as inflow from the Alakol lake system to the east, have no surface inflow today (Myrzakhmetov et al., 2022). The difference in water characteristics of the western and eastern Balkhash sub-basins has led to the nickname “One lake with two waters” (Kezer and Matsuyama, 2006; Huang et al., 2022).
Lake Balkhash receives its largest inflow over the warmer months (May to August). Peak discharge typically occurs in July and mostly results from glacial and snow melt (Petr, 1992; Sala et al., 2016; Mischke, 2020). Based on available average runoff data (1924–72), the Ile River has largest mean runoff with 17.4 km3/yr, accounting for −70–80% of total inflow to Lake Balkhash. Inflow from the Karatal, Aksu, Lepsy and Ayagoz Rivers to the eastern sub-basin comprises 20%–30% of total inflow (Petr, 1992; Kezer and Matsuyama, 2006). These eastern tributaries are also the major source of sediments (Petr, 1992). The variation in inflow and sediment input from the different tributaries has led to the division of the modern Balkhash basin into five distinct sub basins/zones, i.e., 1) West-South, 2) West-North, 3) Middle, 4) Lepsy Karatal, and 5) Kentubek (Figure 1). The depth of these basins increases from west to east, with lake bottoms at 334, 333, 327, 326, and 316 m asl, respectively corresponding to current water depths of c. 10, 11, 15, 16, and >20 m (Myrzakhmetov et al., 2022).
The Ile-Balkhash catchment experiences a continental climate and diverse geomorphology, spanning highest glaciated mountains of Khan Tengri peak rising to 6995 m asl, and terminating in the desert at 340 m asl with lowest point in the Lake Balkhash (Cao et al., 2022). The extreme climate supports desert and steppe vegetation near the lake, with deciduous trees and coniferous forests, alpine meadows and tundra vegetation with increasing altitude (Mischke et al., 2020). Summers in this region are typically hot, with temperatures frequently exceeding 40°C, while winters can be extremely cold, with subzero temperatures (Ahmed et al., 2022). These extreme temperature oscillations are also reflected in the mean surface water temperatures, which fluctuate between c. 0°C and 24°C from December to July, respectively (Barinova et al., 2017). This marked temperature variation has important implications for the water cycle, especially in terms of evaporation and ice cover on the lake. Precipitation is highly inconsistent in the Ile-Balkhash basin, with a general spring peak in rainfall and annual averages of 100–200 mm (Ahmed et al., 2022). Extended dry spells during the summer are common, leading to increased evapotranspiration rates of 8%–15% (Chub, 2000). The continental climate, in particular the high summer temperatures and irregular precipitation patterns, is a significant driver of water balance in the lake.
The Ile-Balkhash basin mainly comprised of sedimentary rocks such as carbonates, silicates, and alluvial deposits (Shen et al., 2021). Carbonate rocks are found extensively across the basin, especially near the upper part of the Ile River and the northern shore of Lake Balkhash. Silicate rocks are primarily located in the central part of the basin, along the Ile River, Aksu River, Lepsy River, and Karatal River. Igneous and metamorphic rocks are also present throughout the basin but are more common to the northern shoreline of the lake, characterized by a tectonically disturbed terrain as high as with 20–30 m asl. The western shoreline of the Lake Balkhash is dominated by clay deposits whereas, the south of the lake shoreline is dominated by flat sandy alluvial and wind-blown sediments deposits, mostly composed of siliceous materials (Sala et al., 2016; Shen et al., 2021). Thus, the overall configuration of the lake shoreline suggests that the lake receives substantial sediment input from the tributary rivers, which drain an actively uplifting catchment containing significant fine-grained unconsolidated sediments, as well as from aeolian transport by the dominant westerly winds which entrain sediment while sweeping across the loess steppe and dune landscapes (Sala et al., 2016; Fitzsimmons et al., 2020; Myrzakhmetov et al., 2022). The high sediment input, particularly in the south of the lake, impacts the turbidity of the water. The spatially diverse climate and topography results in complex interactions between precipitation, runoff, evaporation, accumulation of sediments, salts, and pollutants, ultimately affecting the lake ecosystem as a whole (Klein et al., 2014).
2.2 Datasets
The primary and secondary datasets relevant to this study include remote sensing datasets, precipitation (P), temperature (T), the wind variables for direction (Wd) and speed (Ws), water level (WL) and landuse landcover (LULC).
2.2.1 Remote sensing datasets
Our study makes use of remote sensing-based datasets to investigate the water quality (WQ) of Lake Balkhash through time. This approach, however, is limited due to insufficient and inconsistent satellite data observations, particularly during the winter which result in frequent data gaps due to snow and cloud cover (Supplementary Table S1). This causes an imbalance in effective observation of satellite imagery both spatially and temporally.
In order to overcome these limitations, we analysed turbidity from all available datasets to produce a synthesized annual turbidity based on data from the three available seasons (considering 9 months) available for the years 1991–2022 for Lake Balkhash. In addition, we investigated variability in turbidity for specific seasons independently of one another: the spring months (March-May) are assumed to be the peak season for agricultural activities (Kogutenko et al., 2019); summer (June-August) represents the period of maximum hydrological stress; and fall (September-November) is the season of highest water influx. We used only cloud-free, Level-2 reflectance images from Landsat-5 (L5, Thematic mapper), Landsat-7 (Enhanced Thematic Mapper Plus), and Landsat-8 (L8, Operational Land Imager) (Supplementary Table S1). We processed the satellite images using Google Earth Engine (GEE) to derive the turbidity index maps.
2.2.2 Climatic variables
We obtained monthly precipitation (P) and near-surface air temperature (T; 2 m above the surface) data over Lake Balkhash from the high-resolution Climatic Research Unit (CRU TS v.4.07; observed datasets available at http://www.cru.uea.ac.uk/cru/data/hrg/). These datasets are based on in situ measurements from multiple weather stations and agree well with other datasets, such as the Global Precipitation Climatology Centre (GPCC) (Harris et al., 2014) and have been shown to be suitable for Central Asia (Deng and Chen, 2017). We downloaded data for the period from 1991 to 2022 with a spatial resolution of 0.5° by 0.5° to match both the timeframe and scale of our datasets.
Figure 1 shows six meteorological stations situated around Lake Balkhash; from the four stations adjacent, the lake we obtained daily wind speed (Ws) and direction (Wd) data from the Hadley Centre Integrated Surface Database (HadISD). The HadISD provides an hourly record that is particularly valuable for assessing short-term climate extremes and variability at local scales relevant to our study. We acquired daily wind data for the period from 1991 to 2022 from the openly accessibly global sub-daily surface meteorological station dataset (version v3.3.0.2022f) from National Center for Environmental Information—NOAA (NCEI) accessible at https://dx.doi.org/10.5285/60c28523d8c54c58831b2608164cf35e. However, we note that the available data for these adjacent stations exhibit high variability (Table 1).
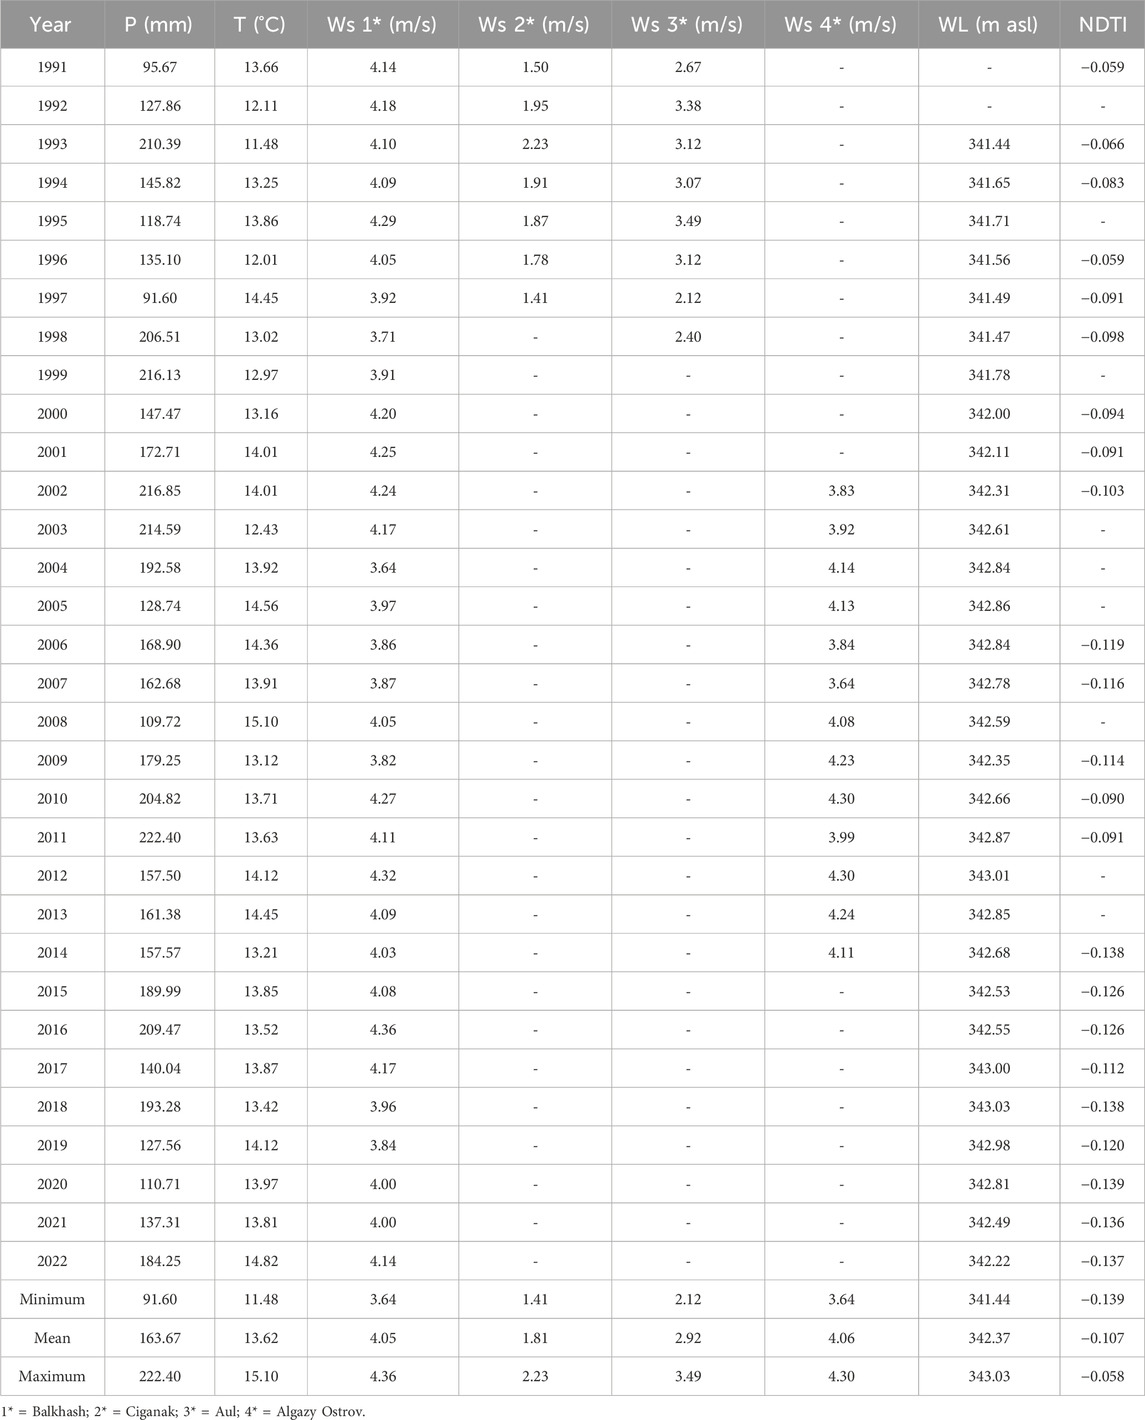
Table 1. Year-wise average water level (WL), precipitation (P), temperature (T), wind speed (Ws) and turbidity index (NDTI) variation data sets used for the time series trend analysis.
2.2.3 Anthropogenic variables
We obtained monthly WL datasets from the Laboratoire d'Etudes en Géophysique et Océanographie Spatiales (LEGOS) Hydroweb altimetry data repository (accessible at http://www.legos.obs-mip.fr/soa/hydrologie/HYDROWEB). These datasets are derived from multi-source altimetric satellite data, including TOPEX/Poseidon, GFO, ERS-2, Jason-1, Jason-2, and Envisat (Crétaux et al., 2011; Jean-François et al., 2015). The available data covers the period from September 1992 to 2023. However, we acquired monthly water level data for each 9-month interval (spring through to fall) spanning between year 1993–2022 at spatial and temporal scale (Table 1). One previous study derived water level data from the same source to assess temporal variability in water influx to the lake between 1992 and 2010, and established a strong correlation between satellite altimetry-derived WL and in situ measured WL (Propastin, 2012). The high degree coefficient of determination (R2 = 0.92) gives us confidence in the reliability of our satellite altimetry-based approach. In our study, we extend the use of WL data up to 2022 to analyse water level fluctuations over the last 3 decades (i.e., 1993–2022). In doing so we additionally capture any potential changes associated with the acceleration of Belt and Road projects in western China. It's worth noting that zone wise WL data in not available for the present study.
We also obtained annual (12-month) landuse landcover (LULC) datasets spanning from 1992 to 2020, with a spatial resolution of 300 m (Supplementary Figure S1; Supplementary Table S2). These datasets were sourced from the European Space Agency Climate Change Initiative Land Cover project (http://maps.elie.ucl.ac.be/CCI/viewer). The annual LULC subclasses used in our study were merged accordingly and reclassified as cropland, forestland, grassland, shrubland, wetland, urban land, bare land, water bodies, and snow and ice (Supplementary Figure S1). These LULC datasets currently restrict seasonal and zonal analysis for our study area.
2.3 Methods
The aim of this study is to identify, characterize, and explain turbidity variations over space and time at Lake Balkhash. To achieve these objectives, we undertook an iterative approach to analysing the datasets (Figure 2). To begin with, we examined the annual (9M) and seasonal (3M) turbidity data represented by the Normalized Difference Turbidity Index (NDTI). Season-specific analysis offers insight into water quantity and quality as it moves through the hydrological system. We simultaneously interrogate the annual (9M) and seasonal (3M) variability of meteorological (e.g., P, T and Ws/Wd) and anthropogenic influenced variables (e.g., WL and LULC) to match the data consistency to that of satellite imageries obtained for turbidity analysis. In order to better understand spatial variability within the large lake basin, we collected −2000 random point samples from time-series data for NDTI, precipitation (P) and temperature (T) (Supplementary Figure S2). Finally, we performed a time-series trend analysis using linear regression and Pearson correlation analysis on both NDTI and the climatic and anthropogenically influenced variables to investigate the socio-climatic effects on water surface dynamics and quality. The idea of obtaining −2000 random sample points for P, T and NDTI in this study is to select a representative subset of data points from a larger dataset. This method ensures equal opportunity for each data point to be chosen, thus minimizing bias and accurately reflecting the entire data population.
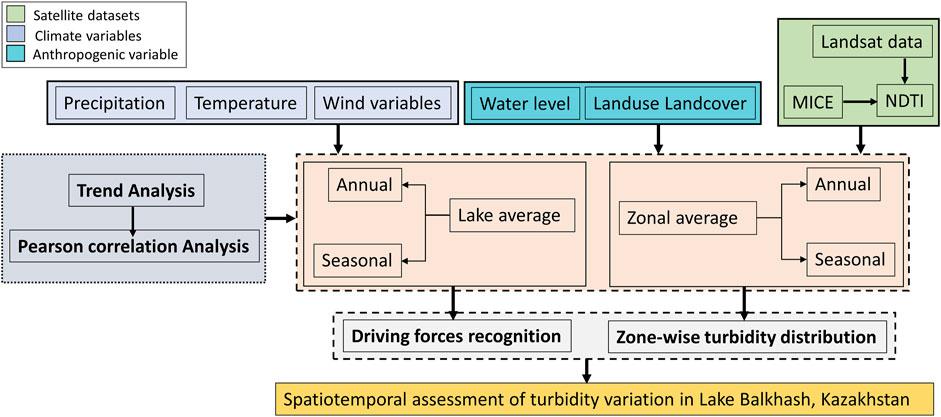
Figure 2. Flow chart shows the schematic stepwise methodology adopted for the assessment of the turbidity variation across spatio-temporal scale.
2.3.1 Normalized difference turbidity index
Turbidity is a measure of the cloudiness of water resulting from the interference of light by suspended sediment within the water column. Turbidity increases with an increase in suspended particle load. Pure water without suspended load has a specific radiometric response, namely, a weak reflectance in the green part of the spectrum (<10%), a still weaker reflectance in the red wavelengths, and close to no reflectance in the near-infrared range. In highly turbid water, the radiometric spectra of open water surfaces emulate bare soil in terms of reflectance (Lacaux et al., 2007; Gardelle et al., 2010). With increasing turbidity, the reflectance of the red band is typically higher than that of the green band (Islam and Sado, 2006).
In this study we estimated water turbidity from the available remote sensing data using the published NDTI method (Lacaux et al., 2007), an approach specifically designed for ponds and inland catchments. Generally, the NDTI values ranges between −1 and +1 whereas lower value indicates clear water and higher value represent higher turbidity (Klein et al., 2014). Larger NDTI values signify higher turbidity and vice versa. The index combines the red and green spectra of satellite datasets and is described by the following equation:
where
Given the size of Lake Balkhash and its spatially variable inflows and associated turbidity properties, we calculated the NDTI for multiple point locations within the five sub-basins (zones) defined by bathymetry and association with inflowing rivers (Figure 1) (Myrzakhmetov et al., 2022). We used these data to generate zonal average values for individual seasons and for the synthesised annual (9M; spring-summer-fall months) time periods.
2.3.2 Data treatment and statistical analysis
Satellite data collection can be limited by weather conditions such as cloud cover and dust storms, leading to data gaps in our NDTI calculations. To address this issue, we employed the Multivariate Imputation by Chained Equations (MICE) package, which is a tool developed within the open-source R software. The MICE technique is designed to estimate missing values using a multivariate approach, considering the relationships and patterns observed in the available data. We applied the MICE approach to fill in data gaps with statistically anticipated values (van Buuren and Groothuis-Oudshoorn, 2011) for the selected points collected across the different zones of Lake Balkhash (Supplementary Figure S3). This approach mitigates the impact of missing data over space and time.
We analysed the trend and correlation of different datasets using statistics in order to identify, describe, and explain turbidity variations over time and space. We used Pearson correlation coefficient (r) and significance (p-value) to illustrate the trend of NDTI, P, T, Wd, Ws, WL, and LULC time-series data. We also evaluated the r and p-value to decouple the relative influences of the climatic variables to turbidity patterns over time.
3 Results
3.1 Spatiotemporal analysis of climatic variables at Lake Balkhash
Here, we first present the trend analysis of precipitation (P), temperature (T), the wind variables for direction (Wd) and speed (Ws), over the 1991–2022 period at both annual and seasonal scales. Overall, we observe a trend of significant correlation for temperature but the long-term averaged precipitation and wind data do not appear to yield any correlation through time. The details of these observations are further elaborated in the subsequent sub-sections.
3.1.1 Precipitation
The annual and seasonal precipitation (P) trends for the Lake Balkhash region is illustrated in Figure 3A. We observe an overall trend in increasing precipitation over the lake over the period 1992–2022, at a rate of 0.48 mm/9M, although this trend is not statistically significant (r = 0.117, p = 0.320; Table 2). The lowest annual lake-averaged P occurred in 1997, with 91.60 mm recorded, while the highest annual average precipitation was observed in 2011 with 222.40 mm (Table 1).
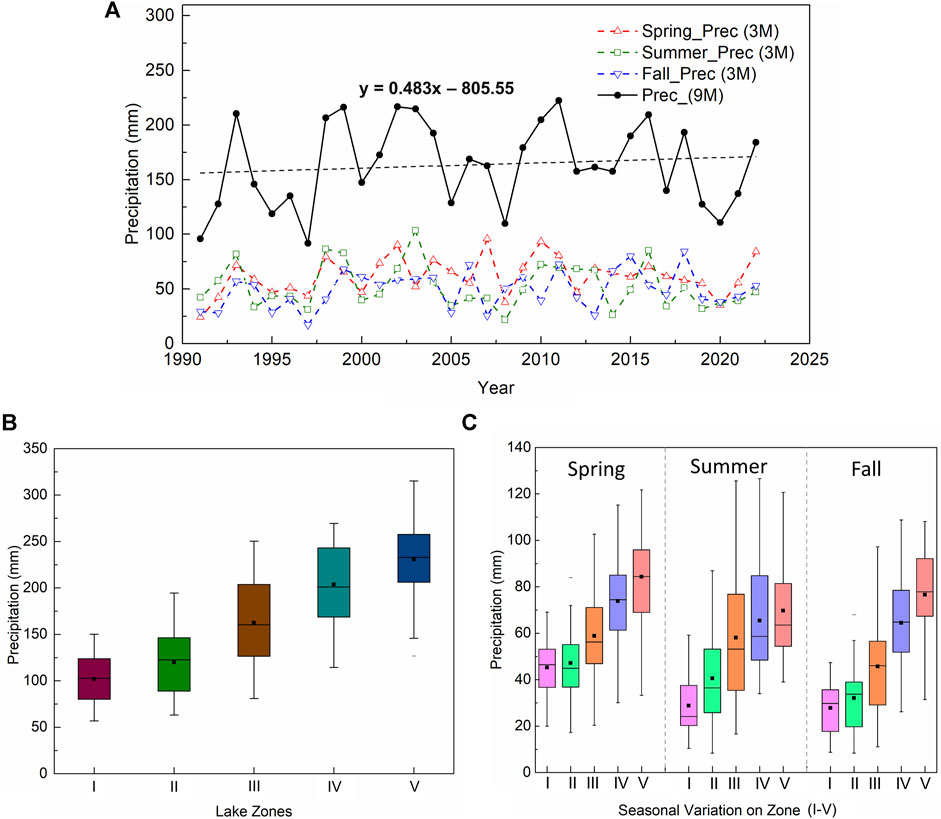
Figure 3. (A) Temporal trend of the precipitation (P) variables at interannual and seasonal scale; (B) and (C) Box plots of the zone-wise distribution of precipitation at annual and seasonal scales, respectively.
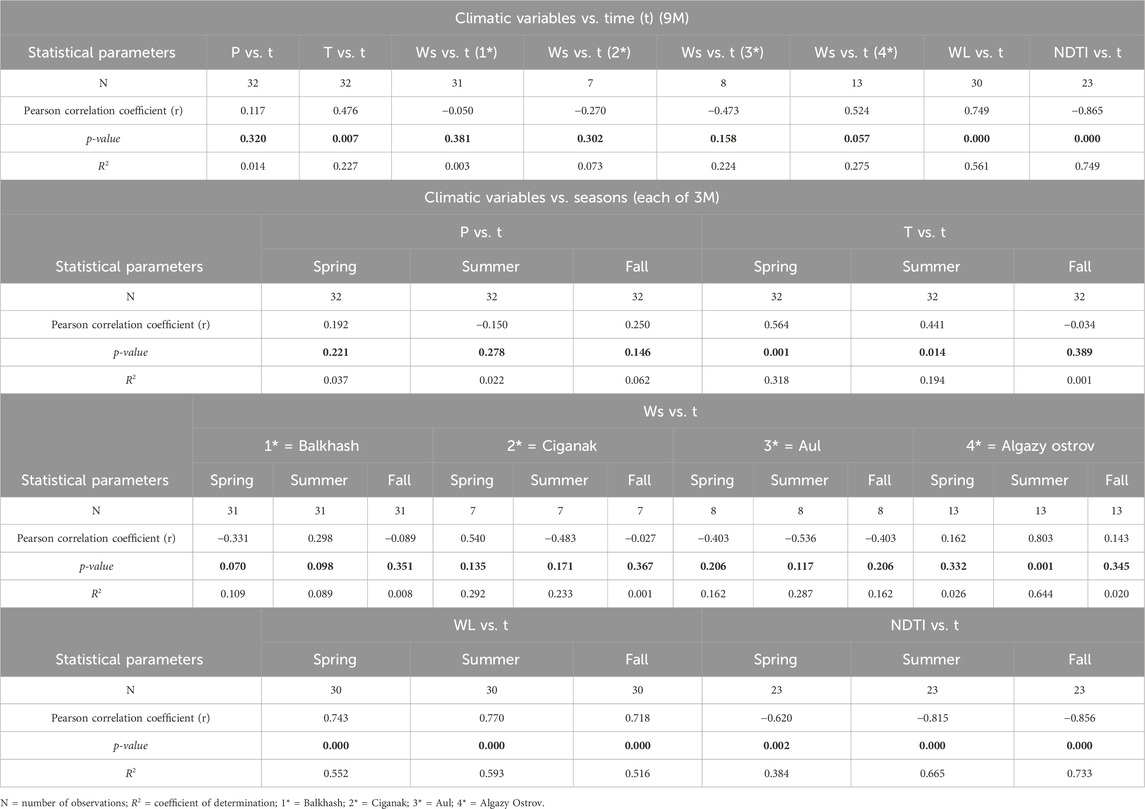
Table 2. Pearson correlation coefficient (r) and significance (p-value) of different climatic variables used in the surface water turbidity assessment at interannual and seasonal scales.
When we consider the data for individual seasons, we observe the highest average rainfall in the spring months (61.87 mm averaged over the observation period, with a peak in year 2007 of 95.74 mm); the summer months average 52.50 mm over the observation period and fall 49.30 mm. Statistical trend analysis performed on seasonal P averages yields no significant correlations with time, (spring r = 0.192, p = 0.221; summer r = −0.150, p = 0.278; fall r = 0.250, p = 0.146) as observed for the annual data (Figure 3A; Table 2). These findings suggest that, at least over the 1991–2022 period, annual as well as seasonal precipitation patterns have not changed significantly at Lake Balkhash.
We observe spatial variability in the direct precipitation independent of annual and seasonal factors over the lake throughout the study period (Figure 3B; Table 3). Mean annual P increases from zone I at the western end of the lake (101.8 mm) to zone V in the far east (230.6 mm). This may be explained by the fact that the western end lies in the lowermost, most open part of the basin, whereas there are topographic highs in the east which may trap any remaining moistures (Caves et al., 2015; Fitzsimmons et al., 2020). Thus, the eastern part of Lake Balkhash therefore receives more direct precipitation than the western part irrespective of year and season (Figure 3C; Table 3) (Duan et al., 2020).
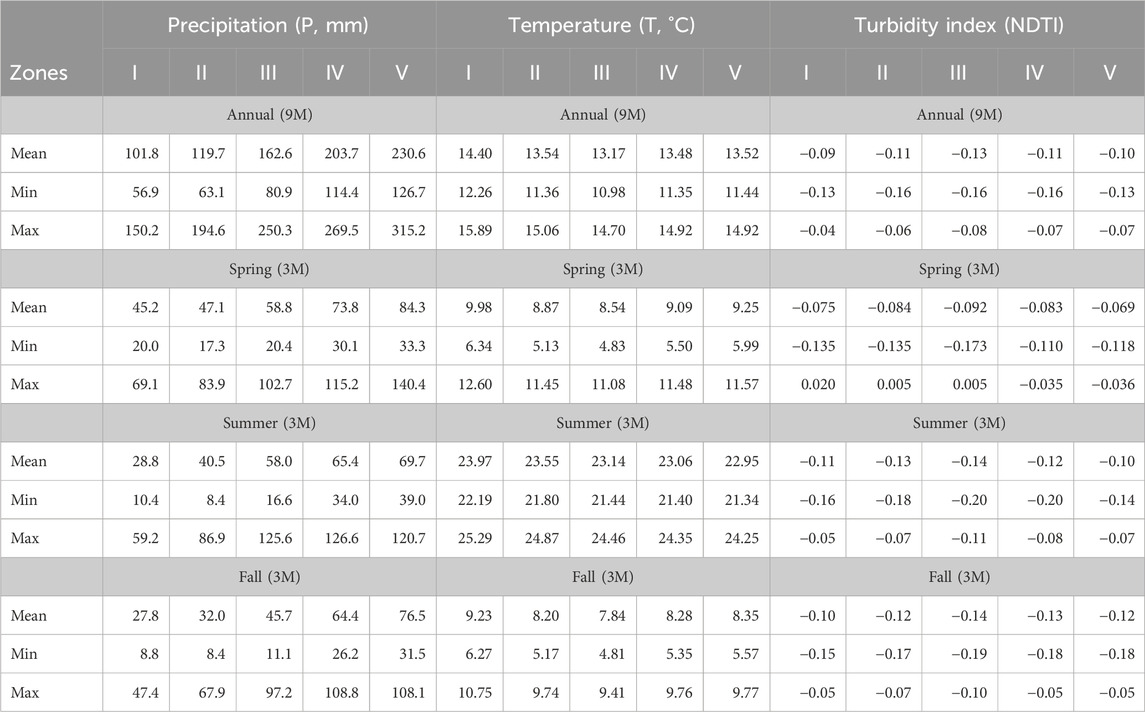
Table 3. Zone-wise statistics of precipitation (P), temperature (T) and turbidity index (NDTI) variation over the Lake Balkhash.
3.1.2 Temperature
Interannual temperatures (T) increase significantly over the period 1991–2022. Over 3 decades, the overall synthesised annual near surface temperature increase is −0.04°C/9M (Figure 4A), a value which is statistically moderate (r = 0.476; p = 0.007; Table 2). Minimum, maximum and mean T for 9-month data aggregates were 11.48°C, 15.10°C, and 13.62°C, respectively (Table 1).
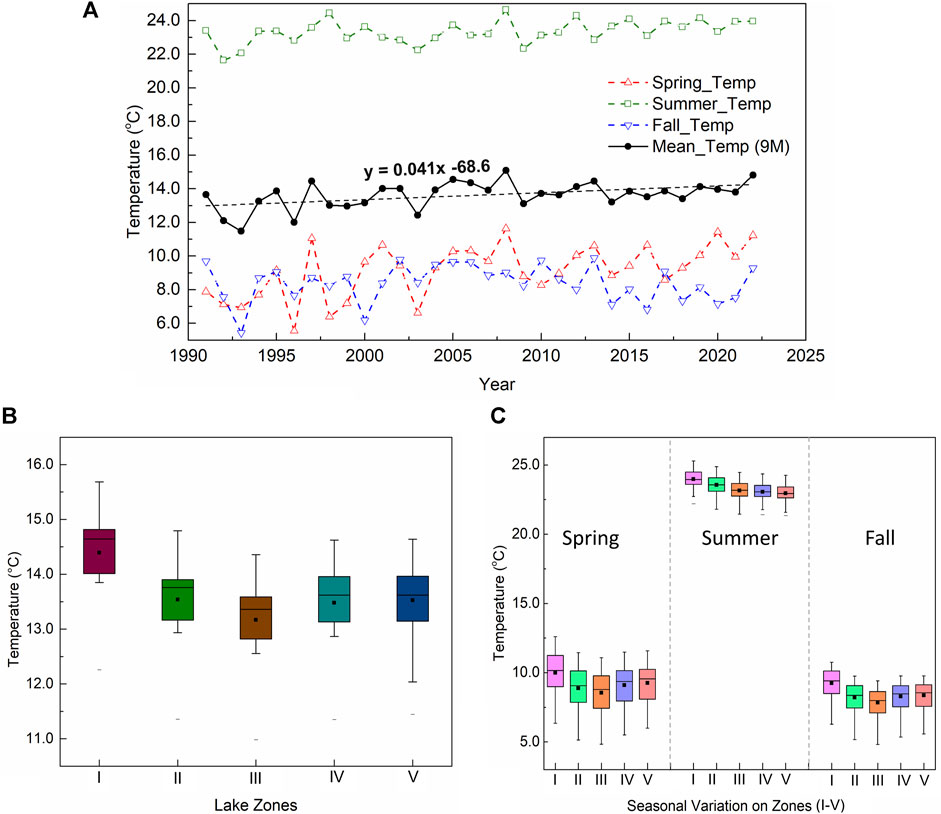
Figure 4. (A) Temporal trend of the temperature (T) at mean interannual and seasonal scale; (B) and (C) Box plots of the zone-wise distribution of temperature at annual and seasonal scales, respectively.
We also assessed the trends in seasonal T values over the study period and found that the range of spring average temperatures (5.56°C–11.63°C) are comparable with the fall equivalents (5.43°C–9.88°C) (Figure 4A; Table 3). Summer temperatures are substantially warmer and range from 21.63°C–24.65°C. Average spring temperatures increases by c. 0.08°C (r = 0.57; p = 0.001) and by 0.02°C in the summer temperatures (r = 0.44; p = 0.014) over the 1991–2022 study period. We observe no statistically significant trends for average fall temperatures (r = −0.03; p = 0.389) (Table 2). The significant warming trend over Lake Balkhash since 1991 (Figure 4A) is therefore dominated by the rise in spring temperatures followed by summer (Figure 4A). This rise in spring near-surface temperatures is likely to have affected water mixing, causing sediments within the water to settle at a slower rate. Increased temperatures also impact lake biological activity, for example, increasing the likelihood of algal blooms. These combined effects potentially contribute to increasing lake water turbidity.
We observe temperature differences across five lake zones (Figure 4B; Table 3). The westernmost zone (I) records the highest average temperatures, yielding a MAT (Mean annual temperature) of 14.40°C and maximum average summer temperature of 25.01°C (Table 3). The coolest zone is that in the centre of the lake (Zone III), with an average annual temperature of 13.17°C (Figure 4B; Table 3), as well as the lowest spring and fall averages (Figure 4C). The spatial distribution of average summer temperatures yields higher values in the western zones and lower values in the three eastern zones (Figure 4C; Table 3). Looking at the seasonal temperature differences across these five lake zones, the summer temperature is at the higher ordinates to that of spring and fall season (Figure 4C; Table 3). As a result, turbidity may be higher in the western part of lake Balkhash, particularly in the spring and summer months.
3.1.3 Wind variables (wind speed and direction)
The wind speed (Ws) and direction (Wd) statistics as recorded at the four weather stations of the Lake Balkhash are summarised in Figure 5.
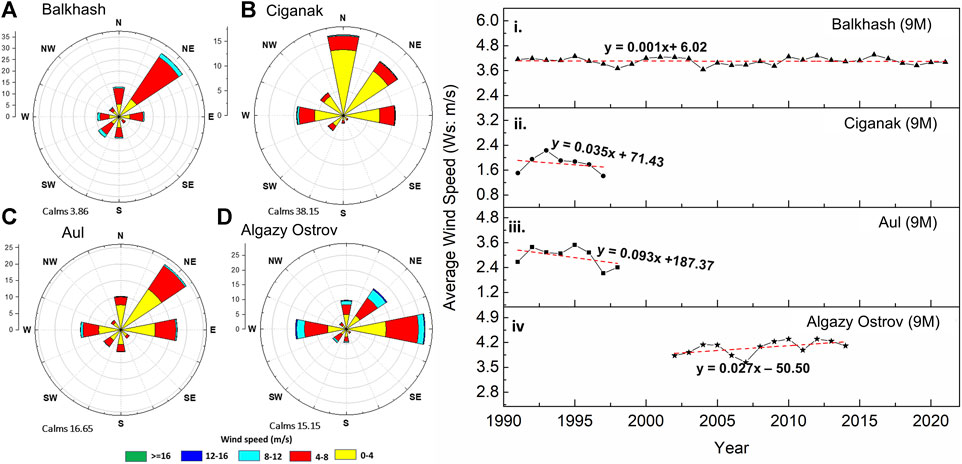
Figure 5. Rose diagram of the average wind speed (Ws) and direction (Wd) of the 4 nearest meteorological stations (A) Balkhash, (B) Ciganak, (C) Aul and (D) Algazy Ostrov based on the daily wind data measured over the study period (1991–2022), respectively. Plots (i–iv) show time series trend analysis of the mean interannual wind speed of the available datasets.
The Balkhash weather station lies at 440 m asl on the northern lake margins of the western lake sub-basin, within zone II (Figure 1). The Balkhash locality is dominated by north-easterly winds, although moderate to high intensity winds (4–12 m/s) may derive from any quadrant (Figure 5A; Table 4); it experiences minimal calm conditions (3.86%) compared with the other localities. The seasonal pattern of wind speed shows consistent wind strength across all three seasons (Supplementary Figure S4; Table 4) and there is no clear temporal trend in wind speed or direction at both annual and seasonal scales (Figure 5i; Supplementary Figure S4i; Table 2).
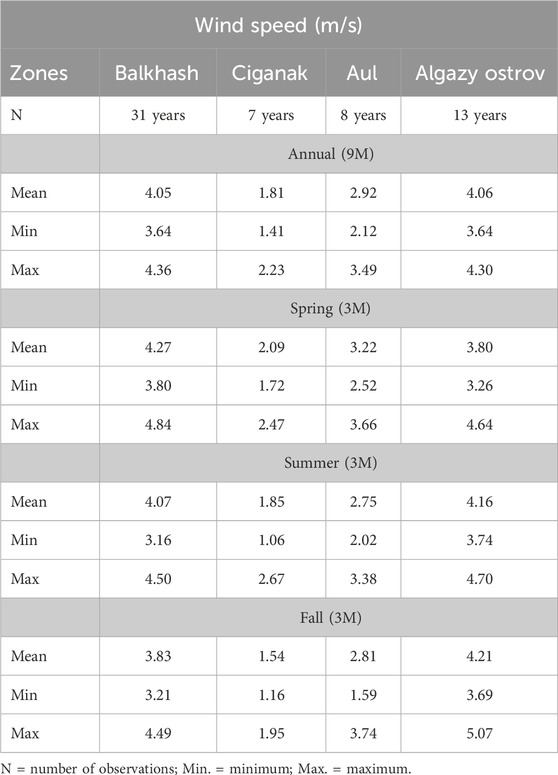
Table 4. Zone-wise statistics of the wind speed (Ws) variations at four wind stations near Balkhash.
The Ciganak weather station (locally known as Shyghanak) is located at the southernmost extent of the western sub-basin (Figure 1), at 349 m asl. Wind regimes at this locality are considerably calmer, mostly in the 0–4 m/s range and with a northerly to north easterly trajectory (Figure 5B; Table 4); calm conditions are experienced 38.15% of the time. All three seasons experience low wind strength in all the three seasons (Figure 5B; Table 4), and there is no clear temporal trend in wind speed or direction at both annual and seasonal scales (Figure 5ii, Supplementary Figure S4ii; Table 2).
Aul weather station is located in the Ile delta, at an of 353 m asl and approximately −24 km south of Lake Balkhash zone II. This locality experiences a similar wind regime to Balkhash, experiencing predominantly north-easterly winds, a greater proportion of easterly winds and some westerly air flow. Wind speeds are on average slower than at Balkhash; wind speeds of 0–4 m/s account for 15% of the annual average, and 4–8 m/s for 10% of the time (Figure 5C; Table 4). The trend analysis at this station also suggests no significant correlation at annual and seasonal scale (Figure 5iii, Supplementary Figure S4iii; Table 2).
The Algazy Ostrov weather station (locally known as Alghazy Island) is the only locality with data for the eastern sub-basin; it lies at 349 m asl at the western end of zone IV. This station experiences the most frequent stronger winds. It is dominated by frequent easterly wind vectors (27% of time), with significant periods of north-easterly and westerly winds, and calm conditions 15.15% of the time. The seasonal wind trend indicates an average wind speed of −4.06 m/s (Figure 5D; Table 4). Winds in the summer months appear to be stronger at Algazy Ostrov unlike seasonal variability at the other weather stations (r = 0.80; p = 0.001) (Figure 5iv, Supplementary Figure S4iv; Table 2), suggesting a localised wind effect in the eastern sub-basin during summer.
Based on the wind statistics we performed time series trend analysis using linear regression of the available datasets. We observe no significant correlation between wind strength and time over the observation period, at annual or seasonal timescales, for any of the weather stations (Figure 5; Supplementary Figure S4; Table 2). This suggests that lake Balkhash is influenced by variable wind patterns dominated by low wind speeds, perhaps influenced by local topographical features.
3.2 Spatiotemporal analysis of anthropogenic variables at Lake Balkhash
Overall, we observe a trend of significant correlation for water level (WL), with increasing over the 1991–2022 period at both annual and seasonal scales. Similarly, the different LULC variables around the Lake Balkhash shows significant correlation with time over the study period. The data in detail are presented in the following sub-sections. The details of these observations are further elaborated in the subsequent sub-sections.
3.2.1 Water level variability
The synthesised annual (9M) and seasonal variations in water levels (WL) at Lake Balkhash for the period 1993–2022 are illustrated in Figure 6. We observe a statistically significant and positive correlation (r = 0.75; p = 0.000) between WL fluctuation and time, suggesting an overall increase in lake WL during the study period (Table 2). The low p-value suggests a high level of confidence in the observed correlation, indicating that our results are not just due to random variability (Table 2). The interannual (9M) time series WL data for the 1993–2022 period reveals an apparently increasing trend, with a mean annual increase in height of +5.0 cm/9M, and an average water level of 342.37 m asl. The minimum and maximum water level recorded during the study period is 341.44 m asl (1993) and 343.03 m asl (2018) (Table 1). The WL trend appears to fluctuate cyclically over the study period; this may be attributed to an seasonal increase in surface runoff accelerated by the melting of mountain glaciers and snowmelt that feed the Lake Balkhash (Matsuyama and Kezer, 2009).
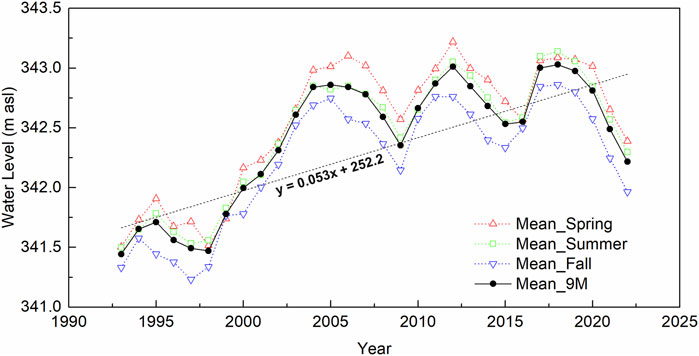
Figure 6. Mean interannual and seasonal scale temporal trend of the water level (WL) data obtained from LEGOS Hydroweb altimetry data repository for Lake Balkhash between 1993 and 2022 (with no year gap).
Despite the apparent trend of increasing water levels, there are substantial interannual fluctuations. We observe a rise in WL over the period 1992–1994, a subsequent steady decrease until 1998, followed by a substantial and rapid increase by 1.42 m (a rate of 16 cm/yr) until 2006. In the subsequent years, the lake WL experienced two decreases and rises, with low stands in 2009 (342.41 m asl) and 2015 (342.51 m asl). The most recent lake level rise occurred over 2017–2018, with the highest WL for the observation period reached in 2018 with 343.03 m asl (Cao et al., 2022). Lake levels have been falling ever since at a rate of 21 cm/yr and reached a level equivalent to that of 2002 in our final observation year 2022. This decline exhibited a steep negative trend with a strong correlation (r = −0.914; p = 0.004). This decline may be attributed to land use change in the form of conversion of steppe pastures to irrigated agricultural fields in the upstream (Chinese) part of the Ile catchment (0.74 × 10³ km2/year from 1992 to 2015). In addition, population growth in the catchment (850 persons/sq.km/5 years), may have reduced inflow to the lake (Pueppke et al., 2018a; Duan et al., 2020).
We observe a seasonal cyclicity in lake WL across the three calendar seasons for which data were available (Figure 6; Table 2). The spring WL fluctuates the most; we observe a maximum WL of 343.22 m asl in 2012 and a minimum of 341.50 m asl in 1993. The fall season yields the lowest lake levels, with a minimum of 341.23 m asl in 1997 and maximum of 342.86 m asl in 2018. The WL ordinates of the summer seasons are intermediate between the spring and fall levels and reach a maximum of 343.1 m asl in 2012 and in 2017–19, and a minimum of 341.5 m asl in 1993 (Figure 6). The seasonal trend and correlation between WL fluctuation and time also suggests significant positive correlation in all the three seasons (spring r = 0.74; p = 0.000, summer r = 0.77; p = 0.000, and fall r = 0.72; p = 0.000), suggesting an overall tendency for increasing lake WL during the different seasons (Table 2).
The available WL zone I, II, and III, the Ile River contributes the majority of water during the spring months and is directly influenced by ice melting and river flow regulation (Sala et al., 2016). In contrast, Karatal and other rivers (Figure 1) dominate inflow in Zones IV and V; some of these rivers currently provide no discharge to the lake.
3.2.2 Landuse landcover dynamics
Figure 7 shows the temporal timeseries trend of the reclassified LULC variables used in the present study based on the detailed statistics (areal percentage; %) analyzed for the period 1992–2020, as shown in Supplementary Table S2. The overall aerial statistics of Ile-Balkhash basin shows the dominance of grasslands, which account for approximately 60% of the total basin area. These grasslands are majorly dominated in the eastern, northern, and western lake margins, which are largely an elevated topography. However, the timeseries trend of grassland shows a substantial decrease from 58.88% to 57.63% in the areal extent between 1992 and 2020 (Figure 7A; Supplementary Table S2). Between 2001 and 2007, the Ile-Balkhash basin show a sudden decrease in the grassland portion (Figure 7A). Similarly, the southwestern and southern parts of lake vicinity have shrubland, bareland, and wetland as major LULC variables situated on low-rise topography sloping in a southeast-northwest direction (Supplementary Figure S4). The timeseries trend of shrubland show an increment of 12.57% (1992) to 14.26% (2020) of area followed by wetland (2.16%–2.18%), urban areas (0.3%–0.23%) and forests (2.40%–3.53%) between 1992 and 2020 (Figure 7; Supplementary Table S2). Bareland on the other hand has decreased substantially by 10.06% to almost 6.84% during the period (Figure 7C; Supplementary Table S2). Looking at the variable trend within the LULC variables, we investigate the statistical trend and correlation with time. We observe a statistically significant and negative correlation in bareland (r = −0.973; p = 0.000) and grassland (r = −0.494; p = 0.008) over the study period (Table 5), suggesting a decrease in the overall areal percentage (Figure 7C). However, there is a positive correlation between shrubland, cropland, urban land, wetland, and snow and ice over time. This positive trend indicates an overall increase in the areal percentage over time. It is also evident from the analysis that interconversion of one or the other variables over time has taken place (Table 5; Supplementary Table S2). The low p-value <0.05 (excluding the waterbodies) suggests a high level of confidence in the observed correlation between these variables over the study period, indicating that our results are not merely due to random variability (Table 5).
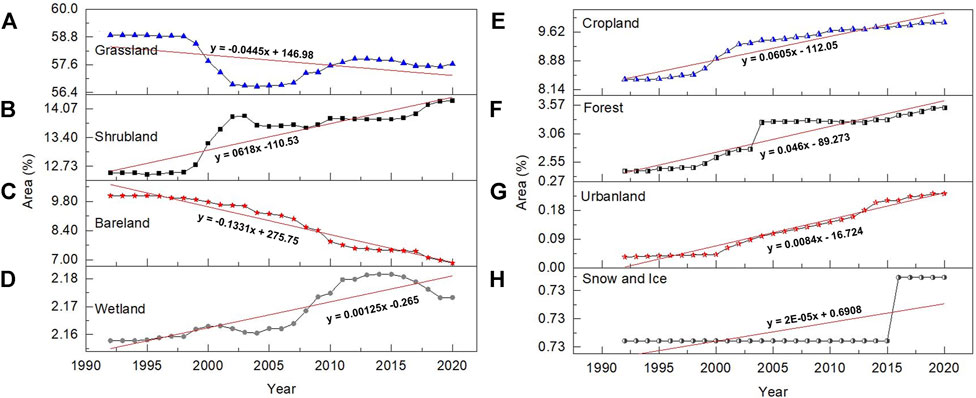
Figure 7. Plots (A–H) showing the temporal trend of LULC variables for Ile-Balkhash basin over the study period of 1992–2020.
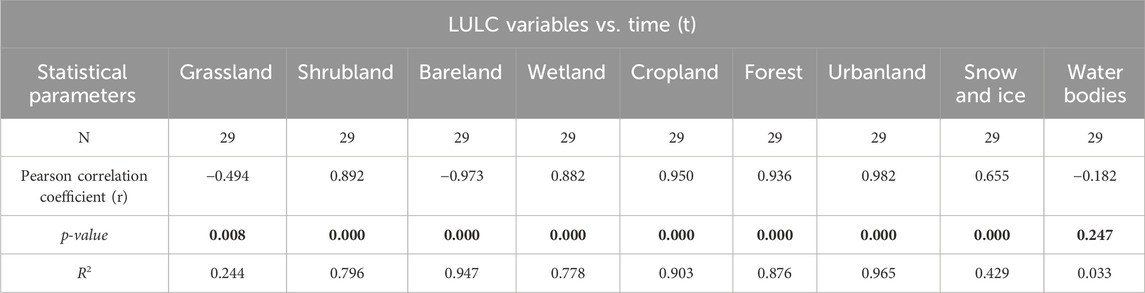
Table 5. Pearson correlation coefficient (r) and significance (p-value) of different LULC variables used in the surface water turbidity assessment at annual scales between the years 1992–2020.
3.3 Spatiotemporal variability of water turbidity index (NDTI) at Lake Balkhash
The overall spatio-temporal trend of NDTI at Lake Balkhash for the observation period is provided in Figure 8. Averaged NDTI values range from −0.149 to −0.044 and therefore correspond to slightly turbid conditions. Time-series analyses of the annual NDTI trend show an overall decrease in turbidity through time (r = −0.865; p = 0.000), with short-lived peaks and troughs in NDTI values (Figure 9A; Table 2). The period 1991–1996 experienced the highest turbidity values, with a peak of −0.059 in 1996. Other short-lived peaks occurred in 2001 (−0.091) and 2010–2011 (−0.090 and −0.091 respectively), and smaller turbidity peaks in 2017 and 2019.
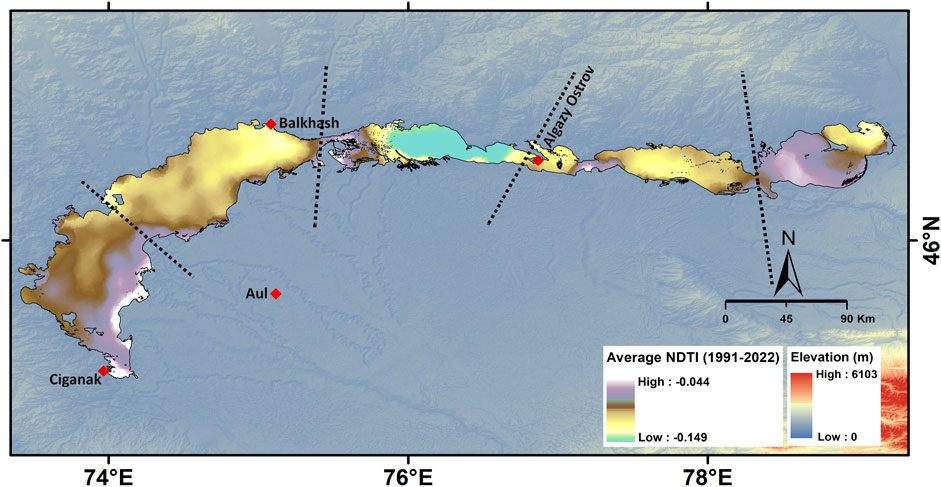
Figure 8. Map shows the zone-wise distribution of the mean annual turbidity of Lake Balkhash derived from the randomly selected 2000 NDTI points from 1991 to 2022 with base elevation map.
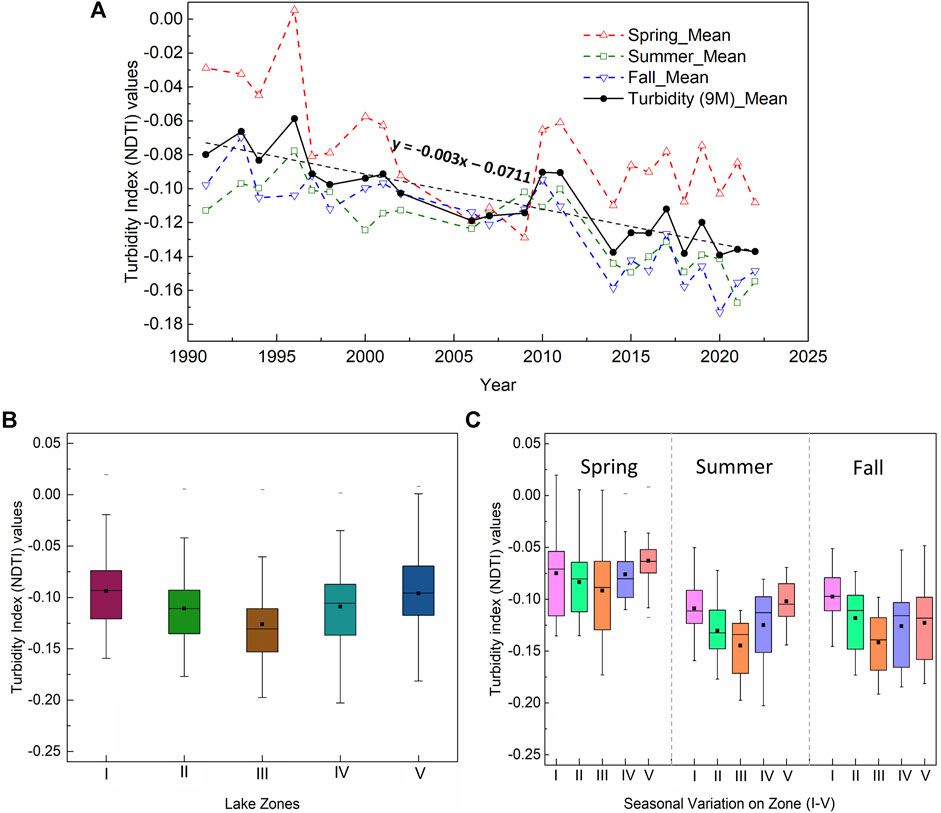
Figure 9. (A) Temporal trend of the turbidity index (NDTI) variable at mean interannual and seasonal scale; (B) and (C) Box plots of the zone-wise distribution of NDTI at annual and seasonal scales.
We also observe differences in turbidity between the seasons (Figure 9A). Turbidity during the spring season fluctuates more substantially between the years than during summer and fall; spring NDTI values indicate high turbid water. There is a significant and strong trend of decreasing turbidity for each of the seasons (spring r = −0.620; p = 0.002; summer r = −0.815; p = 0.000; fall r = −0.856; p = 0.000), which underscores the annual time-series trend (Figure 9A; Table 2). The trend of decreasing turbidity is strongest for the fall and summer seasons. Less turbid water is likely to be the product of a range of factors including reduced runoff into the lake, changes in precipitation patterns, land use, or improved water quality management practices.
We summarise the spatial variability of both annual and seasonal NDTI values derived from the different zones in Figure 9B. We observe the lowest annual average NDTI in the central Zone III; turbidity increases towards the eastern and western extremities of the lake (Figure 9B; Table 3). This spatial trend is echoed by NDTI values for the summer and fall months. The spring season experiences relatively higher ordinates of turbidity and a less pronounced spatial trend (Figure 9C; Table 3).
3.4 Correlation between turbidity and exploratory variables
To further assess the dominant factors affecting lake turbidity in an arid climate, we investigated potential correlation between the five exploratory variables, i.e., P, T, Ws, WL, LULC, and NDTI variation. On an inter-annual basis, NDTI displays a negative correlation with most of the variables. We find no significant relationship between NDTI and P (r = −0.074, p = 0.371), and between NDTI and Ws (all 4 stations) (Table 6). However, we observe a moderate negative association between NDTI and T (r = −0.532, p = 0.010). We also find a significant negative correlation between NDTI and WL (r = −0.696, p = 0.001) (Table 6). These correlations suggest that higher turbidity is associated with lower temperatures and lower water levels and vice versa.
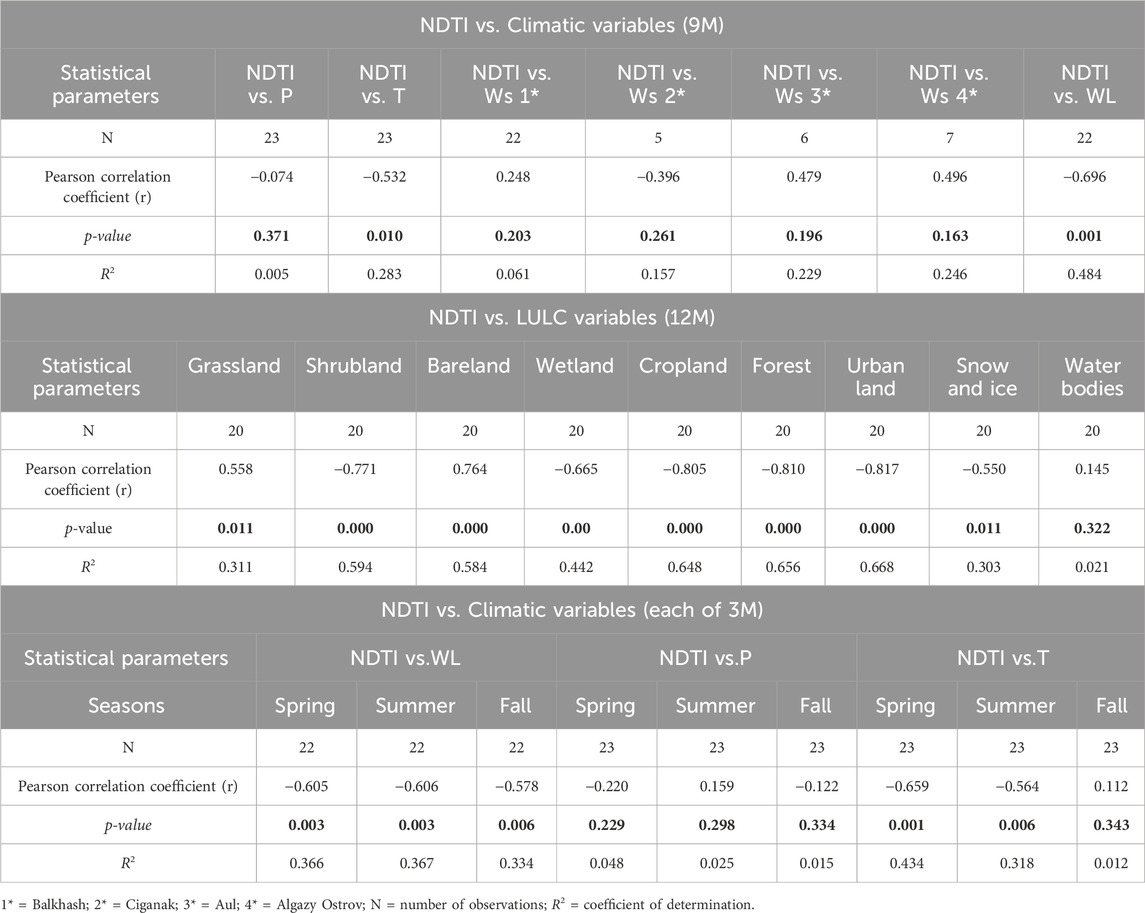
Table 6. Pearson correlation coefficient (r) and significance (p-value) of turbidity index (NDTI) vs. other variables, including precipitation (P), temperature (T), wind speed (Ws), water level (WL) and LULC variables used in the surface water turbidity assessment at interannual and seasonal scales.
Similarly, we conducted statistical trend analysis to establish the correlation between the major LULC classes and NDTI (Table 6) in the present study area. Examining the major LULC classes around the lake, we observe a strong positive correlation between NDTI and bareland (r = 0.764, p = 0.000) and a moderate positive correlation with grassland (r = 0.558, p = 0.011). However, the percentage statistics of these two variables indicate a relative decrease in the areal extent (Figure 7; Supplementary Table S2). On the other hand, shrubland (r = −0.771; p = 0.000), and wetland (r = −0.665; p = 0.000), which dominate the southern part of Lake Balkhash, exhibit a negative correlation with NDTI at the annual scale (Table 6). Whereas, the statistics of these variables reveal an increase in the areal percentage over time (Supplementary Table S2). An overall assessment suggests that an increase in shrubland and wetland, with a relative decrease in grassland and bareland in the vicinity of Lake Balkhash, has a significant impact on reducing sediment availability to the lake turbidity (Table 6). Also, the other LULC variables such as cropland, forests, urban land, and snow and ice as distributed in the basin exhibit strong and negative correlation with NDTI, with their relatively low and indirect contribution to turbidity dynamics.
We further repeated this statistical analysis for the available seasonal datasets to better understand the trends in variability specifically for water levels and temperature with the NDTI (Table 6). We observe a strong negative correlation between NDTI and both T (r = −0.659; −0.564 and p = 0.001; 0.006) and WL (r = −0.605; −0.606 and p = 0.003; 0.003) during the spring and summer seasons. However, during fall, NDTI only yields a statistically significant correlation with WL and not with T (r = −0.578 and p = 0.006) (Table 6). This result suggests that WL fluctuations may have a more pronounced impact on turbidity, particularly during fall. These findings emphasize the influence of T and WL on turbidity dynamics at Lake Balkhash.
4 Discussion
4.1 Effect of climatic and anthropogenic variables on turbidity change
We observe clear spatial and temporal variability in the NDTI of Lake Balkhash waters over the time period 1991–2022. Since the lake is situated in an arid climatic setting (Pueppke et al., 2018a), we selected the five exploratory variables i.e., P, T, Wd/s, WL and LULC as those most likely to elucidate the controls on lake turbidity at annual and seasonal timescales. We group these variables into two categories: a) entirely natural factors such as precipitation, temperature and wind, and b) parameters reflecting a coupling between climate and anthropogenic influence. We assume water level to correspond to the latter category, since Lake Balkhash is a regulated system and its flow is almost regulated by dams and diversions (Dostay et al., 2012; Pueppke et al., 2018a).
We find minimal correlation between NDTI and precipitation (Table 6), and attribute this to the weak effect of direct precipitation over the lake in the study area (Duan et al., 2020; Salnikov et al., 2023). This is despite of an overall trend of increasing precipitation (Figure 3A) over the observation period reported across the river basin (Matsuyama and Kezer, 2009; Propastin, 2012; Yu et al., 2021), in particular in the spring and summer seasons (Duan et al., 2020). Our results clearly suggest that local precipitation over the lake has minimal impact on turbidity variation, most likely relating to the small absolute amount of rainfall as well as high rates of evaporation loss from large water bodies (Dostay et al., 2012; Pueppke et al., 2018a; Yu et al., 2021; Albarqouni et al., 2022) arid and semi-arid climatic settings. At the catchment scale, precipitation is much higher in the headwater regions, and is particularly pronounced in the climatically diverse Ile-Balkhash catchment; catchment-scale rainfall and snow has an indirect impact on surface runoff and stream discharge upstream region (Petr, 1992; Göransson et al., 2013; Yu et al., 2021). The impact of catchment-scale precipitation is evidenced by large floods following extreme rainfall events; such events controls a considerable part of the sediment load being transported into dryland lakes such as Lake Balkhash, so driving short-lived turbidity fluctuations (Karthe, 2018; Duan et al., 2020). Unfortunately, the scope of our study prevented the investigation of specific events such as floods and the quantification of NDTI resulting from such events.
Although impacts of wind strength has been reported to impact turbidity in arid zone water bodies (Wu et al., 2013; Ouni et al., 2019), we observe no statistical correlation between turbidity and wind regime parameters at Lake Balkhash (Table 6). It is also been reported that western part of the lake observed less frequent strong winds than in the eastern part (Ivkina, 2022). This may be explained by the local topographic context of the Lake Balkhash coastline and surrounds. The western and northern lake shorelines are up to 30 m above the base lake level (Figure 1), with rocky uneven terrain; this relatively high topographic difference may act as a natural barrier to air flow, preventing strong winds and associated storm surges reaching inland and causing turbidity within the water (Ivkina, 2022). On the other hand the deeper, narrower, and dissected eastern sub-basin prevents the generation of sizeable waves and therefore there is no or limited wind-driven turbidity in that region (Sala et al., 2020; Ivkina, 2022). The one place where wind regimes may have an influence on turbidity is in the southern part of the lake, which has a very low relief shoreline, with abundance of loose alluvial and aeolian sediments and slightly stronger wind speeds with a N-NE orientation (Issanova et al., 2015; Sala et al., 2020). Under these conditions, winds may disturb the lake bottom sediments in the shallow southern part, partly contributing to turbidity in zones I and II (Petr, 1992; Ivkina, 2022).
More significantly, we observe a clearer and stronger connection between NDTI and temperature (T) as well as water level (WL). These parameters likely govern most of the turbidity fluctuations at annual and seasonal time scales. We propose that temperature is one of the dominant factor in this region, controlling process-feedbacks for turbidity in Lake Balkhash. Several studies have documented increasing temperatures in this region (Propastin, 2012; Qi et al., 2020), resulting in high evaporation rates (Abdrahimov et al., 2020) and exacerbating discharge patterns through an increase in water level (Qi et al., 2020; Moldakhanova et al., 2023). It is important to note that the major contributing rivers - Ile, Karatal, Lepsy and Aksu - are fed by glaciers and snowmelt, and are consequently highly sensitive to temperature-driven impacts (Kaldybayev et al., 2016; Sala et al., 2016; Mischke, 2020; Cao et al., 2022) on runoff and the seasonal distribution of water. During winter, the lake is mostly frozen; the lake surface starts melting in the early March, with the onset of spring (Petr, 1992). This phenomenon elevates seasonal turbidity variation in the lake due to the loss of lake ice cover and large temperature fluctuations (Ivkina, 2022). Rising temperatures also affect spring snowmelt in the upstream reaches (Duan et al., 2020; Zhang Q. et al., 2022), increasing water levels as well as sediment input to the lake (Karthe, 2018; Panyushkina et al., 2018). Frequent event-based flooding due to local snow melt in the spring (Petr, 1992; Yapiyev et al., 2017; Salnikov et al., 2023) also contributes to the lake turbidity. Although, both spring and summer are dominated by high water inflow from the upstream regions, the lake water level is ultimately controlled by regulated discharge from the Kapshagay dam which also controls sediment transport downstream (Pueppke et al., 2018a; Panyushkina et al., 2018; Mukhitdinov et al., 2020). Nevertheless, high temperatures combined high water inflow moderates the input of sediment to Lake Balkhash in the spring, reducing spring turbidity relative to summer (Sala et al., 2016; Panyushkina et al., 2018). By fall, as temperatures decrease, there is reduced water inflow into the lake (Petr, 1992; Propastin, 2012), which further decreases the sediment contributions and subsequent turbidity.
Human induced LULC dynamics also have a major impact in driving the water turbidity in inland lakes from local to regional scale (Li et al., 2014; Baltodano et al., 2022; Zhang L. et al., 2022). The different LULC pattern observed across the basin has a significant bearing in driving the turbidity of a lake. For instance, the expansion of grassland or shrubland areas around the lake serves as a protective cover and the root systems effectively bind the soil, reducing erosion caused by wind and water (De Baets et al., 2011; Zhang et al., 2013). Furthermore, they intercept rainfall, minimising soil disturbance and consequently reducing surface runoff carrying sediments into water bodies (Mohamadi and Kavian, 2015). This natural sediment trapping mechanism not only preserves soil integrity but also improves water quality by limiting the influx of pollutants into lakes, thereby safeguarding aquatic ecosystems and maintaining ecological balance. In our study, we observed an increase in shrubland areas (Figure 7B) within the basin, which has likely contributed to soil erosion control and, consequently, might have helped in reducing the lake water turbidity. The Ile-Balkhash basin has also been marked by an expansion of wetland areas, mostly associated with the southeastern part of the lake (Cao et al., 2022). These wetlands serve as natural filters, trapping sediment carried by runoff before it reaches the lake (Johnston, 1991; Mereta et al., 2020), thereby decreasing turbidity levels. In summary, the increase in wetland areas around Lake Balkhash can act as a vital mechanism for mitigating turbidity and promoting the overall health and ecological balance of inland lakes (Cao et al., 2022). Conversely, barren landscapes are prone to erosion, leading to sediment runoff and positively contribute to water turbidity. A change in barren areas in the region can significantly contribute to turbidity dynamics in nearby water bodies (Li and Xia, 2023). With vegetation replacing barren areas, soil erosion is minimized as roots bind the soil and vegetation intercepts rainfall, reducing sediment distribution along the lake river system in the Ile -Balkhash basin. Several studies put forward a strong link between the rapid urbanization and industrial areas with the detriment of river and lake water quality (Li et al., 2014; Pueppke et al., 2018b; Duan et al., 2020; Baltodano et al., 2022). However, in the present study reveals that although there is strong and negative correlation, of cropland, forests, urban land, and snow and ice majorly distributed in the upstream region, has an indirect control in turbidity variation in Lake Balkhash (Pueppke et al., 2018a; Duan et al., 2020). Therefore, these variables singularly or in combination impact the water quality of the associated water resources (Tahiru et al., 2020).
The spatial variability of NDTI values is dominated by inflow from the Ile River as the largest contributor to the Lake Balkhash (Petr, 1992; Mukhitdinov et al., 2020; De Boer et al., 2021), specifically to zones I and II in the western sub-basin. The Ile River is also responsible for most of the sediment influx responsible for its turbidity, giving the western sub-basin a yellow-gray color (visibility 5–10 m) and silty-sandy lake bottom deposits (Petr, 1992; Krupa et al., 2020; Mischke, 2020). The shallow western sub-basin, and its large surface area, are additional possible factors contributing to the high turbidity in that part of the lake (Ivkina, 2022; Myrzakhmetov et al., 2022). The eastern sub-basin, in particular zones IV and V, receives significantly lower sediment and water input (Petr, 1992; Mischke, 2020); it is also deeper with smaller surface area relative to water volume, and therefore has greater potential for clearer water (Ivkina, 2022). The central zone III in the eastern sub-basin experiences the lowest turbidity, since it is least affected by sediment inflow from the rivers. In summary, our study indicates a strong connection between water level and temperature as key drivers of turbidity at Lake Balkhash. Additional factors may contribute to water quality fluctuations which are subject to the influence of human activities and have not been considered in this study. The increase in human population in the Ile-Balkhash basin in the last several decades (Duan et al., 2020) has led to increased water consumption and changes in land use practices (Mukhitdinov et al., 2020) with an ultimate loss of natural land cover (Mischke, 2020; Huang et al., 2022). In addition, poor management of waste and sewage disposal from the municipal and industrial point sources, are also likely to have a localized impact on lake water quality (Karthe et al., 2015; Karthe, 2018; Mukhitdinov et al., 2020).
4.2 Implications of turbidity on ecology and ecosystem services
Monitoring and managing turbidity variations in waterbodies is essential for keeping the ecosystem healthy and for maintaining the services that we get from them. The time series analysis of the NDTI for Lake Balkhash reveals a significant reduction in water turbidity, signifying an enhancement in water clarity over the past 3 decades (Tilekova et al., 2016). The observed decrease in turbidity over 3 decades in Lake Balkhash can have several potential impacts on the ecology and ecosystem services (Huang et al., 2022). Clearer water conditions in the lake system has led to reduced mineralization and increased penetration of sunlight, which promotes the growth of aquatic vegetation and altering habitat structure (Krupa et al., 2014; Barinova et al., 2017). This, in turn, has affected the distribution and abundance of aquatic organisms and may lead to shifts in species composition (Pueppke S. et al., 2018). Some studies have reported the increase in zooplanktons, phytoplankton’s and fish spawning behavior and reproductive success of some species over the other in the Lake Balkhash (Tilekova et al., 2016; Pueppke S. et al., 2018). Overall, the changes in turbidity levels can influence trophic interactions and ecosystem functioning, potentially disrupting food webs and altering nutrient cycling processes (Imentai et al., 2015; Krupa et al., 2020). Therefore, highlighting the importance of continuous environmental monitoring and in-depth studies for effective management of turbidity is crucial for preserving the health of Lake Balkhash’s ecosystem.
4.3 Limitations and uncertainties
This study obtains valuable insights into the likely drivers of water quality variability and trends in Lake Balkhash. However, it is important to note that our study relies entirely on infrequent Earth observation datasets, and as such is limited by data gaps and may not adequately capture seasonal and short-term turbidity events. The accuracy of our interpretations can only be obtained by increasing the spatial and temporal resolution of the available datasets. In addition, it is important to recognize the significance of local factors specific to Lake Balkhash, including shoreline and lake basin characteristics, human land use practices within the basin, and inflows and sediment input from individual tributaries. These local influences can have a significant impact on turbidity levels within the lake.
The calibration and validation of our turbidity calculations against ground-based measurements are essential steps in ensuring the reliability of satellite-based assessments. The relatively remote setting and limited infrastructure at Lake Balkhash currently limits the opportunity for generating in-situ turbidity datasets over the observed time period both at spatial and temporal scale (Barinova et al., 2017; Krupa et al., 2020). However, several studies have make use of the remote sensing based indices (e.g., NDTI) which found to have strong correlation with the in-situ observation to highlight the usefulness of the satellite imageries in water resource management in various climatic settings (Baughman et al., 2015; Bid and Siddique, 2019; Elhag et al., 2019; Kaplan et al., 2019). Putting this forward, future efforts should be directed toward collecting and integrating ground-based data for an observed period to improve the accuracy and reliability of turbidity forecasting using remote sensing observations at Lake Balkhash.
5 Conclusion
In this study we make use of remote sensing techniques to monitor water quality and sedimentation in a large, arid zone inland lake. In developing countries, there is limited capacity for monitoring lakes such as Balkhash; these circumstances can be overcome using freely available remote sensing based NDTI techniques. The stepwise statistical analysis undertaken here is a very useful approach for understanding how processes in natural systems are affected by human activities.
Under the combined influence of the climatic and anthropogenic variables, the turbidity patterns show significant spatial and temporal variations at Lake Balkhash. Interannual and seasonal turbidity variations indicate the critical influence of temperature and water level over the last 3 decades. It is also noted that change in the LULC patterns in the Ile-Balkhash basin over the time has significantly impacted the turbidity dynamics of Lake Balkhash. Spatial variation is primarily driven by the inflow from the major rivers, which is actually regulated by reservoirs. In addition to the major controlling factors, there are other localised factors which can have influence turbidity variations which have not been considered in the present study.
Overall, the present study illustrates the potential of a remote sensing approach to identify turbid zones in the absence of or with limited in-situ and observed data. The results highlight the significant impact of rising temperatures and anthropogenically influenced water levels and LULC variables on turbidity in Lake Balkhash, Kazakhstan. Therefore, the study emphasizes that the warming climate and alterations in the lake’s hydrology as well as land use dynamics have a considerable impact on water quality. This suggests that monitoring water health alone may not suffice to mitigate the impacts of climate change and human activities on water quality unless we reduce emissions, cap warming, and stop interfering with the lake’s hydrology and landscape configuration. These actions are necessary to sustainably manage and conserve dryland water resources.
Data availability statement
Publicly available datasets were analyzed in this study. This data can be found here: All data sources are mentioned in the manuscript under section “Data and Methods.” Datasets are available on request: The raw data supporting the conclusions of this article will be made available by the authors, without undue reservation.
Author contributions
KM: Conceptualization, Data curation, Formal Analysis, Funding acquisition, Investigation, Methodology, Project administration, Resources, Validation, Visualization, Writing–original draft, Writing–review and editing. BC: Data curation, Formal Analysis, Writing–review and editing, Methodology. KF: Methodology, Resources, Supervision, Validation, Visualization, Writing–review and editing.
Funding
The author(s) declare that financial support was received for the research, authorship, and/or publication of this article. This research was funded by the Federal Ministry of Education and Research (BMBF) and Baden-Württemberg Ministry of Science as a part of Excellence Strategy of the German Federal and State Governments. Grant number (PRO-MISHRA-2023-12).
Acknowledgments
We also acknowledge support by the Open Access Publishing Fund of University of Tübingen. We sincerely thank the two reviewers and Kanat Samarkhanov (Editor) for the thoughtful and thorough reviews, which have significantly improved the clarity of the manuscript.
Conflict of interest
The authors declare that the research was conducted in the absence of any commercial or financial relationships that could be construed as a potential conflict of interest.
Publisher’s note
All claims expressed in this article are solely those of the authors and do not necessarily represent those of their affiliated organizations, or those of the publisher, the editors and the reviewers. Any product that may be evaluated in this article, or claim that may be made by its manufacturer, is not guaranteed or endorsed by the publisher.
Supplementary material
The Supplementary Material for this article can be found online at: https://www.frontiersin.org/articles/10.3389/fenvs.2024.1371759/full#supplementary-material
References
Abdelbaki, A. M. (2022). Suggested solutions for the problems of salinity increase and cumulated pollution in lake Qarun, Egypt: present and future (A review). Ain Shams Eng. J. 13 (3), 101588. doi:10.1016/j.asej.2021.09.015
Abdrahimov, R., Amirgaliyeva, A., Tastambek, K., Zhumalipov, A., and Polyakova, S. (2020). Annual river runoff of the ile-balkash basin and prospects of its assessment due to climatic changes and water economy activities. Int. J. GEOMATE 18 (69), 230–239. doi:10.21660/2020.69.32068
Ahmed, R., Rawat, M., Wani, G. F., Ahmad, S. T., Ahmed, P., Jain, S. K., et al. (2022). Glacial Lake outburst flood hazard and risk assessment of gangabal lake in the upper jhelum basin of kashmir himalaya using geospatial technology and hydrodynamic modeling. Remote Sens. 14 (23), 5957. doi:10.3390/rs14235957
Albarqouni, M. M. Y., Yagmur, N., Bektas Balcik, F., and Sekertekin, A. (2022). Assessment of spatio-temporal changes in water surface extents and lake surface temperatures using Google Earth engine for lakes region, türkiye. ISPRS Int. J. Geo-Information 11 (7), 407. doi:10.3390/ijgi11070407
Allouche, J. (2007). “The governance of central asian waters: national interests versus regional cooperation in disarm,” in Forum, 46–55.
Baban, S. M. J. (1993). Detecting water quality parameters in the norfolk broads, U.K., using landsat imagery. Int. J. Remote Sens. 14, 1247–1267. doi:10.1080/01431169308953955
Baltodano, A., Agramont, A., Reusen, I., and van Griensven, A. (2022). Land cover change and water quality: how remote sensing can help understand driver–impact relations in the Lake titicaca basin. WaterSwitzerl. 14 (7), 1021. doi:10.3390/w14071021
Barinova, S., Krupa, E., and Kadyrova, U. (2017). Spatial dynamics of species richness of phytoplankton of Lake Balkhash in the gradient of abiotic factors. Transylv. Rev. Syst. Ecol. Res. 19 (2), 1–18. doi:10.1515/trser-2017-0009
Baughman, C., Jones, B., Bartz, K., Young, D., and Zimmerman, C. (2015). Reconstructing turbidity in a glacially influenced lake using the landsat TM and ETM+ surface reflectance climate data record archive, lake clark, Alaska. Remote Sens. 7 (10), 13692–13710. doi:10.3390/rs71013692
Bid, S., and Siddique, G. (2019). Identification of seasonal variation of water turbidity using NDTI method in Panchet Hill Dam, India. Model. Earth Syst. Environ. 5 (4), 1179–1200. doi:10.1007/s40808-019-00609-8
Cao, Y., Ma, Y., Liu, T., Li, J., Zhong, R., Wang, Z., et al. (2022). Analysis of spatial–temporal variations and driving factors of typical tail-reach wetlands in the ili-balkhash basin, central Asia. Remote Sens. 14 (16), 1–19. doi:10.3390/rs14163986
Caves, J. K., Winnick, M. J., Graham, S. A., Sjostrom, D. J., Mulch, A., and Chamberlain, C. P. (2015). Role of the westerlies in central Asia climate over the cenozoic. Earth Planet Sci. Lett. 428, 33–43. doi:10.1016/j.epsl.2015.07.023
Chaudhari, S., Felfelani, F., Shin, S., and Pokhrel, Y. (2018). Climate and anthropogenic contributions to the desiccation of the second largest saline lake in the twentieth century. J. Hydrol. 560, 342–353. doi:10.1016/j.jhydrol.2018.03.034
Cherednichenko, A. V., Cherednichenko, A. V., Cherednichenko, V. S., Storozhenko, N. D., Kozhachmetova, E. P., Kupchishin, A. I., et al. (2019). Dynamic of Balkhash lake level under climate change conditions. IOP Conf. Ser. Earth Environ. Sci. 321 (1), 012012. doi:10.1088/1755-1315/321/1/012012
Chub, V. E. (2000). “Climate change and its impact on natural resources potential of the Republic of Uzbekistan,” in Main administration on hydrometeorology under the cabinet of ministers of.
Crétaux, J. F., Arsen, A., Calmant, S., Kouraev, A., Vuglinski, V., Bergé-Nguyen, M., et al. (2011). SOLS: a lake database to monitor in the Near Real Time water level and storage variations from remote sensing data. Adv. Sp. Res. 47 (9), 1497–1507. doi:10.1016/j.asr.2011.01.004
De Baets, S., Poesen, J., Meersmans, J., and Serlet, L. (2011). Cover crops and their erosion-reducing effects during concentrated flow erosion. CATENA 85 (3), 237–244. doi:10.1016/j.catena.2011.01.009
De Boer, T., Paltan, H., Sternberg, T., and Wheeler, K. (2021). Evaluating vulnerability of central asian water resources under uncertain climate and development conditions: the case of the ili-balkhash basin. WaterSwitzerl. 13 (5), 615. doi:10.3390/w13050615
Dekker, A. G., Vos, R. J., and Peters, S. W. M. (2001). Comparison of remote sensing data, model results and in situ data for total suspended matter (TSM) in the southern Frisian lakes. Sci. Total Environ. 268 (1–3), 197–214. doi:10.1016/s0048-9697(00)00679-3
Deng, H., and Chen, Y. (2017). Influences of recent climate change and human activities on water storage variations in Central Asia. J. Hydrol. 544, 46–57. doi:10.1016/j.jhydrol.2016.11.006
de Vente, J., Poesen, J., Bazzoffi, P., Van Rompaey, A., and Verstraeten, G. (2006). Predicting catchment sediment yield in mediterranean environments: the importance of sediment sources and connectivity in Italian drainage basins. Earth Surf. Process Landforms 31 (8), 1017–1034. doi:10.1002/esp.1305
Dostay, Z., Alimkulov, S., Tursunova, A., and Myrzakhmetov, A. (2012). Modern hydrological status of the estuary of Ili River. Appl. Water Sci. 2 (3), 227–233. doi:10.1007/s13201-012-0034-5
Duan, W., Zou, S., Chen, Y., Nover, D., Fang, G., and Wang, Y. (2020). Sustainable water management for cross-border resources: the balkhash Lake Basin of central Asia, 1931–2015. J. Clean. Prod. 263, 121614. doi:10.1016/j.jclepro.2020.121614
Dubovyk, O., Ghazaryan, G., González, J., Graw, V., Löw, F., and Schreier, J. (2019). Drought hazard in Kazakhstan in 2000–2016: a remote sensing perspective. Environ. Monit. Assess. 191 (8), 510. doi:10.1007/s10661-019-7620-z
Elhag, M., Gitas, I., Othman, A., Bahrawi, J., and Gikas, P. (2019). Assessment of water quality parameters using temporal remote sensing spectral reflectance in arid environments. Saudi Arabia. Water (Switzerland): MDPI.
Farooq, I., Shah, A. R., Sahana, M., and Ehsan, M. A. (2023). Assessment of drought conditions over different climate zones of Kazakhstan using standardised precipitation evapotranspiration index. Earth Syst. Environ. 7 (1), 283–296. doi:10.1007/s41748-022-00314-0
Fischer, A., Pang, D., Kidd, I., and Moreno-Madriñán, M. (2017). Spatio-temporal variability in a turbid and dynamic tidal estuarine environment (tasmania, Australia): an assessment of MODIS band 1 reflectance. ISPRS Int. J. Geo-Information 6 (11), 320. doi:10.3390/ijgi6110320
Fitzsimmons, K. E., Nowatzki, M., Dave, A. K., and Harder, H. (2020). Intersections between wind regimes, topography and sediment supply: perspectives from aeolian landforms in Central Asia. Palaeogeogr. Palaeoclimatol. Palaeoecol. 540, 109531. doi:10.1016/j.palaeo.2019.109531
Gaines, M. D., Tulbure, M. G., and Perin, V. (2022). Effects of climate and anthropogenic drivers on surface water area in the southeastern United States. Water Resour. Res. 58 (3), 1–22. doi:10.1029/2021wr031484
Gao, P. (2008). Understanding watershed suspended sediment transport. Prog. Phys. Geogr. 32 (3), 243–263. doi:10.1177/0309133308094849
Gao, P., and Josefson, M. (2012). Temporal variations of suspended sediment transport in Oneida Creek watershed, central New York. J. Hydrol. 426–427, 17–27. doi:10.1016/j.jhydrol.2012.01.012
Gardelle, J., Hiernaux, P., Kergoat, L., Grippa, M. G., et al. (2010). Less rain, more water in ponds: a remote sensing study of the dynamics of surface waters from 1950 to present in pastoral Sahel (Gourma region, Mali). Hydrol. Earth Syst. Sci. 14, 309–324. doi:10.5194/hess-14-309-2010
Garg, V., Senthil Kumar, A., Aggarwal, S. P., Kumar, V., Dhote, P. R., Thakur, P. K., et al. (2017). Spectral similarity approach for mapping turbidity of an inland waterbody. J. Hydrol. 550, 527–537. doi:10.1016/j.jhydrol.2017.05.039
Gholizadeh, M. H., Melesse, A. M., and Reddi, L. (2016). A comprehensive review on water quality parameters estimation using remote sensing techniques. Sensors Switz. 16, 1298. doi:10.3390/s16081298
Gitelson, A., Garbuzov, G., Szilyagi, F., Mittenwey, K. H., Karnieli, A., and Kaiser, A. (1993). Quantitative remote sensing methods for real-time monitoring of inland waters quality. Int. J. Remote Sens. 14 (7), 1269–1295. doi:10.1080/01431169308953956
Göransson, G., Larson, M., and Bendz, D. (2013). Variation in turbidity with precipitation and flow in a regulated river system-river Göta Älv, SW Sweden. Hydrol. Earth Syst. Sci. 17 (7), 2529–2542. doi:10.5194/hess-17-2529-2013
Gordon, L. J., Peterson, G. D., and Bennett, E. M. (2008). Agricultural modifications of hydrological flows create ecological surprises. Trends Ecol. Evol. 23 (4), 211–219. doi:10.1016/j.tree.2007.11.011
Hagenlocher, M., Renaud, F. G., Haas, S., and Sebesvari, Z. (2018). Vulnerability and risk of deltaic social-ecological systems exposed to multiple hazards. Sci. Total Environ. 631–632 (March), 71–80. doi:10.1016/j.scitotenv.2018.03.013
Hamilton, J., and Luffman, I. (2009). Precipitation, Pathogens, and turbidity trends in the little river, Tennessee. Phys. Geogr. 30 (3), 236–248. doi:10.2747/0272-3646.30.3.236
Harris, I., Jones, P. D., Osborn, T. J., and Lister, D. H. (2014). Updated high-resolution grids of monthly climatic observations - the CRU TS3.10 Dataset. Int. J. Climatol. 34 (3), 623–642. doi:10.1002/joc.3711
Huang, F., Ochoa, C. G., Jarvis, W. T., Zhong, R., and Guo, L. (2022). Evolution of landscape pattern and the association with ecosystem services in the Ili-Balkhash Basin. Environ. Monit. Assess. 194 (3), 171. doi:10.1007/s10661-022-09836-6
Imentai, A., Thevs, N., Schmidt, S., Nurtazin, S., and Salmurzauli, R. (2015). Vegetation, fauna, and biodiversity of the ile delta and southern Lake Balkhash - a review. J. Gt. Lakes. Res. 41 (3), 688–696. doi:10.1016/j.jglr.2015.04.002
IPCC (2019). Climate change and land: an IPCC special report. Clim Chang L IPCC Spec Rep Clim Chang Desertif L Degrad Sustain L Manag food Secur Greenh gas fluxes Terr Ecosyst 1–864. https://www.ipcc.ch/srccl/.
Islam, M., and Sado, K. (2006). Analyses of ASTER and spectroradiometer data with in situ measurements for turbidity and transparency study of lake Abashri. Int. J. Geoinformatics 2, 31–45.
Issanova, G., Abuduwaili, J., Kaldybayev, A., Semenov, O., and Dedova, T. (2015). Dust storms in Kazakhstan: frequency and division. J. Geol. Soc. India 85 (3), 348–358. doi:10.1007/s12594-015-0224-5
Ivkina, N. I. (2022). Water level variations on the balkash lake in the modern period. Hydrometeorol. Ecol. 106 (3), 6–13. doi:10.54668/2789-6323-2022-106-3-6-13
Jean-François, C., Sylvain, B., Adalbert, A., Muriel, B. N., and Mélanie, B. (2015). Global surveys of reservoirs and lakes from satellites and regional application to the Syrdarya river basin. Environ. Res. Lett. 10 (1), 015002. doi:10.1088/1748-9326/10/1/015002
Johnston, C. A. (1991). Sediment and nutrient retention by freshwater wetlands: effects on surface water quality. Crit. Rev. Environ. Control 21 (5–6), 491–565. doi:10.1080/10643389109388425
Kaldybayev, A., Chen, Y., and Vilesov, E. (2016). Glacier change in the karatal river basin, zhetysu (dzhungar) Alatau, Kazakhstan. Ann. Glaciol. 57 (71), 11–19. doi:10.3189/2016aog71a005
Kaplan, G., Avdan, Z. Y., Goncu, S., and Avdan, U. (2019). “Evaluation of RapidEye-3 satellite data for assessing water turbidity of Lake borabey,” in The 4th international electronic conference on water Sciences (Basel Switzerland: MDPI), 14.
Karthe, D. (2018). Environmental changes in central and east asian drylands and their effects on major river-lake systems. Quat. Int. 475, 91–100. doi:10.1016/j.quaint.2017.01.041
Karthe, D., Chalov, S., and Borchardt, D. (2015). Water resources and their management in central Asia in the early twenty first century: status, challenges and future prospects. Environ. Earth Sci. 73 (2), 487–499. doi:10.1007/s12665-014-3789-1
Kaushal, S. S., Likens, G. E., Pace, M. L., Reimer, J. E., Maas, C. M., Galella, J. G., et al. (2021). Freshwater salinization syndrome: from emerging global problem to managing risks. Biogeochemistry 154, 255–292. doi:10.1007/s10533-021-00784-w
Kezer, K., and Matsuyama, H. (2006). Decrease of river runoff in the Lake Balkhash basin in central Asia. Hydrol. Process 20 (6), 1407–1423. doi:10.1002/hyp.6097
Klein, I., Dietz, A. J., Gessner, U., Galayeva, A., Myrzakhmetov, A., and Kuenzer, C. (2014). Evaluation of seasonal water body extents in Central Asia over thepast 27 years derived from medium-resolution remote sensing data. Int. J. Appl. Earth Obs. Geoinf 26 (1), 335–349. doi:10.1016/j.jag.2013.08.004
Kogutenko, L., Severskiy, I., Shahgedanova, M., and Lin, B. (2019). Change in the extent of glaciers and glacier runoff in the Chinese sector of the Ile River basin between 1962 and 2012, 11. Water (Switzerland): MDPI, 1668. doi:10.3390/w11081668
Krupa, E., Barinova, S., and Aubakirova, M. (2020). Tracking pollution and its sources in the catchment-lake system of major waterbodies in Kazakhstan. Lakes Reserv. Sci. Policy Manag. Sustain Use 25 (1), 18–30. doi:10.1111/lre.12302
Krupa, E., Slyvinskiy, G., and Barinova, S. (2014). The effect of climatic factors on the long-term dynamics of aquatic ecosystem of the Balkhash lake (Kazakhstan, Central Asia). Adv. Stud. Biol. 6 (3), 115–136. doi:10.12988/asb.2014.4523
Kulkarni, A. (2011). Water quality retrieval from landsat TM imagery. Procedia Comput. Sci. 6, 475–480. doi:10.1016/j.procs.2011.08.088
Lacaux, J. P., Tourre, Y. M., Vignolles, C., Ndione, J. A., and Lafaye, M. (2007). Classification of ponds from high-spatial resolution remote sensing: application to Rift Valley Fever epidemics in Senegal. Remote Sens. Environ. 106 (1), 66–74. doi:10.1016/j.rse.2006.07.012
Li, J., and Xia, C. (2023). Drivers of spatial and temporal dynamics in water turbidity of China yangtze river basin. Water 15 (7), 1264. doi:10.3390/w15071264
Li, Y., Li, Y., Qureshi, S., Kappas, M., and Hubacek, K. (2014). On the relationship between landscape ecological patterns and water quality across gradient zones of rapid urbanization in coastal China. Ecol. Modell. 318, 100–108. doi:10.1016/j.ecolmodel.2015.01.028
Lucatello, S., and Huber-Sannwald, E. (2020). Sustainable development goals and drylands: addressing the interconnection. Springer Clim., 27–40.
Matsuyama, H., and Kezer, K. (2009). Long-term variation of precipitation around Lake Balkhash in Central Asia from the end of the 19th century. Sci. Online Lett. Atmos. 5 (1), 73–76. doi:10.2151/sola.2009-019
Mereta, S. T., De Meester, L., Lemmens, P., Legesse, W., Goethals, P. L. M., and Boets, P. (2020). Sediment and nutrient retention capacity of natural riverine wetlands in southwest Ethiopia. Front. Environ. Sci. 8 (July), 1–12. doi:10.3389/fenvs.2020.00122
Mischke, S. (2020). Large asian lakes in a changing world (Cham: Springer International Publishing). Available at: http://link.springer.com/10.1007/978-3-030-42254-7.
Mischke, S., Zhang, C., and Plessen, B. (2020). Lake Balkhash (Kazakhstan): recent human impact and natural variability in the last 2900 years. J. Gt. Lakes. Res. 46 (2), 267–276. doi:10.1016/j.jglr.2020.01.008
Mishra, S., and Kumar, A. (2021). Estimation of physicochemical characteristics and associated metal contamination risk in the Narmada river, India. Environ. Eng. Res. 26 (1), 1–11. doi:10.4491/eer.2019.521
Mohamadi, M. A., and Kavian, A. (2015). Effects of rainfall patterns on runoff and soil erosion in field plots. Int. Soil Water Conserv. Res. 3 (4), 273–281. doi:10.1016/j.iswcr.2015.10.001
Moldakhanova, N., Alimkulov, S., and Smagulov, Z. (2023). Analysis of changes in the ecological space of the Ili River delta (due to reduced flow of the Ili River). Evergreen 10 (1), 29–35. doi:10.5109/6781031
Molekoa, M. D., Kumar, P., Choudhary, B. K., Yunus, A. P., Kharrazi, A., Khedher, K. M., et al. (2022). Spatio-temporal variations in the water quality of the Doorndraai Dam, South Africa: an assessment of sustainable water resource management. Curr. Res. Environ. Sustain 4 (6), 100187. doi:10.1016/j.crsust.2022.100187
Mukhitdinov, A., Nurtazin, S., Alimova, S., Ablaikhanova, N., Yessimsiitova, Z., Salmurzauly, R., et al. (2020). The transformation of ecosystems of the ili river delta (Kazakhstan) under the flow regulation and climate change. Appl. Ecol. Environ. Res. 18 (2), 2483–2498. doi:10.15666/aeer/1802_24832498
Myrzakhmetov, A., Dostay, Z., Alimkulov, S., Tursunova, A., and Sarsenova, I. (2022). Level regime of Balkhash Lake as the indicator of the state of the environmental ecosystems of the region. Paddy Water Environ. 20, 315–323. doi:10.1007/s10333-022-00890-x
Newcomer, M. E., Kuss, A. J. M., Ketron, T., Remar, A., Choksi, V., and Skiles, J. W. (2014). Estuarine sediment deposition during wetland restoration: a GIS and remote sensing modeling approach. Geocarto Int. 29 (4), 451–467. doi:10.1080/10106049.2013.798356
Nurtazin, S., Thevs, N., Iklasov, M., Graham, N., Salmurzauli, R., and Pueppke, S. (2019). Challenges to the sustainable use of water resources in the Ili River basin of Central Asia. E3S Web Conf. 81, 1–19. doi:10.1051/e3sconf/20198101009
Ohashi, Y., Iida, T., Sugiyama, S., and Aoki, S. (2016). Spatial and temporal variations in high turbidity surface water off the Thule region, northwestern Greenland. Polar Sci. 10 (3), 270–277. doi:10.1016/j.polar.2016.07.003
Ouni, H., Kawachi, A., Irie, M., Ben, M., Barek, N., Hariga-Tlatli, N., et al. (2019). Development of water turbidity index (WTI) and seasonal characteristics of total suspended matter (TSM) spatial distribution in Ichkeul Lake, a shallow brackish wetland, Northern-East Tunisia. Environ. Earth Sci. 78 (6), 1–19. doi:10.1007/s12665-019-8126-2
Panyushkina, I. P., Meko, D. M., Macklin, M. G., Toonen, W. H. J., Mukhamаdiev, N. S., Konovalov, V. G., et al. (2018). Runoff variations in Lake Balkhash basin, central Asia, 1779–2015, inferred from tree rings. Clim. Dyn. 51 (7–8), 3161–3177. doi:10.1007/s00382-018-4072-z
Petr, T. (1992). Lake balkhash, Kazakhstan. Int. J. Salt Lake Res. 1 (1), 21–46. doi:10.1007/bf02904950
Propastin, P. (2012). Patterns of lake balkhash water level changes and their climatic correlates during 1992-2010 period. Lakes Reserv. Sci. Policy Manag. Sustain Use. 17 (3), 161–169. doi:10.1111/j.1440-1770.2012.00508.x
Pueppke, S., Iklasov, M., Beckmann, V., Nurtazin, S., Thevs, N., Sharakhmetov, S., et al. (2018c). Challenges for sustainable use of the fish resources from Lake Balkhash, a fragile lake in an arid ecosystem. Sustainability 10 (4), 1234. doi:10.3390/su10041234
Pueppke, S. G., Zhang, Q., and Nurtazin, S. T. (2018a). Irrigation in the Ili River basin of central Asia: from ditches to dams and diversion, 10. Water (Switzerland): MDPI, 1650. doi:10.3390/w10111650
Pueppke, S. G., Zhang, Q., and Nurtazin, S. T. (2018b). Irrigation in the Ili River basin of central Asia: from ditches to dams and diversion. WaterSwitzerl. 10 (11), 1–19. doi:10.3390/w10111650
Qi, J., Tao, S., Pueppke, S. G., Espolov, T. E., Beksultanov, M., and Chen, X. (2020). Changes in land use/land cover and net primary productivity in the transboundary Ili-Balkhash basin of Central Asia, 1995 – 2015 Changes in land use/land cover and net primary productivity in the transboundary Ili-Balkhash basin of Central Asia.
Richey, A. S., Thomas, B. F., Lo, M. H., Reager, J. T., Famiglietti, J. S., Voss, K., et al. (2015). Quantifying renewable groundwater stress with GRACE. Water Resour. Res. 51 (7), 5217–5238. doi:10.1002/2015wr017349
Rodell, M., Famiglietti, J. S., Wiese, D. N., Reager, J. T., Beaudoing, H. K., Landerer, F. W., et al. (2018). Emerging trends in global freshwater availability. Nature 557 (7707), 651–659. doi:10.1038/s41586-018-0123-1
Sala, R., Deom, J. M., Aladin, N. V., Plotnikov, I. S., and Nurtazin, S. (2020). “Geological history and present conditions of Lake Balkhash. Large Asian Lakes in a Changing World: Natural State and Human Impact,” in Springer water, 143–175. doi:10.1007/978-3-030-42254-7_5
Sala, R., Deom, J. M., Nigmatova, S., Endo, K., Kubota, J., et al. (2016). Soviet, recent plan studies of the behavior of the Balkhash lake. News of the National Academy of Science of the Republic of Kazakhstan. Ser. Geol. Tech. Sci. 2 (416), 76–86.
Salnikov, V., Talanov, Y., Polyakova, S., Assylbekova, A., Kauazov, A., Bultekov, N., et al. (2023). An assessment of the present trends in temperature and precipitation extremes in Kazakhstan. Climate 11 (2), 33. doi:10.3390/cli11020033
Shen, B., Wu, J., Zhan, S., Jin, M., Saparov, A. S., and Abuduwaili, J. (2021). Spatial variations and controls on the hydrochemistry of surface waters across the Ili-Balkhash Basin, arid Central Asia. J. Hydrol. 600 (2020), 126565. doi:10.1016/j.jhydrol.2021.126565
Tahiru, A. A., Doke, D. A., and Baatuuwie, B. N. (2020). Effect of land use and land cover changes on water quality in the nawuni catchment of the white volta basin, northern region, Ghana. Appl. Water Sci. 10 (8), 1–19. doi:10.1007/s13201-020-01272-6
Tang, H. L., Lu, S. L., Cheng, Y. P., Ge, L. Q., Zhang, J. K., Dong, H., et al. (2019). Analysis of dynamic changes and influence factors of Lake Balkhash in the last twenty years. J. Groundw. Sci. Eng. 7 (3), 214–223. doi:10.19637/j.cnki.2305-7068.2019.03.002
Teodoro, A. C., Veloso-Gomes, F., and Gonçalves, H. (2008). Statistical techniques for correlating total suspended matter concentration with seawater reflectance using multispectral satellite data. J. Coast Res. 24 (4 Suppl. L), 40–49. doi:10.2112/06-0770.1
Thevs, N., Beckmann, V., Akimalieva, A., Köbbing, J. F., Nurtazin, S., Hirschelmann, S., et al. (2017). Assessment of ecosystem services of the wetlands in the Ili River delta, Kazakhstan. Environ. Earth Sci. 76 (1), 30. doi:10.1007/s12665-016-6346-2
Tilekova, Z. T., Oshakbaev, M. T., and Khaustov, A. P. (2016). Assessing the geoecological state of ecosystems in the Balkhash region. Geogr. Nat. Resour. 37 (1), 79–86. doi:10.1134/s187537281601011x
Tyler, A. N., Svab, E., Preston, T., Présing, M., and Kovács, W. A. (2006). Remote sensing of the water quality of shallow lakes: a mixture modelling approach to quantifying phytoplankton in water characterized by high-suspended sediment. Int. J. Remote Sens. 27 (8), 1521–1537. doi:10.1080/01431160500419311
van Buuren, S., and Groothuis-Oudshoorn, K. (2011). mice: multivariate imputation by chained equations in R. J. Stat. Softw. 45 (3), 1–67. doi:10.18637/jss.v045.i03
Wang, J., Song, C., Reager, J. T., Yao, F., Famiglietti, J. S., Sheng, Y., et al. (2018). Recent global decline in endorheic basin water storages. Nat. Geosci. 11 (12), 926–932. doi:10.1038/s41561-018-0265-7
Wass, P. D., Marks, S. D., Finch, J. W., Leeks, G. J. L., and Ingram, J. K. (1997). Monitoring and preliminary interpretation of in-river turbidity and remote sensed imagery for suspended sediment transport studies in the Humber catchment. Sci. Total Environ. 194–195 (96), 263–283. doi:10.1016/s0048-9697(96)05370-3
Williams, W. D. (2000). Dryland lakes. Lakes Reserv. Sci. Policy Manag. Sustain Use. 5 (3), 207–212. doi:10.1046/j.1440-1770.2000.00116.x
Wu, T. feng, qiang, Q. B., wei, Z. G., Zhu, M. yuan, Li, W., and mei, L. C. (2013). Modeling of turbidity dynamics caused by wind-induced waves and current in the Taihu Lake. Int. J. Sediment. Res. 28 (2), 139–148. doi:10.1016/S1001-6279(13)60026-8
Wu, Z., Zhang, D., Cai, Y., Wang, X., Zhang, L., and Chen, Y. (2017). Water quality assessment based on the water quality index method in Lake Poyang: the largest freshwater lake in China. Sci. Rep. 7 (1), 1–19. doi:10.1038/s41598-017-18285-y
Wurtsbaugh, W. A., Miller, C., Null, S. E., Justin De Rose, R., Wilcock, P., Hahnenberger, M., et al. (2017). Decline of the world’s saline lakes. Nat. Geosci. 10 (11), 816–821. doi:10.1038/ngeo3052
Yapiyev, V., Sagintayev, Z., Inglezakis, V. J., Samarkhanov, K., and Verhoef, A. (2017). Essentials of endorheic basins and lakes: a review in the context of current and futurewater resource management and mitigation activities in Central Asia. WaterSwitzerl. 9 (10), 798. doi:10.3390/w9100798
Yu, Y., Chen, X., Malik, I., Wistuba, M., Cao, Y., Hou, D., et al. (2021). Spatiotemporal changes in water, land use, and ecosystem services in Central Asia considering climate changes and human activities. J. Arid. Land 13 (9), 881–890. doi:10.1007/s40333-021-0084-3
Zhang, G., Tang, K., Ren, Z., and Zhang, X. C. (2013). Impact of grass root mass density on soil detachment capacity by concentrated flow on steep slopes. Trans. ASABE 56 (3), 927–934. doi:10.13031/trans.56.9566
Zhang, L., Xin, Z., Feng, L., Hu, C., Zhou, H., Wang, Y., et al. (2022b). Turbidity dynamics of large lakes and reservoirs in northeastern China in response to natural factors and human activities. J. Clean. Prod. 368 (July), 133148. doi:10.1016/j.jclepro.2022.133148
Keywords: normalized difference turbidity index (NDTI), spatio-temporal analysis, remote sensing-GIS, arid central Asia, endorheic lake basin, Lake Balkhash, Kazakhstan
Citation: Mishra K, Choudhary B and Fitzsimmons KE (2024) Predicting and evaluating seasonal water turbidity in Lake Balkhash, Kazakhstan, using remote sensing and GIS. Front. Environ. Sci. 12:1371759. doi: 10.3389/fenvs.2024.1371759
Received: 16 January 2024; Accepted: 08 April 2024;
Published: 01 May 2024.
Edited by:
Kanat Samarkhanov, Nazarbayev University, KazakhstanReviewed by:
Ping Wang, Chinese Academy of Sciences (CAS), ChinaAdilet Valeyev, Institute of geography and water safety, Kazakhstan
Copyright © 2024 Mishra, Choudhary and Fitzsimmons. This is an open-access article distributed under the terms of the Creative Commons Attribution License (CC BY). The use, distribution or reproduction in other forums is permitted, provided the original author(s) and the copyright owner(s) are credited and that the original publication in this journal is cited, in accordance with accepted academic practice. No use, distribution or reproduction is permitted which does not comply with these terms.
*Correspondence: Kanchan Mishra, a2FuY2hhbi5taXNocmFAdW5pLXR1ZWJpbmdlbi5kZQ==