 Xingshan Chen
 Qingwu Yan
 Minghao Yi1,3
 Zihao Wu
94% of researchers rate our articles as excellent or good
Learn more about the work of our research integrity team to safeguard the quality of each article we publish.
Find out more
ORIGINAL RESEARCH article
Front. Environ. Sci., 27 May 2024
Sec. Environmental Informatics and Remote Sensing
Volume 12 - 2024 | https://doi.org/10.3389/fenvs.2024.1369974
Introduction: Vegetation is the main factor of ecological stability, but the construction of largescale corridor projects will bring some damage to vegetation.
Methods: Based on the NDVI, temperature and precipitation data of the growing season from 1990–2021 (June to September), this paper uses the maximum synthesis method, trend analysis method, correlation analysis method and coefficient of variation method to study the spatial-temporal changes and driving factors of NDVI in the past 32 years, taking the 30 km belt buffer zone along the Lan-Xin Railway as the research area. The influence range of railway construction on NDVI in different climatic conditions is analyzed.
Results: The results showed that: (1) From 1990–2021, the average annual temperature of the growing season in the study area showed an increasing trend, the average annual precipitation showed a decreasing trend, and the average annual NDVI showed an increasing trend; NDVI was positively correlated with temperature in 54.04%, and positively correlated with precipitation in 62.88%. Precipitation had a greater effect on NDVI than temperature. (2) Under the same climatic conditions, the NDVI variability coefficient in the study area fluctuates significantly within 3,000–21,000 m along the railway line, stabilizing beyond 21,000 m; the impact range of railway construction on NDVI gradually increases with increasing precipitation within the same temperature range, and increases gradually with rising temperatures within the same precipitation range. (3) During the growing season (June to September) in the study area, when the temperature is below 25°C, NDVI increases initially with increasing precipitation before decreasing, showing an overall upward trend; when the temperature is above 25°C, NDVI initially increases with increasing precipitation before decreasing. High temperature and high precipitation will inhibit vegetation growth and reduce NDVI. The NDVI of the core area before the railway construction is larger than that of the background area, while the NDVI of the core area after the railway construction is smaller than that of the background area.
Discussion: In short, the construction of Lan-Xin Railway has a certain influence on NDVI along the line. When studying the impact of large-scale engineering projects on vegetation in the future, higher resolution imagery can be used along with the incorporation of human activities' influence. These factors will enable more accurate and comprehensive research.
Large-scale linear engineering constitutes a critical component of the modern in-tegrated transportation system. It plays a significant role in supporting the national economy during its new development phase and serves as a crucial strategic asset of the country (Li et al., 2017). The Lan-Xin Railway project comprises both the Lan-Xin Railway and the Lan-Xin high-speed railway. The Lan-Xin high-speed railway serves as the primary railway artery traversing Gansu, Qinghai and Xinjiang provinces, which not only adds a large transport capacity out of Xinjiang, greatly improves the transportation capacity, but also forms the main framework of Xinjiang’s connection with the inland provinces and regions. The construction of the Lan-Xin Railway project has greatly improved the capacity of both passenger and freight transportation. It has become a crucial “transport channel” that accelerates the western development process. However, it is important to acknowledge that the ecological environment in Xinjiang is extremely fragile and challenging to restore once damaged (Zhou et al., 2015; Liu et al., 2022). The construction of railway projects have caused disturbances to the surface vegetation and vegetation growth environment along the Lan-Xin Railway (Cui and Shi, 2010; Otto et al., 2016; Jiang et al., 2017; Li et al., 2019). This has accelerated soil erosion, compromised the water-holding capacity of the soil in this area, and led to the degradation of the overall quality of the ecological environment (Dutta et al., 2015; Lu et al., 2018; Zhu et al., 2018). Consequently, the already vulnerable ecological environment in Xinjiang faces increased ecological pressure (Fu et al., 2016; Luo et al., 2018; Zhou and Liu, 2018; Xu et al., 2020).
The Normalized Vegetation Index (NDVI) serves as a crucial indicator for monitoring vegetation cover (Xie et al., 2023), and it is extensively utilized in the assessment of vegetation (Ma et al., 2021a; Xiong et al., 2023) and ecological environments (Xu et al., 2022). Scholars, both domestic and international, have employed NDVI data in studying the status of vegetation growth and its response to climatic factors. Zhang et al. (Zhang et al., 2021a), Li et al. (Li et al., 2021), and Xue et al. (Xue et al., 2021) have employed correlation and trend analysis to examine the changes in vegetation cover and its responses to driving factors in regions such as Tibet, Xinjiang, and Southwest China. Utilizing MODIS NDVI data, Ma et al. (Ma et al., 2022), Guan et al. (Guan et al., 2021), and Yu et al. (Yu et al., 2020) have analyzed the impacts of climate change and human activities on the dynamics of vegetation change in Xinjiang. Xu et al. (Xu et al., 2023), Cui et al. (Cui et al., 2023), and Cui et al. (Cui et al., 2018) have used the Yangtze River and Songhua River basins as their research subjects, studying the dynamic impacts of climate change on the basins’ vegetation. Some researchers have also investigated the influence of large-scale projects on NDVI. Yang et al. (Yang et al., 2021), Yang et al. (Yang et al., 2022), Ma et al. (Ma et al., 2021b), taking the Qinghai-Tibet Railway, Sichuan-Tibet Railway and other large projects as research objects, analyzed their impact on NDVI and its change characteristics. Through the utilization of remote sensing data and correlation analysis, most of studys (Olthof and Pouliot, 2010; Scheftic et al., 2014; Yin et al., 2016) delves into the spatio-temporal dynamics of NDVI (Normalized Difference Vegetation Index) in the study area, drawing insightful conclusions. Few studies have hitherto scrutinized the influence range of large-scale railway projects on NDVI under varying climatic conditions. For example, Zou et al. (Zou et al., 2012) took the Lanxin Railway second line as an example from Minle to Yumen, analyzing the impact of engineering construction on the integrity of the ecosystem within a 10 km range on both sides of the railway. Xue (Xue, 2023) used the Zhangjiakou section of the Beijing-Zhangjiakou Railway as a typical case, establishing an index system for ecological environment quality, landscape pattern, and carbon storage, evaluating the ecological impact of the railway corridor, and analyzing the ecological costs and benefits of the railway corridor from an economic perspective. Yang (Yang, 2023), based on the RSEI model, took the city of Poland along the route of the China-Europe freight train as an example, analyzing the spatiotemporal changes in the ecological environment at the urban scale before, during, and after the operation of the China-Europe freight train. Focusing on the Xinjiang section of the Lan-Xin Railway Project, this research aims to fill this gap. By analyzing NDVI data alongside temperature and precipitation records during the growing season (June to September) from 1990 to 2021, the study discusses the temporal and spatial changes of NDVI along the railway and its responsiveness to climate factors. The correlation analysis and coefficient of variation methods are employed to explore the relationship between the influence range of railway construction on NDVI and climate factors. The research findings hold significant implications for the construction and planning of major energy channel projects.
The Lan-Xin Railway, stretching from Lanzhou in Gansu Province to Alashankou in the Xinjiang Uygur Autonomous Region, stands as one of the longest railway lines constructed post the establishment of the People’s Republic of China. It once served as the sole railway line connecting Xinjiang to the mainland, constituting a significant segment of the railway network in Northwest China. Following the inauguration of the Lan-Xin Railway’s main line in 1990, the development of the double line commenced in 1992, spanning a total length of 1,622 km. The entire line was completed in 1994, followed by a series of electrification transformations conducted from 1995 to 2012. The construction of the Lan-Xin High-Speed Railway initiated at the end of 2009, with the entire line becoming operational in 2014. Upon completion, the logistical and passenger transport capabilities of Xinjiang experienced significant enhancement, providing robust transport capacity for the development and export of Xinjiang’s coal and other resources. The railway has become an energy “transport corridor” between Xinjiang and the mainland, promoting not only Xinjiang’s economic development but also catering to the travel needs of its residents.
The study area, characterized by a typical temperate continental arid and semi-arid climate, boasts an average annual temperature of −4∼9°C, an annual precipitation range of 150–200 mm, a frost-free period spanning 140–185 days per year, four distinct seasons, and complex landforms, inclusive of the Altai Mountain and Junggar Basin (Chen et al., 2023). The Lan-Xin Railway (Figure 1, No. Xin S (2023) 061) penetrates Xinjiang via the Hongliu River, traverses Weiya, and proceeds through Hami, Shanshan, and Turpan along the southern foot of the Tianshan Mountain. It then crosses the Tianshan Mountain at Dabancheng to reach Urumqi City, moves west through Shihezi, Kuitun, and Boler, referred to as the city of military cultivation, before finally arriving at the border port city of Alashankou. Stretching from Lanzhou West Railway Station to Urumqi Railway Station, the Lan-Xin High-Speed Railway spans 1,786 km, encompassing 22 stations, with the Xinjiang section measuring 709.923 km in length.
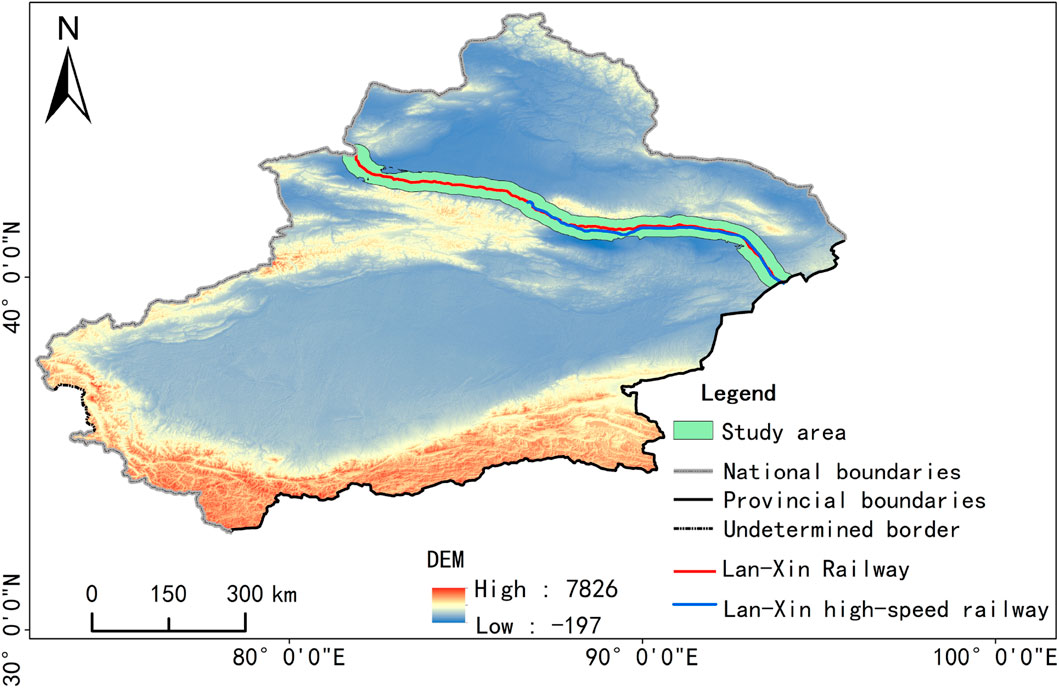
Figure 1. Location and research area of Lan-Xin Railway.
The Xinjiang Uygur Autonomous Region encompasses a vast expanse of desert. To enhance the precision of the research findings, areas of the desert lacking vegetation cover were masked, and water bodies within the study area were excluded, thereby refining the accuracy of the results.
The Global Inventory Modeling and Mapping Studies (GIMMS) NDVI dataset (1990–1999), obtained from remote sensing data (https://www.nasa.gov/), possesses a long time series and extensive coverage. It effectively captures the dynamic changes of vegetation and is extensively utilized in detecting regional scale vegetation changes, among other applications. The dataset has a spatial resolution of 10000 m × 10000 m and a temporal resolution of 15 days. The dataset has undergone various processes such as atmospheric correction, geometric correction, removal of erroneous lines, and elimination of volcanic eruptions, thereby ensuring good data quality. The NDVI data from 2000 to 2021 is extracted from the MOD12A3 data, a part of the MODIS dataset released by NASA. The dataset has a monthly temporal resolution, a spatial resolution of 1000 m × 1000 m, and follows the GCS_WGS_1984 geographical coordinate system. The maximum NDVI data values during the growing season (June to September) were compiled to derive the peak NDVI data value for Xinjiang’s growing season over a 32 year period. To maintain uniformity in data resolution, bilinear interpolation was employed to adjust the data to a 1000 m resolution.
The climatological data, which includes temperature and precipitation from 1990 to 2021, is sourced from the “China 1 km resolution Monthly Mean Temperature Dataset” and “China 1 km resolution Monthly Precipitation Dataset” provided by the National Tibetan Plateau Scientific Data Center. This dataset, in NETCDF format, has a spatial resolution of 1000 m × 1000 m. It is created using the Delta spatial downscaling scheme, which is based on the global 0.5° climate data from the Climate Research Unit (CRU) and high-resolution climate data from WorldClim. The dataset’s accuracy is validated using data from 496 independent meteorological observation points.
The research framework is depicted in Figure 2. The data used in this study consisted of Normalized Difference Vegetation Index (NDVI), temperature, and precipitation at a resolution of 1,000 m from 1990 to 2021. The study area encompasses a 30 km buffer zone along the Lan-Xin Railway. In terms of research methodology, the maximum synthesis method was employed to process the NDVI data. Trend analysis was utilized to examine the spatio-temporal variation of NDVI and climatic factors. A correlation analysis was conducted to analyze the response of NDVI to climatic factors. The coefficient of variation method was employed to determine the extent of the Lan-Xin Railway project’s influence on NDVI along its route. It was observed that the influence of the Lan-Xin Railway on NDVI varied with precipitation when the temperature was either below or above 25°C. Additionally, this influence varied with temperature in regions with different precipitation levels. The responses of NDVI to climatic factors in both the ecological background area and the core area were compared and analyzed. Finally, conclusions were drawn based on the aforementioned data, methodologies, and findings. The calculation and visualization software used in the study include ArcMAP, Origin and draw.
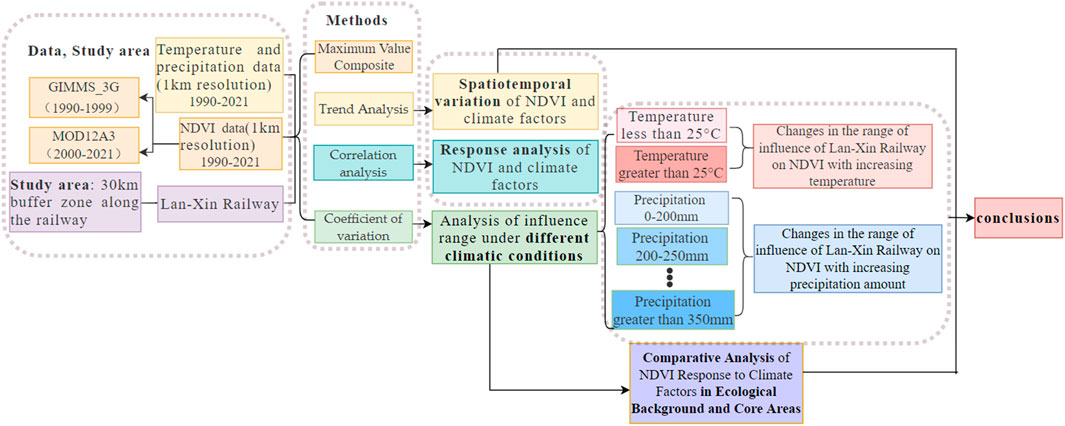
Figure 2. Research framework.
By utilizing the Maximum Value Composite (MVC) method in the processing of NDVI remote sensing data, it is possible to further eliminate the interference caused by clouds, atmospheric disturbances, and solar altitude angle data (Long et al., 2013). This method is used to determine the maximum NDVI on an annual basis.
In this study, we employed a one-dimensional linear regression method to examine the trends in NDVI, temperature, and precipitation during the growing season (June to September) from 1990 to 2021 within the study area. This approach aids in il-lustrating the interannual variation trends of NDVI and climate within the study area (Wang et al., 2017; Guo et al., 2020).
The Pearson correlation coefficient, a concept originally proposed by Francis Galton in the 1880s and later refined by Carl Pearson, serves to measure the correlation between two variables, yielding values that range from −1 to 1 (Zhang et al., 2021b; Ma et al., 2023; Wang et al., 2023).
The coefficient of variation is a statistical measure that represents the degree of dispersion in data, expressed as an absolute value. Unlike the standard deviation, it does not rely on the data’s mean value; being a dimensionless quantity, it allows for the comparison of two datasets with differing dimensions or mean values (Milich and Weiss, 2000). The formula for its calculation is as follows:
Where, CV denotes the coefficient of variation of NDVI, n signifies the number of years,
To investigate the temporal fluctuations in NDVI in the study area from 1990 to 2021, we employed the maximum synthesis method to derive the peak synthetic data for the growing season (June to September) from the original remote sensing data spanning 1990 to 2021. Subsequently, a trend analysis was conducted on the 32-year annual mean NDVI values in the study area.
Based on the interannual NDVI trends during the growing season in the study area from 1990 to 2021 (Figure 3A), the average NDVI demonstrated a fluctuating up-ward trend, with a mean of 0.22 and a range from 0.18 to 0.26. The minimum and maximum values were recorded in 2001 and 2017, respectively. Over a 32-year period, the NDVI increased at a rate of 0.0016 annually, but displayed a decreasing trend from 1990 to 2001, primarily attributed to human activities like railway construction. The entire period from 2001 to 2021 exhibited a fluctuating upward trend, with a maximum increase of 0.0791. The linear regression equation for NDVI from 1990 to 2021 is y = 0.0016x-2.9507, with an R2 value of 0.54. Based on the distribution values and a 95% confidence interval, the NDVI distribution appears to be relatively discrete, showing a slight upward trend that is not statistically significant. During the construction of the Lan-Xin high-speed Railway, the study area experienced a decrease in NDVI, In the subsequent period of railway operation, the NDVI exhibited a dynamic upward trend.
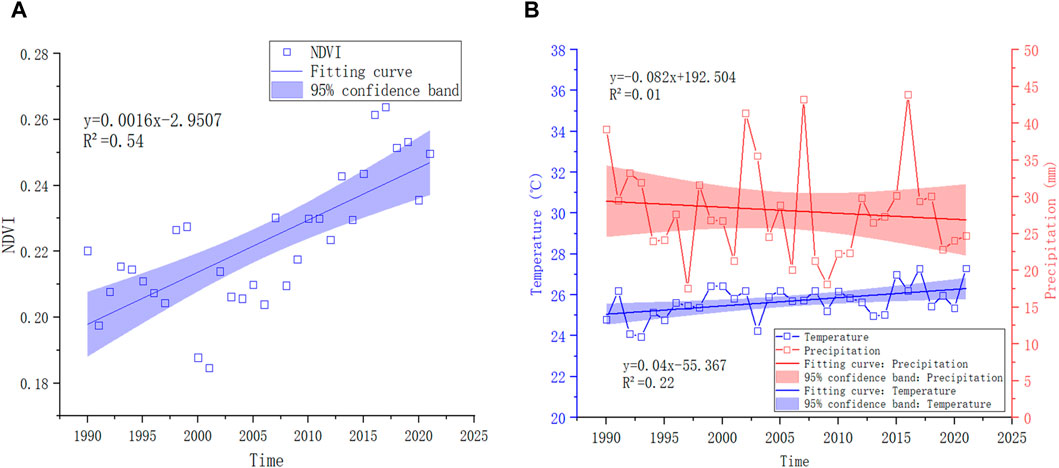
Figure 3. (A) Interannual variation trend of NDVI during the growing season in the study area from 1990 to 2021; (B) Interannual variation trend of temperature (°C)/precipitation (mm) during the growing season in the study area from 1990 to 2021.
The annual variation of NDVI during the growing season exhibits a significant correlation with local temperature and precipitation. Overall, the average temperature during the growing season (Figure 3B) in the study area from 1990 to 2021 demonstrated a fluctuating upward trend, with a range of 24.0°C–27.3°C and an annual increase rate of 0.04041°C, the highest and lowest temperatures occurred in 2021 and 1992, respectively. The linear regression equation for the temperature data from 1990 to 2021 is y = 0.04x-55.367, with an R2 value of 0.22. Based on the regression analysis, while there is an overall increasing trend in temperature, it is not statistically significant and the temperature values are relatively scattered. During the growing season from 1990 to 2021, the precipitation in the study area (Figure 3B) displayed an overall fluctuating and declining trend, with an annual decrease rate of 0.082 mm and an average precipitation fluctuating between 17.55 and 43.88 mm, The highest and lowest precipitation years occurred in 2016 and 1997, respectively. The linear regression equation for precipitation from 1990 to 2021 is y = −0.082x+192.504, with a coefficient of determination R2 = 0.01. It is evident from the data that the distribution of precipitation exhibits considerable variability, displaying a subtle declining trend over time and significant year-to-year fluctuations.
The main vegetation types in the study area include grasslands, rain-fed crops, and perennial and annual herbaceous plants. The dynamic variation of NDVI is influenced by fluctuations in temperature and precipitation. For instance, in 2001, the average NDVI value during the growing season in the study area hit a record low. Concurrently, it was observed that both temperature and precipitation in 2001 were notably low. In 2008, the average annual NDVI during the growing season significantly decreased due to high temperatures and low precipitation in the study area. In 2017, with the combined effect of optimal temperature and precipitation, the average annual NDVI during the growing season in the study area achieved its peak.
The annual average NDVI of the growing season in the study area was calculated for the period from 1990 to 2021. The resulting annual spatial distribution map of NDVI for the growing season was divided into five categories (Figure 4). From 1990 to 2021, the average NDVI value was 0.2214, indicating a low mean NDVI value and uneven spatial distribution. The majority of the NDVI values in the northwestern part of the study area exceed 0.4. However, in the southeastern part, located in eastern Xinjiang where desertification is severe, most NDVI values range between 0 and 0.2. In the study area, 57.63% of NDVI values fall between 0 and 0.2, 22.83% between 0.2 and 0.4, 14.53% between 0.4 and 0.6, and 5.01% exceed 0.6. Kuitun City, Shihezi City, Changji City, and Urumqi are situated in the southwest and south of the Junggar Basin, as well as in the middle part of the northern foothills of the Tianshan Mountains. The NDVI value is relatively higher in these oasis groups. Turpan City, Hami City, and Bole City are respectively located in the Turpan, Hami, and Boltala Oases. These oases have been formed by rivers created from the melting of glaciers and snow. The conditions of wa-ter vapor are relatively sufficient, fostering the growth and development of vegetation, and resulting in higher NDVI values.
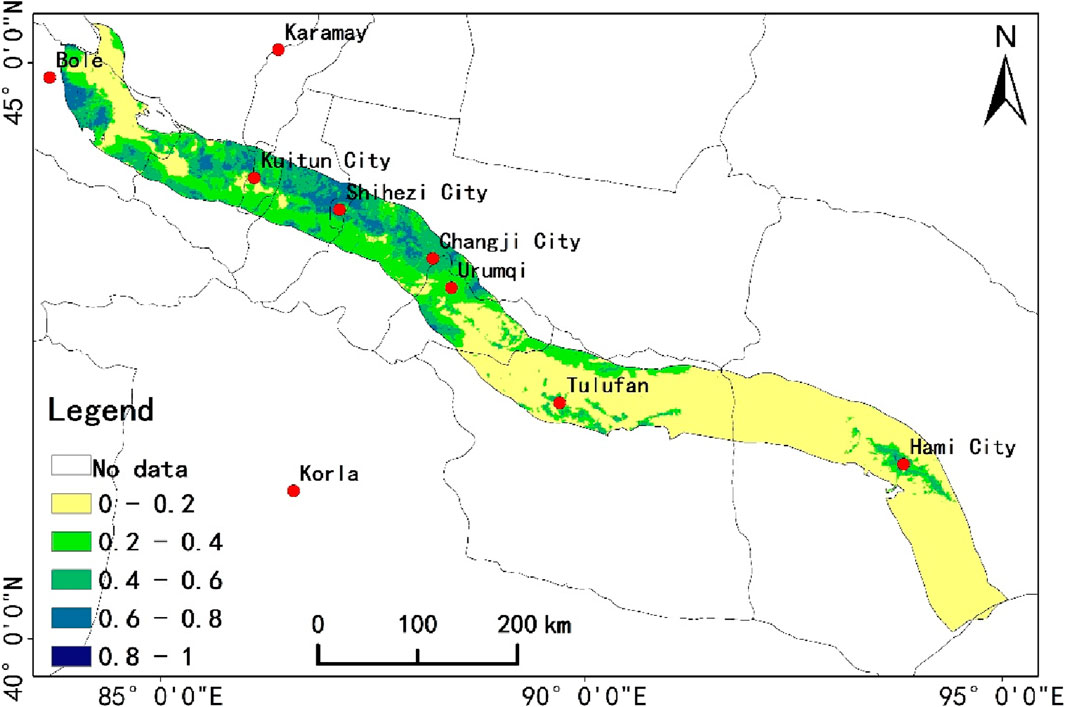
Figure 4. Spatial distribution of NDVI during the growing season from 1990 to 2021.
In the study area, we employed Pearson correlation analysis to compute the Pearson correlation coefficient for each pixel. This resulted in a Pearson correlation distribution map of NDVI and temperature from 1990 to 2021 in the study area (Figure 5). A Pearson correlation coefficient less than 0 signifies a negative correlation, greater than 0 signifies a positive correlation, and a larger absolute value signifies a stronger correlation. The results revealed that the mean Pearson correlation coefficient between NDVI and temperature is 0.29. Additionally, NDVI has a positive correlation with temperature in approximately 54.04% of the study area. Moreover, the region displaying a significant positive correlation between NDVI and temperature constitutes approximately 0.58% (p < 0.05). The results showed that temperature had no significant positive effect on NDVI. Regions exhibiting a negative correlation between NDVI and temperature suggest that extreme temperatures (either high or low) in these areas inhibit NDVI.
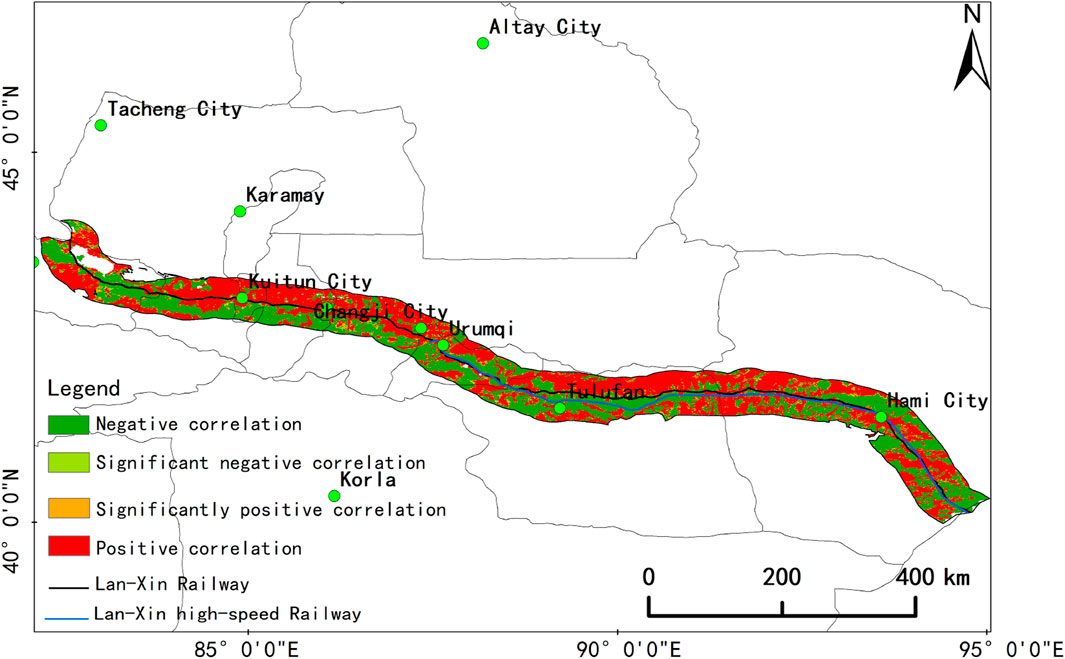
Figure 5. Pearson correlation distribution of NDVI and temperature.
The correlation of NDVI with precipitation in the study area was calculated. Additionally, a correlation distribution map of NDVI and precipitation in the study area was obtained for the period from 1990 to 2021 (Figure 6). The results reveal that the average correlation coefficient between NDVI and Pearson is 0.64, with the Pearson correlation value ranging from −0.53 to 0.73. Approximately 62.88% of the region’s NDVI exhibits a positive correlation with precipitation. This is higher than the 54.04% of the region that shows a positive correlation with temperature. The results indicate that precipitation has a more substantial impact on NDVI than temperature. NDVI demonstrated a positive correlation with precipitation in 12.28% of the regions (p < 0.05). Conversely, in 15.07% of the regions, NDVI was negatively correlated with precipitation. This suggests that extreme precipitation levels, either too high or too low, in these regions significantly influence NDVI.
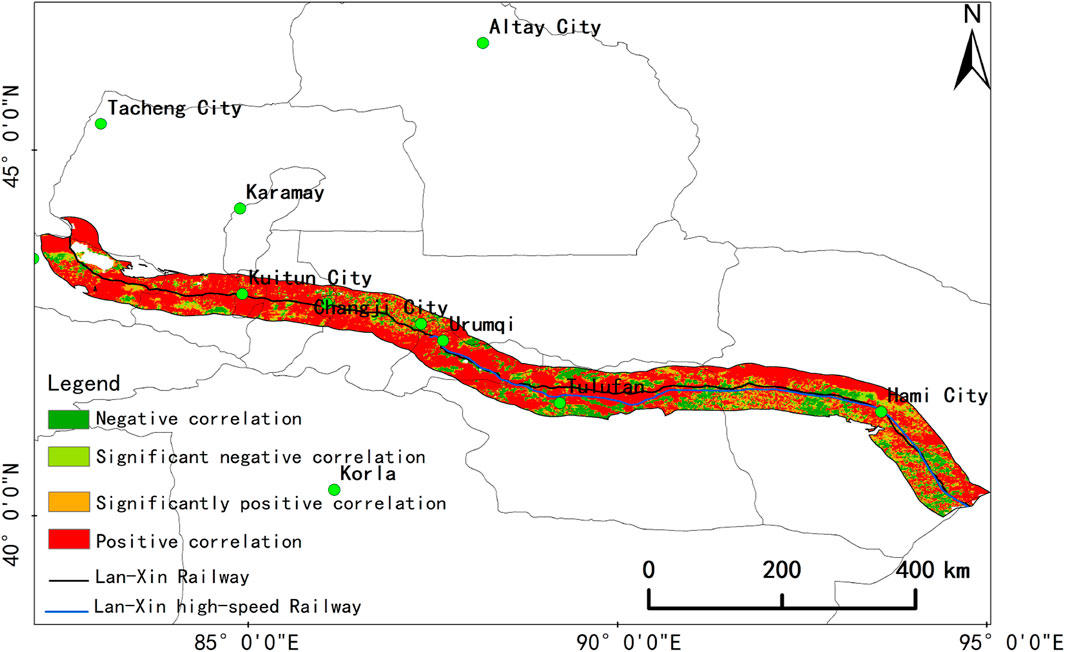
Figure 6. Pearson correlation distribution of NDVI and Precipitation.
Upon analyzing the distribution of NDVI in the study area, we observed variations in NDVI across regions at different distances from the Lan-Xin Railway. These variations can be attributed to disturbances in the surrounding ecological environment due to the construction and operation of the Lan-Xin Railway. Therefore, to precisely determine the influence range of the Lan-Xin Railway, we employed the coefficient of variation method. This method calculates the NDVI variation coefficient, which fluctuates with increasing distance under various climatic conditions. The distance at which the coefficient of variation stabilizes is considered as the influence range of the railway construction. In the study area, we created strip buffers every 1,000 m from the railway, with a maximum buffer distance of 30 km. For instance, a “6,000 m buffer” refers to a strip buffer centered on the railway. The inner part of the buffer is 5,000 m from the railway line, the outer part is 6,000 m, and the width of the buffer is 1,000 m. This pattern continues for the subsequent buffers.
Data from 2010 (pre-construction), 2014, 2018, and 2021 (post-construction) were chosen to represent the periods before and after the railway construction. The coefficient of variation method was employed to assess the fluctuations in the NDVI coefficient of variation under varying distance and climate conditions. This allowed for an analysis of the diverse impact ranges of railway construction on NDVI under different climatic conditions. Based on the historical temperature and precipitation classification in the study area, with an average of the growing season temperature of about 25°C, temperatures were categorized into two groups: below 25°C and above 25°C. Precipitation was divided into five categories, each representing a 50 mm range: below 200 mm, 200–250 mm, 250–300 mm, 300–350 mm, and above 350 mm. The common area of temperature and precipitation data was chosen to represent the data under each climate condition. For instance, the intersection of data for temperatures below 25°C and pre-cipitation between 250 and 300 mm was selected, and the corresponding area in the NDVI data was used as the NDVI data for that climate condition.
Figure 7 illustrates the fluctuation of the NDVI variation coefficient under various climatic conditions prior to the railway construction in 2010. In this context, “0_25” signifies a temperature less than 25°C, “0_200” denotes precipitation less than 200 mm, “25_25+” represents a temperature exceeding 25°C, “350_350+” indicates precipitation over 350 mm, and so forth. “0_25_0_200” designates an area with a temperature below 25°C and precipitation under 200 mm. This notation is consistently used in the same manner throughout the paper. As this study examines the NDVI variation coefficient under identical climatic conditions, it necessitates the selection of NDVI data with consistent temperature and precipitation ranges. Owing to the constraints of the study area’s size, certain values are absent under specific climatic conditions, but this does not impact the research findings. As depicted in Figure 7, the NDVI variation coefficient along the railway exhibits significant fluctuations between 3,000–21000 m, with the CV value gradually stabilizing thereafter. Given the consistent climatic con-ditions selected for this study, the pronounced fluctuation of the CV variation coefficient within a short railway distance can discount the influence of climate factors, and the topographic changes within a short distance can be disregarded. There is some variation in the range of impacts under different climatic conditions.
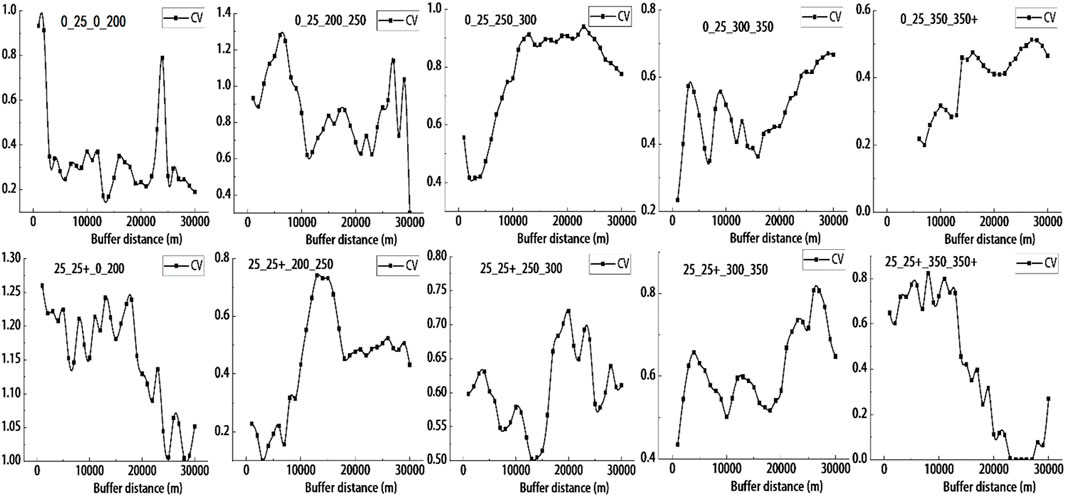
Figure 7. Fluctuation of NDVI’s CV under different climatic conditions before the railway construction (2010).
Following the construction of the railway, the fluctuation of the Coefficient of Variation (CV) of the Normalized Difference Vegetation Index (NDVI) under varying climatic conditions is depicted in Figure 8, Figure 9, and Figure 10 for the years 2014, 2018, and 2021, respectively. During this period, the CV exhibited significant fluctuations within the 4,000–19000 m range before gradually stabilizing. In certain datasets, anomalous values emerge post-stabilization of the CV, potentially influenced by human activities or other factors. These anomalies can be disregarded in data research and analysis. Over time, the distance from the railway also alters when the CV stabilizes under identical climatic conditions.
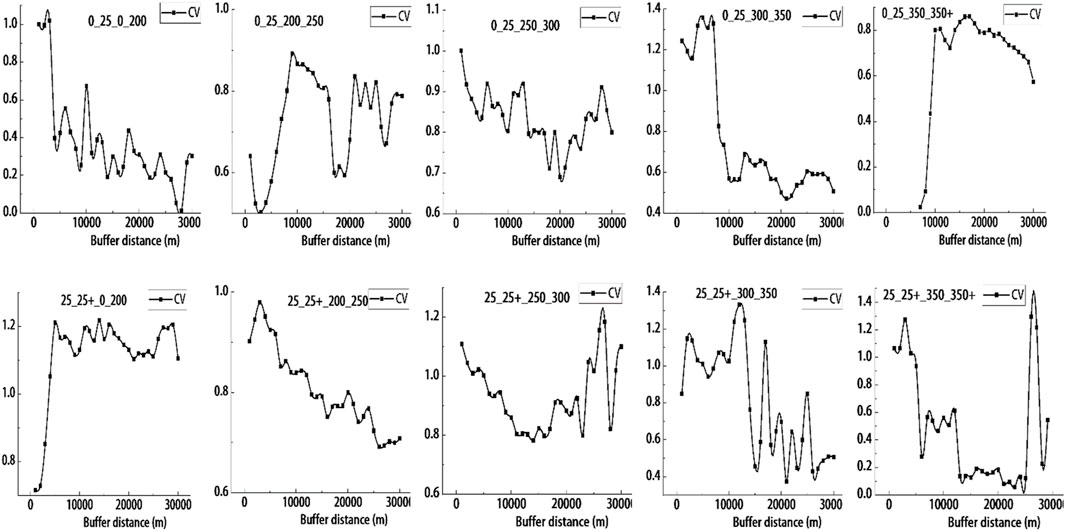
Figure 8. Fluctuation of NDVI’s CV under different climatic conditions after the railway construction (2014).
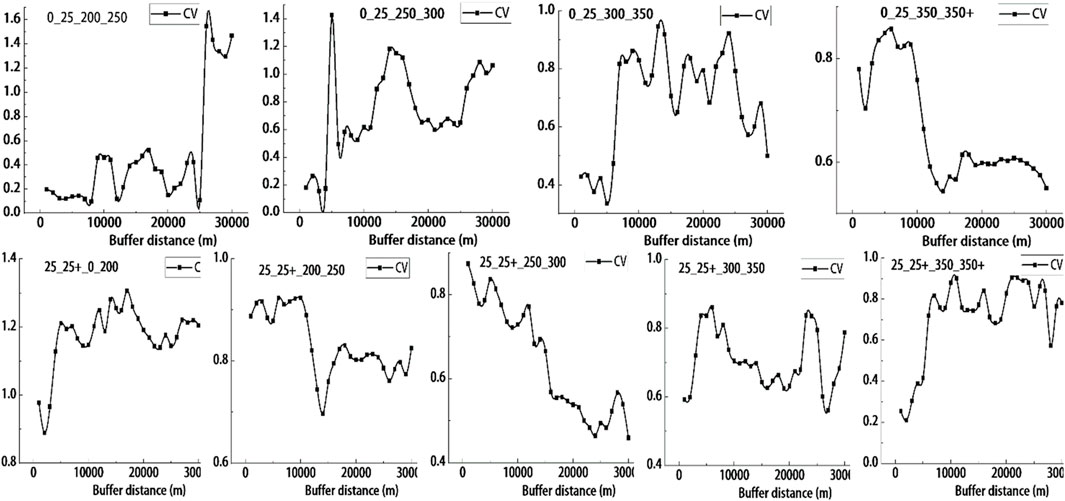
Figure 9. Fluctuation of NDVI’s CV under different climatic conditions after the railway construction (2018).
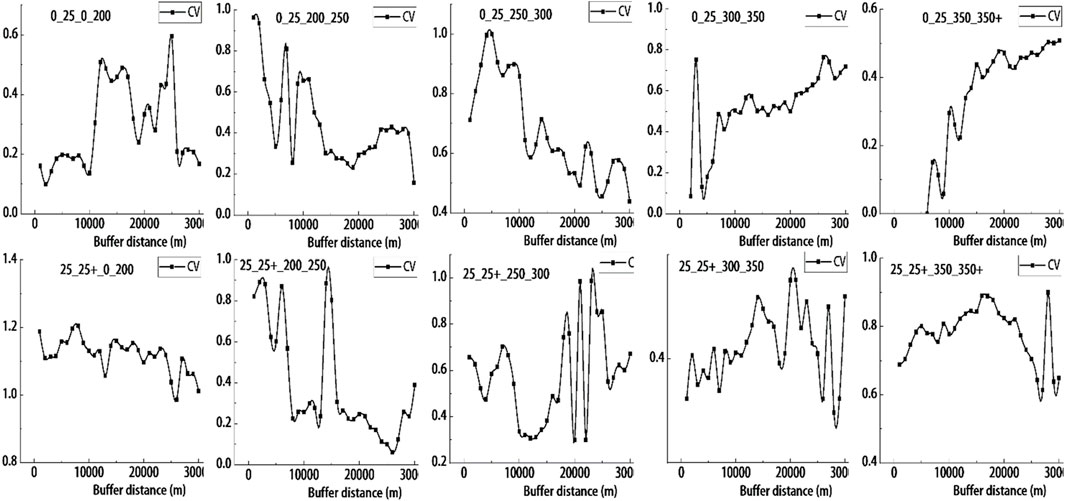
Figure 10. Fluctuation of NDVI’s CV under different climatic conditions after the railway construction (2021).
The influence range of railway engineering on the Normalized Difference Vegeta-tion Index (NDVI) is determined by the minimum distance at which the coefficient of variation remains stable. Data analysis of the Coefficient of Variation (CV) fluctuation charts (Figures 7–10) revealed the impact range of railway projects on NDVI for the years 2010, 2014, 2018, and 2021 (Figure 11). The interpretation of climatic conditions remains consistent with the previous explanation.
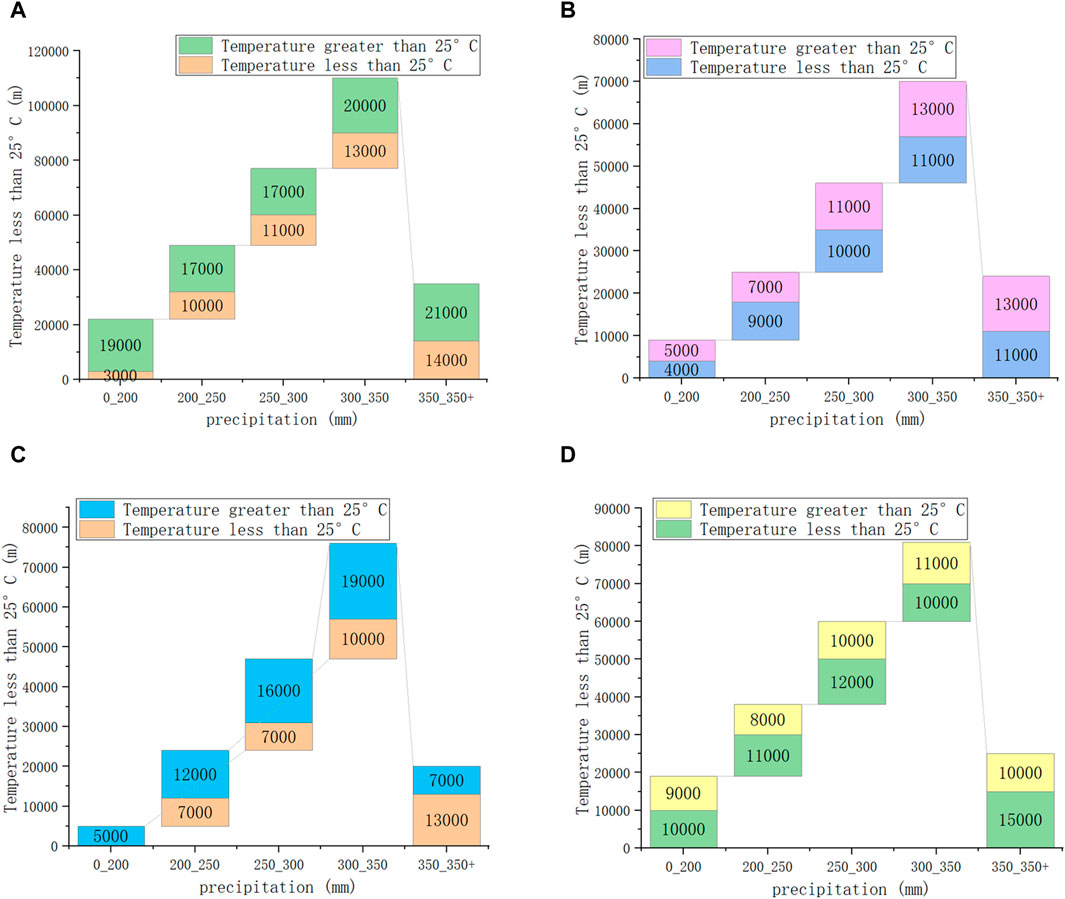
Figure 11. The impact range of the railway on NDVI under different climate conditions in (A) 2010, (B) 2014, (C) 2018 and (D) 2021.
As per Figure 11A, prior to the construction of the Lan-Xin high-speed Railway in 2010, the influence range expanded with increasing precipitation under identical temperature conditions. Similarly, with consistent precipitation, the influence range enlarged with rising temperature. The findings indicate that under specific conditions, high temperature and heavy precipitation exert a more substantial impact on NDVI. Figure 11B–D depict the results after the completion of the railway construction for the years 2014, 2018, and 2021, respectively. The results suggest that following the completion of the railway construction, the overall influence range exhibited an upward trend with increased precipitation under the same temperature conditions. Likewise, under a constant precipitation range, the overall influence range trended upwards with a rise in temperature.
Using the railway project’s influence range on NDVI from the previous section as a reference point, we define the annular buffer area outside this range as the “ecological background area” (hereafter referred to as the background area), while the strip buffer area within this range is termed the “core area”. The average NDVI value in both the ecological background area and the core area represents the NDVI value under the given climatic conditions. The trend of NDVI value variations under different climatic conditions was analyzed (Figure 12). Furthermore, the changes in NDVI under varying climatic conditions were studied and compared.
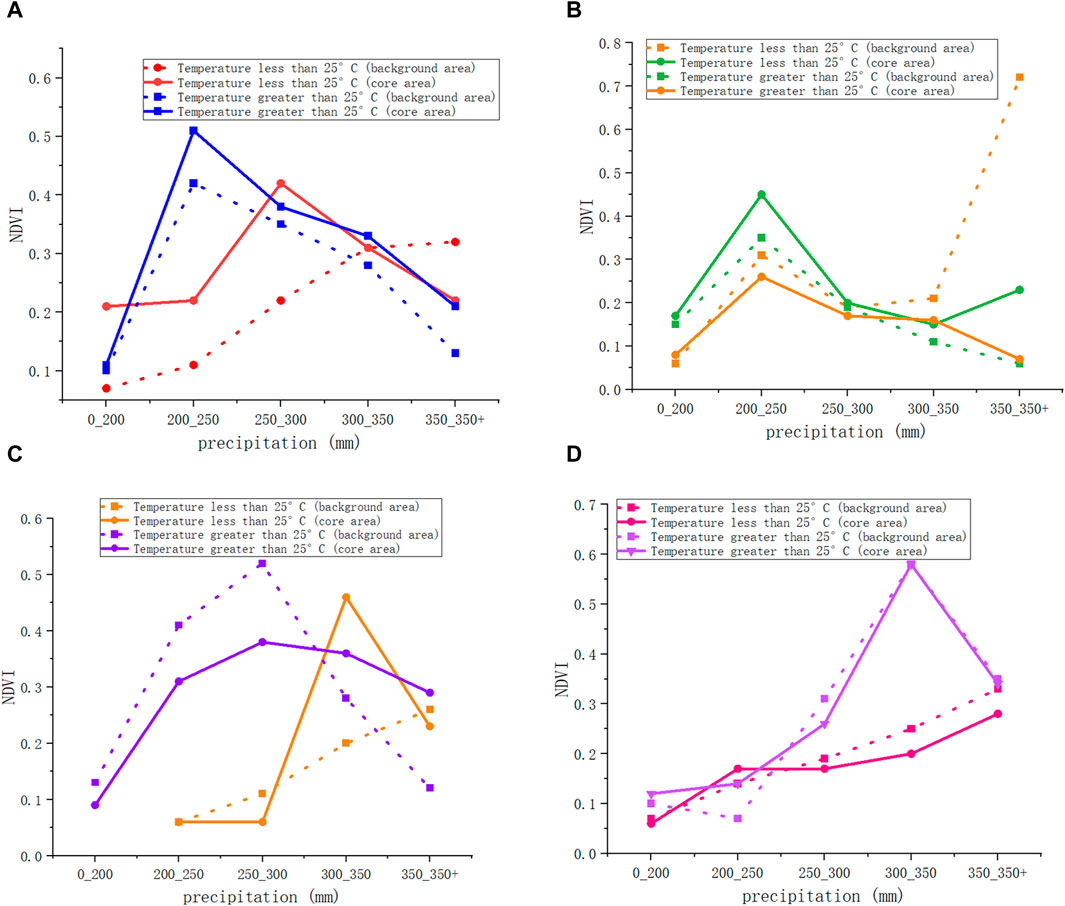
Figure 12. The trend of NDVI changes under different climatic conditions in 2010 (A), 2014 (B), 2018 (C) and 2021 (D).
As illustrated in Figure 12, when the temperature is below 25°C, the NDVI value initially increases with rising precipitation, then decreases, indicating an overall up-ward trend. When the temperature exceeds 25°C, the NDVI values display a dynamic pattern of initial increase followed by a decrease with rising precipitation. Moreover, under identical precipitation conditions, the NDVI values are generally higher when the temperature exceeds 25°C compared to temperatures below 25°C. Generally, the NDVI value increases as the amount of water decreases. The NDVI value tends to in-crease with rising temperature. However, the results also indicate that when both precipitation and temperature surpass a certain threshold, they inhibit vegetation growth, leading to a decrease in NDVI value. For instance, in 2010, when both the temperature exceeded 25°C and precipitation surpassed 300 mm, the NDVI value exhibited a downward trend. Prior to the railway construction in 2010, the NDVI in the core area was higher than that in the background area. However, post-construction (2014, 2018, and 2021), the NDVI in the background area gradually overtook the core area. In 2014, under certain climatic conditions, the NDVI in the background area exceeded that in the core area, and by 2021, the NDVI in the background area was generally higher than that in the core area. Table 1 shows the mean NDVI of the ecological background region and core region before and after the construction of the railway. As indicated in Table 1, before the railway construction, the mean NDVI of the background region was lower than that of the core region, with the core region’s mean NDVI about 20.8% higher than that of the background region in 2010. After the railway construction, the mean NDVI of the background region was generally higher than that of the core region, with the most notable difference in 2014 when the mean NDVI of the background region was approximately 21.1% higher than that of the core region. After removing the ecological background influence, the NDVI decreased by approximately 25.9%. This suggests that the construction of the Lanzhou-Xinjiang Railway project had a certain impact on the NDVI along the line, suppressing the NDVI in the core region to some extent.
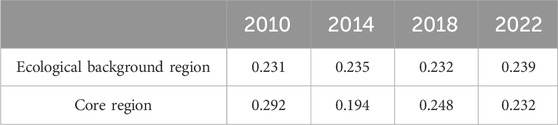
Table 1. The average NDVI values for the ecological background region and core region in the years 2010, 2014, 2018, and 2021.
The study indicates that from 1990 to 2021, there has been a slight upward trend in temperatures in the study area, although not significant. Rainfall has shown a slight downward trend over the 32-year period. However, these overall climate changes have not had a negative impact on NDVI, which has shown an overall upward trend in dynamic changes. Undoubtedly, the contribution of human activities to the NDVI along the railway over the past 32 years cannot be overlooked, and proactive measures must be taken to mitigate the ecological damage caused by the railway construction.
Currently, most domestic and international research focuses on the dynamic changes in vegetation, the driving forces of temperature and precipitation on vegetation, etc. There are few articles specifically studying NDVI under different climatic conditions. Based on remote sensing data of NDVI, temperature, and precipitation during the growing season (June to September) in the study area, this paper investigates the impact range of railway construction on NDVI under different climatic conditions, as well as the pattern of this impact range with climate change. At the same time, a comparative analysis of the response of NDVI to climate in ecological background areas and core areas is conducted, drawing the conclusion that the Lanzhou-Xinjiang railway project has a certain impact on NDVI along the route. Wu et al. (Wu et al., 2022) conducted a study on the Guiyang-Huangguoshu Expressway, exploring the impact of large-scale engineering construction on vegetation within a certain range and its response to climatic factors. They concluded that the construction of expressways significantly affects the surrounding vegetation. However, the paper only analyzes the influence of natural factors and railway construction on NDVI during the research process, neglecting the impact of other human activities such as ecological engineering construction, agricultural development, and grazing prohibition. Sardiña et al. (Sardina et al., 2023) utilized NDVI analysis to investigate the causes of grassland degradation in southern South America. The research findings indicate that it is climate factors rather than human activities that have influenced the degradation of grasslands. Guan et al. (Guan et al., 2021) combine an improved NDVI prediction model with residual analysis methods to quantitatively evaluate the impact of human activities on vegetation dynamic changes in Xinjiang. Thus, it is evident that the influence of human activities varies under different circumstances, and exploring the impact of human activities is essential for more accurate research results. Further investigation into the effects of human activities in this regard can be conducted in the future.
The article systematically analyzed the correlation between NDVI and climatic factors at the pixel level, concluding that temperature has no significant positive impact on NDVI, while precipitation has a greater positive impact on NDVI than temperature. This finding is consistent with Chang et al. (Chang et al., 2022)’s study on Chinese vegetation, where a multiple regression model showed that the regression coefficient of precipitation on NDVI is greater than that of temperature, suggesting precipitation as the dominant factor influencing NDVI. Bianchi et al. (Bianchi et al., 2020) explored the relationship between NDVI and changes in precipitation and temperature in northern Patagonia. They analyzed the relationship between climate and vegetation, concluding that there is a significant positive correlation between monthly precipitation and NDVI, while the relationship between NDVI and temperature is relatively weak. These findings closely align with the conclusions drawn regarding the relationship between climate and NDVI in the article. Xinjiang is a typical ecologically fragile area, and with the implementation of various ecological conservation projects, future human activities may have a more positive impact on NDVI. Further exploration is needed on the dynamic effects of human activities and climate change on vegetation, as well as their driving mechanisms.
The article, although to a certain extent, investigates the different effects of railway engineering on NDVI under various climate conditions and their changing patterns. However, due to the limitations of long-term time series remote sensing data resolution, the interval of the strip buffer is only 1,000 m. If higher precision data could be collected, a more in-depth study of the impact of railway engineering on NDVI could be conducted. Freemantle et al. (Freemantle et al., 2020) utilized high spatial resolution satellite remote sensing data to explore whether vegetation richness at the Nuna-Wat Melville Island Arctic Watershed Observatory has changed, using vegetation cover percentage measurements and indices derived from local climate data to analyze the NDVI trends separated by different vegetation types and activity layers for background analysis, confirming that the use of high spatial resolution remote sensing data helps link NDVI changes with vegetation and surface process changes. Munyati et al. (Munyati and Mboweni, 2013) analyzed the NDVI of semi-arid sparse grassland vegetation, conducting vegetation monitoring on arid sparse grasslands, which requires imagery with higher spatial resolution. Additionally, studies by Otto et al. (Otto et al., 2016) and Meng et al. (Meng et al., 2013) also demonstrate the importance of high spatial resolution imagery in NDVI research. Furthermore, the study area has relatively fixed ranges of temperature and precipitation during the growing season, making it difficult to study other temperature and precipitation ranges. In the future, the time series of climate data could be increased to study each month. Horion et al. (Horion et al., 2013) used a phenological approach to study the interaction between climate and vegetation dynamics, indicating that the complexity of the relationship between climate and vegetation is variable in both space and time. It also indicates that there are different possibilities for the relationship between climate and vegetation in different ranges, making it necessary to increase the time series to study the relationship between climate and vegetation. Due to the long time series of the study, NDVI data could not be collected from the same sensor, so two different NDVI products were used, which would result in some differences in their NDVI over the time series. Beck et al. (Beck et al., 2011) compared several NDVI datasets and found that trends on Chinese land surfaces were consistent, but trends in Europe were inconsistent. In the comparison of temporal change values, the GIMMS dataset performed the best, while the performance of MODIS-NDVI was better than any AVHRR-NDVI dataset. This also proves that there are certain differences between different datasets, and more precise research results could be obtained if the same dataset could be used within the time series. Therefore, in future research, the same NDVI product should be used when conditions permit.
This study focuses on the 30 km buffer zone along the Lan-Xin Railway. The dynamic changes of climate factors and the spatial-temporal distribution of NDVI during the growing season from 1990 to 2021 were analyzed using methods such as maximum synthesis, trend analysis, correlation analysis, and coefficient of variation. The study also explores the impact of railway construction on NDVI and the extent of this influence under various climatic conditions. The findings indicate that.
(1) From 1990 to 2021, the study area’s annual mean temperature during the growing season demonstrated a consistent upward trend. The average annual precipitation during the growing season exhibited a steady downward trend. The annual mean NDVI during the growing season revealed a consistent upward trend, particularly after 2001, with a significant increase despite a low mean NDVI of 0.2224. Regarding spatial distribution, the northwest region of the study area has a larger NDVI value than the southwest. Furthermore, 57.63% of the regions have an NDVI value ranging from 0 to 0.2, with only 5.01% exceeding 0.6. A pixel-by-pixel correlation analysis was conducted to examine the relationship between NDVI and both temperature and precipitation. The results indicated a positive correlation between NDVI and temperature in 54.04% of the region, and a positive correlation between NDVI and precipitation in 62.88% of the region. Overall, both temperature and precipitation could increase the NDVI value, with precipitation exerting a greater impact than temperature.
(2) Under identical climatic conditions, the coefficient of variation of NDVI, both pre and post railway construction, experiences significant fluctuations within a 3,000–21000 m range along the railway line. The coefficient of variation gradually stabilizes post construction. With a constant temperature and increasing precipitation, the influence range of railway construction on NDVI progressively expands. Similarly, with constant precipitation and increasing temperature, the influence of railway construction on NDVI progressively widens.
(3) During the growing season in the study area when the temperature is below 25°C, NDVI values initially increase, then decrease, yet the general trend is upward. When the temperature exceeds 25°C and precipitation increases, NDVI values demonstrate a dynamic trend of initially increasing and subsequently decreasing. Regions with higher temperatures have higher NDVI values than those with lower temperatures. However, extreme temperatures and precipitation may hin-der vegetation growth, thus reducing NDVI. Prior to the construction of the Lan-Xin Railway, the NDVI in the core area exceeded that in the background area. Post-construction, the NDVI in the core area is less than that in the background area. After removing the ecological background influence, the NDVI decreased by approximately 25.9% following the construction of the railway. It can be seen that the construction of the Lanzhou-Xinjiang Railway has had a certain impact on the NDVI along the route.
The original contributions presented in the study are included in the article/supplementary material, further inquiries can be directed to the corresponding author.
XC: Writing–original draft, Writing–review and editing, Conceptualization, Data curation. QY: Conceptualization, Writing–review and editing. MY: Data curation, Writing–review and editing. XM: Resources, Writing–review and editing. GL: Conceptualization, Writing–review and editing. ZW: Conceptualization, Writing–review and editing. QP: Supervision, Writing–review and editing. YQ: Data curation, Writing–review and editing.
The author(s) declare financial support was received for the research, authorship, and/or publication of this article. This research was funded by The Third Xinjiang Scientific Expedition Project (grant number 2022xjkk1004), National Natural Science Foundation of China (grant number 42201447), National Natural Science Foundation of China (grant number 42101459) and Special Project for the Fundamental Research Operating Costs of the Central Universities (grant number 2021ZDPY0205).
The authors declare that the research was conducted in the absence of any commercial or financial relationships that could be construed as a potential conflict of interest.
All claims expressed in this article are solely those of the authors and do not necessarily represent those of their affiliated organizations, or those of the publisher, the editors and the reviewers. Any product that may be evaluated in this article, or claim that may be made by its manufacturer, is not guaranteed or endorsed by the publisher.
Beck, H. E., McVicar, T. R., van Dijk, A. I. J. M., Schellekens, J., de Jeu, R. A. M., and Bruijnzeel, L. A. (2011). Global evaluation of four avhrr-ndvi data sets: intercomparison and assessment against landsat imagery. Remote Sens. Environ. 115, 2547–2563. doi:10.1016/j.rse.2011.05.012
Bianchi, E., Villalba, R., and Solarte, A. (2020). Ndvi spatio-temporal patterns and climatic controls over northern patagonia. Ecosystems 23, 84–97. doi:10.1007/s10021-019-00389-3
Chang, J., Liu, Q., Wang, S., and Huang, C. (2022). Vegetation dynamics and their influencing factors in China from 1998 to 2019. Remote Sens. 14, 3390. doi:10.3390/rs14143390
Chen, C. B., Li, G. Y., and Peng, J. (2023). Spatio-temporal characteristics of Xingjiang grassland NDVI and its response to climate change from 1981 to 2018. Acta Ecol. Sin. 43, 1537–1552. doi:10.5846/stxb202201260251
Cui, L., Wang, L., Singh, R. P., Lai, Z., Jiang, L., and Yao, R. (2018). Association analysis between spatio temporalvariationofvegetation greenness and precipitation/temperature in the yangtze river basin (China). Environ. Sci. Pollut. Res. 25, 21867–21878. doi:10.1007/s11356-018-2340-4
Cui, L. L., and Shi, J. (2010). Temporal and spatial response of vegetation ndvi to temperature and precipitation in eastern China. J. Geogr. Sci. 20, 163–176. doi:10.1007/s11442-010-0163-4
Cui, S., Jia, C. Y., Guo, L., Fu, Q., and Liu, D. (2023). Impacts of extreme climate events at different altitudinal gradient on vegetation NPP in Songhua River Ba-sin. Environ. Sci. 2023, 1–17. doi:10.13227/j.hjkx.202301118
Dutta, D., Das, P. K., Paul, S., Sharma, J. R., and Dadhwal, V. K. (2015). Assessment of ecological disturbance in the mangrove forest of sundarbans caused by cyclones using modis time-series data (2001-2011). Nat. Hazards. 79, 775–790. doi:10.1007/s11069-015-1872-x
Freemantle, V., Freemantle, J., Atkinson, D., and Treitz, P. (2020). A high spatial resolution satellite remote sensing time series analysis of cape bounty, melville island, nunavut (2004-2018). Can. J. Remote Sens. 46, 733–752. doi:10.1080/07038992.2020.1866979
Fu, J., Qin, J. X., Zhang, M., and Long, Y. H. (2016). Spatial-temporal variations of vegetation coverage in the lake dongting basin from 2001 to 2013. Geo spat. Inf. Sci. 18, 1209–1216. doi:10.3724/SP.J.1047.2016.01209
Guan, J., Yao, J., Li, M., and Zheng, J. (2021). Assessingthespatiotemporalevolutionofanthropogenicimpacts on remotely sensed vegetation dynamics in xinjiang, China. Remote Sens. 13, 4651. doi:10.3390/rs13224651
Guo, B., Zhang, J., Meng, X., Xu, T., and Song, Y. (2020). Long-term spatio-temporal precipitation variations in China with precipitation surface interpolated by anusplin. Sci. Rep. 10, 81. doi:10.1038/s41598-019-57078-3
He, J. Q., Wei, Y., Gao, W. D., Chen, Y. F., Ma, Y. D., et al. (2022). Temporal and spatial variation of vegetation NDVI and its response to climatic factors in the southeastern margin of Mu Us Sandy Land. Arid. land Geogr. 45, 1523–1533. doi:10.12118/j.issn.1000-6060.2021.017
Horion, S., Cornet, Y., Erpicum, M., and Tychon, B. (2013). Studying interactions between climate variability and vegetation dynamic using a phenology based approach. Int. J. Appl. Earth Obs. Geoinf. 20, 20–32. doi:10.1016/j.jag.2011.12.010
Jiang, L., Jiapaer, G., Bao, A., Guo, H., and Ndayisaba, F. (2017). Vegetation dynamics and responses to climate change and human activities in central asia. Sci. Total Environ. 599, 967–980. doi:10.1016/j.scitotenv.2017.05.012
Li, H., Renssen, H., and Roche, D. M. (2019). Global vegetation distribution driving factors in two dynamic global vegetation models of contrasting complexities. Glob. Planet. Change. 180, 51–65. doi:10.1016/j.gloplacha.2019.05.009
Li, M. L., Yin, L. C., Zhang, Y., Su, X. K., Liu, G. H., et al. (2021). Spatio-temporal dynamics of fractional vegetation coverage based on MODIS-EVI and its driving factors in Southwest China. Acta Ecol. Sin. 41, 1138–1147. doi:10.5846/stxb201907101451
Li, Y. S., Zhou, J. X., and Wu, X. Q. (2017). Effects of the construction of Qinghai-Tibet railway on the vegetation ecosystem and eco-resilience. Geogr. Res. 36, 2129–2140. doi:10.11821/dlyj201711008
Liu, Y., Liu, H., Chen, Y., Gang, C., and Shen, Y. (2022). Quantifying the contributions of climate change and humanactivitiestovegetationdynamicinchina based on multiple indices. Sci. Total Environ. 838, 156553. doi:10.1016/j.scitotenv.2022.156553
Long, X., Li, J., and Liu, Q. H. (2013). Review on VI compositing algorithm. Remote Sens. Tech. Appl. 28, 969–977.
Lu, Y., Zhang, L., Yan, H. M., Ren, X. L., Wang, J. B., Zhongen, N. I. U., et al. (2018). Spatial and temporal patterns of changing vegetation and the influence of environmental factors in the karst region of Southwest China. Acta Ecol. Sin. 38, 8774–8786. doi:10.5846/stxb201807251593
Luo, L., Ma, W., Zhuang, Y., Zhang, Y., Yi, S., Xu, J., et al. (2018). The impacts of climate change and human activities on alpine vegetation and permafrost in the qinghai-tibet engineering corridor. Ecol. Indic. 93, 24–35. doi:10.1016/j.ecolind.2018.04.067
Ma, C., Cui, P. P., Zhong, G. R., Meng, M., Yang, C., et al. (2021b). Impact of climate change and engineering activities on spatiotemporal changes of vegetation index along Qinghai-Tibet Railway. Geoge. Res. 40, 35–51. doi:10.11821/dlyj020200528
Ma, C., Li, T., and Liu, P. (2021a). Gimmsndvi3g+(1982-2015) responsetoclimatechange and engineering activities along the qinghai-tibet railway. Ecol. Indic. 128, 107821. doi:10.1016/j.ecolind.2021.107821
Ma, N., Bai, T., Cai, C. C., and Li, D. Y. (2022). Characteristics of vegetation cover change in xinjiang based on NDVI. North. Hortic. 2022, 145–154. doi:10.11937/bfyy.2022153
Ma, R., Xia, C. L., Zhang, J. Q., and Shen, X. J. (2023). Spatiotemporal variation of vegetation NDVI and its response to climate change in the temperate grassland region of China. Chin. J.Ecol. 42, 395–405. doi:10.13292/j.1000-4890.202302.015
Meng, J., Du, X., and Wu, B. (2013). Generation of high spatial and temporal resolution ndvi and its application in crop biomass estimation. Int. J. Digit. Earth 6, 203–218. doi:10.1080/17538947.2011.623189
Milich, L., and Weiss, E. (2000). Gacndviinterannualcoefficientofvariation (cov) images: ground truth sampling of the sahel along north-south transects. Int. J. Remote Sens. 21, 235. 260. doi:10.1080/014311600210812
Munyati, C., and Mboweni, G. (2013). Variation in ndvi values with change in spatial resolution for semi-arid savanna vegetation: a case study in northwestern South Africa. Int. J. Remote Sens. 34, 2253–2267. doi:10.1080/01431161.2012.743692
Olthof, I., and Pouliot, D. (2010). Treeline vegetation composition and change in Canada's western subarctic from avhrr and canopy reflectance modeling. Remote Sens. Environ. 114, 805–815. doi:10.1016/j.rse.2009.11.017
Otto, M., Hoepfner, C., Curio, J., Maussion, F., and Scherer, D. (2016). Assessing vegetation response to precipitation in northwest Morocco during the last decade: an application of modis ndvi and high resolution reanalysis data. Theor. Appl. Climatol. 123, 23–41. doi:10.1007/s00704-014-1344-3
Sardina, L. C., Irisarri, G., and Texeira, M. (2023). Climate factors rather than human activities controlled ndvi trends across wet meadow areas in the andes centrales of Argentina. J. Arid. Environ. 214, 104983. doi:10.1016/j.jaridenv.2023.104983
Scheftic, W., Zeng, X., Broxton, P., and Brunke, M. (2014). Intercomparison of seven ndvi products over the United States and Mexico. Remote Sens. 6, 1057–1084. doi:10.3390/rs6021057
Wang, J. S., Bi, R. T., He, P., Xu, L. S., Liu, Z. C., et al. (2023). Variations of NDVI during main growing season in the Loess Plateau under climate change. Chin. J.Ecol. 42, 67–76. doi:10.13292/j.1000-4890.202301.014
Wang, Q., Zhang, T. B., Yi, G. H., Chen, T. T., Bie, X. J., and He Yixuan, 何. (2017). Tempo-spatial variations and driving factors analysis of net primary productivity in the Hengduan mountain area from 2004 to 2014. Acta Ecol. Sin. 37, 3084–3095. doi:10.5846/stxb201602030248
Wu, Y., Gu, L., Li, S., Guo, C., Yang, X., Xu, Y., et al. (2022). Responses of ndvi to climate change and lucc along large-scale transportation projects in fragile karst areas, sw China. Land 11, 1771. doi:10.3390/land11101771
Xie, P. J., Sun, W. Y., Mu, X. M., and Gao, P. (2023). Research on the shift change of vegetation greenness line in the Loess Plateau in recent 30 years based on GEE platform. China Environ. Sci. 2023, 1–12. doi:10.19674/j.cnki.issn1000-6923.20230802.001
Xiong, X. T., Li, C. H., and Chen, J. H. (2023). Topographic regulatory role of vegetation response to climate change. Acta Geogr. Sin. 78, 2256–2270. doi:10.11821/dlxb202309009
Xu, B., Li, J., Luo, Z., Wu, J., Liu, Y., Yang, H., et al. (2022). Analyzing the spatio temporal vegetation dynamics and their responses to climate change along the ya'an-linzhi section of the sichuan-tibet railway. Remote Sens. 14, 3584. doi:10.3390/rs14153584
Xu, Y., Luo, J. F., Zhou, J. X., Wang, L. N., and Yang, M. X. (2020). Secondary community characteristics and interspecific associations in alpine mead-ow areas along the Qinghai-Tibet railway. Pratac. Sci. 37, 41–51. doi:10.11829/j.issn.1001-0629.2019-0262
Xu, Y., Pan, Y. C., Zou, B., Zheng, Z. W., and Guo, Z. D. (2023). Quantitative assessment of the impact of climate change on the growing season of vegetation gross primary productivity in the middle and lower reaches of the Yangtze River. Environ. Sci. 2023, 1–20. doi:10.13227/j.hjkx.202304152
Xue, J., Wang, Y., Teng, H., Wang, N., Li, D., Peng, J., et al. (2021). Dynamics of vegetation greenness and its response to climate change in xinjiang over the past two decades. Remote Sens. 13, 4063. doi:10.3390/rs13204063
Xue, J. Q. (2023). Calculation of the spatiotemporal scale and value of the impact of railway corridors on the ecological environment and carbon storage ——taking the Beijing Zhangjiakou Railway as an Example, Beijing Jiaot. University.Xue Jiaqi.
Yang, C., Xing, Y. Q., and Ma, C. (2022). The response of NDVI along the Qinghai-Tibet railway to human activities and climate change. Sci. Surv. Mapp. 47, 137–145. doi:10.16251/j.cnki.1009-2307.2022.04.018
Yang, C. Y., Wang, S. X., Yang, C. Y., Feng, C. Y., Gao, Y. N., et al. (2021). Spatial-temporal variation characteristics of vegetation coverage along Sichuan-Tibet railway. J.Arid Land Resour.Environ. 35, 174–182. doi:10.13448/j.cnki.jalre.2021.085
Yang, M. (2023). Study on the net-impact of China-Europe railway express on urban environment changes based on RSEI model: a case study in Poland, Beijing university of civil engineering and architecture.Yang Miao. doi:10.26943/d.cnki.gbjzc.2023.000363
Yin, J., Zhan, X., Zheng, Y., Hain, C. R., Ek, M., Wen, J., et al. (2016). Improving noah land surface model performance using near real time surface albedo and green vegetation fraction. Agric. For. Meteorol. 218, 171–183. doi:10.1016/j.agrformet.2015.12.001
Yu, H., Bian, Z., Mu, S., Yuan, J., and Chen, F. (2020). Effects of climate change on landcover change and vegetation dynamics in xinjiang, China. Int.J. Environ. Res. Public Health 17, 4865. doi:10.3390/ijerph17134865
Zhang, H., Ali, S., Ma, Q., Sun, L., Jiang, N., Jia, Q., et al. (2021a). Remote sensing strategies to characterization of drought, vegetation dynamics in relation to climate change from 1983 to 2016 in tibet and xinjiang province, China. Environ. Sci. Pollut. Res. 28, 21085–21100. doi:10.1007/s11356-020-12124-w
Zhang, H., Li, M., Song, J. Y., and Han, W. H. (2021b). Analysis of driving factors of vegetation NDVI change in Qilian Mountain National Park based on geographic detector. Chin. J.Ecol. 40, 2530–2540. doi:10.13292/j.1000-4890.202108.022
Zhao, H. Y., Chen, Y., Zhou, Y., Pei, T. T., Xie, B. P., et al. (2019). Spatiotemporal variation of NDVI in vegetation growing season and its responses to climatic factors in mid and eastern Gansu Province from 2008 to 2016. Arid. land Geogr. 42, 1427–1435. doi:10.12118/j.issn.1000-6060.2019.06.22
Zhou, M. T., Li, J., and Zhu, K. W. (2015). Spatial-temporal dynamics of different types of vegetation NDVI and its response to climate change in Xinjiang during 1998-2012. Arid. Land Geogr. 38, 779–787. doi:10.13826/j.cnki.cn65-1103/x.2015.04.016
Zhou, Y. K., and Liu, J. W. (2018). Spatiotemporal analysis of vegetation phenology with multiple methods over the Tibetan plateau based on MODIS NDVI data. Remote Sens.Tech. Appl. 33, 486–498. doi:10.11873/j.issn.1004-0323.2018.3.0486
Zhu, L. F., Xie, S. Y., Yang, H., and Ma, M. G. (2018). Study on the spatial-temporal variability of vegetation coverage based on MODIS/EVI in Chongqing. Acta Ecol. Sin. 38, 6992–7002. doi:10.5846/stxb201709131650
Zou, C. X., Shen, W. S., Zhao, L. H., Zhang, H., and Li, H. D. (2012). Evaluation of the impact of railway construction on ecosystem integrity in the northwestern cold and arid region: a case study of the Minle to yumen section of the second line of the Lanxin railway. J. Ecol. Rural Environ. 28, 633–637. doi:10.3969/j.issn.1673-4831.2012.06.005
Keywords: trend analysis, scope of influence, coefficient of variation, railway project, driving factors
Citation: Chen X, Yan Q, Yi M, Ma X, Li G, Wu Z, Pan Q and Qiu Y (2024) Analysis of spatial and temporal variations of NDVI and its driving factors in the corridor of Lan-Xin railway. Front. Environ. Sci. 12:1369974. doi: 10.3389/fenvs.2024.1369974
Received: 13 January 2024; Accepted: 13 May 2024;
Published: 27 May 2024.
Edited by:
Shuisen Chen, Guangzhou Institute of Geography, ChinaReviewed by:
Kinga Kulesza, Institute of Geodesy and Cartography, PolandCopyright © 2024 Chen, Yan, Yi, Ma, Li, Wu, Pan and Qiu. This is an open-access article distributed under the terms of the Creative Commons Attribution License (CC BY). The use, distribution or reproduction in other forums is permitted, provided the original author(s) and the copyright owner(s) are credited and that the original publication in this journal is cited, in accordance with accepted academic practice. No use, distribution or reproduction is permitted which does not comply with these terms.
*Correspondence: Qingwu Yan, eWFucWluZ3d1QGN1bXQuZWR1LmNu
Disclaimer: All claims expressed in this article are solely those of the authors and do not necessarily represent those of their affiliated organizations, or those of the publisher, the editors and the reviewers. Any product that may be evaluated in this article or claim that may be made by its manufacturer is not guaranteed or endorsed by the publisher.
Research integrity at Frontiers
Learn more about the work of our research integrity team to safeguard the quality of each article we publish.