 Stefania Renna
 Jacopo Lunghi
 Francesco Granella1,2,4
 Maurizio Malpede
95% of researchers rate our articles as excellent or good
Learn more about the work of our research integrity team to safeguard the quality of each article we publish.
Find out more
ORIGINAL RESEARCH article
Front. Environ. Sci. , 11 July 2024
Sec. Toxicology, Pollution and the Environment
Volume 12 - 2024 | https://doi.org/10.3389/fenvs.2024.1369678
This article is part of the Research Topic Atmospheric Aerosol and Pollution: Characterization Techniques and Source Identification View all 7 articles
Air pollution is one of the main environmental health concerns globally, with particulate matter (PM) as the primary threat. While many policies address emissions from transport and industry, there is growing evidence of agriculture’s significant impact on air quality. Evaluating how intensive farming impacts PM concentrations and public health is necessary for informed policy interventions. We focus on the Po Valley (Italy), characterized by intensive agricultural practices and substantial pollution levels. Our study examines secondary inorganic aerosol (SIA) concentrations between 2013 and 2020 in Lombardy. Our findings reveal key insights into the impact of intensive farming on air pollution and public health. First, we find that ammonium salts make up over 30% of the daily particulate matter
The European Environment Agency (EEA) and the World Health Organization (WHO) rank air pollution as Europe’s greatest environmental health risk. Outdoor air pollution alone is responsible for more than 327,000 premature deaths every year. Fine particulate matter with a diameter less than or equal to 2.5 μm (
In Italy, the majority of fatalities occur in the Po Valley, a densely populated and highly industrialized region of Northern Italy with some of the highest particulate matter (PM) concentrations among OECD countries (European Environment Agency, 2023a). Due to this basin’s unique geo-morphological and meteorological conditions, the chemical regimes of PM are complex, non-linear, and spatially varying, exacerbating pollution levels (Thunis et al., 2021).
Additionally, the Po Valley is a hub for intensive agricultural activities and livestock farming, resulting in high atmospheric ammonia (
Concerning both short and long-term PM components’ toxicity and their related effects on health, the existing research is still insufficient (Kinney et al., 2010; Atkinson et al., 2014; Chung et al., 2015; Wyzga and Rohr, 2015; Badaloni et al., 2017; Chen and Hoek, 2020), in particular on the role of nitrates and sulfates (Cassee et al., 2013; World Health Organization Regional Office for Europe, 2013). Some studies suggest that the inorganic components of PM might be less detrimental than the carbonaceous part (Schlesinger and Cassee, 2003), which could be up to five times more harmful (Tuomisto et al., 2008; Lelieveld et al., 2015), and than combustion aerosols in general (Park et al., 2018). However, other researchers have obtained different findings. Achilleos et al. (2017) find in their meta-analysis that the short-term association between
Numerous analyses on the role of agriculture on air pollution and on the spatiotemporal distribution of
Given that the most critical health impacts originate from PM itself, unlike previous studies, we focus on SIA, a component of PM, rather than
Our study is one of the few exploring long-range transport patterns and their impact on SIA formation in Lombardy across a long time series. One of the agricultural activities with a substantial impact on SIA formation is the broadcasting of manure. We look at the impact of manure spreading on the observed SIA levels in Milan. Finally, we evaluate the health impact of agriculture. This involves estimating the number of deaths and years of life lost attributable to exposure to ammonium salts as a fraction of
PM may either be directly emitted into the atmosphere through biogenic or anthropogenic emissions (primary aerosol) or may indirectly result from chemical reaction processes (secondary aerosol) (Seinfeld and Pandis, 2016). In Europe’s urban environments, including the Po Valley, the secondary aerosol component of PM prevails in the total mass concentration (Larsen et al., 2012; Aksoyoglu et al., 2017; Thunis et al., 2021; Clappier et al., 2021).
Depending on the composition, secondary aerosol may be classified as secondary organic aerosol (SOA) or as secondary inorganic aerosol (SIA). Gaseous precursors of the SIA are atmospheric
In Italy,
Lombardy, located in Northern Italy within the Po Valley, is the region with the highest number of livestock units and intensive rearing in the country. It also stands among the leading regions in Europe in terms of livestock (Statistical Office of the European Union, 2023). Refer to Supplementary Figure S1 to compare cattle and pig livestock numbers in Lombardy with other European regions. As of the conclusion of 2021, Lombardy housed approximately 27.58% of the Italian cattle population, amounting to 1,555,372 units, and a substantial 50.55% of the Italian pig population, totaling 4,242,918 units (Pretolani and Rama, 2022). Notably, within the category of ruminants with significant dietary requirements, more than one-fourth of milk cows were found in Lombardy. However, Lombardy’s breeding farms represented only 10% and 8.84% of the Italian total for cattle and pigs, respectively. In the context of agricultural emissions of
Due to its high anthropogenic activity but also to its geographical characteristics, Lombardy is particularly subject to the accumulation of pollutants and poor air quality for prolonged periods. In particular, the presence of the Alps on the northern and western side and of the Apennines on the southern side determine weak wind conditions and frequent thermal inversion episodes, hindering atmospheric dispersion and trapping pollution to the ground (Caserini et al., 2017).
In this study, we employed a wide range of data types, including air quality, meteorological conditions, livestock, crop areas, effluent dispersion, population demographics, and mortality statistics. All of these data sets are readily accessible online, with the exception of PM speciation data, which are provided by the regional environmental protection agency, Agenzia Regionale per la Protezione dell’Ambiente (ARPA Lombardia), which is in charge of collecting samples and validating the data for the territory of Lombardy in the appliance of the European Directive on Air Quality (European Union, 2008). For further details on the analytical methods followed by ARPA Lombardia and the instrumentation employed, see Supplementary Section S1. Supplementary Tables S1, S2 report the limit of detection and the uncertainty associated with the ions’ measurements.
Specifically, we have gathered daily data on air pollutants from the Open Data Lombardia portal (Regione Lombardia, 2021), with a particular focus on select pollutants and trace gases, including
Concentrations are expressed in
1. The urban background station on Pascal Street in the city of Milan, characterized by a highly urbanized environment.
2. The urban traffic station on Senato Street in the city of Milan, also in an urban setting.
3. The rural background station in Schivenoglia, situated in the Mantua province in South Eastern Lombardy, known for its predominantly agricultural surroundings.
For the sake of simplicity, we will refer to these air quality stations as follows: the background station in Milan (Pascal), the traffic station in Milan (Senato), and the rural station in Schivenoglia. Notice that ammonium salt data are available for all stations until August 2020. However, for the rural station, data prior to February 2018 is not available. In Figure 1, the geographical locations of each air quality station within the region are displayed in relation to land use categories, which include urban areas (colored in grey), agricultural areas (yellow), forests (green), wetlands (violet), and bodies of water (light blue). Notice that livestock specialization prevails in the Lombardy plain to the east of Milan, which is much more limited in the west, where the prevalent specialized crop is rice paddy (Regione Lombardia, 2019).
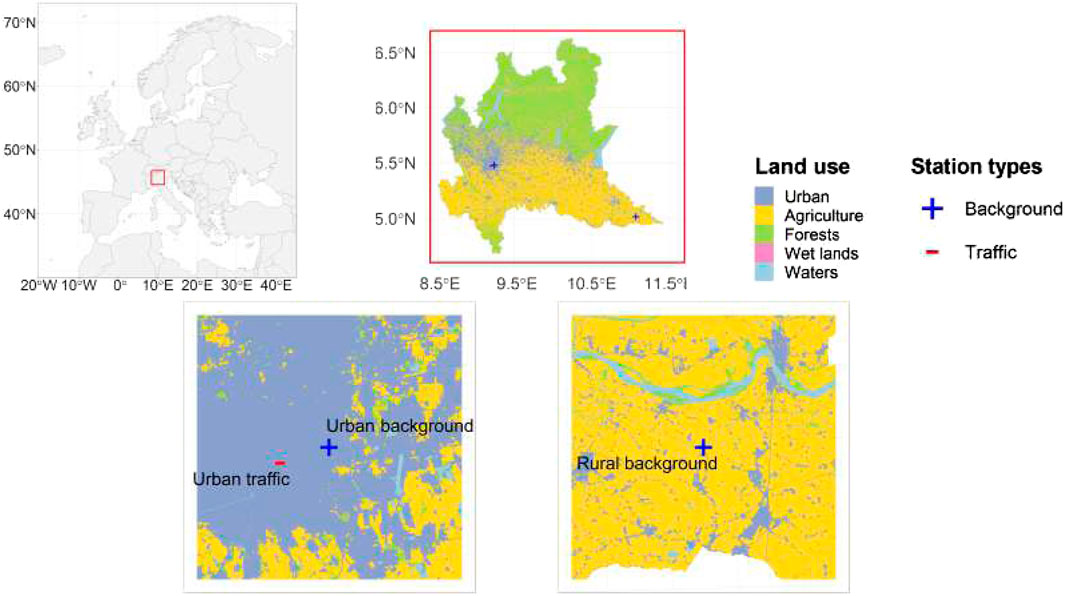
Figure 1. Air quality stations with respect to land use in Lombardy. Land use categories are urban areas, agricultural areas, forests, wetlands, and waters (colored in grey, yellow, green, violet, and light blue, respectively). The blue cross identifies background stations, while the red one identifies traffic stations. Map of Europe with a red rectangle over Lombardy.
Meteorological conditions, namely, wind speed and wind direction, have been sourced from weather station data available on the regional open data portal (Regione Lombardia, 2021). Since the meteorological and air quality stations are not co-located, we have associated weather conditions with air quality stations using the nearest weather station. Specifically, the nearest weather station for Milan’s background air quality station (Juvara) is located approximately 1.2 kilometers (km) away. For Milan’s traffic air quality station, the closest meteorological urban site (Brera) is situated approximately 660 m away. As for the rural air quality station, the nearest weather station is located in Sermide, a semi-urban environment in the province of Mantua, at a distance of 16 km. The lack of co-location between the monitoring stations may introduce minor measurement errors in attributing wind conditions. However, this is unlikely to significantly impact the analyses exploiting aggregate weather conditions under Section 3.2. In urban areas like Milan, small distances between stations do not typically result in major variations in wind speed and direction due to homogeneous meteorological conditions. For rural stations, such as those in the flat Manua province, distant weather stations likely still provide representative wind patterns, as topographical features have less influence on wind conditions.
Annual livestock consistencies are available on the data portal of the statistical office of the European Union (Eurostat) (Statistical Office of the European Union, 2023). Six-month data on livestock numbers are accessible through the National Data Bank of the Zootechnical Registry portal (Ministero della Salute, 2021). Regarding the spreading of livestock effluents (referred to as “spreading windows”), starting in 2016, the Regional Agency for Agricultural and Forestry Services (ERSAF) has been providing information twice a week through a bulletin that specifies permissible times for spreading within the six pedoclimatic zones in Lombardy: Alps, Western Prealps, Eastern Prealps, Western Plain, Central Plain, and Eastern Plain. We have obtained these data from the ERSAF website (Ente Regionale per i Servizi all’Agricoltura e alle Foreste, 2021). For a detailed overview of agricultural sources of ammonium salts, refer to Supplementary Section S4.
Information about land use and crop surfaces comes from a regional land use and cover database for the year 2018, known as Destinazione d’Uso dei Suoli Agricoli e Forestali (DUSAF), version 6.0 (Destination of use of agricultural and forest soils) (Regione Lombardia, 2019). Additionally, data on the regional and municipal borders for the year 2021 have been derived from the National Institute of Statistics (ISTAT) (Istituto Nazionale di Statistica, 2021). Lastly, annual population figures, observed all-cause mortality rates, and 3-year life expectancy data for the city of Milan were accessed through the Integrated Statistical System portal of the municipality (Comune di Milano, 2021).
Identifying sources of secondary pollutants that are not directly emitted into the atmosphere can be challenging. We employ a multifaceted approach that integrates various data sources and methods to accomplish this goal. In particular, we build upon the research conducted by Lonati and Cernuschi (2020), utilizing bivariate polar plot (BPP) and bivariate conditional probability distribution function (BCPF) analyses to investigate the relationship between daily concentrations of air pollutants and wind patterns. Notably, our analysis extends beyond
A BPP is a well-established technique for source apportionment. It represents concentration data using polar coordinates (reflecting wind direction) and radial coordinates (indicating a second numeric variable, typically wind speed). This approach provides insights into the probable distance and origin of sources that influence pollution levels at the receptor. We first partition the time series of atmospheric compound concentrations into bins based on wind speed and wind direction and then calculate averages. This method proves valuable in characterizing sources, facilitating the differentiation between diffuse, ground-level sources (such as livestock farms, residential heating, or traffic-related emissions) and point sources with buoyant emissions (including industrial plants, harbors, or airports), as demonstrated by Lonati and Cernuschi (2020). For further details, we refer to Carslaw et al. (2006), Carslaw and Ropkins (2012), Carslaw and Beevers (2013), Uria-Tellaetxe and Carslaw (2014), John H. Seinfeld (2016), and Grange and Carslaw (2019). We generate BPP and BCPF plots using the polarPlot function within the openair R package for air pollution analysis (Carslaw and Ropkins, 2012; Carslaw, 2019).
We also employ long-range back-trajectory techniques to account for the potential influence of distant sources, given that SIA can persist in the atmosphere for up to 2 weeks and be transported. We use the HYbrid Single-Particle Lagrangian Integrated Trajectory (HYSPLIT) model version 5.3.2 (Stein et al., 2015) to derive 72-h air mass back-trajectories for our urban and rural background source receptors. For the simulation, trajectories are calculated daily at 00, 06, 12, and 18 universal Time Coordinated (UTC), starting from date 2013-01-01 to date 2020-08-01;at a height of 100 (Scotto et al., 2021) and 500;m (Ara Begum et al., 2005; Pekney et al., 2006; Zhao et al., 2007; Zhou et al., 2019; Scotto et al., 2021) above ground level (m a.g.l.), respectively. The HYSPLIT model, widely used for calculating atmospheric trajectories (Fleming et al., 2012), was developed by the National Oceanic and Atmospheric Administration (NOAA) Air Resources Laboratory. As meteorology data, we employ the National Center for Environmental Prediction (NCEP)/National Center for Atmospheric Research (NCAR) archived reanalysis data, with a 2.5° latitude-longitude resolution. We use the SplitR R package (Iannone, Richard, 2016) to apply the model and determine trajectories. As methods of analysis, we use the Potential Source Contribution Function (PSCF) and Concentration-Weighted Trajectory (CWT) methods, generated with the openair R package (Carslaw and Ropkins, 2012). The PSCF method provides spatially distributed conditional probabilities of highly polluting sources, based on a concentration percentile of interest (Ara Begum et al., 2005; Pekney et al., 2006; Zhao et al., 2007; Scotto et al., 2021). E.g., we apply PSCF to estimate likely sources contributing to concentrations above the 90th percentile. While PSCF relies on probabilities, the CWT method allows instead calculating a spatial weighted average of concentrations, providing complementary information on sources (Lupu and Maenhaut, 2002; Zhao et al., 2007; Masiol et al., 2015).
To evaluate the human health effects of agricultural activities that emit
AD represent the number of individuals who have experienced premature mortality due to specific causes, such as exposure to air pollution, while YLL quantify the potential lifetime loss due to specific causes (European Environment Agency, 2022). To provide a comprehensive assessment, we compute AD and YLL for both the entire adult population of Milan aged 20 and older and for groups defined by year
Deaths per year, gender, and age group
We exclude mortality from non-natural causes by applying a correction factor of 0.963 specific for the province of Milan taken from Carugno et al. (2017). The correction coefficient is constructed based on 2009–2013 mortality data and calculated excluding violent deaths.
The relative risk
where
In Eq. 2,
The number of years of life lost per year, gender, and age group
Finally, we compute yearly aggregates Eqs. 4, 5 as well as the rates of attributable deaths and years of life lost per 100,000 inhabitants Eqs. 6, 7. This approach follows methodologies used in prior research (Carugno et al., 2017; Giannini et al., 2017).
where
Our data analysis begins with an overview of key pollutant concentrations observed at the three air quality stations, as summarized in Supplementary Tables S6–S8. Notably,
In winter, particulate levels between Milan and Schivenoglia are positively correlated. Specifically,
In the region,
SIA is, on average, a third of
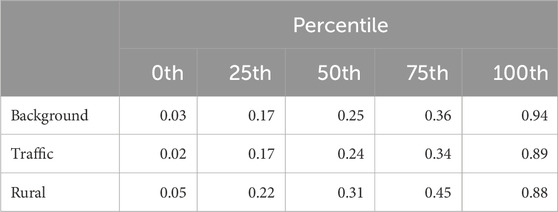
Table 1. Percentiles of ammonium salts’ share in
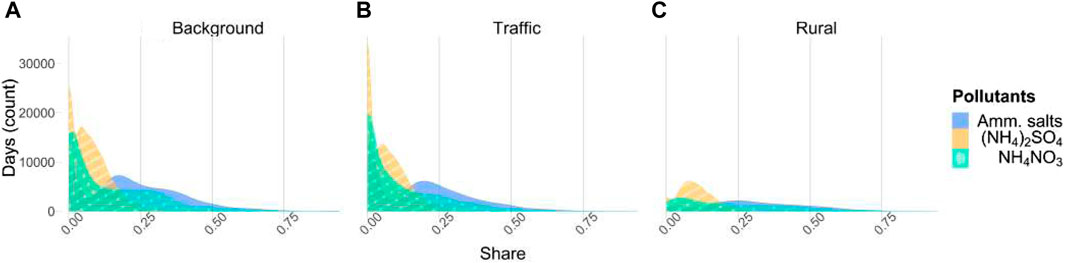
Figure 2. Frequency distribution plots of ammonium nitrates (
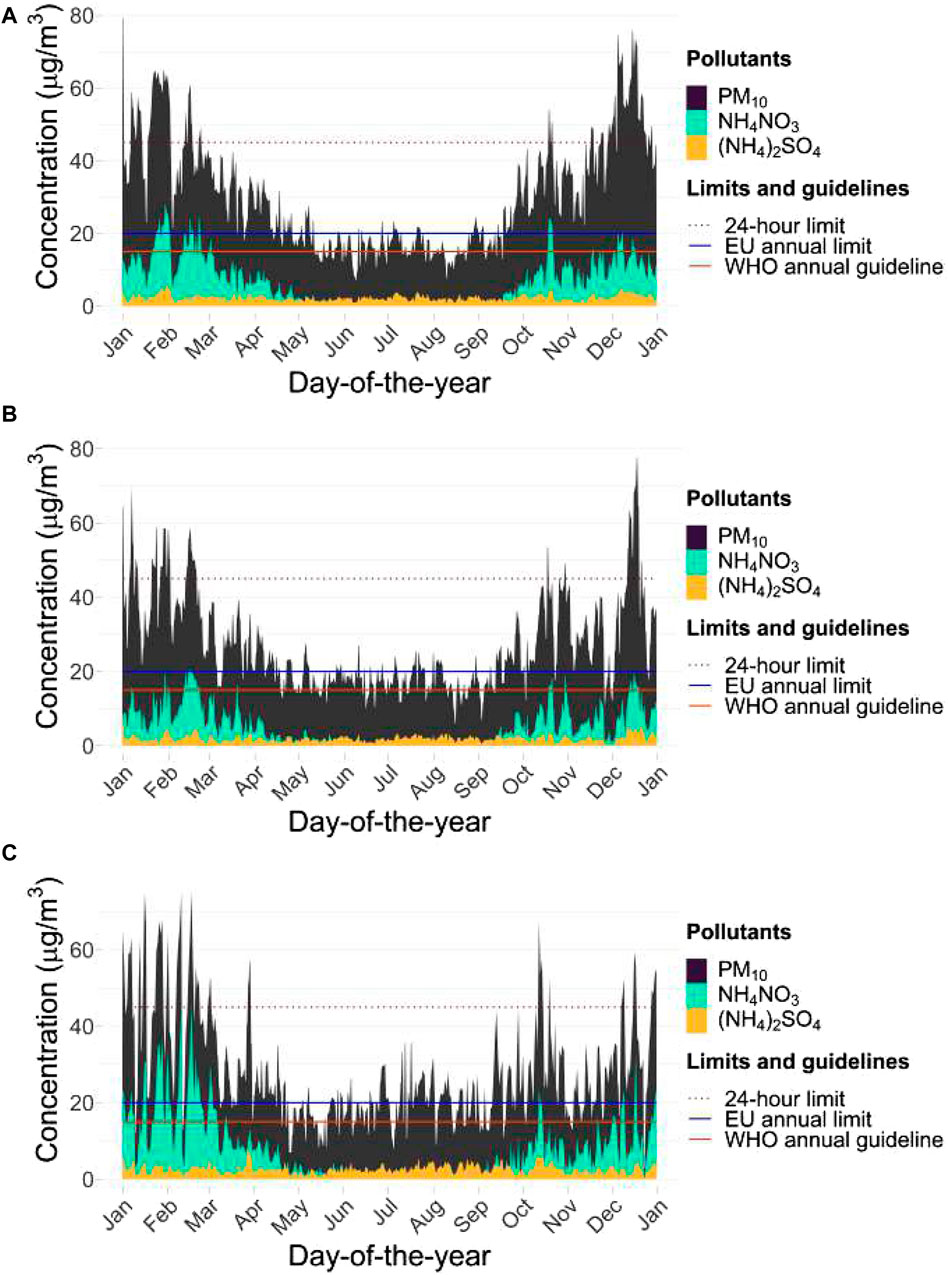
Figure 3. Time series of annualized daily mean concentration levels (2013–2020) for
While there are no regulatory limits for
To investigate the temporal correlation of agriculture activities with the SIA levels measured in Milan, we calculate the cross-correlation between the
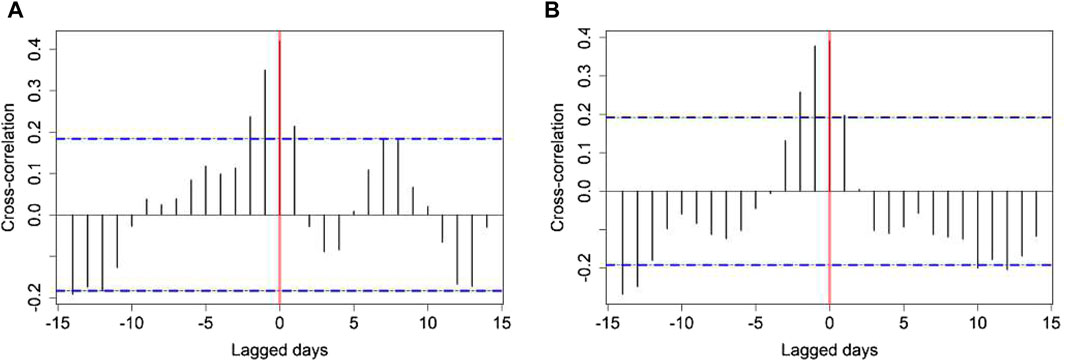
Figure 4. Pearson’s cross-correlation plots between pollutants’ time series in Milan air quality stations and Schivenoglia for winter months only (December, January, February). (A) Lagged
The formation of SIA depends not only on agricultural activities, as seen above but also on meteorological conditions and other pollutants. We analyze the seasonal polar plots of SIA and its precursors in Milan and the rural areas. Supplementary Figures S10–S12 show the average pollutant concentrations by wind conditions for each station and season. Strong seasonal patterns are observed for all stations, and a high variability characterizes each pollutant throughout the year. In particular, winter stands out as the season with the highest concentration values for
To derive insights from specific concentration ranges, we exploit the BCPF technique developed by Uria-Tellaetxe and Carslaw (2014), which puts together the conditional probability function approach with that of polar plots. This way, the BCPF plot associates a probability to a specific concentration level bin, eventually identifying potential sources. We first focus on the worse case pollution episodes and compare the BCPF plots for the range of concentrations
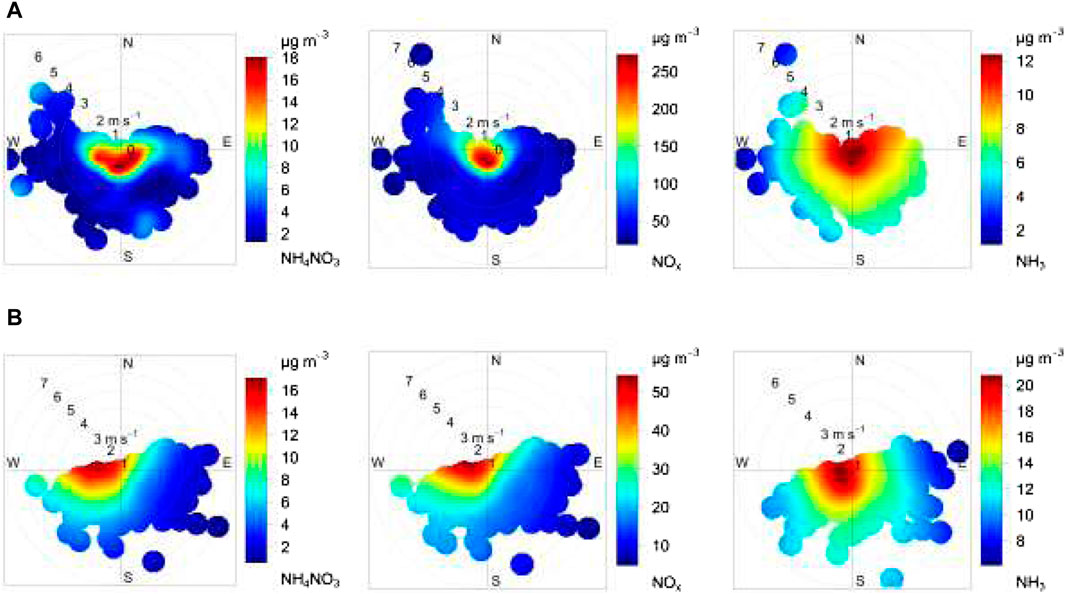
Figure 5. BPP for 2013–2020 mean levels of
Based on recent relevant literature, air pollution sources may be associated with specific concentration ranges (Uria-Tellaetxe and Carslaw, 2014). After having focused on concentration peaks, we use BCPF to find evidence of transported versus locally produced SIA and its precursors. In addition, we examine the average concentrations of pollutants below and above specific threshold values to investigate the wind conditions linked to recommended and undesirable air quality levels. In Figures 6–8, we show BCPF plots for
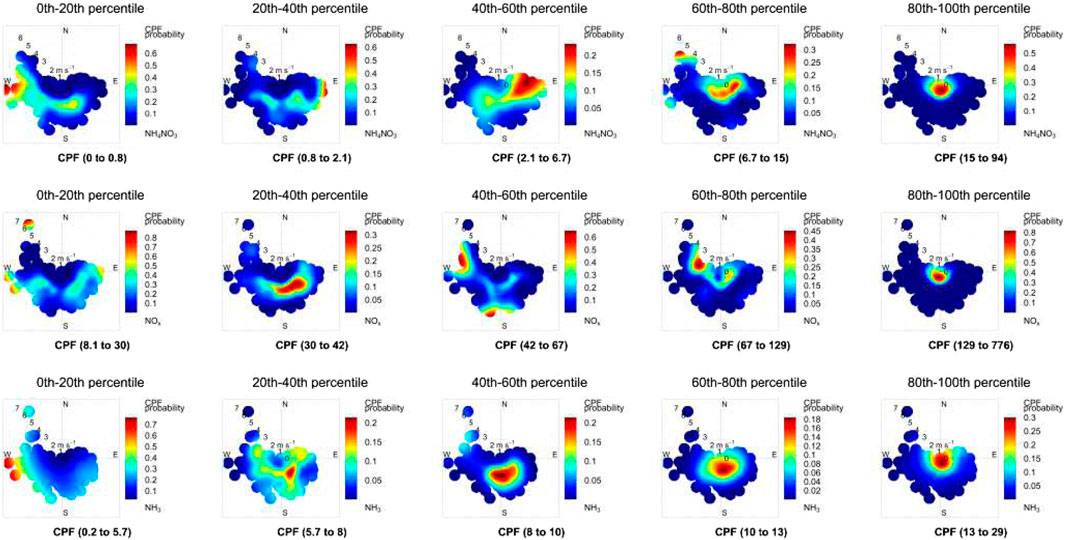
Figure 6. BCPF bins for
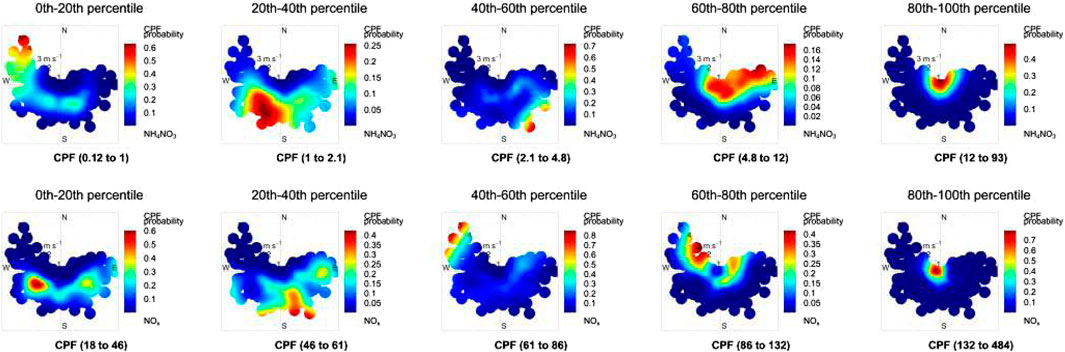
Figure 7. BCPF bins for
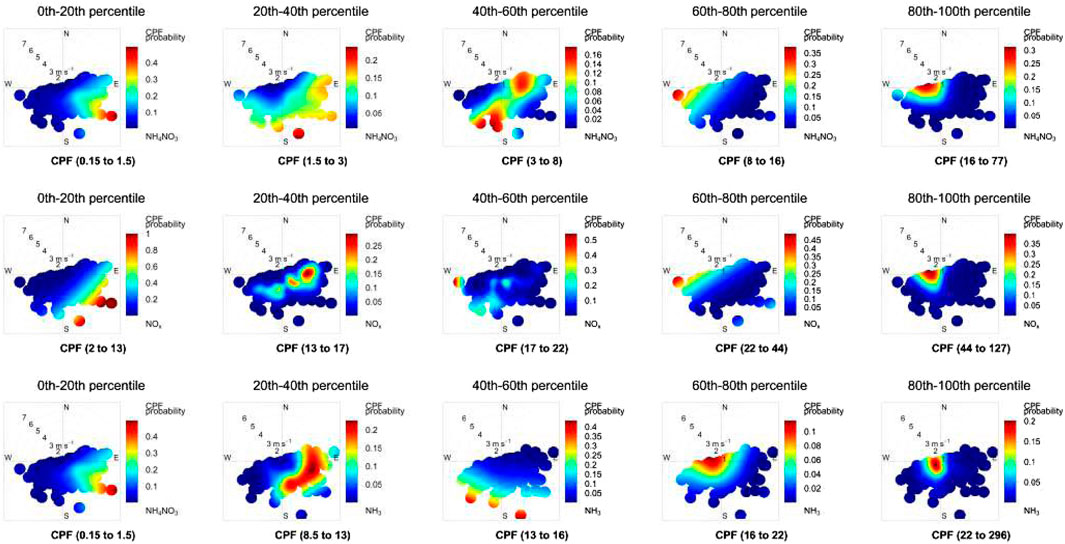
Figure 8. BCPF bins for
Finally, we generate plots of ratios between the cumulative mass of ammonium salts and the total mass of
Concerning Milan’s SIA levels, various graphical analyses have suggested a significant impact from regions known for high livestock density. One of the agricultural activities with a substantial impact on SIA formation is the broadcasting of livestock manure (Pohl et al., 2022; Wyer et al., 2022). We look at the correlation between this activity and the observed SIA levels in Milan, analyzing what happened before and after a spreading event in the Western Plain to which Milan belongs. Figures 9A,B show
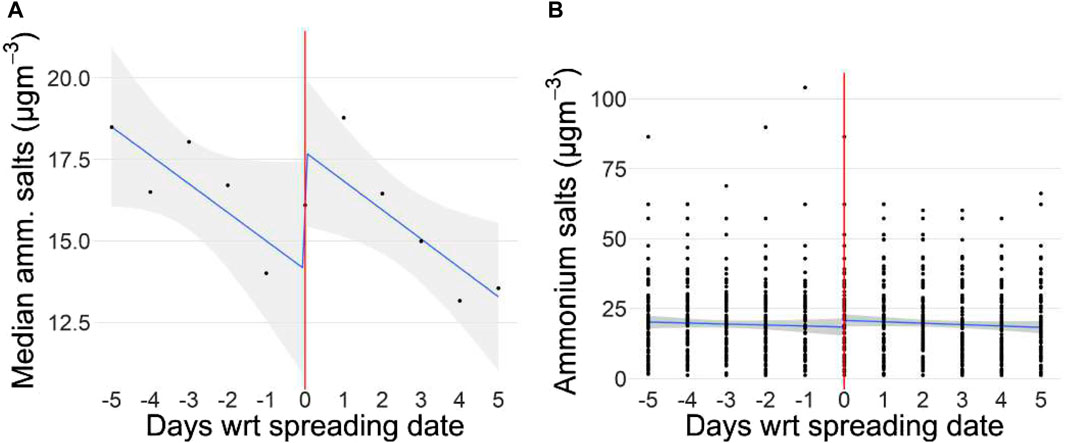
Figure 9. Scatter plots of ammonium salt levels in
After having looked at local contributions to air pollution, we turn to long-range contributions. Back-trajectory techniques have been applied in the Po Valley context in relation to different pollutants and time spans (Sogacheva et al., 2007; Hamed et al., 2007; Masiol et al., 2012; Diémoz et al., 2019; Scotto et al., 2021). We derive 3-day back-trajectories at the urban background receptor location in Milan at 500;m a.g.l. between 01 January 2013 and 29 February 2020, at 0:00, 6:00, 12:00, and 18:00 UTC, excluding months when COVID-19 restrictions were put in place across Europe (Eurostat, 2022).
In Supplementary Figures S22–S24, we show the Potential Source Contribution Function (PSCF) and the Concentration Weighted Trajectory (CWT) seasonal plots for
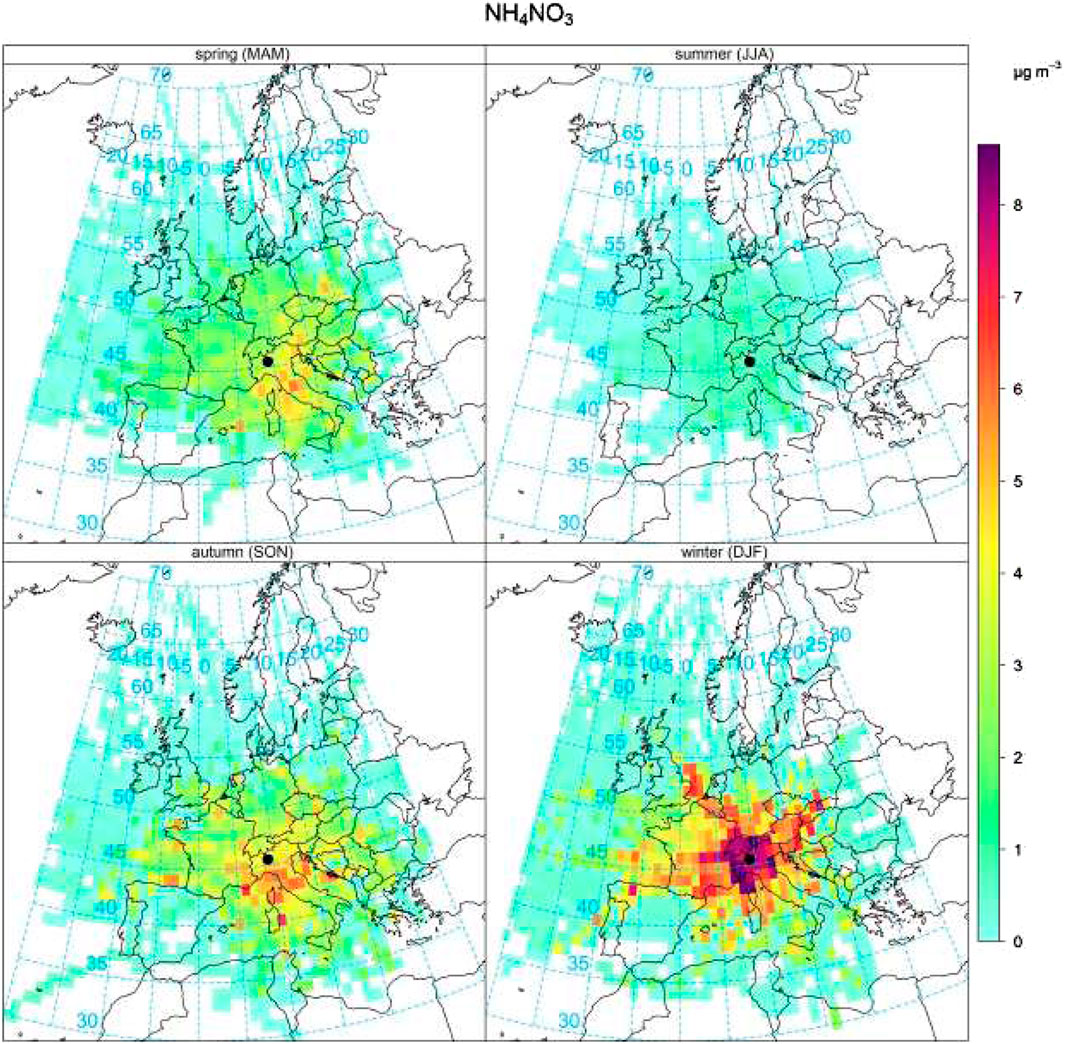
Figure 10. Seasonal gridded 72-h back-trajectory
As a final stage, we shift our focus to evaluating the impact of agriculture-related inorganic
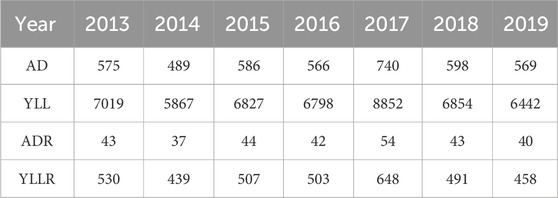
Table 2. Annual attributable deaths (AD), years of life lost (YLL), attributable deaths rate (ADR), and years of life lost rate (YLLR) every 100,000 inhabitants in Milan (2013–2019) due to long-term exposure to ammonium salts as a fraction of
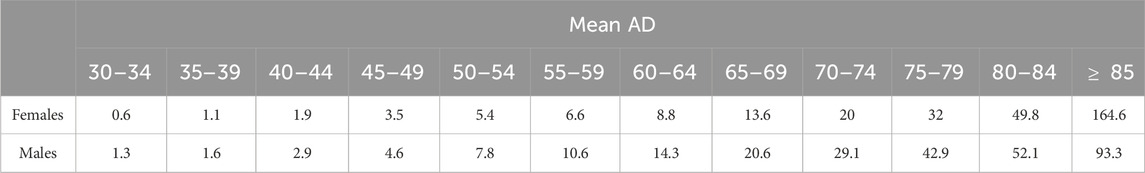
Table 3. 2013–2019 mean attributable deaths (AD) by quinquennial age and gender in Milan due to long-term exposure to ammonium salts as a fraction of
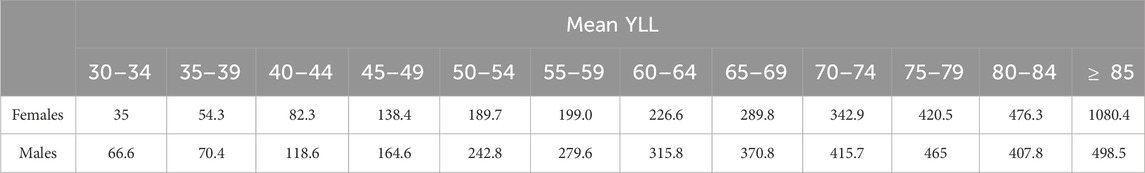
Table 4. 2013–2019 mean years of life lost (YLL) by quinquennial age and gender in Milan due to long-term exposure to ammonium salts as a fraction of
In the region of Lombardy, located in Northern Italy, the agricultural sector stands as the primary source of ammonia (
We find that, at the air quality stations analyzed and especially in rural areas, SIA accounts for a significant portion of the overall
In winter, pollution levels between cities are positively correlated, implying similar trends regardless of local sources, while SIA in Milan’s background air quality station correlates less to
We also find suggestive evidence of the relationship between manure spreading and SIA. Our observations indicate a 2 micrograms per cubic meter of air (
Annually, 589 [446–866] deaths and 6,951 [5,267–10,222] years of life, equivalent to 43 [33–64] and 511 [387–751] every 100,000 inhabitants, are lost on average in Milan due to pollution linked to agricultural activities that could be curbed with technological abatement measures without reducing production. Although referring to
We acknowledge several limitations to our study. The estimation method of ammonium salts is based on the assumption that salts are pure, though this may not be the case, biasing our estimates. We apply long-term concentration-response functions to determine the number of nonaccidental deaths attributable to exposure to ammonium salts, even though on the one hand they were originally constructed for the
Our research adds to an expanding body of literature that explores the impact of agriculture on air quality, specifically focusing on their association rather than causality. However, investigating the causal effect in future studies would be of great interest. Our study also provides insights into the health consequences of secondary air pollution in an urban environment heavily influenced by agricultural activities. Furthermore, our research highlights the importance of PM speciation data and underscores the value of making this information accessible to the public for research purposes and for raising awareness of the complexity of PM pollution.
The datasets presented in this study can be found in online repositories. The names of the repository/repositories and accession number(s) can be found below: 10.17632/2mzdnzfwmt.1.
SR: Conceptualization, Data curation, Formal Analysis, Investigation, Methodology, Software, Visualization, Writing–original draft, Writing–review and editing. JL: Conceptualization, Investigation, Writing–review and editing, Methodology. FG: Investigation, Writing–review and editing, Data curation. MM: Conceptualization, Investigation, Writing–review and editing, Methodology. DD: Investigation, Resources, Supervision, Writing–review and editing, Data curation.
The author(s) declare that financial support was received for the research, authorship, and/or publication of this article. This research has received funding from the Fondazione CARIPLO under the project “INHALE—Impact on human Health of Agriculture and Livestock Emissions,” and from the "GRINS-Growing Resilient, INclusive and Sustainable" project (GRINS PE00000018).
We thank ARPA Lombardia for providing the
The authors declare that the research was conducted in the absence of any commercial or financial relationships that could be construed as a potential conflict of interest.
All claims expressed in this article are solely those of the authors and do not necessarily represent those of their affiliated organizations, or those of the publisher, the editors and the reviewers. Any product that may be evaluated in this article, or claim that may be made by its manufacturer, is not guaranteed or endorsed by the publisher.
The Supplementary Material for this article can be found online at: https://www.frontiersin.org/articles/10.3389/fenvs.2024.1369678/full#supplementary-material
Abeed, R., Viatte, C., Porter, W. C., Evangeliou, N., Clerbaux, C., Clarisse, L., et al. (2022). Estimating agricultural ammonia volatilization over Europe using satellite observations and simulation data. EGUsphere. [preprint]. doi:10.5194/egusphere-2022-1046
Achilleos, S., Kioumourtzoglou, M.-A., Wu, C.-Da, Schwartz, J. D., Koutrakis, P., and Papatheodorou, S. I. (2017). Acute effects of fine particulate matter constituents on mortality: a systematic review and meta-regression analysis. Environ. Int. 109, 89–100. doi:10.1016/j.envint.2017.09.010
Aksoyoglu, S., Ciarelli, G., El-Haddad, I., Baltensperger, U., and Prévôt, A. S. H. (2017). Secondary inorganic aerosols in Europe: sources and the significant influence of biogenic VOC emissions, especially on ammonium nitrate. Atmos. Chem. Phys. 17 (12), 7757–7773. ISSN 1680-7324. doi:10.5194/acp-17-7757-2017
Amato, F., van Drooge, B. L., Jaffrezo, J. L., Favez, O., Colombi, C., Cuccia, E., et al. (2024). Aerosol source apportionment uncertainty linked to the choice of input chemical components. Environ. Int. 184, 108441. ISSN 0160-4120. doi:10.1016/j.envint.2024.108441
Andreani-Aksoyoglu, S., Prévôt, A. S. H., Baltensperger, U., Keller, J., and Dommen, J. (2004). Modeling of formation and distribution of secondary aerosols in the Milan area (Italy). J. Geophys. Res. Atmos. 109 (D5). ISSN 0148-0227. doi:10.1029/2003jd004231
Ara Begum, B., Kim, E., Jeong, C.-H., Lee, D.-W., and Hopke, P. K. (2005). Evaluation of the potential source contribution function using the 2002 Quebec forest fire episode. Atmos. Environ. 39 (20), 3719–3724. ISSN 1352-2310. doi:10.1016/j.atmosenv.2005.03.008
Atkinson, R. W., Mills, I. C., Walton, H. A., and Ross Anderson, H. (2014). Fine particle components and health—a systematic review and meta-analysis of epidemiological time series studies of daily mortality and hospital admissions. J. Expo. Sci. Environ. Epidemiol. 25 (2), 208–214. doi:10.1038/jes.2014.63
Badaloni, C., Cesaroni, G., Cerza, F., Davoli, M., Brunekreef, B., and Forastiere, F. (2017). Effects of long-term exposure to particulate matter and metal components on mortality in the Rome longitudinal study. Environ. Int. 109, 146–154. doi:10.1016/j.envint.2017.09.005
Baek, B. H., Aneja, V. P., and Tong, Q. (2004). Chemical coupling between ammonia, acid gases, and fine particles. Environ. Pollut. 129 (1), 89–98. doi:10.1016/j.envpol.2003.09.022
Bedogni, M., and Pirovano, G. (2011). Source apportionment technique: inorganic aerosol transformation processes in the Milan area. Int. J. Environ. Pollut. 47 (1/2/3/4), 167. ISSN 1741-5101. doi:10.1504/ijep.2011.047333
Belis, C. A., Pirovano, G., Villani, M. G., Calori, G., Pepe, N., and Putaud, J. P. (2021). Comparison of source apportionment approaches and analysis of non-linearity in a real case model application. Geosci. Model. Dev. 14 (7), 4731–4750. doi:10.5194/gmd-14-4731-2021
Burnett, R., and Cohen, A. (2020). Relative risk functions for estimating excess mortality attributable to outdoor PM2.5 air pollution: evolution and state-of-the-art. Atmosphere 11, 589. doi:10.3390/atmos11060589
Cambra-López, M., Aarnink, A. J. A., Zhao, Y., Calvet, S., and Torres, A. G. (2010). Airborne particulate matter from livestock production systems: a review of an air pollution problem. Environ. Pollut. 158 (1), 1–17. doi:10.1016/j.envpol.2009.07.011
Carozzi, M., Ferrara, R., Fumagalli, M., Sanna, M., Chiodini, M., Perego, A., et al. (2012). Field-scale ammonia emissions from surface spreading of dairy slurry in Po Valley. Italian J. Agrometorology 17, 25–34.
Carslaw, D., Beevers, S., Ropkins, K., and Bell, M. (2006). Detecting and quantifying aircraft and other on-airport contributions to ambient nitrogen oxides in the vicinity of a large international airport. Atmos. Environ. 40 (28), 5424–5434. doi:10.1016/j.atmosenv.2006.04.062
Carslaw, D. C. (2019). The openair manual — open-source tools for analysing air pollution data. Man. version 2, 6. Available at: https://davidcarslaw.com/files/openairmanual.pdf.
Carslaw, D. C., and Beevers, S. D. (2013). Characterising and understanding emission sources using bivariate polar plots and k-means clustering. Environ. Model. Softw. 40, 325–329. doi:10.1016/j.envsoft.2012.09.005
Carslaw, D. C., and Ropkins, K. (2012). Openair — an R package for air quality data analysis. Environ. Model. Softw. 27-28, 52–61. doi:10.1016/j.envsoft.2011.09.008
Caserini, S., Giani, P., Cacciamani, C., Ozgen, S., and Lonati, G. (2017). Influence of climate change on the frequency of daytime temperature inversions and stagnation events in the Po Valley: historical trend and future projections. Atmos. Res. 184, 15–23. doi:10.1016/j.atmosres.2016.09.018
Cassee, F. R., Héroux, M.-E., Gerlofs-Nijland, M. E., and Kelly, F. J. (2013). Particulate matter beyond mass: recent health evidence on the role of fractions, chemical constituents and sources of emission. Inhal. Toxicol. 25 (14), 802–812. doi:10.3109/08958378.2013.850127
Chang, M. C., Sioutas, C., Kim, S., Gong, H., and Linn, W. S. (2000). Reduction of nitrate losses from filter and impactor samplers by means of concentration enrichment. Atmos. Environ. 34 (1), 85–98. ISSN 1352-2310. doi:10.1016/s1352-2310(99)00308-8
Chen, J., and Hoek, G. (2020). Long-term exposure to PM and all-cause and cause-specific mortality: a systematic review and meta-analysis. Environ. Int. 143, 105974. doi:10.1016/j.envint.2020.105974
Chen, S., Zhao, Y., and Zhang, R. (2018). Formation mechanism of atmospheric ammonium bisulfate: hydrogen-bond-promoted nearly barrierless reactions of SO3 with NH3 and H2O. ChemPhysChem 19 (8), 967–972. doi:10.1002/cphc.201701333
Chiara Pietrogrande, M., Biffi, B., Colombi, C., Cuccia, E., Dal Santo, U., and Romanato, L. (2024). Contribution of chemical composition to oxidative potential of atmospheric particles at a rural and an urban site in the Po Valley: influence of high ammonia agriculture emissions. Atmos. Environ. 318, 120203. ISSN 1352-2310. doi:10.1016/j.atmosenv.2023.120203
Chung, Y., Dominici, F., Wang, Y., Coull, B. A., and Bell, M. L. (2015). Associations between long-term exposure to chemical constituents of fine particulate matter (PM 2.5) and mortality in medicare enrollees in the eastern United States. Environ. Health Perspect. 123 (5), 467–474. doi:10.1289/ehp.1307549
Clappier, A., Thunis, P., Beekmann, M., Putaud, J. P., and de Meij, A. (2021). Impact of SOx, NOx and NH3 emission reductions on PM2.5 concentrations across Europe: hints for future measure development. Environ. Int. 156, 106699. doi:10.1016/j.envint.2021.106699
Colombo, L., Marongiu, A., Fossati, G., Malvestiti, G., and Angelino, E. (2024). Pm2.5 wintertime sensitivity to changes in nox, so2, and nh3 emissions in Lombardy region. Air Qual. Atmos. Health. ISSN 1873-9326. doi:10.1007/s11869-024-01519-0
Comune di Milano (2021). Sistema statistico integrato. Available at: http://sisi.comune.milano.it/.
Daher, N., Ruprecht, A., Invernizzi, G., Marco, C.De, Miller-Schulze, J., Bae Heo, J., et al. (2012). Characterization, sources and redox activity of fine and coarse particulate matter in Milan, Italy. Atmos. Environ. 49, 130–141. ISSN 1352-2310. doi:10.1016/j.atmosenv.2011.12.011
Diémoz, H., Barnaba, F., Magri, T., Pession, G., Dionisi, D., Pittavino, S., et al. (2019). Transport of Po valley aerosol pollution to the northwestern Alps – Part 1: phenomenology. Atmos. Chem. Phys. 19 (5), 3065–3095. ISSN 1680-7324. doi:10.5194/acp-19-3065-2019
Ehrnsperger, L., and Klemm, O. (2021). Source apportionment of urban ammonia and its contribution to secondary particle formation in a mid-size European city. Aerosol Air Qual. Res. 21 (5), 200404. doi:10.4209/aaqr.2020.07.0404
Ente Regionale per i Servizi all’Agricoltura e alle Foreste (2021). Bollettino nitrati. Available at: https://www.ersaf.lombardia.it/it/servizi-al-territorio/nitrati/bollettini-nitrati/archivio-bollettino-nitrati.
European Commission (2022). Proposal for a Directive of the European Parliament and of the Council on ambient air quality and cleaner air for Europe. Available at: https://eur-lex.europa.eu/legal-content/EN/TXT/?uri=CELEX:52022PC0542 (Accessed October 26, 2023).
European Environment Agency (2023a). European environment and health atlas. Available at: https://discomap.eea.europa.eu/atlas/.
European Environment Agency (2023b). Harm to human health from air pollution in Europe: burden of disease 2023. Tech. Rep.
European Environment Agency (2023c). National air pollutant emissions data viewer 2005-2021. Available at: https://www.eea.europa.eu/data-and-maps/dashboards/necd-directive-data-viewer-7.
European Union (2008). Directive 2008/50/EC of the European Parliament and of the Council of 21 May 2008 on ambient air quality and cleaner air for Europe. Tech. Rep.
Eurostat (2022). Impact of Covid-19 crisis on industrial production. Available at: https://ec.europa.eu/eurostat/.
Fassò, A., Rodeschini, J., Fusta Moro, A., Shaboviq, Q., Maranzano, P., Cameletti, M., et al. (2023). Agrimonia: a dataset on livestock, meteorology and air quality in the Lombardy region, Italy. Sci. Data 10 (1), 143. ISSN 2052-4463. doi:10.1038/s41597-023-02034-0
Fleming, Z. L., Monks, P. S., and Review, A. J. M. (2012). Review: untangling the influence of air-mass history in interpreting observed atmospheric composition. Atmos. Res. 104–105, 1–39. ISSN 0169-8095. doi:10.1016/j.atmosres.2011.09.009
Fu, J., Fei, F., Wang, S., Qi, Z., Yang, X., Zhong, J., et al. (2023). Short-term effects of fine particulate matter constituents on mortality considering the mortality displacement in Zhejiang province, China. J. Hazard. Mater. 457, 131723. doi:10.1016/j.jhazmat.2023.131723
Giannadaki, D., Elias, G., Pozzer, A., and Lelieveld, J. (2018). Estimating health and economic benefits of reductions in air pollution from agriculture. Sci. Total Environ. 622-623, 1304–1316. doi:10.1016/j.scitotenv.2017.12.064
Giannini, S., Baccini, M., Randi, G., Bonafè, G., Lauriola, P., and Ranzi, A. (2017). Estimating deaths attributable to airborne particles: sensitivity of the results to different exposure assessment approaches. Environ. Health 16 (1), 13. doi:10.1186/s12940-017-0213-9
Granella, F., Reis, L. A., Bosetti, V., and Tavoni, M. (2021). Covid-19 lockdown only partially alleviates health impacts of air pollution in northern Italy. Environ. Res. Lett. 16 (3), 035012. ISSN 1748-9326. doi:10.1088/1748-9326/abd3d2
Granella, F., Renna, S., and Reis, L. A. (2024). The formation of secondary inorganic aerosols: a data-driven investigation of Lombardy’s secondary inorganic aerosol problem. Atmos. Environ. 327, 120480. ISSN 1352-2310. doi:10.1016/j.atmosenv.2024.120480
Grange, S. K., and Carslaw, D. C. (2019). Using meteorological normalisation to detect interventions in air quality time series. Sci. Total Environ. 653, 578–588. doi:10.1016/j.scitotenv.2018.10.344
Hamed, A., Joutsensaari, J., Mikkonen, S., Sogacheva, L., Dal Maso, M., Kulmala, M., et al. (2007). Nucleation and growth of new particles in Po Valley, Italy. Atmos. Chem. Phys. 7 (2), 355–376. ISSN 1680-7324. doi:10.5194/acp-7-355-2007
Iannone, Richard (2016). splitr. Available at: https://github.com/rich-iannone/SplitR.
INEMAR - ARPA Lombardia (2022). INEMAR, Inventario Emissioni in Atmosfera: emissioni in Regione Lombardia nell’anno 2019 - versione in revisione pubblica. Milan, Italy: ARPA Lombardia Settore Monitoraggi Ambientali. Available at: https://www.inemar.eu (Accessed: July 22, 2023).
Insitute for Health Metrics and Evaluation (2019). Global burden of disease. Available at: https://vizhub.healthdata.org/gbd-results/.
Istituto Nazionale di Statistica (2021). Istituto Nazionale di Statistica. Available at: https://www.istat.it/it/archivio/222527.
Kinney, P. L., Roman, H. A., Walker, K. D., Richmond, H. M., Conner, L., and Hubbell, B. J. (2010). On the use of expert judgment to characterize uncertainties in the health benefits of regulatory controls of particulate matter. Environ. Sci. Policy 13 (5), 434–443. doi:10.1016/j.envsci.2010.05.002
Larsen, B. R., Gilardoni, S., Stenström, K., Niedzialek, J., Jimenez, J., and Belis, C. A. (2012). Sources for PM air pollution in the Po Plain, Italy: II. Probabilistic uncertainty characterization and sensitivity analysis of secondary and primary sources. Atmos. Environ. 50, 203–213. doi:10.1016/j.atmosenv.2011.12.038
Lee, C. J., Martin, R. V., Henze, D. K., Brauer, M., Cohen, A., and van Donkelaar, A. (2015). Response of global particulate-matter-related mortality to changes in local precursor emissions. Environ. Sci. Technol. 49 (7), 4335–4344. ISSN 1520-5851. doi:10.1021/acs.est.5b00873
Lelieveld, J., Evans, J. S., Fnais, M., Giannadaki, D., and Pozzer, A. (2015). The contribution of outdoor air pollution sources to premature mortality on a global scale. Nature 525 (7569), 367–371. doi:10.1038/nature15371
Lim, J. H., Park, H. Y., and Cho, S. Y. (2022). Evaluation of the ammonia emission sensitivity of secondary inorganic aerosol concentrations measured by the national reference method. Atmos. Environ. 270, 118903. doi:10.1016/j.atmosenv.2021.118903
Lim, S. S., Vos, T., Flaxman, A. D., Danaei, G., Shibuya, K., Adair-Rohani, H., et al. (2012). A comparative risk assessment of burden of disease and injury attributable to 67 risk factors and risk factor clusters in 21 regions, 1990–2010: a systematic analysis for the Global Burden of Disease Study 2010. Lancet 380 (9859), 2224–2260. doi:10.1016/s0140-6736(12)61766-8
Lonati, G., and Cernuschi, S. (2020). Temporal and spatial variability of atmospheric ammonia in the Lombardy region (Northern Italy). Atmos. Pollut. Res. 11 (12), 2154–2163. doi:10.1016/j.apr.2020.06.004
Lonati, G., Giugliano, M., and Ozgen, S. (2008). Primary and secondary components of PM2.5 in Milan (Italy). Environ. Int. 34 (5), 665–670. ISSN 0160-4120. doi:10.1016/j.envint.2007.12.009
Lovarelli, D., Conti, C., Finzi, A., Bacenetti, J., and Guarino, M. (2020). Describing the trend of ammonia, particulate matter and nitrogen oxides: the role of livestock activities in northern Italy during Covid-19 quarantine. Environ. Res. 191, 110048. doi:10.1016/j.envres.2020.110048
Lovarelli, D., Fugazza, D., Costantini, M., Conti, C., Diolaiuti, G., and Guarino, M. (2021). Comparison of ammonia air concentration before and during the spread of COVID-19 in Lombardy (Italy) using ground-based and satellite data. Atmos. Environ. 259, 118534. doi:10.1016/j.atmosenv.2021.118534
Lunghi, J., Malpede, M., and Reis, L. A. (2024). Exploring the impact of livestock on air quality: a deep dive into ammonia and particulate matter in Lombardy. Environ. Impact Assess. Rev. 105, 107456. ISSN 0195-9255. doi:10.1016/j.eiar.2024.107456
Lupu, A., and Maenhaut, W. (2002). Application and comparison of two statistical trajectory techniques for identification of source regions of atmospheric aerosol species. Atmos. Environ. 36 (36–37), 5607–5618. ISSN 1352-2310. doi:10.1016/s1352-2310(02)00697-0
Masiol, M., Benetello, F., Harrison, R. M., Formenton, G., De Gaspari, F., and Spatial, B. P. (2015). Spatial, seasonal trends and transboundary transport of PM2.5 inorganic ions in the Veneto region (Northeastern Italy). Atmos. Environ. 117, 19–31. ISSN 1352-2310. doi:10.1016/j.atmosenv.2015.06.044
Masiol, M., Squizzato, S., Ceccato, D., Rampazzo, G., and Bruno, P. (2012). Determining the influence of different atmospheric circulation patterns on PM10 chemical composition in a source apportionment study. Atmos. Environ. 63, 117–124. ISSN 1352-2310. doi:10.1016/j.atmosenv.2012.09.025
McDuffie, E. E., Martin, R. V., Spadaro, J. V., Burnett, R., Smith, S. J., O’Rourke, P., et al. (2021). Source sector and fuel contributions to ambient PM2.5 and attributable mortality across multiple spatial scales. Nat. Commun. 12 (1), 3594. doi:10.1038/s41467-021-23853-y
Metrohm AG. 930 compact ic flex - manual (2017). Metrohm AG. 930 compact ic flex - manual. Available at: https://www.metrohm.com/it_it/products/2/9301/29301100.html (Accessed February 22, 2024).
Michele, C., Consonni, D., Pier, A. B., Biggeri, A., and Baccini, M. (2017). Temporal trends of PM10 and its impact on mortality in Lombardy, Italy. Environ. Pollut. 227, 280–286. doi:10.1016/j.envpol.2017.04.077
Ministero della Salute (2021). Banca dati Nazionale dell’Anagrafe zootecnica. Available at: https://www.vetinfo.it/j6_statistiche/#/.
Otto, P., Fusta Moro, A., Rodeschini, J., Shaboviq, Q., Ignaccolo, R., Golini, N., et al. (2024). Spatiotemporal modelling of PM2.5 concentrations in Lombardy (Italy): a comparative study. Environ. Ecol. Statistics 31, 245–272. ISSN 1573-3009. doi:10.1007/s10651-023-00589-0
Papadogeorgou, G., Kioumourtzoglou, M.-A., Braun, D., and Zanobetti, A. (2019). Low levels of air pollution and health: effect estimates, methodological challenges, and future directions. Curr. Environ. Health Rep. 6 (3), 105–115. doi:10.1007/s40572-019-00235-7
Park, M., Hung, S. J., Lee, K., Jang, M., Kim, S. D., Kim, I., et al. (2018). Differential toxicities of fine particulate matters from various sources. Sci. Rep. 8 (1), 17007. ISSN 2045-2322. doi:10.1038/s41598-018-35398-0
Pekney, N. J., Davidson, C. I., Zhou, L., and Hopke, P. K. (2006). Application of PSCF and CPF to PMF-Modeled Sources of PM2.5 in Pittsburgh. Aerosol Sci. Technol. 40 (10), 952–961. ISSN 1521-7388. doi:10.1080/02786820500543324
Perrone, M. G., Zhou, J., Malandrino, M., Sangiorgi, G., Rizzi, C., Ferrero, L., et al. (2016). PM chemical composition and oxidative potential of the soluble fraction of particles at two sites in the urban area of Milan, Northern Italy. Atmos. Environ. 128, 104–113. ISSN 1352-2310. doi:10.1016/j.atmosenv.2015.12.040
Pietrogrande, M. C., Demaria, G., Colombi, C., Cuccia, E., and Santo, U. D. (2022). Seasonal and Spatial Variations of PM10 and PM2.5 Oxidative Potential in Five Urban and Rural Sites across Lombardia Region, Italy. Int. J. Environ. Res. Public Health 19 (13), 7778. ISSN 1660-4601. doi:10.3390/ijerph19137778
Pirovano, G., Colombi, C., Balzarini, A., Riva, G. M., Gianelle, V., and Lonati, G. (2015). PM2.5 source apportionment in Lombardy (Italy): comparison of receptor and chemistry-transport modelling results. Atmos. Environ. 106, 56–70. doi:10.1016/j.atmosenv.2015.01.073
Pohl, V., Gilmer, A., Hellebust, S., McGovern, E., Cassidy, J., Byers, V., et al. (2022). Ammonia cycling and emerging secondary aerosols from arable agriculture: a European and Irish perspective. Air 1 (1), 37–54. doi:10.3390/air1010003
Pozzer, A., Tsimpidi, A. P., Karydis, V. A., de Meij, A., and Lelieveld, J. (2017). Impact of agricultural emission reductions on fine-particulate matter and public health. Atmos. Chem. Phys. 17 (20), 12813–12826. ISSN 1680-7324. doi:10.5194/acp-17-12813-2017
Pretolani, R., and Rama, D. (2022). “Il sistema agro-alimentare della Lombardia,” in Rapporto 2022. Milan, Italy: Franco Angeli.
Querol, X., Karanasiou, A., Amato, F., Vasconcelos, C., Alastuey, A., Viana, M., et al. (2016). AIRUSE - testing and development of air quality mitigation measures in Southern Europe. PM speciation and source apportionment. Available at: https://airuse.eu/.
Regione Lombardia (2018). Dusaf 6.0 - uso del suolo. Available at: https://www.dati.lombardia.it/Territorio/Dusaf-6-0-Uso-del-suolo-2018/7rae-fng6.
Regione Lombardia (2019). Uso e copertura del suolo 2018 (DUSAF 6.0). Available at: https://www.geoportale.regione.lombardia.it/en/.
Regione Lombardia (2021). Open data lombardia. Available at: https://dati.lombardia.it/.
Schaap, M., Müller, K., and ten Brink, H. M. (2002). Constructing the European aerosol nitrate concentration field from quality analysed data. Atmos. Environ. 36 (8), 1323–1335. doi:10.1016/s1352-2310(01)00556-8
Schlesinger, R. B., and Cassee, F. (2003). Atmospheric secondary inorganic particulate matter: the toxicological perspective as a basis for health effects risk assessment. Inhal. Toxicol. 15 (3), 197–235. doi:10.1080/08958370304503
Scotto, F., Bacco, D., Lasagni, S., Trentini, A., Poluzzi, V., and Vecchi, R. (2021). A multi-year source apportionment of PM2.5 at multiple sites in the southern Po Valley (Italy). Atmos. Pollut. Res. 12 (11), 101192. ISSN 1309-1042. doi:10.1016/j.apr.2021.101192
Seinfeld, J. H., and Pandis, S. N. (2016). Atmospheric chemistry and physics: from air pollution to climate Change. Hoboken, NJ: John Wiley and Sons Inc. Available at: https://www.ebook.de/de/product/25599491/john_h_seinfeld_spyros_n_pandis_atmospheric_chemistry_and_physics_from_air_pollution_to_climate_change.html.
Sogacheva, L., Hamed, A., Facchini, M. C., Kulmala, M., and Laaksonen, A. (2007). Relation of air mass history to nucleation events in Po Valley, Italy, using back trajectories analysis. Atmos. Chem. Phys. 7 (3), 839–853. ISSN 1680-7324. doi:10.5194/acp-7-839-2007
Squizzato, S., Masiol, M., Brunelli, A., Pistollato, S., Tarabotti, E., Rampazzo, G., et al. (2013). Factors determining the formation of secondary inorganic aerosol: a case study in the Po Valley (Italy). Atmos. Chem. Phys. 13 (4), 1927–1939. doi:10.5194/acp-13-1927-2013
Statistical Office of the European Union (2023). Animal populations by NUTS 2 regions. Available at: https://ec.europa.eu/eurostat/.
Stein, A. F., Draxler, R. R., Rolph, G. D., Stunder, B. J. B., Cohen, M. D., and Ngan, F. (2015). NOAA’s HYSPLIT atmospheric transport and dispersion modeling System. Bull. Am. Meteorological Soc. 96 (12), 2059–2077. ISSN 1520-0477. doi:10.1175/bams-d-14-00110.1
Stojić, A., and Stanišić Stojić, S. (2017). The innovative concept of three-dimensional hybrid receptor modeling. Atmos. Environ. 164, 216–223. ISSN 1352-2310. doi:10.1016/j.atmosenv.2017.06.009
Teledyne API (2019). The model T201 chemiluminescence NH analyzer. Available at: https://www.teledyne-api.com/(Accessed February 22, 2024).
Thakrar, S. K., Balasubramanian, S., Adams, P. J., Azevedo, I. M. L., Muller, N. Z., Pandis, S. N., et al. (2020). Reducing mortality from air pollution in the United States by targeting specific emission sources. Environ. Sci. Technol. Lett. 7 (9), 639–645. doi:10.1021/acs.estlett.0c00424
Thermo Fisher Scientific Inc (2021). Thermo scientific model 17i - ammonia chemiluminescent gas analyzer. Available at: https://www.thermofisher.com/(Accessed February 22, 2024).
Thunis, P., Clappier, A., Beekmann, M., Philippe Putaud, J., Cuvelier, C., Madrazo, J., et al. (2021). Non-linear response of
Tuomisto, J. T., Wilson, A., Evans, J. S., and Tainio, M. (2008). Uncertainty in mortality response to airborne fine particulate matter: combining European air pollution experts. Reliab. Eng. Syst. Saf. 93 (5), 732–744. doi:10.1016/j.ress.2007.03.002
UNI EN 12341:2023 (2023). Aria ambiente - Metodo gravimetrico di riferimento per la determinazione della concentrazione in massa di particolato sospeso PM10 o PM2,5. Technical report.
UNI EN 14211:2005 (2005). Qualità dell’aria ambiente - Metodo normalizzato per la misurazione della concentrazione di diossido di azoto e monossido di azoto mediante chemiluminescenza. Technical report.
UNI EN 14792:2017 (2017). Emissioni da sorgente fissa - Determinazione della concentrazione massica di ossidi di azoto - Metodo di riferimento normalizzato: chemiluminescenza. Technical report.
UNI EN 16913 (2017). Aria ambiente - Metodo di riferimento per la determinazione di NO, SO2, Cl−, NH, Na, K, Mg2, Ca2 contenuti nel PM2,5 depositati su filtri. Tech. Rep. 2017.
Uria-Tellaetxe, I., and Carslaw, D. C. (2014). Conditional bivariate probability function for source identification. Environ. Model. Softw. 59, 1–9. doi:10.1016/j.envsoft.2014.05.002
Van Damme, M., Clarisse, L., Whitburn, S., Hadji-Lazaro, J., Hurtmans, D., Clerbaux, C., et al. (2018). Industrial and agricultural ammonia point sources exposed. Nature 564 (7734), 99–103. doi:10.1038/s41586-018-0747-1
Van Damme, M., Wichink Kruit, R. J., Schaap, M., Clarisse, L., Clerbaux, C., Coheur, P.-F., et al. (2014). Evaluating 4 years of atmospheric ammonia (NH3) over Europe using IASI satellite observations and LOTOS-EUROS model results. J. Geophys. Res. Atmos. 119 (15), 9549–9566. doi:10.1002/2014jd021911
Veratti, G., Stortini, M., Amorati, R., Bressan, L., Giovannini, G., Bande, S., et al. (2023). Impact of NOx and NH3 emission reduction on particulate matter across Po valley: a LIFE-IP-PREPAIR study. Atmosphere 14 (5), 762. doi:10.3390/atmos14050762
World Health Organization Regional Office for Europe (2013). Review of evidence on health aspects of air pollution: REVIHAAP project: technical report. Copenhagen, Denmark: World Health Organization. Available at: https://apps.who.int/iris/handle/10665/341712.
Wyer, K. E., Kelleghan, D. B., Blanes-Vidal, V., Schauberger, G., and Curran, T. P. (2022). Ammonia emissions from agriculture and their contribution to fine particulate matter: a review of implications for human health. J. Environ. Manag. 323, 116285. doi:10.1016/j.jenvman.2022.116285
Wyzga, R. E., and Rohr, A. C. (2015). Long-term particulate matter exposure: attributing health effects to individual PM components. J. Air and Waste Manag. Assoc. 65 (5), 523–543. ISSN 2162-2906. doi:10.1080/10962247.2015.1020396
Zhao, W., Hopke, P. K., and Zhou, L. (2007). Spatial distribution of source locations for particulate nitrate and sulfate in the upper-midwestern United States. Atmos. Environ. 41 (9), 1831–1847. ISSN 1352-2310. doi:10.1016/j.atmosenv.2006.10.060
Keywords: coarse particulate matter (PM10), secondary inorganic aerosol (SIA), ammonium salts, agriculture, back-trajectories, human health, attributable deaths (AD), years of life lost (YLL)
Citation: Renna S, Lunghi J, Granella F, Malpede M and Di Simine D (2024) Impacts of agriculture on
Received: 12 January 2024; Accepted: 06 June 2024;
Published: 11 July 2024.
Edited by:
Mounia Tahri, National Centre for Nuclear Energy, Science and Technology, MoroccoReviewed by:
Mauro Masiol, Ca’ Foscari University of Venice, ItalyCopyright © 2024 Renna, Lunghi, Granella, Malpede and Di Simine. This is an open-access article distributed under the terms of the Creative Commons Attribution License (CC BY). The use, distribution or reproduction in other forums is permitted, provided the original author(s) and the copyright owner(s) are credited and that the original publication in this journal is cited, in accordance with accepted academic practice. No use, distribution or reproduction is permitted which does not comply with these terms.
*Correspondence: Stefania Renna, c3RlZmFuaWEucmVubmFAY21jYy5pdA==
Disclaimer: All claims expressed in this article are solely those of the authors and do not necessarily represent those of their affiliated organizations, or those of the publisher, the editors and the reviewers. Any product that may be evaluated in this article or claim that may be made by its manufacturer is not guaranteed or endorsed by the publisher.
Research integrity at Frontiers
Learn more about the work of our research integrity team to safeguard the quality of each article we publish.