 Yang Liu1
 Wei Lin
94% of researchers rate our articles as excellent or good
Learn more about the work of our research integrity team to safeguard the quality of each article we publish.
Find out more
ORIGINAL RESEARCH article
Front. Environ. Sci., 16 February 2024
Sec. Environmental Informatics and Remote Sensing
Volume 12 - 2024 | https://doi.org/10.3389/fenvs.2024.1369635
This article is part of the Research TopicTerritorial Spatial Evolution Process and Its Ecological Resilience, volume IIView all 10 articles
Ecological restoration holds great significance in addressing environmental degradation and rock desertification in karst areas. Zoning strategy is a fundamental task in understanding the interrelationship between human-environment to foster sustainable development. We explore “social-ecological” system and conduct a case study on the karst region in Guangdong Province, China. An evaluation framework consists of “development pressure”, “sensitivity status”, and “resilience potential” was established. The results show that: regions with high pressure of development are predominantly located in high-density urban areas. The generally distribution of the comprehensive status index exhibits significant spatial heterogeneity. Regions with low sensitivity are found on the eastern and western sides of the study area. The comprehensive resilience values are largely influenced by per capita energy-saving and environmental protection expenditures. The restoration zones mainly concentrated in the contiguous regions of the northwestern and southern parts, covering more than half of the total area. The conservation zones are more numerous and primarily situated in the northern and eastern parts. By integrating socio-economic and ecological factors, this study proposes ecological restoration strategies for specific zones. It helps for improve development issues arising from complex interactions between human-environment, facilitating the implementation of restoration practices.
Increasingly severe degradation and damage to ecosystems are among the current global hot topics (Van der Biest et al., 2020). With the acceleration of China’s industrialization and urbanization, high-intensity development and irrational human activities have led to continuous deterioration of the ecological environment, to some extent affecting the economy and the sustainable use of natural resources (Tang et al., 2022; Hu et al., 2023). To address the escalating environmental issues and gradually achieve the goal of sustainable development, it is crucial to correctly understand and manage the relationship between human activities and ecosystems (Li et al., 2023a). In recent years, the significance of ecological restoration for sustainable development has become increasingly prominent. Actively identifying priority areas for ecological protection and restoration through natural or human interventions to restore degraded ecosystems is a critical strategic task for ecological security and human wellbeing (Peng et al., 2020; Zhao et al., 2023). Scientifically delineating zones enhances the precision and targeting of ecological restoration, serving as an important prerequisite for spatial control of ecological restoration projects and differentiated spatial governance (Yue et al., 2022). Currently, ecological restoration primarily focuses on administrative units or natural watersheds, and zoning methods include research frameworks based on regional dominant functions (Tian et al., 2017; Cai et al., 2020), ecological security pattern construction (Ni et al., 2020; Jiang et al., 2022; Zhang et al., 2023), supply-demand of ecosystem services (Xie et al., 2020; Yue et al., 2022; Hu et al., 2023; Li et al., 2023c), comprehensive indicator systems. Regional context, landscape heterogeneity, human activities, socio-economic are interplay with ecosystem, which needs to be integrated during ecological restoration zoning, the comprehensive indicators not only offer an intuitive depiction of the ecological characteristics and interplay of human activities and economic growth but can also be aligned with the critical objectives of enhancing the level of ecosystem services. The multi-dimensional and multi-functional evaluation underscores the holistic and systematic nature of ecological restoration, demonstrating its effectiveness (Cao et al., 2019; Dan et al., 2020; Li et al., 2023b).
In previous studies, human activities and economic indicators were generally considered as stressors on regional ecological environments, reflecting the conflict within the “social-ecological” system (Wang and Zhong, 2019). However, there is a growing demand for promoting a harmonious coexistence of humans and nature and for reconciling the relationship between ecosystems and socio-economic development (Bai et al., 2019). In recent years, the focus has shifted towards the “social-ecological” system perspective in human-environment research (Vos et al., 2019). Qualitative and quantitative research, which includes aspects such as vulnerability and resilience, marks the beginning of “social-ecological” system research (Liu et al., 2023). While frameworks like DSPIR, PSR, and VSD provide evaluation methods for ecological vulnerability and ecosystem health, they have not offered partitioning schemes for mitigating ecosystem degradation and restoring ecosystem functions and services (Song et al., 2019; Liu et al., 2020). Therefore, to comprehensively address the systemic and holistic issues in both ecosystem protection and social system governance (Ahammad et al., 2023; Wang H. et al., 2023), integrating ecological conservation and restoration into socio-economic development can effectively promote the coordination of human-environment relationships and the sustainable development of the “social-ecological” system (Tedesco et al., 2023). Ecological restoration zoning needs to consider simultaneously the pressure of human activities on the ecosystem, the state of the ecosystem itself, and the resilience potential created by socio-economic development. Based on the results of ecological restoration zoning, appropriate governance approaches and relevant policy recommendations can be proposed.
Karst areas account for about a fifth of the global land area, of which the South China Karst (SCK), is an ecologically fragile area of the largest distribution (Xiong et al., 2023). The SCK is characterized by acute human-environment conflicts, resulting in issues such as frequent soil erosion, the degradation of vegetation cover, and increased poverty. The combined effects of a fragile natural environment and irrational human activities severely hampers socio-economic development, making it imperative to implement ecological protection and restoration (He et al., 2019). The primary task is to delineate comprehensive zoning. Previous land spatial zoning studies in karst areas have not comprehensively considered the spatial variations of desertification and human disturbances (Zhang et al., 2020). Some researchers have established ecological restoration zoning at the basin and grid scales, they have elucidated the inherent characteristics and relationships between various levels of zoning, but precise boundary delineation for implementation was not addressed (Wang and Zhao, 2022; Wang Y. et al., 2023). The key ecological protection and restoration areas from a “social-ecological” system perspective and policy implementation still need to be explored. Therefore, ecological restoration zoning in karst areas should not only consider factors like the degree of ecosystem degradation but should also integrate human activities and the resilience potential of social systems into the framework. Only then can it better contribute to regional sustainable development and improvement of human-environment relationships.
Guangdong’s karst region is mainly concentrated in the northern and northwestern parts of the province. It is situated in the upstream of the Pearl River Delta, serving as a critical ecological barrier and freshwater source for the Guangdong-Hong Kong-Macau Greater Bay Area. Compared to the existing research on karst regions in the SCK, the desertification control in Guangdong’s karst region is currently limited to statistical analysis and comprehensive zoning strategies are still unclear. There is an urgent need for zoning studies to guide the steady progress of ecological restoration efforts. This paper approaches the issue from the perspective of the “social-ecological system” and proposes the “development pressure-sensitivity state-resilience potential” framework. By constructing comprehensive evaluation indicators for quantitative assessment, the goal is to delineate ecological restoration zones that harmonize ecological conditions with the socio-economic systems. This is expected to provide a reference for differentiated management and restoration strategies of desertification issues in karst areas.
The selected study area focuses on the concentrated and contiguous regions with prominent desertification issues, which account for over 90% of the total desertification area in Guangdong province. This area includes the following counties and cities: Qingxin District, Yingde City, Yangshan County, Liannan Yao Autonomous County, and Lian-zhou City in Qingyuan City; Lechang City, Ruyuan Yao Autonomous County, Wujiang District, and Wengyuan County in Shaoguan City; and Lianping County in Heyuan City (Figure 1). The study area is located between 112°2′to 114° 56′east longitude and 23°32′to 25°34′north latitude, covering a total area of approximately 25,077.23 square kilometers. The topography of the study area is complex and includes various landforms. It falls within a subtropical monsoon climate zone with abundant rainfall, averaging between 1,200 and 2000 mm annually. According to data from various city statistical year-books, the study area had a permanent population of approximately 3,993,200 people in the year 2020. The population distribution is uneven, with sparsely populated areas in the mountainous regions and dense populations in hilly areas. The overall Gross Domestic Product (GDP) of the region is relatively low, with Wujiang District and Qingxin District ranking first and second, respectively.

FIGURE 1. Location of the karst region of Guangdong province, China.
The research data mainly include the following: 1. Land use remote sensing monitoring data with a spatial resolution of 1 km for the years 2013 and 2020.2. Normalized Difference Vegetation Index (NDVI) data with a spatial resolution of 1 km for the year 2020.3. Digital Elevation Model (DEM) data with a spatial resolution of 1 km. All three types of data are sourced from the Chinese Academy of Sciences Resource and Environmental Science Data Center. 4. Normalized Difference Rock Index (NDRI) data, calculated using the PIE Engine Studio remote sensing computing cloud service platform, with a spatial resolution of 1 km for the year 2020.5. Meteorological data, obtained from the National Earth System Science Data Center, with a spatial resolution of 1 km, providing monthly rainfall data for the year 2020.6. Soil erodibility data for Guangdong Province, sourced from the High-Performance Computing Platform for Geographic Data and Application Analysis at the Faculty of Geographic Science, Beijing Normal University. The data has been resampled to a spatial resolution of 1 km for the year 2021.7. Socio-economic and population data collected from the official websites of Qingyuan, Shaoguan, and Heyuan governments, statistical yearbooks, and the “Compilation of National Agricultural Product Cost and Income Data.” The data is for the year 2020.
All raster data types have been reprojected to a common coordinate system, specifically the National Geodetic Coordinate System, and have been extracted based on the study area’s boundaries.
The issue of karst desertification in karst regions arises from the intricate interplay between social and natural factors. It is consequence of the detrimental effects of human activities on the ecosystems, with unreasonable human interventions being the predominant contributing factor. This expansion of urban development and the rapid population growth, exerting substantial pressure on the local ecosystems.
The level of sensitivity reflects the degree to which karst regions react to the disruptions caused by socio-economic development and human activities. It signifies how easily and likely karst desertification might occur in response to disturbances. This level can be described using a set of indicators or characteristics, including vegetation cover, soil erosion, and exposed bedrock, which highlight the critical features of karst desertification.
Resilience potential describes the ability of karst regions to self-regulate their ecosystems in response to disturbances and pressures. It also encompasses the capacity of socio-economic factors to facilitate the restoration of ecosystems to their original structure and functional levels. Typically, the government capital investment and human-initiated restoration activities are employed to measure resilience potential. The crucial principle in ecological restoration practices is “giving priority to natural restoration”, nature-based solutions can be assessed using ecosystem service values (Fan et al., 2022; Gong et al., 2020).
To scientifically delineate ecological restoration zones for karst desertification, it is crucial to select representative and systematic indicators. In this study, based on the interaction between socio-economic factors and ecosystems, we have established an evaluation framework of “development pressure-sensitivity status-resilience potential” and selected appropriate indicators to create an evaluation system (Table 1).
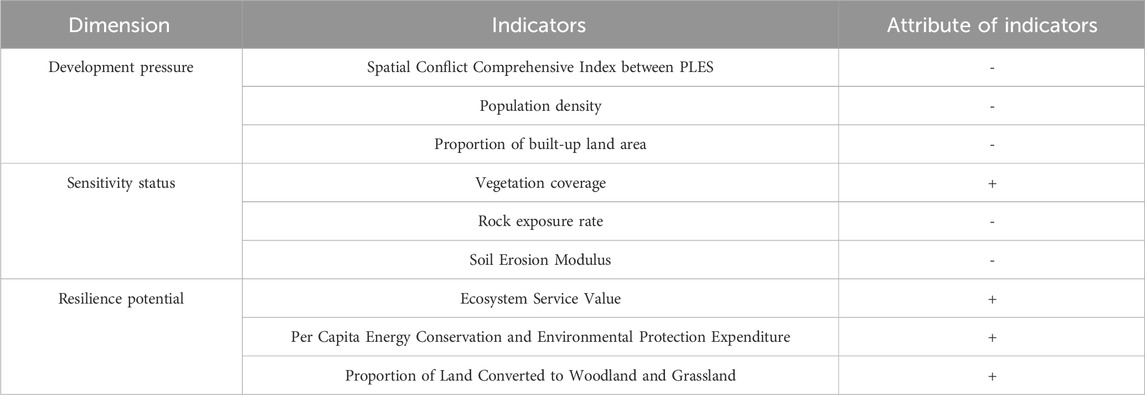
TABLE 1. Evaluation indicators.
We selected indicators such as the proportion of built-up land area and population density for characterization. Specifically, a higher proportion of built-up land indicates a greater likelihood of encroachment on arable land and woodland. Population density serves as a reflection of the pressure on the ecosystem, where higher population density implies greater stress on the ecosystem. With the promotion of rapid economic and social development, land use has undergone profound processes of transition, leaving the production–living–ecological spaces (PLES) and landscape pattern reconfigured, thus further affecting regional eco-environmental quality and landscape ecological risk (Chen et al., 2022). Therefore, we also incorporated the Spatial Conflict Comprehensive Index between PLES to reflect the irrational land use in karst areas.
Based on the multifunctionality of land, and considering the dominant and secondary functions in space, land use is divided into following categories (Liao et al., 2017; Zhao et al., 2019).
- Living-Production Space (urban land, rural residential areas, and other construction land)
- Production-Ecological Space (paddy fields and dryland)
- Ecological -Production Space (woodland and reservoirs/ponds)
- Ecological Space (grassland, rivers, lakes, tidal flats, wastelands, and bare land)
The conflict in land use spatially can be represented as a comprehensive analysis of system complexity, vulnerability, and stability. This conflict index aims to capture the spatial dynamics and potential tensions resulting from land use activities in karst regions.
In the Eq. 1, SCCI, representing the Spatial Conflict Comprehensive Index between PLES, is accompanied by CI (Spatial Complexity Index), FI (Spatial Fragility Index), and SI (Spatial Stability Index). The detailed methods for computing each of these indices can be found in the cited reference (Liao et al., 2017).
Taking into consideration factors like the study area’s extent, zoning units, and spatial resolution, these indices were computed using a 10 km × 10 km window size, resulting in the Spatial Conflict Comprehensive Index (SCCI) with values falling within the [0,1] range. Drawing inspiration from the curve distribution model of Spatial Conflict Index, the index values are classified into the following categories (Feng, 2021): Stable and Controllable [0, 0.4), Essentially Controllable [0.4, 0.6), Essentially Uncontrollable [0.6, 0.8), and Significantly Conflictive [0.8, 1].
Population density (people/km2) is computed based on 2020 population data for each county. The proportion of construction land area is determined as the ratio of the combined area occupied by urban, industrial, mining, and residential land to the total administrative area of each county, utilizing land use remote sensing monitoring data from the year 2020.
The comprehensive pressure index is derived to delineate the spatial distribution characteristics and data variations among the three indicators. Given the substantial numerical differences in population density and the proportion of construction land area among individual counties, we employ a natural logarithm method from statistics to mitigate the sharp fluctuations between assessment units (Dan et al., 2020). All three indicators in the pressure layer share the same directionality, which means that a larger value of the comprehensive pressure index signifies heightened development pressure on the county. The specific formula for calculation is as follows:
In the Eq. 2, Pi denotes the comprehensive pressure index for the ith county evaluation unit, while SCCIi corresponds to the Spatial Conflict Comprehensive Index between PLES. POPi represents the population density, and CLPi signifies the proportion of construction land area.
Sensitivity status provides insights into the responsiveness of ecosystem to human-induced pressures. Among the key characterization factors, vegetation coverage and rock exposure rate are pivotal for accurately assessing the distribution of karst desertification (Wang et al., 2019). Higher vegetation coverage suggests a lower likelihood of karst desertification in the region. Conversely, a higher rate of rock exposure signifies a more severe karst desertification issue. Notably, karst desertification is often accompanied by secondary disasters like soil erosion, which further exacerbate its severity. Soil erosion modulus, a commonly used indicator for assessing soil erosion risk, is inversely related to sensitivity status, meaning lower soil erosion intensity corresponds to lower sensitivity.
Based on pixel-based binary models, the normalized difference vegetation index (NDVI) is selected to extract vegetation cover. Specific calculation methods can be found in the referenced literature (Wu et al., 2020). The average vegetation cover for each county is calculated using zoning statistics tools.
The rock exposure rate (D) is extracted by combining the calculation of the normalized rock index (NDRI) with pixel-based binary models. Specific calculation formulas can be found in the referenced literature (Sun et al., 2022). The average rock exposure rate for each county is calculated using the PIE Engine Studio remote sensing computing cloud service platform and zoning statistics tools.
The Revised universal Soil Loss Equation (RUSLE) model is used to assess soil erosion. The model expression is as follows:
In the Eq. 3.
- A represents the soil erosion modulus, measured in “t/(hm2·a)".
- R is the rainfall erosion factor, measured in " [(MJmm)/(hm2·a)]".
- K is the soil erodibility factor, measured in " [(thm2·h)/(MJhm2·mm)]".
- L and S are terrain factors, with L being the slope length factor and S being the slope steepness factor.
- C is the land cover management factor.
- P is the soil conservation measure factor.
All factors (L, S, C, P) are dimensionless. The rainfall erosion factor R is calculated based on monthly rainfall data following the guidelines in “SL 773–2018 - Guidelines for Estimating Soil Loss from Production and Construction Projects.” The soil erodibility factor K is obtained directly from the 2018 Chinese soil erodibility factor dataset, specifically the data for Guangdong Province, and is extracted based on the study area.
The slope length factor (LS) is calculated using the slope length model as proposed by (Liu et al., 2010). The land cover management and soil conservation factors (C, P) are assigned values based on regional similarity and reference from existing research (Zhong et al., 2022).
The study employs the Albers projection as the spatial reference, and the spatial resolution is set at 1 km × 1 km. The calculations for individual factors and erosion modulus are performed using raster calculators.
The comprehensive state index is calculated by combining vegetation cover, rock exposure rate, and soil erosion. A natural logarithm method is used to mitigate local fluctuations in the soil erosion index. To account for the differing trends of vegetation cover, rock exposure, and soil erosion on ecosystem status, a negative standardization is applied during calculation. A higher value of the comprehensive state index indicates a higher level of sensitivity. The specific calculation formula is as follows:
In the Eq. 4, Si denotes the comprehensive state index for the ith county evaluation unit, Fi corresponds to the negatively processed vegetation cover data, Di represents the rock exposure rate, and Ai indicates the soil erosion modulus.
While socio-economic development exerts pressure on ecosystem, it also presents opportunities for ecological restoration. A primary goal of ecological restoration is to preserve and enhance regional ecosystem services (Kong et al., 2019). Ecosystem services value can visually demonstrate the contribution of ecosystems to supporting socio-economic development (He et al., 2019; Bai et al., 2019), reflecting the self-restoration capacity within the “socio-ecological” system and providing a foundation for ecological restoration zoning. Regional economic development, coupled with increased environmental protection efforts, gradually introduces resilience potential for ecosystem recovery and management strategies (Ye et al., 2019). Per capita energy-saving and environmental protection expenditure reflects the government’s financial commitment to ecological restoration, and the conversion of cropland to forests and grassland is a widely acknowledged ecological engineering measure in the context of desertification control, with the proportion of the area used as an indicator of existing ecological restoration achievements.
We utilized the Chinese ecosystem service value equivalent table to estimate the ecosystem service values of the primary ecosystem types in the study area. Compared to woodland, arable land and wetland, etc., the ESV of construction land is almost negligible. Therefore, according to the previous studies (Xie et al., 2015; Zhu et al., 2020; Feng et al., 2022), urban, industrial, mining, and residential land were omitted from the computation. The unit standard equivalent was based on major food crops and adjusted to align with the economic development status of the study area. Specific parameters can be found in Table 2.
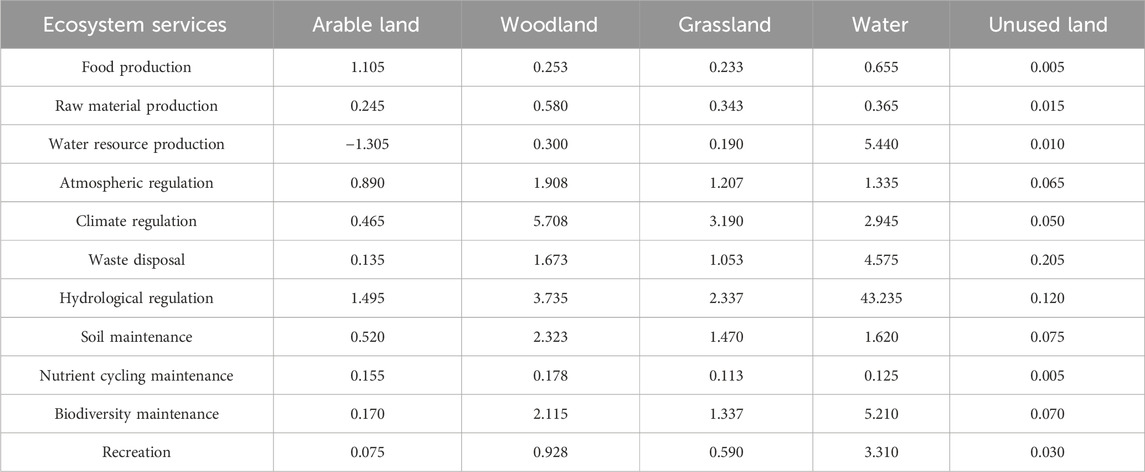
TABLE 2. Ecosystem Services value of per unit area (CNY).
We retrieved data on energy conservation and environmental protection expenditures from the statistical yearbooks of each county in the study area. To calculate per capita energy conservation and environmental protection expenditure (in thousands of RMB per square kilometer), we divided the total expenditure by the administrative area of each county.
This metric assesses the extent of land transformation from arable land in 2013 to woodland and grassland areas in 2020.
The comprehensive potential index is derived from the data of the three aforementioned indicators. A higher value of this index indicates a greater level of socio-economic investment in ecological restoration and a higher resilience potential. The specific formula is as follows:
In this Eq. 5, Ri signifies the comprehensive potential index of the ith county-level evaluation unit, ESVi represents the corresponding ecosystem service value, Zi denotes the per-square-kilometer energy-saving and environmental protection expenditure, and Ti reflects the proportion of converted cropland to woodland and grassland.
Considering that the delineation of ecological restoration zones should cater to regional coordinated development and specific governance needs, it is prudent to establish these zones at the county level to ensure a high degree of territorial integrity. To strike a balance between the influence of development pressure, sensitivity status, and resilience potential on the restoration zones, making restoration strategies more precise and well-founded, we employ z-score standardization based on three key indicators: comprehensive pressure, sensitivity status, and resilience potential. By comparing the relative magnitudes of these indicators, we categorize the ecological restoration zones into different types. Z-score standardization facilitates the comparison of multiple datasets on a consistent scale. The specific formula for calculation is as follows:
In the Eq. 6, yi represents the z-score standardized value of the ith indicator for a county, xi is the original value, "μ" denotes the mean of all county-level indicator data for the ith indicator, and "σ" is the standard deviation of all county-level indicator data for the ith indicator.
The comprehensive sensitivity, being more representative of each county’s ecosystem status, serves as the primary determinant for zone classification. Because of a negative standardization is applied during sensitivity calculation, the standardized comprehensive status index higher than 0 means relatively poorer ecological status and high sensitivity, classifying them as restoration zones. Conversely, those with values smaller than 0 are categorized as conservation zones. Further distinction in the urgency of restoration or conservation is made by considering the development pressure and resilience potential indicators. Those with standardized result of comprehensive resilience potential higher than 0 means more resilient, which are designated as autonomous zones, signifying a greater level of socio-economic investment for restoration or conservation. In contrast, areas where with resilience potential values smaller than 0 and development pressure values higher than 0 means less resilient and ongoing expansion of human activities and more socioeconomic pressure on ecosystem, which are identified as priority zones. Both the standardized comprehensive pressure and resilience potential results are small than 0 means the lower level of socioeconomic growth and ecological restoration investment, which is classified as coordination zones (Table 3).

TABLE 3. Criteria for karst desertification ecological restoration zones.
There are significant spatial variations in both population density and urban development extent in the study area. Regions characterized by low population density, with approximately 100 people per square kilometer, are primarily found in minority autonomous counties. In contrast, areas with high population density and substantial urban development are predominantly situated in Wujiang District and Qingxin District, corresponding to the urban centers of Shaoguan and Qingyuan. In Wujiang District, the population density reaches 554.83 people per square kilometer, with a construction land pro-portion of 6.86%, significantly higher than in most other counties, which remains largely below 3%. This highlights the intense nature of urban development in these areas. The Spatial Conflict Comprehensive Index, applied across all counties, consistently falls within the range from “stable and controllable” to “basically controllable.” Yingde City, Lechang City, Wujiang District, and Wengyuan County exhibit relatively higher values. This is primarily due to the dense and fragmented distribution of production and living spaces within these regions, signifying a heightened degree of land development and utilization. In contrast, counties characterized by lower conflict levels are primarily concentrated within minority autonomous regions, where ecological spaces exhibit a broader and more dispersed pattern. The comprehensive evaluation of development pressure (Table 4) across the study area is notably influenced by population density. Regions facing increased pressure from human activities are mainly concentrated within urban areas, showing a discernible southeast-to-northwest gradient. Wujiang District, situated within the high-value zone, serves as a prominent example. Meanwhile, medium-value areas encompass Qingxin District, Yingde City, and Wengyuan County, primarily distributed in the eastern sector. Conversely, substantial low-value areas are identified in the western part of the study area, including counties such as Lianzhou, Liannan Yao Autonomous County, Yangshan County, Ruyuan Yao Autonomous County, and Lechang City (Figure 2).
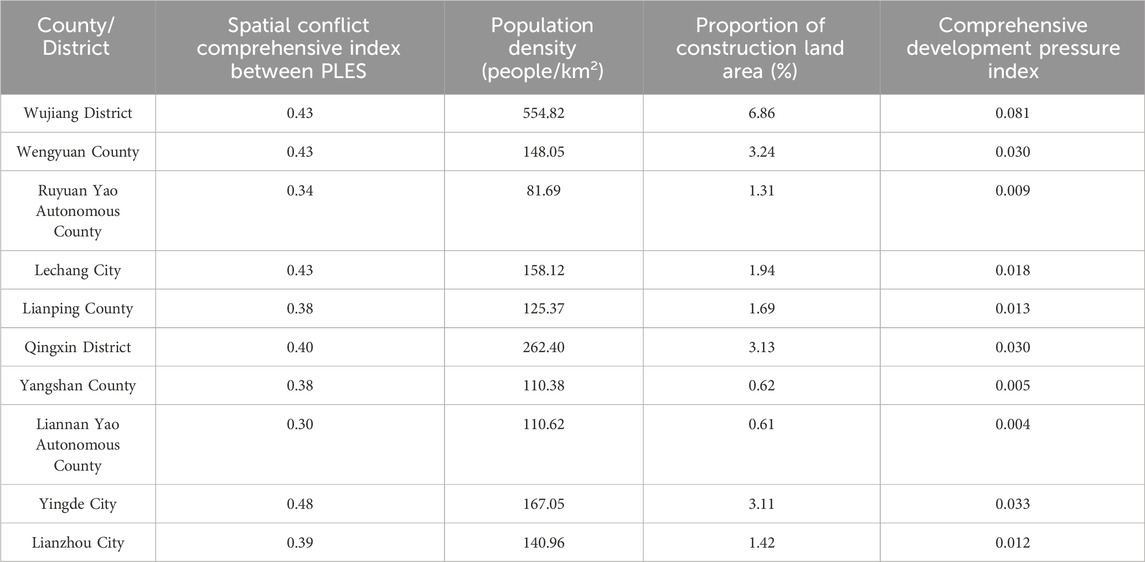
TABLE 4. Development pressure index evaluation.
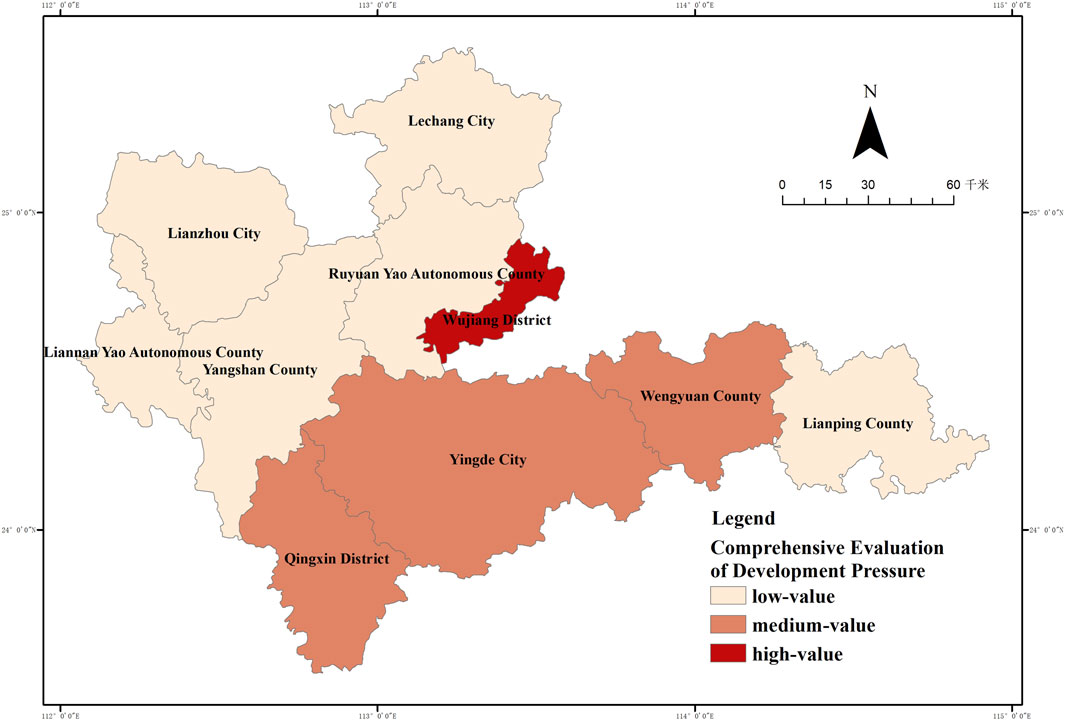
FIGURE 2. Comprehensive evaluation of development pressure.
Significant variations are observed among the sensitivity status indicators within the study area. Notably, the implementation of the national land greening project has had a substantial impact on vegetation cover. Lianping County and Liannan Yao Autonomous County stand out with vegetation cover exceeding 85%. Conversely, Wujiang District, Qingxin District, and Yingde City exhibit relatively lower vegetation cover, all falling below the 80% mark. The distribution of exposed bedrock rates follows a contrasting pattern, with higher values predominantly found in Wujiang District and Yingde City, both ex-ceeding 43%. In contrast, Yangshan County, Lianping County, and Liannan Yao Autonomous County show relatively lower rates of exposed bedrock. Soil erosion levels are notably high in Yangshan County and Yingde City, attributed to the typical impact of karst desertification. On the other hand, areas with lower erosion levels primarily include Liannan Yao Autonomous County and Wujiang District. This is influenced by effective vegetation cover management and soil conservation practices. The comprehensive state index (Table 5) reflects significant spatial disparities throughout the study area, with higher values concentrated in the central region and lower values along the eastern and western sides. Counties with lower index values are less numerous and encompass Lianping County and Liannan Yao Autonomous County. Conversely, Qingxin District and Yingde City stand out with higher index values, with Qingxin District having the least vegetation cover compared to other counties. Yingde City exhibits the highest levels of exposed bedrock and soil erosion in the study area, resulting in the highest overall sensitivity (Figure 3).
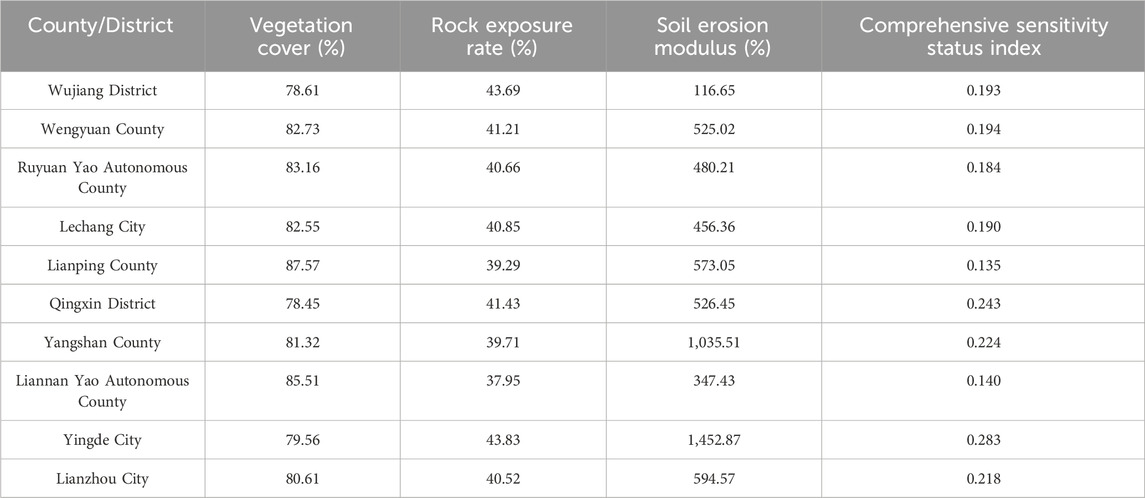
TABLE 5. Sensitivity status index evaluation.
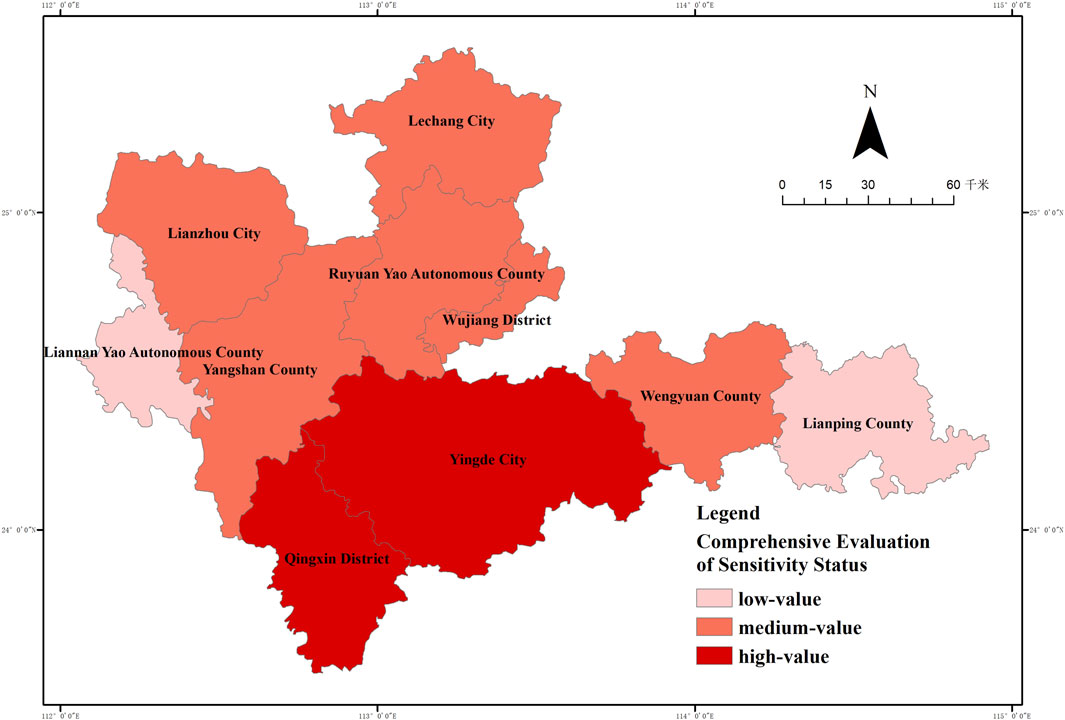
FIGURE 3. Comprehensive evaluation of sensitivity status.
Owing to substantial variations in county sizes, the distribution pattern of ESV across the study area exhibits a higher value in the central regions and lower values along the periphery. The highest ESV is observed in Yingde City, which is also the largest area county-level administrative in Guangdong Province. Counties with relatively lower ESV include Wujiang District and Liannan Yao Autonomous County. As a whole, the study area demonstrates relatively lower per-unit area expenditures in energy conservation and environmental protection. The majority of counties have per-unit expenditures below 4,000 yuan per square kilometer. The highest expenditures are found in Lechang City and Wengyuan County, while the lowest can be seen in Lianzhou City at just 0.82 yuan per square kilometer. From 2013 to 2020, the study area achieved a total afforestation area of 1,663 square kilometers. Areas with a relatively high afforestation rate include Lechang City, Lianzhou City, and Yingde City, while counties with smaller afforestation areas con-sist of Liannan Yao Autonomous County, Ruyuan Yao Autonomous County, and Lianping County. The overall comprehensive resilience potential (Table 6) in the study area is significantly influenced by per-unit area expenditures in energy conservation and environmental protection. There are notable disparities in the overall levels: Lechang City and Wengyuan County fall into the high-value category, with per-unit expenditures in energy conservation and environmental protection significantly surpassing those in Lianzhou City and Yangshan County, which belong to the low-value category. The remaining counties are generally classified as mid-value (Figure 4).
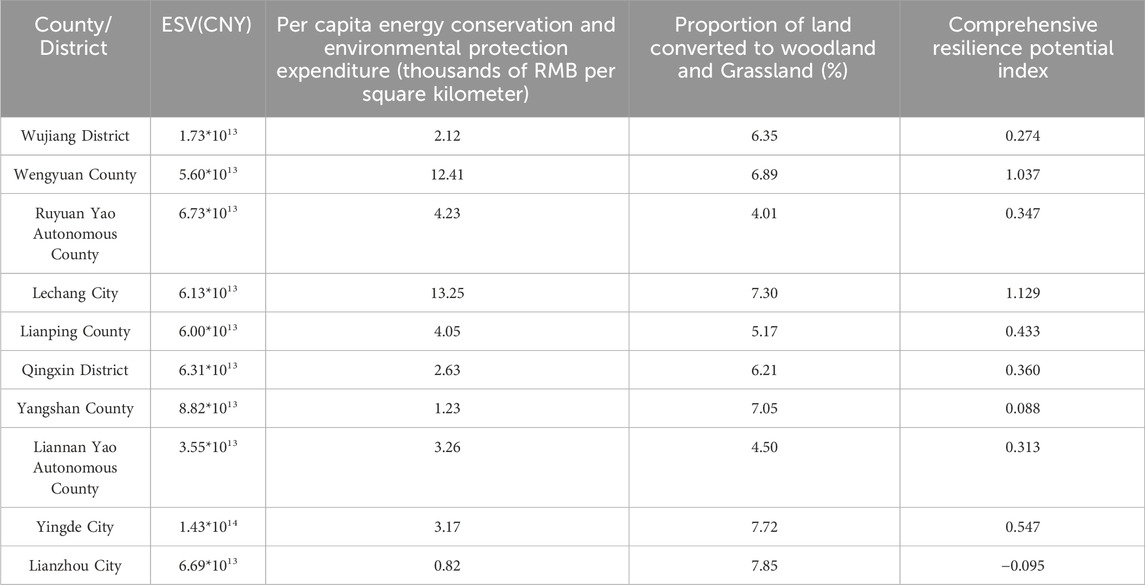
TABLE 6. Resilience potential index evaluation.
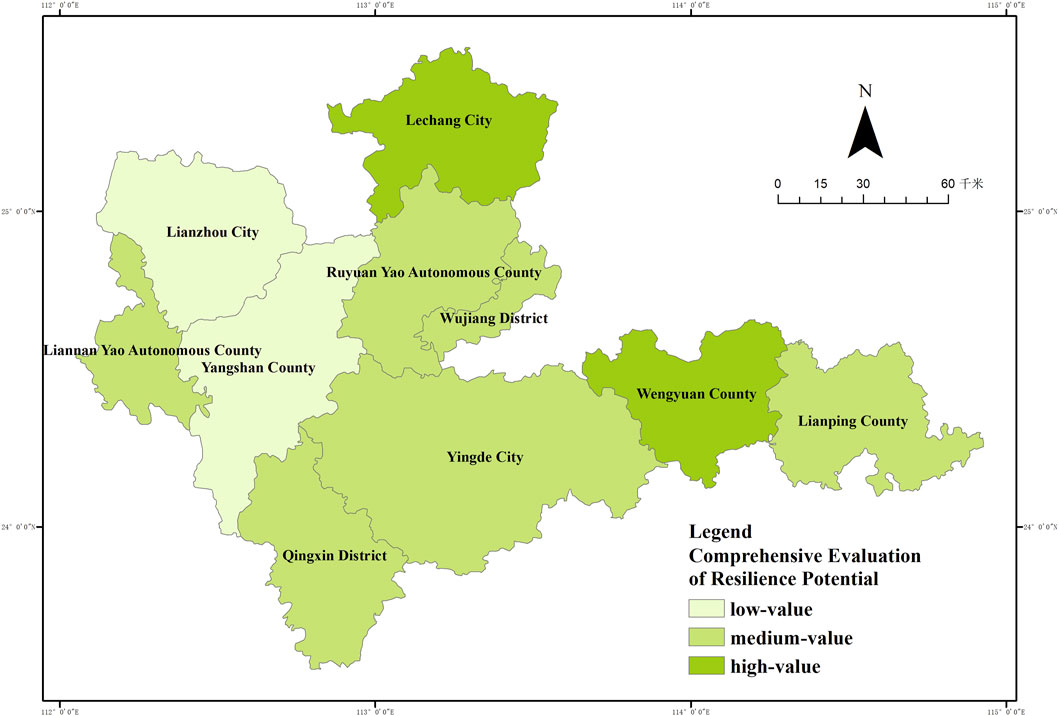
FIGURE 4. Comprehensive evaluation of resilience potential.
Based on the z-score standardized results, the study area is classified into Restoration Zones and Conservation Zones (Figure 5). Notably, the Restoration Zones cover more than half of the total area and are primarily situated in the northwestern and southern parts of the study area, with these regions bordering each other. The Conservation Zones consist of six counties in total, primarily located in the northern, western, and eastern parts of the study area. All three zone—Autonomous Restoration, Coordinated Restoration, and Coordinated Conservation—encompass more than 20% of the total area (Table 7).
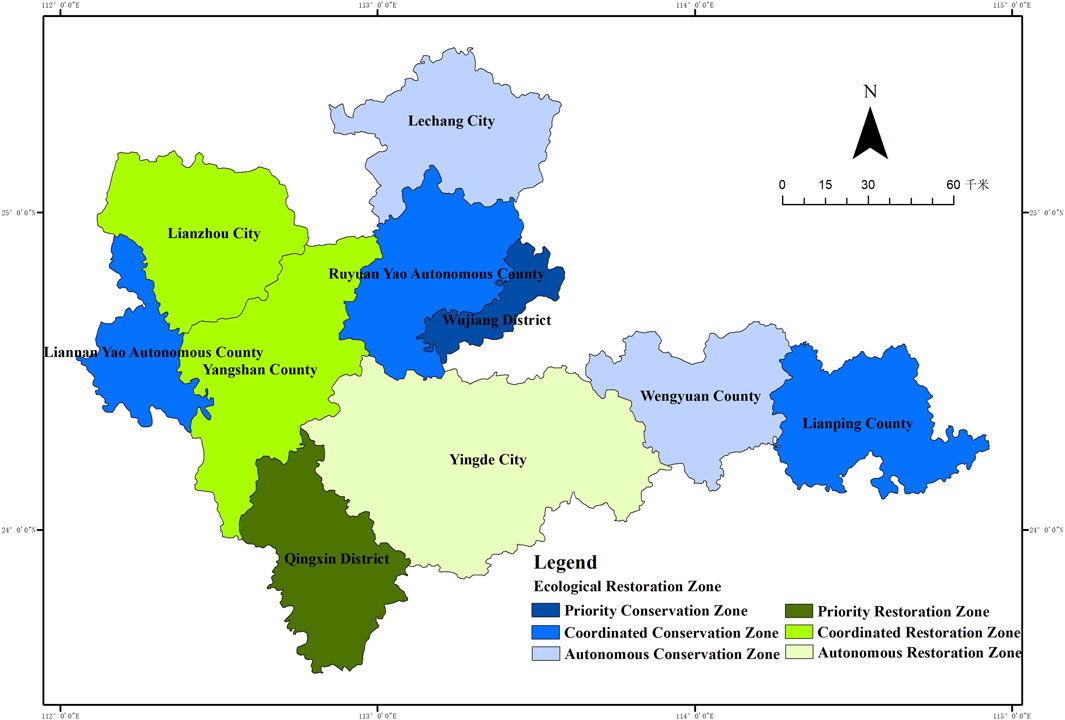
FIGURE 5. Ecological restoration zone.
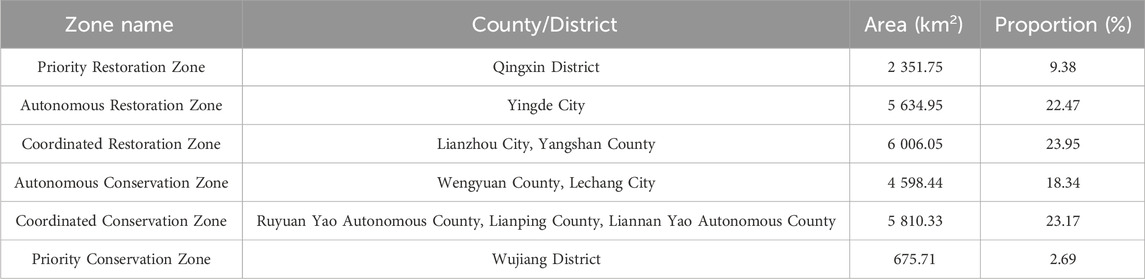
TABLE 7. Karst desertification ecological restoration zone results.
Qingxin District, situated within Qingyuan City, is under substantial development pressure due to human activities. Pressure is influenced by low vegetation cover, high rock exposure rates, and soil erosion, resulting in a less favorable ecological system status. Furthermore, per capita energy expenditure and reforestation areas show limited resilience potential. To reverse the adverse ecological conditions, this region should increase in-vestments in ecological restoration, implement ecological protection and restoration policies, and prioritize actions aimed at preventing ecosystem degradation from inappropriate human activities. The goal is to transform the excessive pressure exerted on the ecosystem by human development into resilience potential. Continuously advance the greening of territorial space, develop distinctive forestry products, and focus on the development model of undergrowth economy, including “medicine, fungi, tea, livestock, and forest tourism."
Corresponding to Yingde City, this area experiences low pressure and exhibits high resilience potential. The primary focus here is on alleviating conflicts within the PLES, strengthening the advantages of ecosystem service values, and enhancing the self-restorative capacity of the ecosystem. Due to the relatively high rock exposure rates and severe soil erosion, additional efforts should be made to enhance water source conservation forests, ecological public welfare forest construction. With the engineering measures and reforestation, promote comprehensive mining reclamation. This will help prevent soil erosion caused by inappropriate human activities. Additionally, implementing ecological compensation policies and creating a “those who undertake the restoration stand to gain the benefits " market mechanism can encourage the involvement of social capital in the entire ecological restoration process.
This zone includes Lianzhou City and Yangshan County, characterized by low human activity pressure and limited resilience potential. The main focus is to increase environmental governance investments, thereby facilitating effective ecological restoration. Due to the low investment in energy conservation and environmental protection funds, it is crucial to make effective use of financial support from higher-level governments and rein-force lateral collaborative governance in the region. In order to the effective restoration of damaged ecosystems, this zone can also collaborate with the Guangdong Nanling National Park construction, integrating ecological elements such as mountains, water, and forests in the restoration of natural resources, by preventing and managing soil erosion, it aims to maintain the ecological barrier integrity of the surrounding mountains. This is achieved through a combination of afforestation, greening initiatives, and forest regeneration, thereby promoting the continuous advancement of desertification control efforts.
This category comprises Lechang City and Wengyuan County, regions with a well-established ecological foundation, a high development pressure, and strong resilience potential. The primary objective is to consolidate the existing ecological foundation, implement water source conservation forests, and precisely enhance forest quality. Innovative measures for desertification control should be introduced, with continued investment in energy conservation and environmental protection, ensuring the protection of the eco-system’s services. Simultaneously, single human intervention measures should be avoid-ed, with further regulation of human development activities and the optimization layout of the PLES, resulting in an improved pattern of production and living. Implementing ecological restoration measures on historically abandoned industrial sites to enhance the ecological quality of the land, while also creating opportunities for local green economic growth.
This zone encompasses Ruyuan Yao Autonomous County, Lianping County, and Liannan Yao Autonomous County, with low development pressure and resilience potential. This area has high vegetation cover and should implement afforestation and greening initiatives. By promoting regional economic development while enhancing ecological protection efforts, it aims to advance the construction of the Wanshanchaowang National Desert Park and the Xijing Ancient Road National Desert Park. Leveraging its excellent ecological foundation, the zone should develop leisure tourism industries and actively promote the development of high-value specialty industries. This approach explores the efficient transformation path for the value realization of ecological product, promoting ecological restoration through ecological industrialization.
The corresponding administrative region is Wujiang District, which is the most densely populated built-up area in the study. It experiences significant development pressure and possesses limited resilience potential. The primary objective is to prevent excessive damage to the ecological foundation, balancing ecological and economic benefits. This area should engage in strategic urban planning within the limits of its resource and environmental carrying capacity, thereby avoiding new issues related to desertification and human-induced soil erosion. Additionally, it should increase investments in environmental protection to improve small watershed soil and water erosion control efforts. Gradually expanding forest coverage and enhancing forest quality, and creating a new pattern for ecological construction.
The study area, situated in a karst region characterized by prominent human-environment conflicts and ecological sensitivity, underscores the intricate interplay between social-ecological system. Unreasonable human activities have led to the degradation of ecosystem functions, impeding local socio-economic development (Ye et al., 2019). If this feedback loop remains unchecked, it may cause the “social-ecological” system to deteriorate further (Wang Z. et al., 2023), leading to a vicious cycle of “vegetation destruction” and “land reclamation equals poverty.” Therefore, there is an urgent need for governance strategies based on a “social-ecological” system analysis framework. Desertification is “negative” feedback resulting from human interference with the ecosystem, leading to the unsustainability of the “social-ecological” system. Therefore, the ultimate goal of ecological restoration zoning is to start from sustainability, coupling multiple objectives within the “social-ecological” system, integrating social, economic, and ecological elements (Polyakov et al., 2023) and processes to formulate ecological restoration zoning decision-making and implementation strategies.
In the context of promote harmonious coexistence between human and environment, ecological restoration should primarily prioritize maintaining regional ecological security, promoting continuous improvement in ecosystem diversity and stability, and achieving synergy between conservation and development. By delineating the interactive processes of the “social-ecological” system, conducting a comprehensive analysis of existing ecological issues, and assessing the relationship between socio-economic system and ecosystem, this study proposes restoration strategies and recommendation measures for each zone. Based on the zoning results, the contiguous regions of the northwestern and southern parts of the study area require more comprehensive engineering and greening measures, the benefits from rocky desertification treatment and reforestation/afforestation will promote the synergistic effect of “social-ecological” system. The conservation zones are primarily situated in the northern and eastern parts of the study area, ecological and economic benefits can be brought from giving priority to natural restoration, ecological industry and reasonable PLES layout also contribute to the “social-ecological” system.
Domestic and international trends in ecological restoration zoning research and practical cases reveals an evolving focus (Smith et al., 2022; Zhou et al., 2022; Reader et al., 2023). Ecological restoration in Karst region entails a comprehensive approach, acknowledging the intricate inter-connections and interdependencies among forest, mountain, and water elements. This holistic perspective reflects the core concept of “integral protection, systematic restoration, and comprehensive management” (Suding et al., 2015). Furthermore, it is crucial to recognize that government bodies, corporate investors, and the stakeholder are central participants in the ecological restoration process (Toma and Buisson, 2022). Their varying perspectives and requirements will directly impact the effectiveness of restoration planning and project implementation. The application of multi-agent modeling to support decision analysis encourages the collective involvement of multiple stakeholders. This approach acknowledges that the success of ecological restoration in karst regions necessitates the active collaboration of various stakeholders and underscores the importance of harmonizing their differing interests and needs for the collective benefit of the human and environment.
In the context of a transition towards more harmonious human-environment relationships within the realm of ecological restoration, this study takes a “social-ecological” system approach. It constructs an evaluation index that comprises “development pressure,” “sensitivity status,” and “resilience potential.” The study performs quantitative assessments and integrated zoning, using the karst-concentrated areas of Guangdong Province as an illustrative example. This research addresses previous inadequacies by providing a more comprehensive perspective. It considers ecological issues and human disturbances while integrating the restorative capacity created by the ecosystem’s resilience potential and socio-economic development. The integrated index allows for the portrayal of societal pressures on ecological systems, the sensitive characteristics of the ecosystem, and the “social-ecological” system’s resilience potential. This enhances our overall understanding of how to resolve human-environment conflicts in ecologically vulnerable areas. This study departs from the practice of assigning weights to indicator factors, which can be subjective. Instead, it employs a standardization method to compare the results of different indicator combinations. This approach is more objective and uses a concise set of critical indicators to reflect regional disparities, making it more operationally feasible. The ultimate goal of the zoning method is to facilitate the implementation of zoning results and ecological restoration. The research framework of this study is clear, easily quantifiable, and holds promise for practical applications.
Compared to studies based on grid or watershed units, this research primarily focuses on reflecting the “social-ecological” system characteristics of various administrative units within a region. This approach provides differentiated governance measures for regional coordinated development. Subsequent steps may involve further refining data granularity and analyzing the spatial heterogeneity characteristics within the units to identify key ecological restoration areas and provide precise strategies (Sun et al., 2022). It is important to note that the sample selection for evaluation units in this study did not include several counties with dispersed distribution of desertification. Future research could encompass a comprehensive analysis of desertification restoration in Guangdong Province and even the karst regions of southern China. Due to data availability and computational constraints, this study did not account for the temporal changes in the “social-ecological” system characteristics. Therefore, it is crucial to explore the relationship between “social-ecological” systems in ecologically fragile karst areas, considering their multi-scale and cross-temporal dimensions in the future.
Ecological restoration zoning involves various socio-economic and ecological factors, making it challenging to accurately identify the ecological restoration zones and propose targeted strategies. In the context of shifting towards coordinated human-environment relationships, this study constructs a comprehensive evaluation framework based on the perspective of “socio-ecological” system. This approach represents a preliminary exploration of the complex interplay between socio-economic and ecological factors, offering a more integrated understanding of the multi-target and multi-stakeholder trends in ecological restoration. Moreover, it provides valuable insights for guiding the treatment of karst desertification and ecological restoration.
The spatial distribution of these indicators shows significant characteristics. Development pressure is strongly influenced by population density, with areas experiencing higher human activity pressure primarily concentrated in urban areas, with the most prominent in Wujiang District. Sensitivity status is predominantly determined by soil erosion levels and vegetation coverage. Qinxin District County and Yingde City exhibit the most severe environmental issues. The overall level of resilience potential varies significantly and is mainly influenced by per capita energy conservation and environmental protection expenditures.
Based on the characteristics of development pressure, sensitivity status, and resilience potential, the study area is recognized to two main categories of restoration units, corresponding “socio-ecological” system restoration strategies were proposed. Restoration-type units should utilize the ecological resilience and focus on reversing poor ecosystem status preventing further ecosystem degradation due to inappropriate human activities. Participation of inter-regional, multi-stakeholder of restoration mechanisms are yet to be established. Conservation -type units should aim to regulate human activities further and promote the rational layout of PLES. These zones should actively explore paths for realizing ecological product value while intensifying ecological protection.
The original contributions presented in the study are included in the article/Supplementary material, further inquiries can be directed to the corresponding author.
YL: Conceptualization, Project administration, Validation, Writing–original draft. JH: Formal Analysis, Methodology, Software, Visualization, Writing–original draft. WL: Conceptualization, Data curation, Formal Analysis, Funding acquisition, Investigation, Methodology, Project administration, Resources, Software, Supervision, Validation, Visualization, Writing–original draft, Writing–review and editing.
The author(s) declare that no financial support was received for the research, authorship, and/or publication of this article.
Author YL is employed by Guangdong Duoyuan Geographic Information Service Co., Ltd.
The remaining authors declare that the research was conducted in the absence of any commercial or financial relationships that could be construed as a potential conflict of interest.
All claims expressed in this article are solely those of the authors and do not necessarily represent those of their affiliated organizations, or those of the publisher, the editors and the reviewers. Any product that may be evaluated in this article, or claim that may be made by its manufacturer, is not guaranteed or endorsed by the publisher.
Ahammad, R., Kamal Hossain, M., Sobhan, I., Hasan, R., Biswas, S. R., and Mukul, S. A. (2023). Social-ecological and institutional factors affecting forest and landscape restoration in the chittagong hill tracts of Bangladesh. Land Use Policy 125 (February), 106478. doi:10.1016/j.landusepol.2022.106478
Bai, Z., Zhou, W., Wang, J., Zhao, Z., Cao, Y., and Zhou, Y. (2019). Overall protection, systematic restoration and comprehensive management of land space. China Land Sci. 33 (2), 1–11. doi:10.11994/zgtdkx.20190218.090442
Cai, H., Chen, Yi, Zha, D., Zeng, Y., Shao, H., and Hong, T. (2020). Principle and method for ecological restoration zoning of territorial space based on the dominant function. China Land Sci. 36 (15), 261–270+325. doi:10.11975/j.issn.1002-6819.2020.15.032
Cao, Yu, Wang, J., and Li, G. (2019). Ecological restoration for territorial space: basic concepts and foundations. China Land Sci. 33 (7), 1–10. doi:10.11994/zgtdkx.20190625.083700
Chen, Z., Liu, Y., and Tu, S. (2022). Comprehensive eco-environmental effects caused by land use transition from the perspective of production–living–ecological spaces in a typical region: a case study of the guangxi Zhuang autonomous region, China. Land 11 (12), 2160. doi:10.3390/land11122160
Dan, Y., Peng, J., Zhang, Z., Xu, Z., Qi, M., and Dong, J. (2020). Territorially ecological restoration zoning based on the framework of degradation pressures, upply state and restoration potential: a case study in the Pearl River Delta region. Acta Ecol. Sin. 40 (23), 8451–8460. doi:10.5846/stxb202004240982
Feng, Q., Zhou, Z., Quan, C., and Zhu, C. (2022). Spatial-temporal evolution research of ecosystem service value in ecologically vulnerable karst regions under the perspective of poverty alleviation relocation. Acta Ecol. Sin. 42 (7). doi:10.5846/stxb202103260798
Fan, Y., Zhou, Y., and Han, Bo (2022). Ecological restoration zoning of agricultural land of the sunan district from the perspective of national land and space governance. Trans. Chin. Soc. Agric. Eng. 38 (1), 287–296. doi:10.11975/j.issn.1002-6819.2022.01.032
Feng, Y. (2021). Construction land optimization of mountain-basin system based on suitability and ecological-production-living spaces conflict——a case study of huishui county in guizhou province. Master Dissertation. Guiyang, China: Guizhou Normal University. doi:10.27048/d.cnki.ggzsu.2021.000674
Gong, Q., Zhang, H., Ye, Y., and Yuan, S. (2020). Planning strategy of land and space ecological restoration under the framework of man-land system coupling: take the Guangdong-Hong Kong-Macao greater Bay area as an example. Geogr. Res. 39 (9), 2176–2188. doi:10.11821/dlyj020200413
He, X., Wang, L., Ke, B., Yue, Y., Wang, K., Cao, J., et al. (2019). Progress on ecological conservation and restoration for China Karst. Acta Ecol. Sin. 39 (18). doi:10.5846/stxb201812292842
Hu, M., Zhang, H., Tang, J., and Yan, S. (2023). Zoning and optimization strategies of land spatial ecological restoration in liangjiang new area of chongqing based on the supply–demand relationship of ecosystem services. Land 12 (6), 1255. doi:10.3390/land12061255
Jiang, H., Peng, J., Zhao, Y., Xu, D., and Dong, J. (2022). Zoning for ecosystem restoration based on ecological network in mountainous region. Ecol. Indic. 142 (September), 109138. doi:10.1016/j.ecolind.2022.109138
Kong, L., Zheng, H., and Ouyang, Z. (2019). Ecological protection and restoration of forest, wetland, grassland and cropland based on the perspective of ecosystem services: a case study in Dongting Lake Watershed. Acta Ecol. Sin. 39 (23). doi:10.5846/stxb201905301137
Li, X. H., Zhang, X., Yao, L., Li, Y., and Yue, L. (2023a). Spatial-temporal evolution characteristics of social - ecological system resilience in hexi region. J. Arid Land Resour. Environ. 37 (7), 38–47. doi:10.13448/j.cnki.jalre.2023.159
Li, Z., Jiang, C., Cheng, Li, and Gu, S. (2023b). Ecological restoration and protection of national land space in coal resource-based cities from the perspective of ecological security pattern: a case study in huaibei city, China. Land 12 (2), 442. doi:10.3390/land12020442
Li, Z., Ma, L., Chen, X., Wang, X., and Bai, J. (2023c). Zoning and management of ecological restoration from the perspective of ecosystem service supply and demand: a case study of yuzhong county in longzhong loess hilly region, China. Land 12 (5), 992. doi:10.3390/land12050992
Liao, L., Dai, W., Chen, J., Huang, W., Jiang, F., and Hu, Q. (2017). Spatial conflict between ecological-production-living spaces on pingtan island during rapid urbanization. Resour. Sci. 39 (10), 1823–1833. doi:10.18402/resci.2017.10.03
Liu, F., Dai, E., and Yin, J. (2023). A review of social–ecological system research and geographical applications. Sustainability 15 (8), 6930. doi:10.3390/su15086930
Liu, Y., Fu, B., Wang, S., Zhao, W., and Li, Y. (2020). Research progress of human-earth system dynamics based on spatial resilience theory. ACTA Geogr. SIN. 75 (5), 891–903. doi:10.11821/dlxb202005001
Ni, Q.-lin, Hou, H.-ping, Zhong-yi, D., Yi-bo, Li, and Jin-rong, Li (2020). Ecological remediation zoning of territory based on the ecological security pattern recognition: taking Jiawang district of Xuzhou city as an example. J. Nat. Resour. 35 (1), 204. doi:10.31497/zrzyxb.20200117
Peng, J., Li, B., Dong, J., Liu, Y., Lv, D., Du, Y., et al. (2020). Basic logic of territorial ecological restoration. China Land Sci. 34 (5), 18–26. doi:10.11994/zgtdkx.20200427.124442
Polyakov, M., Dempster, F., Park, G., and Pannell, D. J. (2023). Joining the dots versus growing the blobs: evaluating spatial targeting strategies for ecological restoration. Ecol. Econ. 204 (February), 107671. doi:10.1016/j.ecolecon.2022.107671
Reader, M. O., Eppinga, M. B., Jan de Boer, H., Damm, A., Petchey, O. L., and Santos, M. J. (2023). Biodiversity mediates relationships between anthropogenic drivers and ecosystem services across global mountain, island and Delta systems. Glob. Environ. Change 78 (January), 102612. doi:10.1016/j.gloenvcha.2022.102612
Smith, L. M., Erin, M., Reschke, J. J. B., Harvey, J. E., and Kevin Summers, J. (2022). A conceptual approach to characterizing ecological suitability: informing socio-ecological measures for restoration effectiveness. Ecol. Indic. 143 (October), 109385. doi:10.1016/j.ecolind.2022.109385
Song, S., Wang, S., Fu, B., Chen, H., Liu, Y., and Zhao, W. (2019). Study on adaptive governance of social-ecological system: progress and prospect. ACTA Geogr. SIN. 74 (11), 2401–2410. doi:10.11821/dlxb201911015
Suding, K., Higgs, E., Palmer, M., Baird Callicott, J., Anderson, C. B., Baker, M., et al. (2015). Committing to ecological restoration. Science 348 (6235), 638–640. doi:10.1126/science.aaa4216
Sun, R., Jin, X., Han, Bo, Liang, X., Zhang, X., and Zhou, Y. (2022). Does scale matter? Analysis and measurement of ecosystem service supply and demand status based on ecological unit. Environ. Impact Assess. Rev. 95 (July), 106785. doi:10.1016/j.eiar.2022.106785
Sun, Y., Zhou, Z., Zhao, Y., Fang, M., and Wu, Y. (2022). Evolution and distribution pattern of land use and rocky desertificaiton in karst mountainous area. Res. Soil Water Conservation 29 (1), 311–318. doi:10.13869/j.cnki.rswc.2022.01.034
Tang, F., Wang, Li, Guo, Y., Fu, M., Huang, Ni, Duan, W., et al. (2022). Spatio-temporal variation and coupling coordination relationship between urbanisation and habitat quality in the grand canal, China. Land Use Policy 117 (June), 106119. doi:10.1016/j.landusepol.2022.106119
Tedesco, A. M., López-Cubillos, S., Chazdon, R., Rhodes, J. R., Archibald, C. L., Pérez-Hämmerle, K.-V., et al. (2023). Beyond ecology: ecosystem restoration as a process for social-ecological transformation. Trends Ecol. Evol. 38 (7), 643–653. doi:10.1016/j.tree.2023.02.007
Tian, M., Gao, J., Song, G., Zou, C., and Zheng, H. (2017). Zoning for ecological remediation by dominant ecological function and ecological degradation degree. J. Ecol. Rural Environ. 33 (1), 7–14. doi:10.11934/j.issn.1673-4831.2017.01.002
Toma, T. S. P., and Buisson, E. (2022). Taking cultural landscapes into account: implications for scaling up ecological restoration. Land Use Policy 120 (September), 106233. doi:10.1016/j.landusepol.2022.106233
Van der Biest, K., Meire, P., Schellekens, T., D’hondt, B., Bonte, D., Vanagt, T., et al. (2020). Aligning biodiversity conservation and ecosystem services in spatial planning: focus on ecosystem processes. Sci. Total Environ. 712 (April), 136350. doi:10.1016/j.scitotenv.2019.136350
Vos, A. de, Biggs, R., and Preiser, R. (2019). Methods for understanding social-ecological systems: a review of place-based studies. Ecol. Soc. 24 (4), art16. doi:10.5751/ES-11236-240416
Wang, H., Zhang, D., Ting, H., Zhao, Y., Wang, Z., and Wu, J. (2023). Social-ecological systems: research trends, theme evolution, and regional practices. Acta Ecol. Sin. 43 (15), 6499–6513. doi:10.5846/stxb202208212395
Wang, J., and Zhong, L. (2019). Application of ecosystem service theory for ecological protection and restoration of mountain-river-forest-field-lake-grassland. Acta Ecol. Sin. 39 (23). doi:10.5846/stxb201905291110
Wang, M., Wang, S., Bai, X., Li, S., Li, H., Cao, Y., et al. (2019). Evolution characteristics of karst rocky desertification in typical small watershed and the key characterization factor and driving factor. ACTA Ecol. SIN. 39 (16), 6083–6097. doi:10.5846/stxb201902170278
Wang, P., and Zhao, W. (2022). Ecological restoration zoning of territorial space in typical karst region: a case study of Maotiao River Basin in Guizhou. J. Nat. Resour. 37 (9), 2403. doi:10.31497/zrzyxb.20220914
Wang, Y., Hu, Y., Gao, M., and Niu, S. (2023). Land-space ecological restoration zoning of karst rocky desertification areas in guangxi from multi-dimensional perspectives. Trans. Chin. Soc. Agric. Eng. 39 (1), 223–231. doi:10.11975/j.issn.1002-6819.202210065
Wang, Z., Fu, B., Wu, X., Li, Y., Wang, S., and Lu, N. (2023). Escaping social–ecological traps through ecological restoration and socioeconomic development in China’s loess plateau. People Nat. 5 (4), 1364–1379. doi:10.1002/pan3.10513
Wu, Y., Zhou, Z., Zhao, X., Dan, Y., and Huang, D. (2020). Spatiotemporal variation of vegetation coverage in plateau mountainous areas based on remote sensing cloud computing platform: a case study of guizhou province. CARSOLOGICA Sin. 39 (2), 196–205. doi:10.11932/karst2020y16
Xie, G., Zhang, C., Zhang, L., Chen, W., and Li, S. (2015). Improvement of the evaluation method for ecosystem service value based on per unit area. J. Nat. Resour. 30 (8), 1243–1254. doi:10.11849/zrzyxb.2015.08.001
Xie, Y.-chu, Zhang, S.-xin, Lin, B., Zhao, Y.-jun, and Bao-qing, Hu (2020). Spatial zoning for land ecological consolidation in Guangxi based on the ecosystem services supply and demand. J. Nat. Resour. 35 (1), 217. doi:10.31497/zrzyxb.20200118
Xiong, K., Cheng, He, Mingsheng, Z., and Junbing, Pu (2023). A new advance on the improvement of forest ecosystem functions in the karst desertification control. Forests 14 (10), 2115. doi:10.3390/f14102115
Ye, Y., Lin, Y., Liu, S., and Luo, M. (2019). Social-ecological system (SES) analysis framework for application in ecological restoration engineering of mountains-rivers-forests-farmlands-lakes-grasslands: utilizing the source area of Qiantang River in Zhejiang Province as an example. Acta Ecol. Sin. 39 (23). doi:10.5846/stxb201905301139
Yue, W., Hou, Li, Xia, H., Wei, J., and Lu, Y. (2022). Territorially ecological restoration zoning and optimization strategy in guyuan city of ningxia, China: based on the balance of ecosystem service supply and demand. Chin. J. Appl. Ecol. 33 (1), 149–158. doi:10.13287/j.1001-9332.202112.024
Zhang, X., Qi, X., Yue, Y., Wang, K., Zhang, X., and Liu, D. (2020). Natural regionalization for rocky desertification treatment in karst peak-cluster depression regions. Acta Ecol. Sin. 40 (16), 5490–5501. doi:10.5846/stxb201910092093
Zhang, X., Wang, Z., Liu, Y., Shi, J., and Du, H. (2023). Ecological security assessment and territory spatial restoration and management of inland river basin—based on the perspective of production–living–ecological space. Land 12 (8), 1612. doi:10.3390/land12081612
Zhao, Xu, Tang, F., Zhang, P., Hu, B., and Xu, L. (2019). Dynamic simulation and characteristic analysis of county production-living-ecological spatial conflicts based on CLUE-S model. Acta Ecol. Sin. 39 (16). doi:10.5846/stxb201901070059
Zhao, Y., Luo, J., Li, T., Chen, J., Yi, Mi, and Wang, K. (2023). A framework to identify priority areas for restoration: integrating human demand and ecosystem services in dongting lake eco-economic zone, China. Land 12 (5), 965. doi:10.3390/land12050965
Zhong, X., Zhang, Su, Wu, R., Jing, Y., Men, L., and Zhou, T. (2022). Analysis of dynamic changes and driving forces of soil erosion in tuojiang river basin. Res. Soil Water Conservation 29 (2), 43–49+56. doi:10.13869/j.cnki.rswc.2022.02.003
Zhou, L., Zhang, H., Bi, G., Su, K., Wang, Li, Chen, H., et al. (2022). Multiscale perspective research on the evolution characteristics of the ecosystem services supply-demand relationship in the chongqing section of the three gorges reservoir area. Ecol. Indic. 142 (September), 109227. doi:10.1016/j.ecolind.2022.109227
Keywords: social-ecological system, ecological restoration zoning, development pressure, sensitivity status, resilience potential, restoration strategies, karst region of Guangdong province, China
Citation: Liu Y, Huang J and Lin W (2024) Zoning strategies for ecological restoration in the karst region of Guangdong province, China: a perspective from the “social-ecological system”. Front. Environ. Sci. 12:1369635. doi: 10.3389/fenvs.2024.1369635
Received: 12 January 2024; Accepted: 31 January 2024;
Published: 16 February 2024.
Edited by:
Xiao Ouyang, Hunan University of Finance and Economics, ChinaReviewed by:
Xiaojun Deng, Zhejiang University of Finance and Economics, ChinaCopyright © 2024 Liu, Huang and Lin. This is an open-access article distributed under the terms of the Creative Commons Attribution License (CC BY). The use, distribution or reproduction in other forums is permitted, provided the original author(s) and the copyright owner(s) are credited and that the original publication in this journal is cited, in accordance with accepted academic practice. No use, distribution or reproduction is permitted which does not comply with these terms.
*Correspondence: Wei Lin, Z2lzX3hpZmFuQDE2My5jb20=
Disclaimer: All claims expressed in this article are solely those of the authors and do not necessarily represent those of their affiliated organizations, or those of the publisher, the editors and the reviewers. Any product that may be evaluated in this article or claim that may be made by its manufacturer is not guaranteed or endorsed by the publisher.
Research integrity at Frontiers
Learn more about the work of our research integrity team to safeguard the quality of each article we publish.