 Yaxuan Cai
 Kongqing Li
- College of Humanities and Social Development, Nanjing Agricultural University, Nanjing, Jiangsu, China
Land use/cover change has an important impact on global climate change and carbon cycle, and it has become another major source of carbon emission after energy consumption. Therefore, this study focuses on the main line of “land use carbon emissions-spatial and temporal patterns-influencing factors,” and selects 13 cities in Jiangsu Province as the research object. Based on the data of land use and energy consumption, combined with the method of land use carbon emissions and ArcGIS technology, this study conducted a quantitative analysis of the spatio-temporal distribution of carbon emissions in Jiangsu Province. The factors affecting the spatial distribution of carbon emissions from land use in Jiangsu Province were discussed by using Geographic detector. The results show that: 1) Carbon emissions in Jiangsu Province showed an overall growth trend, from 16215.44
1 Introduction
In recent years, environmental changes have become more and more drastic as global warming and its negative effects on the ecological environment have gradually intensified (Wang et al., 2014; Pechanec et al., 2018; Zhang et al., 2022). Environmental problems have become one of the major issues of common concern to all countries in the world. At present, global environmental problems are highlighted by climate change triggered by massive greenhouse gas emissions (Zhang et al., 2022). After the industrial revolution, the widespread use of fossil fuels led to the production of large quantities of carbon dioxide, which triggered a rise in global temperatures (Nicholls et al., 2020). In the last decade, the global average temperature has been increasing rapidly. According to the projections of some scholars, by 2050 the global average surface temperature could increase by more than 1.5°C over the period from 1850 to 1990 (Zhu et al., 2022). If the world does not act quickly and aggressively, the global average temperature will continue to rise, which could raise the future sea level by tens of meters (DeFries et al., 2002). This disaster will not only lead to the disappearance of nearly half of the biological species on Earth, but also pose a serious threat to the sustainable development of society, economy and environment, which will in turn jeopardize the security and wellbeing of all humankind (DeFries et al., 2002; Meehl et al., 2014; Waheed et al., 2019; Jiang and Hao, 2022).
According to
Changes in land use will have a great impact on the material cycle and energy flow of the ecosystem, which will not only change the structure, process and function of the ecosystem, but also lead to changes in carbon emissions in the ecosystem (Rong et al., 2022). Different types of land have obvious differences in biomass. When one type of land is transformed into another type of land, it will inevitably cause fluctuations in biomass and lead to changes in carbon storage (Lai et al., 2016; Zhang et al., 2020). In addition, land use change can also affect the regional microclimate to some extent, which can lead to changes in the respiration and decomposition rates of plants and soils in this area, and can also have an impact on the carbon cycle of ecosystems (Zhang et al., 2018). Against this background, many scholars have conducted in-depth discussions on carbon emissions from land use. These studies mainly focus on the calculation method of carbon emissions, the scale of the study, and the various factors affecting carbon emissions (Stuiver, 1978; Breetz, 2017).
The main methods currently used to calculate carbon emissions are the sample land inventory method, the emission inventory method, the mechanistic model simulation method and the carbon emission factor method. The sample land inventory method has relatively few intermediate steps and produces fairly accurate results, however, the obvious drawbacks of this method are the difficulty and high cost of obtaining resource data (Fischer et al., 2011). The emission inventory approach also has its limitations, mainly because it is not comprehensive and fails to accurately reflect emissions from a wide range of activities and consumption patterns, while also lacking sufficient transparency in terms of assumptions, data inputs and emission factors (Leao et al., 2020). Although the mechanistic model simulation method can accurately simulate the carbon cycle process with a high degree of precision, the complexity of the simulation process and the numerous parameters make it difficult for this method to be widely applied (Wu et al., 2019). In contrast, the carbon emission factor method can be widely applied at multiple scales (e.g., macro, meso, and micro scales, etc.) due to its simple formulae and principles (Hu et al., 2023).
In terms of research scale, most of the existing studies use the national and provincial scales to analyze carbon emissions, mainly because the statistics of carbon emissions are carried out at the provincial scale, while studies at the municipal scale are lacking, which makes the research at the municipal scale still a relatively blank stage (Wang et al., 2019; Cai et al., 2021). In fact, the spatial distribution of carbon emissions is jointly determined by the dynamic spatial effects of itself and its neighboring units. Carbon emissions may vary at different spatial scales. By analyzing carbon emissions at the provincial and municipal scales on a spatial scale, we can gain a more comprehensive understanding of the characteristics of carbon emissions in the region.
From the perspective of influencing factors, traditional research methods, such as LMDI, Kaya or STIRPAT models, only reveal the direct effect of each variable on the dependent variable, and then calculate the corresponding influence coefficients. For example (Zhao et al., 2018), conducted an in-depth study on the matching between agricultural carbon emissions and soil and water resources at the provincial level and used the LMDI model for estimation in order to explore how the development of soil and water resources affects agricultural carbon emissions (Wu et al., 2016); used the optimized Kaya constant equation to study the various influencing factors of carbon emissions in China and observed that the growth of the urbanization rate, the energy carbon emission coefficient, and the increase in energy intensity all have a contributing effect on the increase in carbon emissions (Yang and Liu, 2023); used Toronto City in Inner Mongolia as an example, and used the STIRPAT model to conduct linear regression analyses of several indicators, including population, in order to explore the influencing factors of land-based carbon emissions in the city. Typically, various drivers affecting carbon emissions are interconnected, and the interactions between the factors can have different impacts on carbon emissions (Jiang et al., 2018). In many previous studies related to carbon emissions, researchers have identified the relationship between many different drivers and carbon emissions. However, most of the current studies have not considered the interaction between the drivers behind carbon emissions. In addition, most of the models used in the current literature are based on data-based assumptions and do not delve into the interaction between the factors. Therefore, this paper proposes a framework for the study of the interactions among the drivers of carbon emissions based on the geographic detector model. The geographic detector model is a research method that quantifies the spatial heterogeneity of a study object by analyzing the differences between intra- and inter-stratum variances. This model does not need to rely on data assumptions and thus has been widely used in studies related to impact mechanisms (Wang et al., 2010; Jiang et al., 2018; Yang et al., 2019). More importantly, the model is not only able to identify the key drivers that manifest specific spatio-temporal phenomena, but also to explore the interactions among the influencing factors (Wang et al., 2010).
At the same time, with the in-depth study of carbon emissions from land use, more and more scholars have begun to recognize that carbon emissions show significant spatial variability. In recent years, some scholars have even focused on the spatial correlation and spatial aggregation characteristics of carbon emission research. Using spatial autocorrelation (Sun et al., 2020) and hotspot analysis methods (Allaire et al., 2012), some studies have explored the spatial and temporal distribution and agglomeration effects of urban carbon emissions in different regions. For example (Xu et al., 2019), discussed the influence of social ties and economic activities on the spatial and temporal distribution characteristics of carbon emissions in the Pearl River Delta (PRD) (Wu et al., 2021); revealed the spatial and temporal distribution pattern of carbon emissions from industrial land in China during 1997–2016 (Zhang Q. et al., 2017; Wang and He, 2019). conducted an analysis using the Moran index, and the results showed that there was a significant spatial positive correlation between the carbon emissions of various provinces in China, which further revealed the characteristics of spatial agglomeration. From previous studies on the spatial characteristics of carbon emissions, it is clear that China’s carbon emissions do exhibit significant spatial autocorrelation. The researchers also emphasize that understanding the differences in the spatial characteristics of carbon emissions among different cities plays a crucial role in reducing carbon emissions (Tian and Zhou, 2019).
In general, domestic and foreign studies have focused on the accounting of carbon sources, sinks and net carbon emissions from land use, the spatial and temporal distribution characteristics of carbon emissions, and the analysis of factors influencing carbon emissions. These studies are relatively comprehensive, but there are still some limitations: the analyses of the spatial agglomeration characteristics of energy consumption and carbon emissions by the previous researchers mostly stayed at the national and provincial scales, while studies on the spatial and temporal analysis at the provincial and municipal level only focus on the comparison of results from year to year, unable to reveal the inherent law of spatio-temporal changes in carbon emissions, and it is difficult to formulate emission reduction policies based on the spatio-temporal characteristics (Pei et al., 2018); Secondly, in terms of content, there are fewer in-depth discussions on the interactions between neighboring regions, but the revelation of the degree of inter-regional dependence and interactions is helpful to achieve the complementary advantages and coordinated development of the regions; then, most of the studies on the driving factors of carbon emissions have ignored the spatial differences of various influencing factors and the effects of different driving factors on the spatial distribution of carbon emissions from land use.
Situated along the eastern coastal belt, Jiangsu Province is not only one of the most economically prosperous regions in China, but also the center of the Yangtze River Delta region. Since the reform and opening up, Jiangsu’s export-oriented industrialization strategy and accelerated urbanization have led to the province’s rapid economic development, population explosion, intensified energy use and rapid expansion of urban construction land area (Guo and Fang, 2021). Accordingly, the remarkable land-use changes in Jiangsu Province will inevitably affect the local carbon cycle. Therefore, in order to investigate the spatial and temporal dynamic evolution of land use of carbon emissions and its driving factors in Jiangsu Province, this paper selects 13 prefectural-level cities in Jiangsu Province as the research object, and estimates the land use carbon emissions of 13 municipal-level cities and administrative districts in Jiangsu Province from 2010 to 2020 by using the energy consumption data and land use data extracted from remote sensing imagery, and analyzed the spatial and temporal distribution characteristics of their carbon emissions; then, based on the results of carbon emission estimation, the spatial and temporal patterns were further revealed from different perspectives by using exploratory spatial and temporal data analysis (ESTDA) and standard deviation ellipse (SDE). Finally, the geographical detector model was applied to identify the main influencing factors and their interactions, and to reveal the spatial differences of carbon emission drivers in different regions of Jiangsu Province. The conclusions of this study help to clarify the spatial distribution characteristics and influencing factors of carbon emissions from land use in the 13 municipal administrative regions of Jiangsu Province, and also provide a reference for the formulation of regional and differentiated carbon emission reduction policies.
2 Data and methodology
2.1 Representative case
Jiangsu is located in the middle of the eastern coastal region of mainland China, downstream of the Yangtze River and Huaihe River (116°18ˊ-121°57ˊE, 30°45ˊ-35°20ˊN), which is an important part of the Yangtze River Delta region. It has jurisdiction over 13 prefecture-level administrative regions, including Nanjing, Suzhou, Wuxi, Changzhou, Zhenjiang, Nantong, Yangzhou, Taizhou, Lianyungang, Yancheng, Huai’an, Suqian and Xuzhou, accounting for 1.12% of China’s total land area (Figure 1). Geographically, it straddles the north and south, and therefore the climate and vegetation have characteristics of both the south and the north. Jiangsu’s per capita GDP, comprehensive competitiveness, and regional development and livelihood index (DLI) all rank first among all provinces in China, making it the province with the highest level of comprehensive development in China, and it has already stepped into the level of an “upper-middle-class” developed country. However, in recent years, the conflict between rapid development and spatial carrying capacity in Jiangsu Province has become increasingly acute, with drastic changes in land resources and an increasing scarcity of available land resources, triggering a series of ecological and environmental problems such as water pollution and land degradation (He et al., 2022). As an important support and carrier for social and economic development of Jiangsu Province, land use affects the realization of regional carbon balance. Exploring the carbon emission reduction space in the process of land use is of great significance for realizing the “double carbon” goal and improving the green and low-carbon development level of Jiangsu Province.
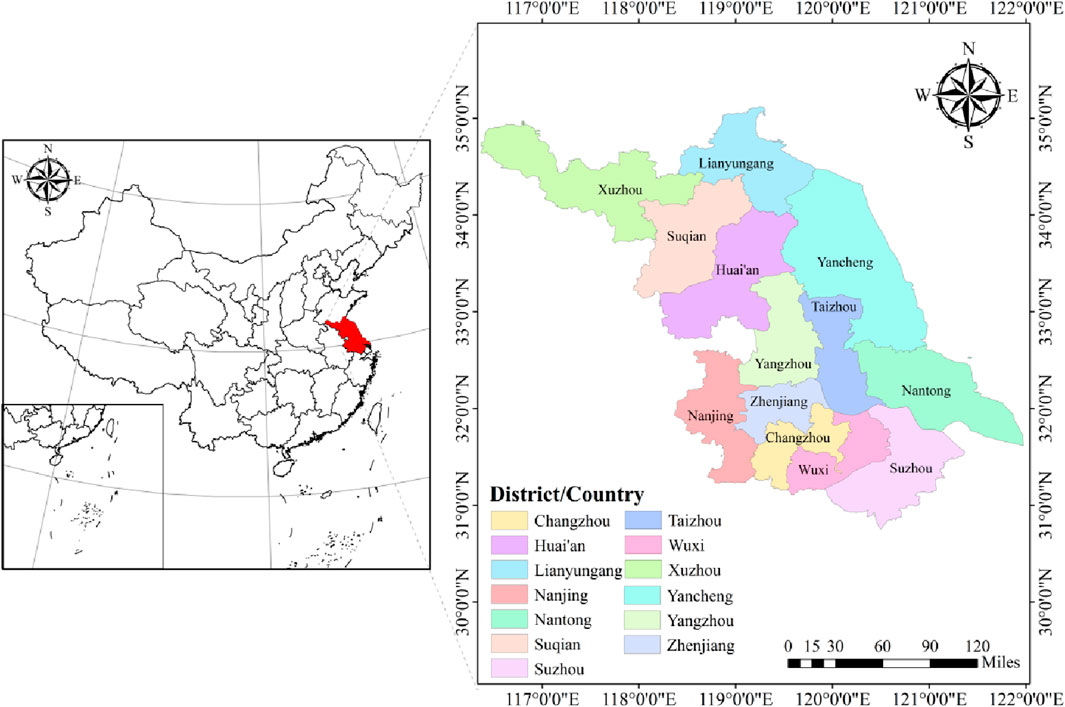
Figure 1. Location of study area.
2.2 Data sources and processing
2.2.1 Data sources
The data used in this study include: 1) Land use data. According to the research needs, remote sensing image data with a raster resolution of 30 m × 30 m in 2010, 2015, 2018 and 2020 were obtained and divided into six land use types: arable land, woodland, grassland, water area, construction land and unutilized land, and ArcGIS software was used to extract the area of each land type. The main remote sensing data are from Data Center for Resources and Environmental Sciences, Chinese Academy of Sciences (https://www.resdc.cn/). 2) Fossil energy data. The fossil energy data used in this paper to calculate the carbon emissions from construction land were obtained from the statistical yearbooks of the 13 prefectural-level cities under the jurisdiction of Jiangsu Province. 3) Social economic data, such as population, GDP were obtained from the Centre for Resource and Environmental Science and Data, Chinese Academy of Sciences (https://www.resdc.cn/).
2.2.2 Influencing factor index selection
Based on the existing research results on carbon emission influencing factors (Deng, 2022; Ye et al., 2023), this study constructs an index system of driving factors of carbon emission of land use in Jiangsu Province from various aspects such as economy, land, population and energy, taking into account the specific situation of the region and availability of data. Considering the uniqueness of “collinear immunity” in the geographic detector model, population size, urbanization rate and population density are selected at the population level; economic total and industrial structure are selected at the economic level; land use structure is selected at the land level; and energy intensity is selected at the energy level. The meanings and statistical descriptions of relevant variables are shown in Table 1.
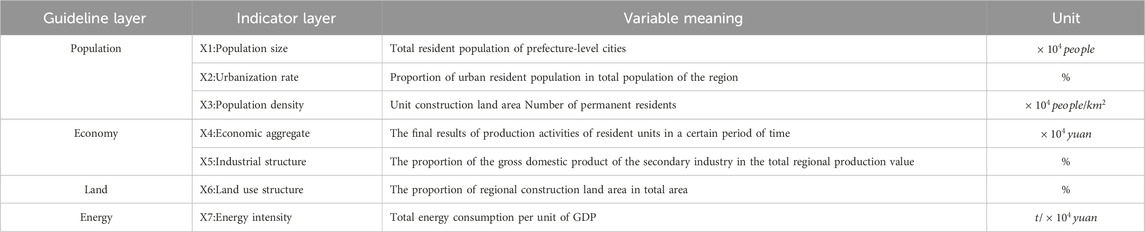
Table 1. Influence index selection and construction.
Population: As the dominant land user, the carbon dioxide released from all economic and social activities carried out by human beings on the land will affect the overall carbon balance pattern of the land, and at the same time, the migration in and out of the population will lead to changes in the population size, thus indirectly affecting the carbon emissions of the whole land. Therefore, this paper chooses the total resident population at the end of the year to represent the population size, and the number of people per unit area to represent the population density, so as to explore the interrelationship between them and the carbon emissions from land use in depth.
Urbanization rate: Rapid development, one of the key indicators of rapid social development, has led to a significant increase in the number of people living in cities and towns. This growth has further triggered the intensive use of energy and land resources, with far-reaching impacts on carbon emissions from land use. In view of this, we use the urbanization rate as an indicator of the level of social development to explore in depth its impact factors on carbon emissions from land use.
Economy: As the economy continues to develop, human consumption of resources such as land and energy gradually increases, which in turn leads to a rise in carbon emissions from land use. At the same time, economic prosperity also promotes the improvement of education and environmental awareness. In this context, the in-depth implementation of carbon emission reduction policies, the continuous innovation of energy-saving and emission reduction technologies and clean energy technologies, as well as the public’s growing preference for environmentally friendly lifestyles, all have an impact on carbon emissions. Therefore, there is a close and dynamic correlation between the level of economic development and land use carbon emissions. In this study, gross regional product is taken as one of the important considerations of carbon emission influencing factors.
Industrial structure: In China’s economic system, the secondary industry plays an important role in the industrial structure, and compared with the primary and tertiary industries, it is more inclined to the use of energy and the development of the industrial sector, and this industrial characteristic makes it more closely related to the land use carbon emissions. Therefore, the article chooses the proportion of the secondary industry in the regional GDP as the index of industrial structure in this study, in order to explore the interaction between these two variables.
Land use structure: Land use structure refers to the spatial distribution of various land uses in a given time scale in a study area, which can visually reflect the current land-use status of the area. In different periods of social development, the degree and pattern of anthropogenic exploitation and utilization will also lead to differences in carbon emissions from land in different regions. It is worth noting that construction land has seen the most significant changes among all types of land use in recent years, and is also the main source of carbon emissions from land use. Therefore, this study chooses the proportion of construction land to total land use as a proxy for land use structure, aiming to explore in depth the intrinsic link between it and land use carbon emissions.
Energy intensity: The impact of energy use intensity on land use carbon emissions lies mainly in the non-equilibrium of the technological level of resource consumption in different regions. This non-equilibrium makes the energy demand of each region differ geographically when reaching the same level of economic growth, which indirectly affects the distribution and spatial characteristics of total carbon emissions. In view of this, this study considers the total energy consumption per unit of GDP as a key element in the system of impact indicators.
2.3 Calculation method of carbon emissions
Land use carbon emissions refer to the
2.3.1 Direct carbon emissions accounting
The carbon emission coefficient method is used to directly account for carbon emissions from arable land, woodland, grassland, watersheds and unutilized land, which are aggregated to obtain the direct carbon emissions from land use, and the calculation formula is as follows:
Where,

Table 2. Carbon emission coefficient of each land use type.
2.3.2 Indirect carbon emissions accounting
Construction land carries many social and economic activities of human beings, so it is impossible to calculate carbon emission directly according to the area of construction land. Therefore, indirect carbon emissions are mainly the carbon emissions generated by human beings in the process of construction land activities, including fossil energy consumption, electricity consumption and population respiration. The calculation formula is as follows:
Where,

Table 3. Carbon emission coefficient of each energy source.
2.4 Standard deviational ellipse (SDE)
The standard deviation ellipse model proposed by Lefever (1926) is an analytical technique used to accurately characterize the spatial distribution of the research object, which mainly covers core elements such as the center of gravity, the long and short axes and the azimuthal angle (Wang et al., 2020). The primary location of the element in space is known as the center of gravity, which usually coincides with the mean position of the arithmetic. The long axis represents the direction of the data distribution, while the short axis reveals the extent of the data distribution. The azimuth angle reveals the trend of the distribution of the study target. This method will be used in this study to analyze the distribution of carbon emission and its trends over time for each city in Jiangsu Province. The formulas are as follows:
a) Center of gravity coordinates
b) Azimuth
c) x-axis standard deviation:
d) y-axis standard deviation:
Where
2.5 Exploratory spatial data analysis (ESDA)
Exploratory spatial data analysis method is actually the comprehensive embodiment of spatial data analysis techniques and methods. This method is often used to describe the distribution characteristics of data in space, and can identify and represent outliers in spatial data in an intuitive manner. In addition, the technique can detect the aggregation effect of certain events in space, provide insights into the spatial layout of the data, and elucidate the spatial interaction mechanisms between different events (Messner et al., 1999). Carbon emissions in space are not randomly distributed, and there may be some correlation between different regions. Through the “cold hot spot analysis” tool in “ArcGIS” software, we can calculate Getis-Ord Gi* for specific weighted elements. Through the calculated z-score and p-value, we can determine the spatial aggregation location of high value areas (hot spots) and low value areas (cold spots), so as to judge the spatial heterogeneity characteristics within the study area (Getis and Ord, 1992). This method is extremely important for the spatial clustering distribution characteristics of the study area.
2.6 The geographical detector model
The Geographical Detector Model is a method of statistical analysis that integrates factors, interactions, risks and ecology, which not only reveals the spatial dissimilarity of a geographic object or phenomenon, but also detects the driving forces generated by the dependent variables (Cheng et al., 2014). Therefore, in this study, we will use the driver detector to quantify the specific influence of each factor on carbon emission, and the result is q. The specific calculation formula is as follows:
Where
Among them, the Geographical Detector Model also includes an interaction detection model, which seeks to elucidate whether the independent variables have an independent effect on the dependent variable, or whether there is an enhanced or diminished effect following an interaction. If an interaction has occurred, there may be five cases as shown in Table 4. At the same time, in order to improve the significance of geographical detector analysis, the article adopts the natural breakpoint method in ArcGIS software to grade the features of each indicator (divided into five levels) to achieve the optimal discretization.
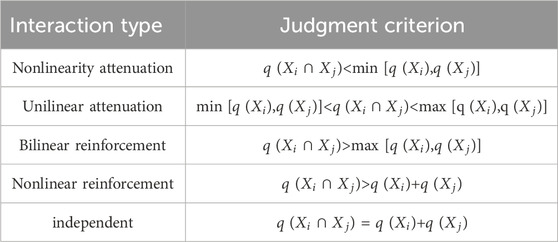
Table 4. The types of independent variable interaction.
3 Results
3.1 Temporal changes in carbon emissions from land use
As can be seen from Table 5, the net carbon emissions in Jiangsu Province during the study period showed a trend of first increasing, then slowly decreasing, and finally rapidly increasing, but in terms of time, the overall net carbon emissions in Jiangsu Province still showed an increasing trend, with an average annual growth rate of 4.55 percent. In 2010–2015, the region’s net carbon emissions showed an upward trend, increasing from 16215.44
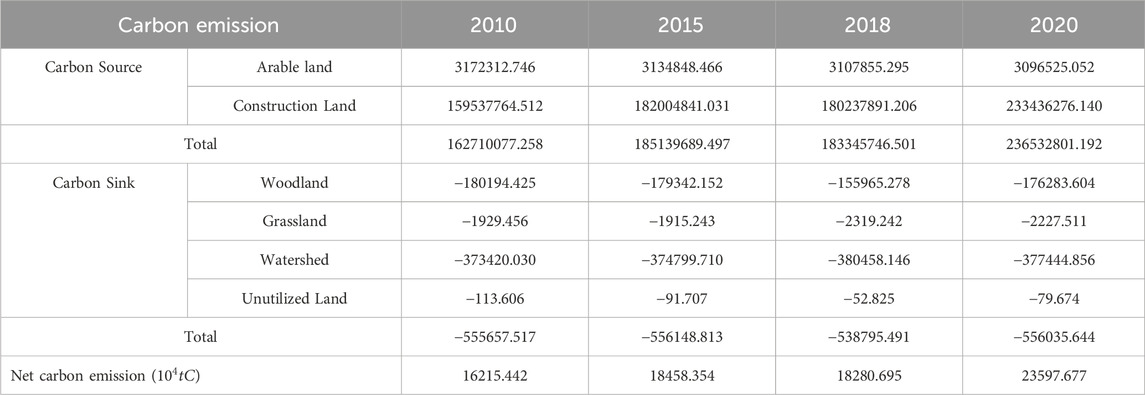
Table 5. Carbon emissions from land use in Jiangsu Province from 2010 to 2020 (
In terms of carbon sources, construction land is the primary land type contributing to the increase of carbon emissions in the region, which increased from 15953.78
In order to have an in-depth understanding of the changes of land use carbon emissions in each city of Jiangsu Province during the study period, this paper conducted detailed statistics on the carbon emissions data of each city, and the results are shown in Figure 2. Because the actual situation of each city is different, the change rule of land use carbon emission varies from city to city. From 2010 to 2015, the carbon emissions of all cities in Jiangsu Province showed an upward trend, except for Wuxi and Yangzhou, which decreased. From 2015 to 2020, the carbon emission from land use in most of the cities in Jiangsu Province basically shows an upward trend in the fluctuation. Among them, driven by the radiation of neighboring cities such as Wuxi and Suzhou, Changzhou’s economy has entered a period of rapid growth, with the proportion of secondary and tertiary industries gradually increasing, and the manufacturing industry has also achieved rapid development. Therefore, Changzhou’s carbon emissions grew most significantly during this period, increasing slowly at first and then rising rapidly in 2018, with a total increase of 5427.468
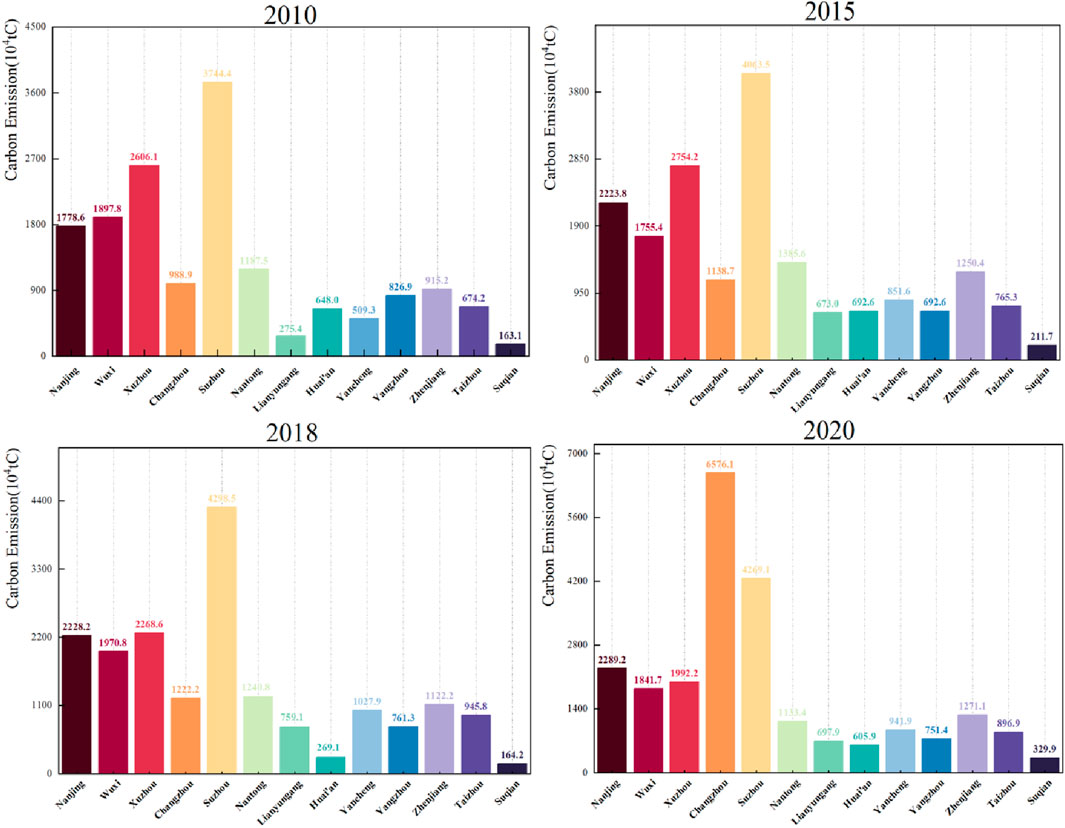
Figure 2. Carbon emissions from land use by city in Jiangsu Province (
3.2 Spatial evolution of carbon emissions from land use
3.2.1 Spatial evolution of land use carbon emissions in Jiangsu Province
In order to more accurately reflect the spatial and temporal distribution characteristics of carbon emissions in each city of Jiangsu Province, this study used the natural segment point method of spatial analysis in ArcGIS software to classify the net carbon emissions of the 13 cities in Jiangsu Province according to different levels (Table 6), which are as follows: light emission zone, general emission zone, moderate emission zone, heavy emission zone, and extremely heavy emission zone.
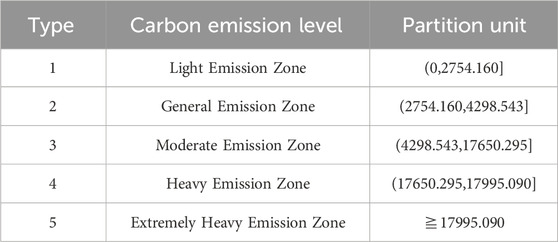
Table 6. Classification criteria for carbon emission levels (
As can be seen from Figure 3, from 2010 to 2020, carbon emissions from land use in all cities in the study area show obvious geographical distribution differences. That is, the overall carbon emissions have a trend of weakening from the surrounding areas to the central area and obvious clustering feature.
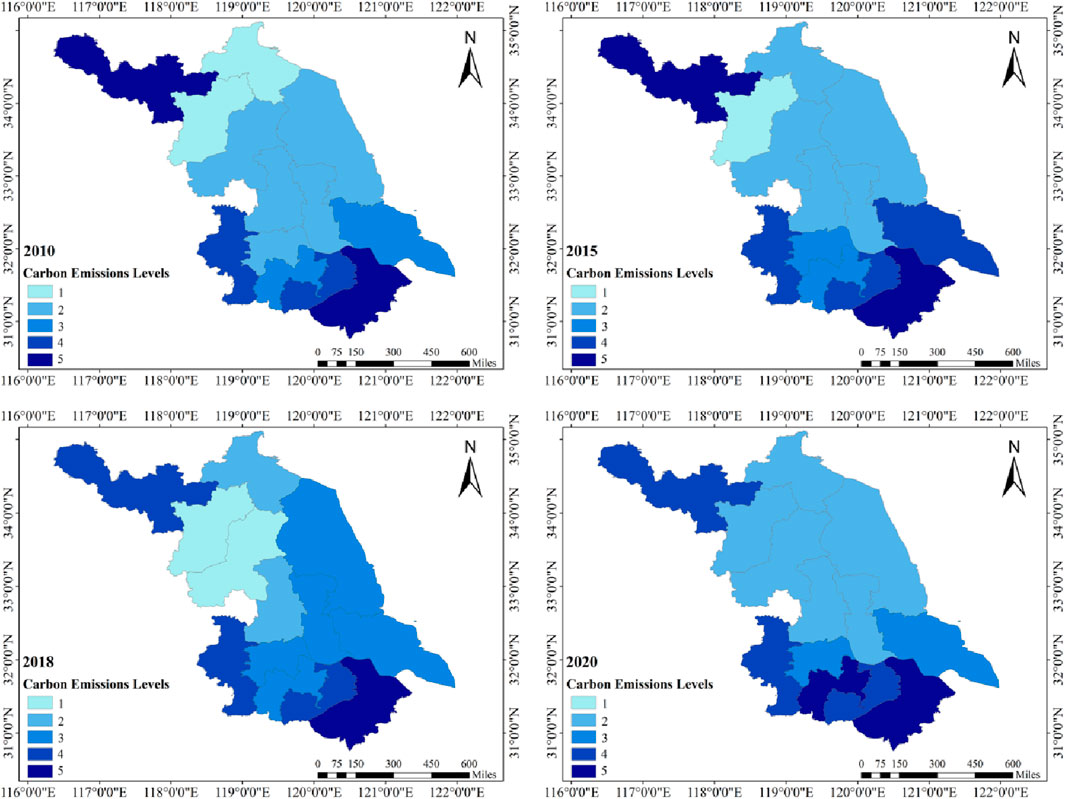
Figure 3. Spatial distribution of net carbon emissions by province in the study area by year (
From 2010 to 2015, the extremely heavy carbon emission zones were mainly distributed in the “two wings” of Jiangsu Province, represented by Xuzhou, Suzhou and other marginal areas with a relatively high degree of industrialization. Because of their rich economic development background and unique geographical location, these areas enjoyed rapid urban construction and economic growth, which also led to the continuous rise of carbon emission. Due to the significant reduction in the use of coal and the transformation and upgrading of five industries, namely, steel, cement, coking, thermoelectric enterprises and chemical industry, the carbon emissions generated in the industrial process have been reduced (Chi et al., 2019), which also makes the carbon emissions of Xuzhou show a significant downward trend in 2018, and gradually exit the extremely heavy carbon emission zone. From 2015 to 2020, as Changzhou’s economy enters the stage of rapid development, its carbon emissions increase rapidly and begin to transform into an extremely heavy carbon emission zone.
The general and medium emission zones were mainly located in the central region of Jiangsu Province, mainly including Yancheng, Yangzhou, Taizhou, Zhenjiang and Nantong, etc. Between 2010 and 2015, except for Nantong, which transformed into a heavy carbon emission zone, the carbon emissions of other regions were relatively stable and remained at their original carbon emission levels. In 2018, Yancheng, Taizhou, Zhenjiang and Nantong all shifted to medium emission zone due to accelerated urbanization, but in 2020, the cities reverted back to general emission zone.
In 2010, the light emission zones were mainly concentrated in Suqian and Lianyungang, which lagged behind in terms of relatively slow economic development, and thus had smaller carbon emissions from their energy consumption. Since 2015, the significant expansion of urban construction land under the influence of policies led to an increase in Lianyungang’s carbon emissions, crossing over into the general carbon emission zone. In 2018, due to Huaian’s stringent control of its carbon emissions, it was successfully transformed into a light emission zone, the number of light carbon emission zones in Jiangsu Province remained at two again. In 2020, the carbon emissions of all cities in Jiangsu Province have increased on the whole, and the light carbon emission zone have disappeared.
3.2.2 Exploratory spatial data analysis of carbon emissions from land use
The “Hot spot Analysis” tool in ArcGIS 10.6 was used to calculate the spatial aggregation degree and change of net carbon emissions in cities of Jiangsu Province, and the results were shown in Table 7. During 2010–2020, the General G value of net carbon emissions from land use in Jiangsu Province was all greater than 0 and showed an overall upward trend, from 0.423512 to 0.423862, indicating that net carbon emissions in this region had an obvious spatial aggregation feature, and the aggregation degree would increase with the evolution of time.
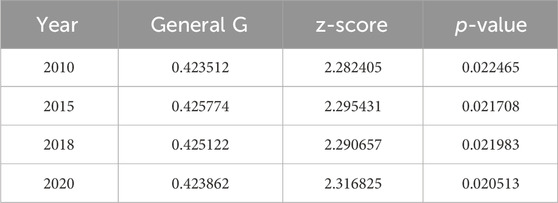
Table 7. The General G value of carbon emissions of Jiangsu Province.
The overall spatial pattern of carbon emissions from land use in Jiangsu Province from 2010 to 2020 is “high in the south and low in the north” (Figure 4). The hot spots of carbon emission are mainly distributed in Suzhou, Wuxi, Changzhou and other southern Jiangsu regions, which are geographically adjacent to Shanghai, with rapid economic development and high urbanization, and are the main economic development force in Jiangsu Province, so it is necessary to focus on the management of carbon emissions in this region. The cold spot zone mainly distributed in the north of Jiangsu Province, such as Huaian, Yancheng, Lianyungang, etc. Although this region has rich natural resources, it is located inland and has a low level of economic development, so the carbon emission is relatively small.
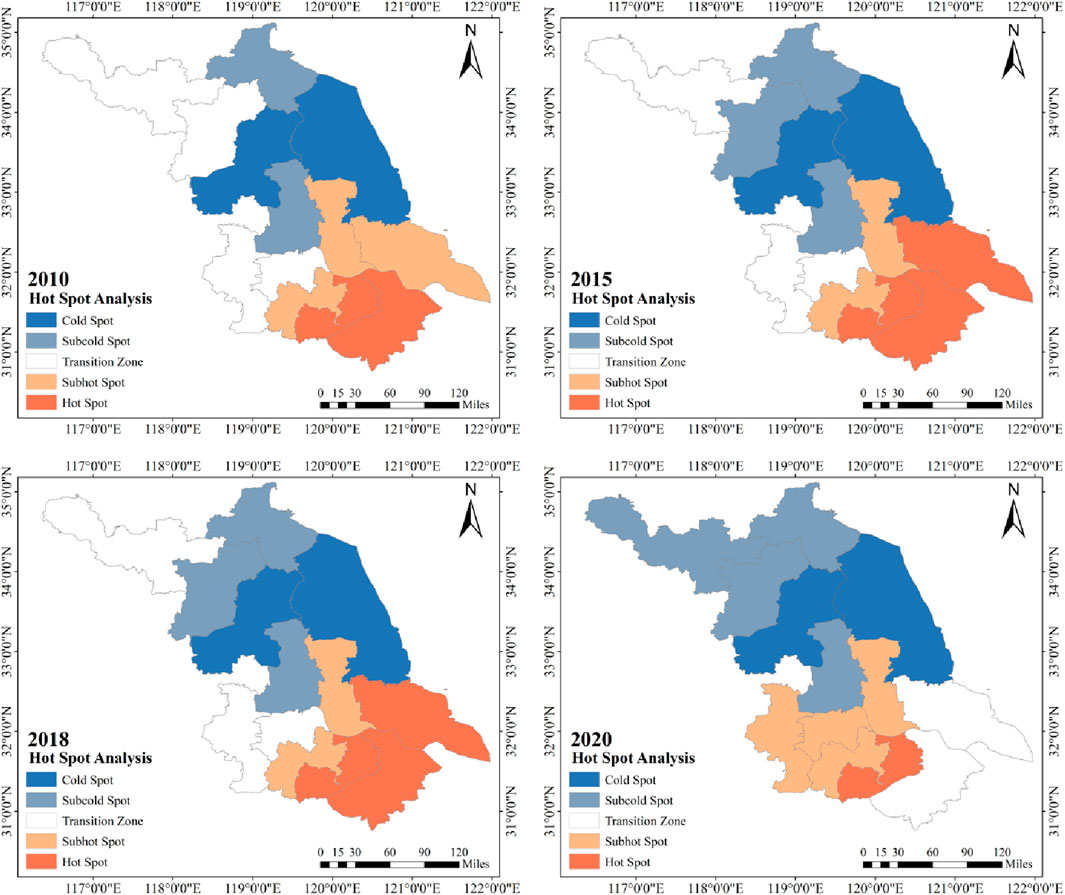
Figure 4. Hot spot analysis of carbon emissions in Jiangsu Province.
During the study period, the distribution pattern of hotspot high-value zone and cold spot low-value zone were relatively stable in space and time, but the distribution characteristics varied among the stages. Spatio-temporally, the range of hotspot zone in Jiangsu Province remained stable from 2010 to 2018, but the hotspot center had an obvious northward trend, which was mainly manifested in the gradual transition of Nantong as a sub-hotspot zone to a hotspot zone. At the same time, the range of cold spot zone in Jiangsu Province is expanded, and Suqian successfully enters the ranks of sub-hot spot zone. In 2018–2020, the range of hot spot zone in Jiangsu Province showed a shrinking trend, transforming from three hot spot zones and two sub-hot spot zones in 2018 to one hot spot and four sub-hot spot zones in 2020, in which Suzhou and Nantong exit from the hot spot zone. The scope of the cold spot zone in Jiangsu Province during this period showed an expanding trend, and the center of the cold spot showed a tendency to shift to the north-west direction, which is reflected by the fact that Xuzhou also gradually transitions to the sub-hot spot zone during this period. These changes show that Jiangsu Province has made good progress in carbon emission reduction in recent years, but in some areas there is still a need to further strengthen management and control.
3.2.3 The migration of gravity center and SDE analysis of carbon emissions
The SDE model was used to conduct complementarity analysis to reveal the changing law of the location of the center of gravity of regional carbon emissions in Jiangsu Province and the spatial distribution characteristics of high carbon emission areas, as shown in Table 8 and Figure 5.

Table 8. Elliptic parameters of standard deviation of carbon emissions in Jiangsu Province.
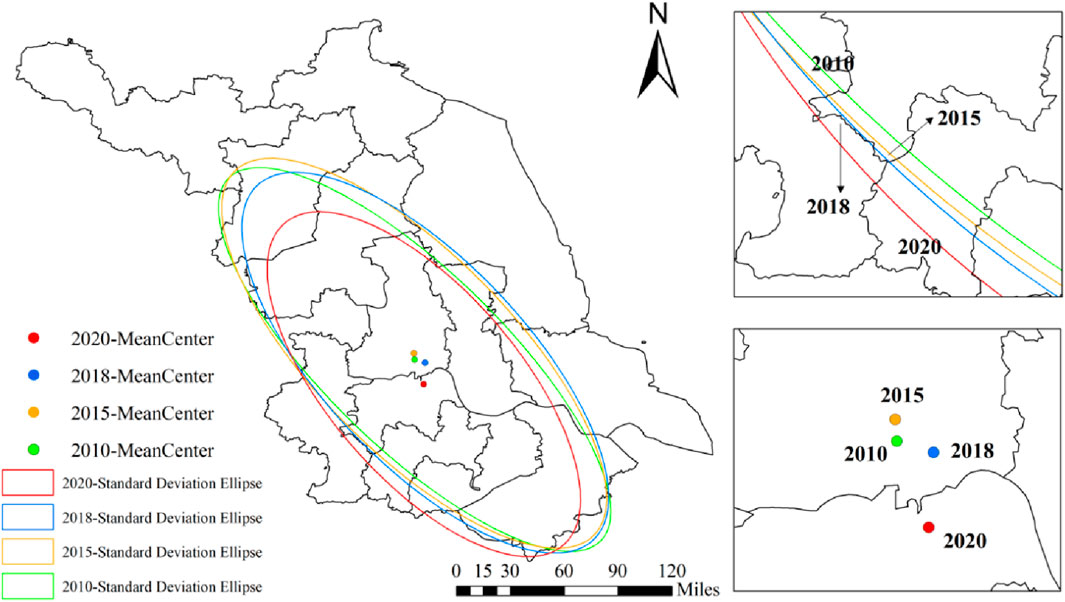
Figure 5. Standard deviation elliptic distribution and center of gravity shift trajectory of carbon emissions.
During the period 2010–2020, the spatial distribution of carbon emissions in Jiangsu Province formed a stable “northwest-southeast” pattern with the change of the length of the axis, and its direction towards the southern part of Jiangsu Province is especially obvious, which indicates that the main driving force for the growth of carbon emissions in Jiangsu Province is the southern part of Jiangsu Province, such as Suzhou, Wuxi, Nanjing, and so on. In addition, the long and short axes of the standard deviation ellipse are also changed to different degrees. Specifically, the long axis decreased from 216.016
During the study period, the center of gravity of carbon emissions in Jiangsu Province was distributed between 119°34′06.44"∼119°39′26.70″E and 32°11′37.95"∼32°26′46.59″N, which is located in the southeast direction of the regional geometric center, which means that the carbon emissions in the eastern and southern regions of Jiangsu Province are relatively high. By observing the trajectory of the change of the center of gravity of carbon emissions in Jiangsu Province, it can be found that the center of gravity of carbon emissions in the province mainly migrates to the southeast, which means that the growth rate of carbon emissions in the eastern and southern regions of Jiangsu Province is above average.
From 2010 to 2020, the center of gravity moved a total of 23.352
3.3 Geo-detection analyses of the impact of land-use carbon emissions
3.3.1 Detection of single factor
The geographic detector is used for detection and analysis, and the q value of carbon emission for each detection factor is calculated, and then the visual display is carried out. The results show that different influencing factors have certain consistency and difference on land use carbon emissions in Jiangsu Province (Table 9). From the table, it can be seen that in 2010, the order of the q-value of each indicator is: economic total > population density > population size > urbanization rate > industrial structure > energy intensity > land-use structure, in which the sum of the explanatory power of population size, urbanization rate, population density and economic total accounted for 74.97% of the sum of the total explanatory power affecting carbon emissions, and the q-values of these four factors are all greater than 0.5. Therefore, these factors can be regarded as the main driving forces affecting Jiangsu’s carbon emissions in that year.
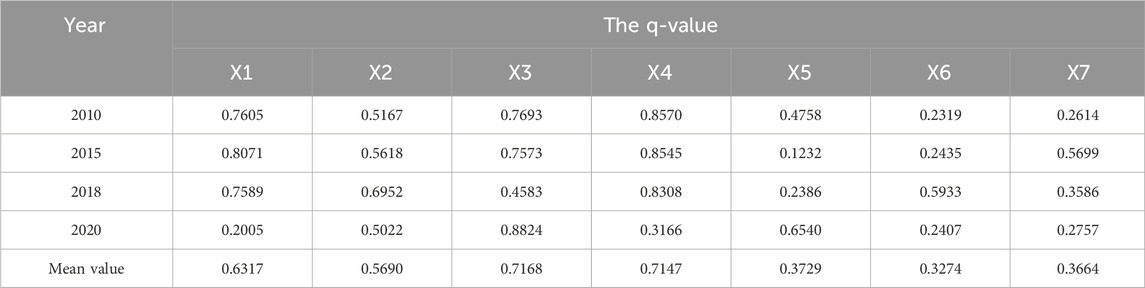
Table 9. The q-value for detection analysis of carbon emission factors from land use in Jiangsu Province.
In 2015, the q-value of each indicator is in the following order: economic total > population size > population density > energy intensity > urbanization rate > land use structure > industrial structure, of which economic total, population size, population density, energy intensity and urbanization rate are the dominant factors affecting carbon emissions in Jiangsu Province in that year. Under the background of rapid economic development in Jiangsu Province in 2015, its demand for energy is also rising, and this large-scale energy consumption has led to a significant increase in carbon emissions, so it can be found that energy intensity has also become the dominant factor affecting carbon emissions in Jiangsu Province in that year.
In 2018, the order of the q-value of each indicator is: economic total > population size > urbanization rate > land use structure > population density > energy intensity > industrial structure, in which economic total, population size, urbanization rate and land use structure were the main factors influencing carbon emissions in Jiangsu Province in that year. The influence of land use structure grew rapidly during the period, which was mainly due to the accelerated pace of urbanization driven by population surge, rapid development of secondary and tertiary industries and government policies, which triggered the rapid expansion of construction land. This also indirectly proves that construction land is the main source of carbon emissions, echoing the previous measurements.
In 2020, the q-value of each indicator is in the following order: population density > industrial structure > urbanization rate > economic total > energy intensity > land use structure > population size, of which the factors that play a dominant role in the carbon emissions of Jiangsu Province are population density, industrial structure and urbanization rate. During this period, the influence of each indicator has changed significantly, and population size and economic total are no longer the dominant factors affecting carbon emissions. On the contrary, the industrial structure has gradually increased its strength in explaining carbon emissions. This change may be attributed to the fact that the overall economic growth rate of Jiangsu began to decline due to the impact of the Xin Guan epidemic, and the secondary industry led by industry gradually became the core driving force of local economic growth, which led to the gradual weakening of the influence of the total economic output on carbon emissions in Jiangsu Province, and the gradual increase of the influence of the industrial structure on carbon emissions.
3.3.2 Detection of two-factor interaction
The interaction between the indicators was further explored using the interaction detection method of the geographical detector (Figure 6). The results of the interaction of the influencing factors mainly show two-factor enhancement or non-linear enhancement effects, and there is no mutual independence or weakness, which means that the spatial and temporal differences in land use carbon emissions in the study area is not entirely caused by a single factor, but by the joint action of multiple factors.
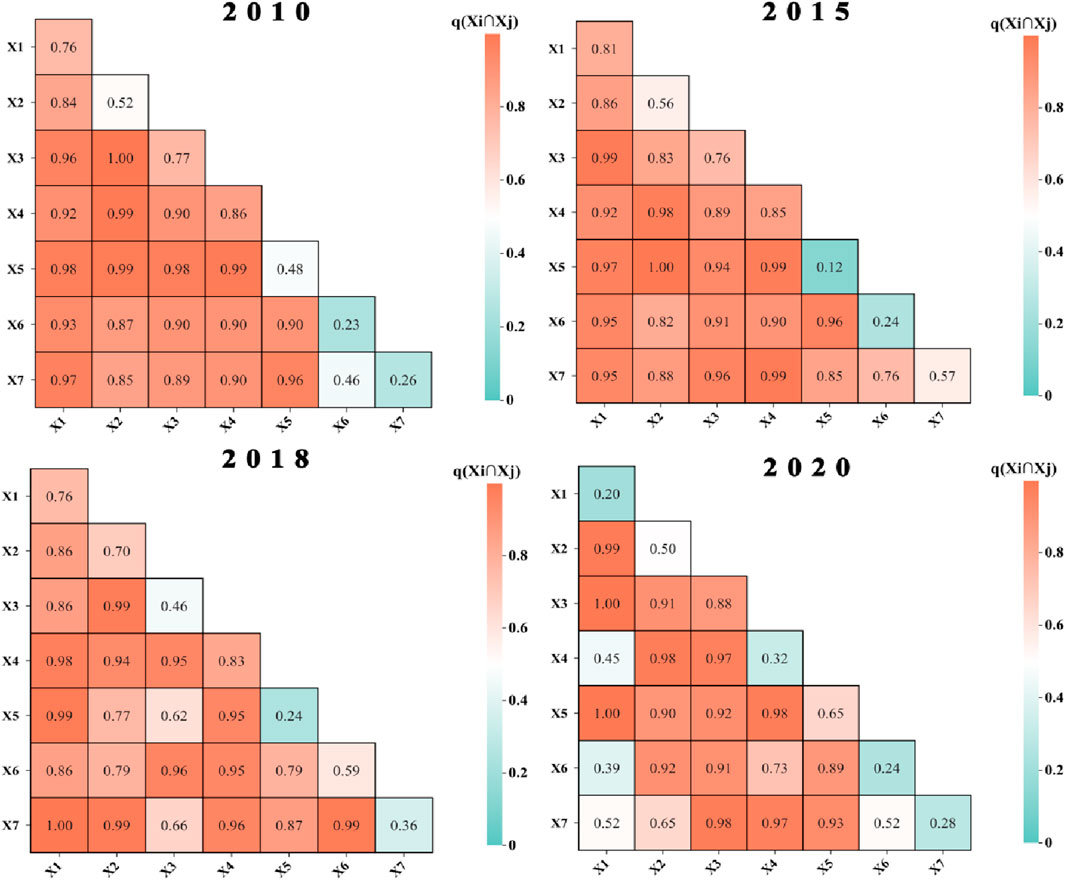
Figure 6. Two-factor interaction heat map of carbon emissions from land use in Jiangsu Province.
Among them, in 2010, the combinations with the most significant interactions are X2∩X3, X2∩X4, X2∩X5, X4∩X5, and their interaction values are 0.9988, 0.9935, 0.9890, 0.9972, respectively; in 2015, the combinations with the most significant interactions are X1∩X3, X2∩X4, X2∩X5, X4∩X5, X4∩X7, with interaction values of 0.9925, 0.9821, 1.0000, 0.9853, and 0.9918, respectively; in 2018, the combinations with the most significant interactions were X1∩X5, X1∩X7, X2∩X3, X2∩X7, and X6∩X7, with interaction values of 0.9989, 0.9999, 0.9886, and 0.9957, respectively; in 2020, the combinations with the most significant interaction are X1∩X2, X1∩X3, X1∩X5, X2∩X4, X3∩X7, and X4∩X5, with interaction values of 0.9981, 0.0081, 0.9982, 0.9820, 0.9820, and 0.9847, respectively.
Observing the whole research cycle, the interaction mechanisms of the indicators in different time periods show obvious differences. In the early part of the study period (2010–2015), the influences of urbanization rate or economic volume interacting with other variable factors are more significant. However, in the middle and late periods of the study (2015–2020), the interactions between population size and other variable factors are more prominent. Overall, the interactions between the three factor combinations of urbanization rate and population density, urbanization rate and total economic value, and total economic value and industrial structure show high explanatory power almost throughout the study period, which strongly indicates that they have the most critical impact on carbon emissions in Jiangsu Province.
4 Discussion
4.1 Analysis of spatio-temporal evolution characteristics of carbon emissions from land use
During the period of 2010–2020, Jiangsu’s carbon emissions from land use in general showed a fluctuating upward trend, with a downward trend in 2015–2018 and a rapid rise in 2018. This is because with the national emphasis on the development of low-carbon economy, Jiangsu Province, in order to ensure the achievement of the “Twelfth Five-Year” energy-saving, emission reduction and carbon reduction targets, has formulated policies such as the “2014–2015 Energy Saving, Emission Reduction and Low-Carbon Development Action Implementation Programme.” As a result, in 2015, carbon emissions in Jiangsu Province were under better control, showing a downward trend. However, as the pace of China’s urbanization continues to accelerate, Jiangsu Province stepped into the rapid development stage of urbanization in 2018. This has led to the gradual emergence of problems such as inefficient use, inappropriate use and disorderly expansion of construction land, which has triggered a series of ecological and environmental problems, and thus has led to the trend of rapid growth of carbon emissions from land use in Jiangsu Province in 2018.
Overall, about more than half of the carbon sequestration during the study period originated from watersheds (Table 5). It can be seen that the watershed of Jiangsu Province seem to possess higher carbon sequestration potential. One possible explanation for this is that watershed, as the dividing line between land and sea, have large organic carbon reserves (Zhang et al., 2022). Therefore, in order to achieve the goal of reducing carbon emissions, it is also particularly crucial to prevent water bodies from being polluted. In Jiangsu Province, industrial and mining land with high carbon emissions is mainly concentrated in coastal areas near the Yangtze River Basin, where a large number of other pollutants may exist that have not yet been identified (Yuan et al., 2022), therefore, the use of industrial and mining land in areas near the Yangtze River Basin should be strictly controlled, and in the future, it is even more important to prohibit the expansion of industrial land in such areas, as well as consider relocating enterprises elsewhere, and converting industrial and mining land to other uses.
By analyzing the characteristics of the spatial evolution of carbon emissions from land use in Jiangsu Province, it can be found that carbon emissions in Jiangsu Province show a strong spatial focus. It is mainly manifested in the fact that the surrounding cities of Nanjing, Suzhou, Wuxi and other high carbon emission areas are also always in the hot spot of carbon emission. This phenomenon has a certain connection with the economic development status of each place (Rehman et al., 2021). As we all know, the economic development of Jiangsu Province is very unbalanced, showing significant geographical differences, of which Southern Jiangsu, Central Jiangsu and Northern Jiangsu are the three major economic regions with obvious gradient differences. Southern Jiangsu is located in the hinterland of the “Yangtze River Delta Economic Circle,” adjacent to the core city of Shanghai, and has a fast-developing economy; Northern Jiangsu is located in the periphery, farther away from Shanghai, and the attraction and radiation effect of the economic center is very weak. Therefore, the overall spatial distribution pattern of carbon emissions in Jiangsu Province is high in the south and low in the north. However, with the passage of time, the number of areas with high carbon emissions in Jiangsu Province has gradually increased and spread to the central and northern parts of the Jiangsu Province. This is mainly due to the fact that Jiangsu Province has begun to vigorously promote the development and opening up of northern and central Jiangsu in recent years, and has deeply explored and utilized the traditional resources of northern and central Jiangsu. Although the economy has achieved rapid growth, it has also caused a series of ecological and environmental pollution problems.
4.2 Analysis of influencing factors of land use carbon emission in Jiangsu Province
The Carbon emissions from land use in Jiangsu Province are affected by a variety of factors, such as economic development, industrial structure, energy intensity, land use and human activities, and the process has a complex mechanism. Among them, population size, economic aggregate, urbanization rate and population density are not only obviously related to the land use carbon emissions in Jiangsu Province, but also the main driving force of the uneven spatial distribution of land use carbon emissions in Jiangsu Province.
The results of the study show that the demographic factors (population density, population size and urbanization rate) have always had a strong explanatory power for carbon emissions in Jiangsu Province. The reason why carbon emissions have become the focus of global attention is that excessive carbon emissions can cause a series of environmental problems that are closely related to the survival of human beings, in which human beings are both the bearers and generators of carbon emissions (). Against the backdrop of accelerated industrialization and urbanization, the supply and demand relationship between land for living and production and land for construction will become tighter due to the concentration of population, which in turn will lead to a continuous increase in the area of arable land and construction land, and a decrease in the area of carbon sinks, such as woodland, grassland and watersheds. At the same time, as the population grows, we need to consume more energy to make the products we need, which means that more carbon dioxide will be released in people’s daily lives and travel.
Secondly, as shown in Table 9, carbon emissions from land use in Jiangsu Province are to a large extent positively driven by the economic aggregate factor. This is mainly because rapid economic growth will bring about a significant “siphon effect,” which will attract the inflow of resources and capital from neighbouring regions, leading to an increase in energy consumption in production and life, and ultimately driving the rise of regional carbon emissions. However, as Jiangsu Province’s economy continues to improve and its industrial structure transforms, the province’s economy will gradually become more intensive, and the efficiency of resource use will continue to increase, which will further lead to a gradual reduction in the intensity of carbon emissions; While the economy is developing, people pay more and more attention to environmental protection, and they begin to pursue more low-carbon living habits, which also leads to the reduction of carbon emissions (Gu et al., 2023). Therefore, it can also be found that the q value of the influence of the total economy is decreasing year by year, and it is only 0.3166 in 2020.
Although the explanatory power of industrial structure on carbon emissions is lower than that of the main drivers mentioned above, we can observe that the influence of industrial structure on the growth of carbon emissions increases significantly at a later stage. Therefore, when it comes to carbon emission reduction in the future, cities and regions in Jiangsu Province need to focus on concentrating on optimizing the industrial layout, strengthening the integration between industries, and integrating the concept of low carbon into the development of industrialization.
It should be emphasized that the effects of pairwise interactions of factors on carbon emissions are more significant than those of single factors (Figure 6). It is clear that carbon dioxide emissions are the product of the combined influence of many factors. Therefore, when formulating strategies to reduce carbon emissions, it is necessary to consider a combination of factors, and the effect of only targeting a single factor may not be satisfactory.
4.3 Low-carbon recommendations
4.3.1 Optimize the land use structure and strictly control new construction land
In order to realize the low-carbon development of land use in Jiangsu Province, it is necessary to pay attention to the strict control of the expansion rate and scale of construction land, and to formulate differentiated carbon emission management strategies at the city and county levels. Firstly, the province should strictly implement the land use control system, strictly divide the scope of urban development, and strictly control the conversion of woodland, watershed and other high carbon sink land into construction land; secondly, it should vigorously advocate afforestation and greening, improve environmental management, vigorously develop low-carbon fisheries, and explore new types of fishery and forestry management methods, so as to achieve win-win results in terms of economy and ecology; lastly, it should strengthen the intensive use of construction land, take the initiative to explore the potentials of its inherent, and advocate three-dimensional construction land use. Finally, it is necessary to strengthen the intensive use of construction land, actively explore its inherent potential, advocate three-dimensional development of construction land, carry out a reasonable layout of construction land, and strengthen the infrastructure construction of neighboring counties and cities to alleviate the pressure on the land of the central urban area, and promote the outward development of towns and cities.
4.3.2 Strengthening industrial transformation and optimization and upgrading industrial structure
Economic development is an important factor affecting carbon emissions from land use in Jiangsu Province, and the optimization and adjustment of industrial structure is the key to achieving green and low-carbon development. Therefore, in the future, Jiangsu Province should adjust the structure of the three industries, promote the transformation of the economic development mode, change the traditional development mode of “high energy consumption, high pollution and high emission” to “high efficiency, high output and high growth,” The traditional development mode of “high energy consumption, high pollution and high emission” should be changed to a new economic growth mode of “high efficiency, high output, high growth” and “low pollution.” On the one hand, it is necessary to actively promote the development of low-carbon industries, act in strict accordance with the country’s new low-carbon industrial policy, and prioritize the allocation of land resources to innovative industries and modern service industries that are in line with the direction of industrial transformation and upgrading. Land use standards will be more inclined to energy saving, environmental protection, low energy consumption, high economic benefits and low carbon emissions of environmental friendly fields. On the other hand, strengthen the supervision of existing industries, especially industry, strictly control each carbon emission index, and carry out industrial emission reduction layer by layer in the two dimensions of supply and supervision.
4.3.3 Optimizing the structure of energy use and improving the efficiency of energy use
In the context of fossil energy as the largest source of carbon emissions, improving energy efficiency has been recognized by many countries as an effective means of reducing emissions. Therefore, in order to realize the gradual decoupling of economic growth and land use carbon emissions, it is necessary to adjust the economic structure to the direction of capital economy, while improving energy efficiency and reducing energy consumption. This will help Jiangsu Province achieve economical and intensive economic development, thus achieving the goal of reducing emissions. On the one hand, Jiangsu should make use of its unique energy advantages to strengthen cross-regional cooperation with Zhejiang, Anhui and other provinces, deepen energy cooperation relations with neighboring provinces, commit to building high-end energy and chemical industry bases, and comprehensively plan the regional layout of key energy and chemical industry projects, while promoting the protection of ecological environment; On the other hand, it will gradually change the energy consumption structure of Jiangsu Province, which is dominated by fossil fuels such as coal, oil and natural gas, promote the diversified development of energy consumption structure, commit to the development of efficient and green energy resources, and promote the research and development and application of safe, efficient and clean renewable energy and new energy.
4.3.4 Reasonable control of population size
By analyzing the results of the geodetector, we can clearly see that population size has a significant impact on carbon emissions from land use. Jiangsu Province, as an economically developed region, has a huge population base, which will be a key factor for Jiangsu Province to face greater carbon emission pressure in the future. In addition, with the full implementation of the two-child policy, the population size of Jiangsu Province will continue to increase carbon dioxide emissions in the near future. Therefore, there is a need to strengthen the control of the population. The number of household population should be effectively controlled and people should be guided to establish a scientific concept of childbearing to prevent the two-child policy from being implemented without excessive population growth during the peak fertility period. At the same time, it is necessary to effectively control the excessive inflow of migrants and achieve a long-term balance between carbon emission reduction and attracting migrants to develop employment.
5 Conclusion
In this study, carbon emissions from land use in Jiangsu Province during the period 2010–2020 were estimated, and various technical methods such as hotspot analysis, standard deviation ellipse and geo-detector were used to conduct an in-depth study and analysis of their spatial and temporal evolution patterns as well as the factors that affect these changes, and the following results were obtained.
From the perspective of time evolution characteristics, carbon emissions in Jiangsu Province generally show a growth trend, from 16215.44
The Carbon emissions from land use in Jiangsu Province show a spatial trend of weakening from the surrounding regions to the central region. Among them, except for Xuzhou, the high carbon emission areas are mainly concentrated in the southern part of Jiangsu Province near Shanghai. According to the hotspot analysis and the standard deviation ellipse analysis, the land use carbon emissions of each city in Jiangsu Province have obvious distribution characteristics of high in the south and low in the north, and a stable spatial clustering pattern, and the degree of aggregation increases with the evolution of time.
The spatial variability of carbon emissions from land use in Jiangsu Province is the result of a combination of factors such as economic development, industrial structure, energy intensity, and land use. Among them, population size, economic aggregate, urbanization rate and population density all play a decisive role, and the results show that the influence of any two influencing factors after interaction shows different degrees of two-factor enhancement and non-linear enhancement.
Finally, based on the analysis of the whole paper, it puts forward the policy suggestions for low-carbon development in Jiangsu Province, such as strictly controlling the expansion of construction land, optimizing the industrial structure, improving energy efficiency, and controlling population growth.
Overall, this study reveals the relationship of carbon emissions between neighboring regions and the impacts of the interaction of different drivers on carbon emissions, bridges the gap in the existing research literature, and provides a reference for realizing the complementary advantages and coordinated development between regions. At the same time, the study may have deficiencies in the following aspects, which should be avoided as much as possible in future research: (1) When calculating direct carbon emissions from land use in this study, the carbon emission coefficients of all land use types are adopted from previous research results. Due to technical constraints, these coefficients are not fully localized, which may lead to slight deviations between the calculation results and the actual carbon emission characteristics of the study area; nevertheless, these results are still acceptable and understandable. (2) The change process of land use carbon emissions should be continuous, but due to the different uniform calibrations of land area, this paper chooses to use remote sensing image data to account for land use carbon emissions during 2010–2020, which makes the results have a large difference in each time period and the problem of discontinuous changes. It will be further improved in the future research.
Data availability statement
The original contributions presented in the study are included in the article/supplementary material, further inquiries can be directed to the corresponding author.
Author contributions
YC: Writing–original draft. KL: Writing–review and editing.
Funding
The author(s) declare that financial support was received for the research, authorship, and/or publication of this article. This work was supported by General Project of National Social Science Foundation of China (Grant No. 22BGL192).
Conflict of interest
The authors declare that the research was conducted in the absence of any commercial or financial relationships that could be construed as a potential conflict of interest.
Publisher’s note
All claims expressed in this article are solely those of the authors and do not necessarily represent those of their affiliated organizations, or those of the publisher, the editors and the reviewers. Any product that may be evaluated in this article, or claim that may be made by its manufacturer, is not guaranteed or endorsed by the publisher.
References
Allaire, S. E., Lange, S. F., Lafond, J. A., Pelletier, B., Cambouris, A. N., and Dutilleul, P. (2012). Multiscale spatial variability of CO2 emissions and correlations with physico-chemical soil properties. Geoderma 170, 251–260. doi:10.1016/j.geoderma.2011.11.019
Breetz, H. L. (2017). Regulating carbon emissions from indirect land use change (ILUC): US and California case studies. Environ. Sci. Policy 77, 25–31. doi:10.1016/j.envsci.2017.07.016
Cai, M., Shi, Y., Ren, C., Yoshida, T., Yamagata, Y., Ding, C., et al. (2021). The need for urban form data in spatial modeling of urban carbon emissions in China: a critical review. J. Clean. Prod. 319, 128792. doi:10.1016/j.jclepro.2021.128792
Cheng, G., Han, J. W., Zhou, P. C., and Guo, L. (2014). Multi-class geospatial object detection and geographic image classification based on collection of part detectors. Isprs J. Photogrammetry Remote Sens. 98, 119–132. doi:10.1016/j.isprsjprs.2014.10.002
Chi, W., Li, Y., Cao, Y., and Cao, Y. (2019). Survey analysis and countermeasures research on eco-civilisation construction in Xuzhou city. Environ. Prot. Circular Econ. 39, 84–87.
Chuai, X. W., Huang, X. J., Wang, W. J., Zhao, R. Q., Zhang, M., and Wu, C. Y. (2015). Land use, total carbon emission's change and low carbon land management in Coastal Jiangsu, China. J. Clean. Prod. 103, 77–86. doi:10.1016/j.jclepro.2014.03.046
DeFries, R. S., Houghton, R. A., Hansen, M. C., Field, C. B., Skole, D., and Townshend, J. (2002). Carbon emissions from tropical deforestation and regrowth based on satellite observations for the 1980s and 1990s. Proc. Natl. Acad. Sci. U. S. A. 99, 14256–14261. doi:10.1073/pnas.182560099
Deng, Y. (2022). Study on land use carbon emission characteristics and influencing factors in the Yangtze River Economic Belt. Changsha, China: Nanchang University.
Fischer, C., Kleinn, C., Fehrmann, L., Fuchs, H., and Panferov, O. (2011). A national level forest resource assessment for Burkina Faso - a field based forest inventory in a semiarid environment combining small sample size with large observation plots. For. Ecol. Manag. 262, 1532–1540. doi:10.1016/j.foreco.2011.07.001
Fu, J., Ding, R., Zhang, Y. L., Zhou, T., Du, Y. M., Zhu, Y. Q., et al. (2022). The spatial-temporal transition and influencing factors of green and low-carbon utilization efficiency of urban land in China under the goal of carbon neutralization. Int. J. Environ. Res. Public Health 19, 16149. doi:10.3390/ijerph192316149
Getis, A., and Ord, J. K. (1992). The analysis of spatial association by use of distance statistics. Geogr. Anal. 24, 189–206. doi:10.1111/j.1538-4632.1992.tb00261.x
Gu, H., Liu, Y., Xia, H., Tan, X., Zeng, Y., and Zhao, X. (2023). Spatiotemporal dynamic evolution and its driving mechanism of carbon emissions in hunan province in the last 20 years. Int. J. Environ. Res. public health 20, 3062. doi:10.3390/ijerph20043062
Guo, X. M., and Fang, C. L. (2021). Integrated land use change related carbon source/sink examination in Jiangsu province. Land 10, 1310. doi:10.3390/land10121310
He, W. K., Li, X. S., Yang, J., Ni, H., and Sang, X. J. (2022). How land use functions evolve in the process of rapid urbanization: evidence from Jiangsu Province, China. J. Clean. Prod. 380, 134877. doi:10.1016/j.jclepro.2022.134877
Hu, Y., Zhang, K., Hu, N., and Wu, L. (2023). A review of agricultural carbon emission measurement in China. Chin. J. Eco-Agriculture 31, 163–176. doi:10.12357/cjea.20220777
Jiang, M. H., and Hao, X. Q. (2022). Adjusting the intermediate input sources for global carbon emission reduction: an input-output optimization model. Sci. Total Environ. 835, 155582. doi:10.1016/j.scitotenv.2022.155582
Jiang, X. T., Wang, Q., and Li, R. R. (2018). Investigating factors affecting carbon emission in China and the USA: a perspective of stratified heterogeneity. J. Clean. Prod. 199, 85–92. doi:10.1016/j.jclepro.2018.07.160
Lai, L., Huang, X. J., Yang, H., Chuai, X. W., Zhang, M., Zhong, T. Y., et al. (2016). Carbon emissions from land-use change and management in China between 1990 and 2010. Sci. Adv. 2, e1601063. doi:10.1126/sciadv.1601063
Leao, E. B. D., do Nascimento, L. F. M., de Andrade, J. C. S., and de Oliveira, J. A. P. (2020). Carbon accounting approaches and reporting gaps in urban emissions: an analysis of the Greenhouse Gas inventories and climate action plans in Brazilian cities. J. Clean. Prod. 245, 118930. doi:10.1016/j.jclepro.2019.118930
Li, Y., Shen, Y., and Wang, S. (2022). Temporal and spatial characteristics and effects of terrestrial carbon emissions based on land use change in Anhui Province. J. soil water conservation 36, 182–188. doi:10.13870/j.cnki.stbcxb.2022.01.024
Meehl, G. A., Teng, H. Y., and Arblaster, J. M. (2014). Climate model simulations of the observed early-2000s hiatus of global warming. Nat. Clim. Change 4, 898–902. doi:10.1038/nclimate2357
Meng, Q. X., Zheng, Y. N., Liu, Q., Li, B. L., and Wei, H. J. (2023). Analysis of spatiotemporal variation and influencing factors of land-use carbon emissions in nine provinces of the yellow River Basin based on the LMDI model. Land 12, 437. doi:10.3390/land12020437
Messner, S. F., Anselin, L., Baller, R. D., Hawkins, D. F., Deane, G., and Tolnay, S. E. (1999). The spatial patterning of county homicide rates: an application of exploratory spatial data analysis. J. Quantitative Criminol. 15, 423–450. doi:10.1023/a:1007544208712
Nicholls, Z. R. J., Gieseke, R., Lewis, J., Nauels, A., and Meinshausen, M. (2020). Implications of non-linearities between cumulative CO2emissions and CO2-induced warming for assessing the remaining carbon budget. Environ. Res. Lett. 15, 074017. doi:10.1088/1748-9326/ab83af
Pechanec, V., Purkyt, J., Benc, A., Nwaogu, C., Sterbová, L., and Cudlín, P. (2018). Modelling of the carbon sequestration and its prediction under climate change. Ecol. Inf. 47, 50–54. doi:10.1016/j.ecoinf.2017.08.006
Pei, J., Niu, Z., Wang, L., Song, X. P., Huang, N., Geng, J., et al. (2018). Spatial-temporal dynamics of carbon emissions and carbon sinks in economically developed areas of China: a case study of Guangdong Province. Sci. Rep. 8, 13383. doi:10.1038/s41598-018-31733-7
Rehman, A., Ma, H. Y., and Ozturk, I. (2021). Do industrialization, energy importations, and economic progress influence carbon emission in Pakistan. Environ. Sci. Pollut. Res. 28, 45840–45852. doi:10.1007/s11356-021-13916-4
Rong, T. Q., Zhang, P. Y., Zhu, H. R., Jiang, L., Li, Y. Y., and Liu, Z. Y. (2022). Spatial correlation evolution and prediction scenario of land use carbon emissions in China. Ecol. Inf. 71, 101802. doi:10.1016/j.ecoinf.2022.101802
Shi, H., Mu, X. m., Zhang, Y., and L, M. (2012). Effects of different land use patterns on carbon emission in Guangyuan City of Sichuan Province. Bull. Soil Water Conservation 32, 101–106. doi:10.13961/j.cnki.stbctb.2012.03.020
Stuiver, M. (1978). Atmospheric Carbon Dioxide and Carbon Reservoir Changes: reduction in terrestrial carbon reservoirs since 1850 has resulted in atmospheric carbon dioxide increases. Science 199, 253–258. doi:10.1126/science.199.4326.253
Sun, H., Liang, H., Chang, X., Cui, Q., and Tao, Y. (2015). Land use carbon emissions and their spatial correlation in China. Econ. Geogr. 35, 154–162. doi:10.15957/j.cnki.jjdl.2015.03.023
Sun, L. C., Qin, L., Taghizadeh-Hesary, F., Zhang, J. J., Mohsin, M., and Chaudhry, I. S. (2020). Analyzing carbon emission transfer network structure among provinces in China: new evidence from social network analysis. Environ. Sci. Pollut. Res. 27, 23281–23300. doi:10.1007/s11356-020-08911-0
Tian, Y. Y., and Zhou, W. Q. (2019). How do CO2 emissions and efficiencies vary in Chinese cities? Spatial variation and driving factors in 2007. Sci. Total Environ. 675, 439–452. doi:10.1016/j.scitotenv.2019.04.239
Waheed, R., Sarwar, S., and Wei, C. (2019). The survey of economic growth, energy consumption and carbon emission. Energy Rep. 5, 1103–1115. doi:10.1016/j.egyr.2019.07.006
Wang, J. F., Li, X. H., Christakos, G., Liao, Y. L., Zhang, T., Gu, X., et al. (2010). Geographical detectors-based health risk assessment and its application in the neural tube defects study of the heshun region, China. Int. J. Geogr. Inf. Sci. 24, 107–127. doi:10.1080/13658810802443457
Wang, S. J., Fang, C. L., Guan, X. L., Pang, B., and Ma, H. T. (2014). Urbanisation, energy consumption, and carbon dioxide emissions in China: a panel data analysis of China's provinces. Appl. Energy 136, 738–749. doi:10.1016/j.apenergy.2014.09.059
Wang, S. J., Huang, Y. Y., and Zhou, Y. Q. (2019). Spatial spillover effect and driving forces of carbon emission intensity at the city level in China. J. Geogr. Sci. 29, 231–252. doi:10.1007/s11442-019-1594-1
Wang, W., Samat, A., Abuduwaili, J., and Ge, Y. (2020). Spatio-temporal variations of satellite-based PM2. 5 concentrations and its determinants in Xinjiang, northwest of China. Int. J. Environ. Res. Public Health 17, 2157. doi:10.3390/ijerph17062157
Wang, Y. Y., and He, X. B. (2019). Spatial economic dependency in the Environmental Kuznets Curve of carbon dioxide: the case of China. J. Clean. Prod. 218, 498–510. doi:10.1016/j.jclepro.2019.01.318
Wu, M. S., Ran, Y. H., Jansson, P. E., Chen, P., Tan, X., and Zhang, W. X. (2019). Global parameters sensitivity analysis of modeling water, energy and carbon exchange of an arid agricultural ecosystem. Agric. For. Meteorology 271, 295–306. doi:10.1016/j.agrformet.2019.03.007
Wu, S., Hu, S. G., and Frazier, A. E. (2021). Spatiotemporal variation and driving factors of carbon emissions in three industrial land spaces in China from 1997 to 2016. Technol. Forecast. Soc. Change 169, 120837. doi:10.1016/j.techfore.2021.120837
Wu, Y. Z., Shen, J. H., Zhang, X. L., Skitmore, M., and Lu, W. S. (2016). The impact of urbanization on carbon emissions in developing countries: a Chinese study based on the U-Kaya method. J. Clean. Prod. 135, 589–603. doi:10.1016/j.jclepro.2016.06.121
Xu, Q., Dong, Y. X., Yang, R., Zhang, H. O., Wang, C. J., and Du, Z. W. (2019). Temporal and spatial differences in carbon emissions in the Pearl River Delta based on multi-resolution emission inventory modeling. J. Clean. Prod. 214, 615–622. doi:10.1016/j.jclepro.2018.12.280
Xu, Y., Guo, N., Ru, K., and Fan, S. (2022). Spatial zoning characteristics and optimization strategies of Fujian Province from the perspective of carbon neutrality. J. Appl. Ecol. 33, 500–508. doi:10.13287/j.1001-9332.202201.016
Yang, J. T., Song, C., Yang, Y., Xu, C. D., Guo, F., and Xie, L. (2019). New method for landslide susceptibility mapping supported by spatial logistic regression and GeoDetector: a case study of Duwen Highway Basin, Sichuan Province, China. Geomorphology 324, 62–71. doi:10.1016/j.geomorph.2018.09.019
Yang, X., and Liu, X. Z. (2023). Path analysis and mediating effects of influencing factors of land use carbon emissions in Chang-Zhu-Tan urban agglomeration. Technol. Forecast. Soc. Change 188, 122268. doi:10.1016/j.techfore.2022.122268
Ye, L., Wang, G. L., Zhang, Y. X., Sun, S. N., Qin, Y. P., Sun, L. Y., et al. (2023). Spatiotemporal evolution and driving forcesof the carbon emissions of the Yangtze River DeltaUrban agglomeration. Pol. J. Environ. Stud. 32, 2417–2428. doi:10.15244/pjoes/157379
Yuan, Y., Chuai, X. W., Xiang, C. Z., and Gao, R. Y. (2022). Carbon emissions from land use in Jiangsu, China, and analysis of the regional interactions. Environ. Sci. Pollut. Res. 29, 44523–44539. doi:10.1007/s11356-022-19007-2
Zhang, C. Y., Zhao, L., Zhang, H. T., Chen, M. N., Fang, R. Y., Yao, Y., et al. (2022). Spatial-temporal characteristics of carbon emissions from land use change in Yellow River Delta region, China. Ecol. Indic. 136, 108623. doi:10.1016/j.ecolind.2022.108623
Zhang, D. J., Ge, W. Y., and Zhang, Y. (2020). Evaluating the vegetation restoration sustainability of ecological projects: a case study of Wuqi County in China. J. Clean. Prod. 264, 121751. doi:10.1016/j.jclepro.2020.121751
Zhang, L., Jin, G., Wan, Q., Liu, Y. F., and Wei, X. J. (2018). Measurement of ecological land use/cover change and its varying spatiotemporal driving forces by statistical and survival analysis: a case study of yingkou city, China. Sustainability 10, 4567. doi:10.3390/su10124567
Zhang, P. Y., He, J. J., Hong, X., Zhang, W., Qin, C. Z., Pang, B., et al. (2017a). Regional-level carbon emissions modelling and scenario analysis: a STIRPAT case study in henan province, China. Sustainability 9, 2342. doi:10.3390/su9122342
Zhang, Q., Yang, J., Sun, Z. X., and Wu, F. (2017b). Analyzing the impact factors of energy-related CO2 emissions in China: what can spatial panel regressions tell us? J. Clean. Prod. 161, 1085–1093. doi:10.1016/j.jclepro.2017.05.071
Zhang, X. P., and Cheng, X. M. (2009). Energy consumption, carbon emissions, and economic growth in China. Ecol. Econ. 68, 2706–2712. doi:10.1016/j.ecolecon.2009.05.011
Zhao, R. Q., Liu, Y., Tian, M. M., Ding, M. L., Cao, L. H., Zhang, Z. P., et al. (2018). Impacts of water and land resources exploitation on agricultural carbon emissions: the water-land-energy-carbon nexus. Land Use Policy 72, 480–492. doi:10.1016/j.landusepol.2017.12.029
Zheng, J. L., Mi, Z. F., Coffman, D., Milcheva, S., Shan, Y. L., Guan, D. B., et al. (2019). Regional development and carbon emissions in China. Energy Econ. 81, 25–36. doi:10.1016/j.eneco.2019.03.003
Zhou, J. (2011). Study on the cointegration and causal relationship between land use change and carbon balance in changsha city (Changsha, China: Hunan Normal University).
Keywords: carbon emissions, spatio-temporal evolution characteristics, influencing factors, hot spot analysis, geographic detector
Citation: Cai Y and Li K (2024) Spatiotemporal dynamic evolution and influencing factors of land use carbon emissions: evidence from Jiangsu Province, China. Front. Environ. Sci. 12:1368205. doi: 10.3389/fenvs.2024.1368205
Received: 11 January 2024; Accepted: 15 April 2024;
Published: 16 May 2024.
Edited by:
Chenxi Li, Xi’an University of Architecture and Technology, ChinaReviewed by:
Yang Wang, Yunnan Normal University, ChinaJing Liu, China University of Mining and Technology, China
Copyright © 2024 Cai and Li. This is an open-access article distributed under the terms of the Creative Commons Attribution License (CC BY). The use, distribution or reproduction in other forums is permitted, provided the original author(s) and the copyright owner(s) are credited and that the original publication in this journal is cited, in accordance with accepted academic practice. No use, distribution or reproduction is permitted which does not comply with these terms.
*Correspondence: Kongqing Li, bGlrcUBuamF1LmVkdS5jbg==