 Tao Shi
 Lei Liu2
- 1School of Mathematics and Computer Science, Tongling University, Tongling, Anhui, China
- 2Wuhu Meteorological Bureau, Wuhu, Anhui, China
- 3Anhui Engineering Research Center of Intelligent Manufacturing of Copper-based Materials, Tongling, Anhui, China
Under the background of global warming and accelerating urbanization, the interaction between heat waves (HWs) and canopy urban heat island (CUHI) has become one of the focuses in the field of global climate change research. This paper comprehensively reviewed and summarized the research process on the synergies of HWs and CUHI and their influencing mechanism. The coupling effect between HWs and CUHI remains debated, which may be related to the use of different standards to define heat wave events. The spatiotemporal differences in the synergies between HWs and CUHI was also influenced by climate background and local circulation. For instance, scholars have reached different conclusions regarding the stronger synergistic effect between daytime and nighttime in cities with different climate backgrounds. In addition, the modulation of urban morphological structure to the synergies between HWs and CUHI cannot be ignored. In the future, it is necessary to adopt different definitions of HWs to systematically study the formation mechanism of urban excess warming from different climatic backgrounds, local circulation conditions, and urban morphologies.
1 Introduction
HWs sually refer to the situation that the daily maximum temperature reaches or exceeds a certain threshold for several days (Tan et al., 2010; Perkins, 2015; Sun et al., 2017; Su and Dong, 2019; Zong et al., 2021). HWs are one of the important causes of diseases such as cardiovascular, respiratory, and digestive systems in the human body, and in extreme cases, they can directly lead to death (Fouillet et al., 2006; Zhang et al., 2018; He et al., 2021). Even in the period of global warming hiatus, the frequency and duration of HWs show an increasing trend, which poses a huge challenge to the health of people and the stable development of society (IPCC, 2021). In addition, urbanization has become an important driving force of regional and global warming (Seto et al., 2012; Shi et al., 2021). Canopy urban heat island is a phenomenon that the canopy urban temperature is higher than that in suburban and rural areas due to the change in the nature of the urban underlying surface and anthropogenic heat emission (Li et al., 2015; Shi et al., 2015; Yang et al., 2023). CUHI effect has become one of the most significant characteristics of urban climate, which has an important impact on human health and socio-economic development (Gershunov et al., 2009; Ren et al., 2011; Luo and Lau, 2019; Yang et al., 2019).
The interaction between climate change and urbanization and its possible synergistic effects have become the focus of global climate change research (Seto et al., 2012). Urbanization has an impact on the indicators of HWs (Zong et al., 2021), and changes the distribution and intensity of high temperature fields in summer (Founda et al., 2015; Xue et al., 2023). The HWs and CUHI may also have a superimposed effect, even more than the sum of the effects of the two on the urban area (Basara et al., 2010). The frequency of HWs in urban stations increases significantly, the increasing degree of the number of HWs and the duration of HWs is also larger than that in non-urban stations (Mishra et al., 2015; Khan et al., 2020; Mughal et al., 2020; Zinzi et al., 2020). However, some scholars have observed completely different results (Basara et al., 2008; Basara et al., 2010; Ramamurthy and Bou-Zeid, 2017; Chew et al., 2020). Scholar have found that under the HWs condition, the CUHI intensity (CUHII) at nighttime in Melbourne and Adelaide is stronger than that at daytime, while the CUHII at nighttime in Perth is weaker than that at daytime (Rogers et al., 2019). Currently, there is no consensus on whether CUHI will intensify or weaken during heat waves periods.
With the acceleration of urbanization and aggregation of population, the CUHI effect is significant (Liu et al., 2007; Zheng et al., 2018; Yang et al., 2020), which intensifies the occurrence of regional excess warming (Li et al., 2015; Yoon et al., 2018; Zong et al., 2021) and seriously affects the health of residents (Gao et al., 2015; Jiang et al., 2019). The research on HWs and CUHI has been carried out for decades. Especially in recent years, the research results are very rich. This paper comprehensively reviewed the progress on the synergies of HWs and CUHI and their driving factors, in order to provide important theoretical basis and technical support for the construction of high temperature monitoring, prediction, and early warning systems, the improvement of living environment and urban planning management.
2 Difference in the research on the synergies between HWs and CUHI
Over the past few decades, major cities around the world have witnessed rapid expansion of construction land. The CUHI effect caused by urbanization is one of the typical urban climate characteristics (Ren et al., 2015; Yang et al., 2019). In parallel, climate change has led to a significant increase in the frequency of high temperature and heat wave events in most parts of the world (Su and Dong, 2019; Yang et al., 2023). The interaction between CUHI and regional extreme high temperatures cannot be overlooked.
Many scholars have carried out research on the synergies of HWs and CUHI. Some studies have demonstrated a synergistic effect between HWs and CUHI, further compounding the heat risk in urban (Jiang et al., 2019; Yang et al., 2023). Compared with the non-heat waves periods, the maximum CUHII of Beijing at nighttime during the heat waves periods increased by 1.26°C (Jiang et al., 2019), the average CUHII in Shanghai during the heat waves periods increased by 0.9°C (Yang et al., 2023), and the maximum CUHII in Seoul during the heat waves periods increased by 4.5°C (Ngarambe et al., 2020). During the heat waves periods, the average CUHII of 50 cities in the United States was 0.4°C–0.6°C higher than that during the non-heat waves periods (Zhao et al., 2018). During the heat waves periods in the northeast of the United States in 2016, the CUHII of New York City, Washington, and Baltimore was amplified by 1°C–2°C (Ramamurthy and Bou-Zeid, 2017). During the heat waves periods from 2013 to 2018, the CUHII of Shanghai increased by about 0.8°C (Ao et al., 2019). Also during the heat waves periods from 2013 to 2018, Jiang et al. (2019) found that the CUHII of Shanghai increased by 1.0°C, which was close to the research results of Ao et al. (2019), and 1.2°C and 0.9°C were observed in Beijing and Guangzhou. Zong et al. (2021) concluded that the increase of CUHII usually reached a minimum at 0900 and 1800 LST, and the peak often occurred at noon or at midnight (as shown in Figure 1).
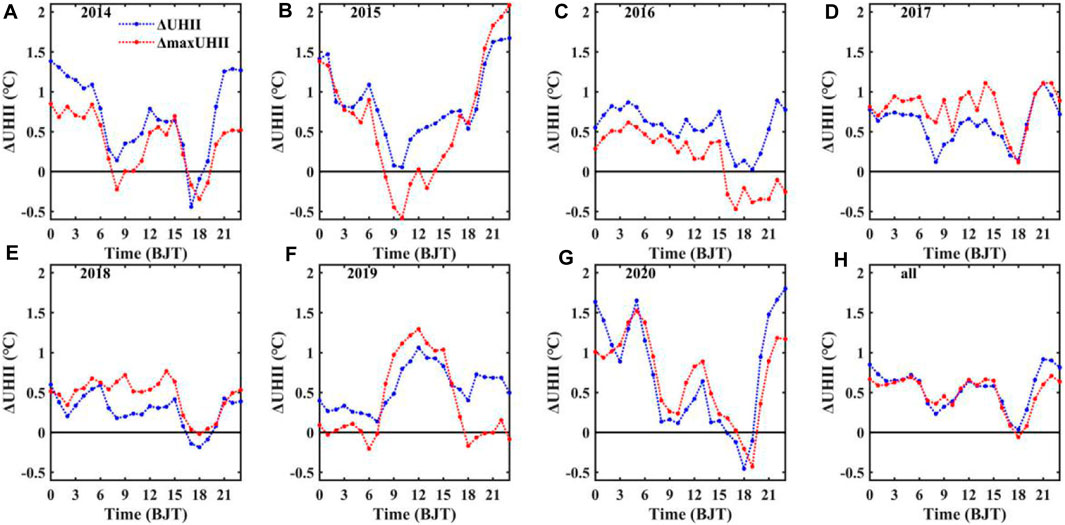
Figure 1. Diurnal variation of UHII between HW and NHW periods during summertime (June–August) 2014–2020 (A–G) and averaged value (H). HW and NHW periods are indicated by red and blue, respectively. Lines denote average UHII values and shaded areas present the standard deviation of the average UHII values according to all urban reference stations (Zong et al., 2021).
Some studies showed that the synergies between HWs and CUHI are not obvious, and even the CUHII may decrease during heat waves periods (Richard et al., 2021). Rogers et al. (2019) found in their study on CUHI during heat waves periods and non-heat waves periods in Australian that the CUHI of nighttime in Perth weakened during heat waves periods. Compared with the non-heat waves periods, there was no CUHI enhancement in Philadelphia during the heat waves periods (Ramamurthy and Bou-Zeid, 2017). Scott et al. (2018) took 15 HWs in Baltimore from 2000 to 2015 as a composite event and found that there were no synergies between HWs and CUHI. After expanding the research scope to 54 cities, even the average CUHII tended to decrease during the heat waves periods. Richard et al. (2021) discovered that the maximum CUHII in Dijon (France) frequently occurs prior to or within the first few days of HWs, and subsequently diminishes during heat waves periods (As shown in Figure 2). Using ground observation data, Chew et al. (2020) discovered that, in contrast to non-heatwave periods, the CUHII does not intensify during heat waves periods. Specifically, the CUHII remains approximately 2.5°C during both heat waves periods and non-heat waves periods, and the results from the WRF simulation are consistent with the observation results. The above findings suggest that there are significant differences in the coupling effect between CUHI and HWs across different regions, necessitating in-depth research that takes into account specific research methods, the geographical location of the research subjects, and other influencing factors.
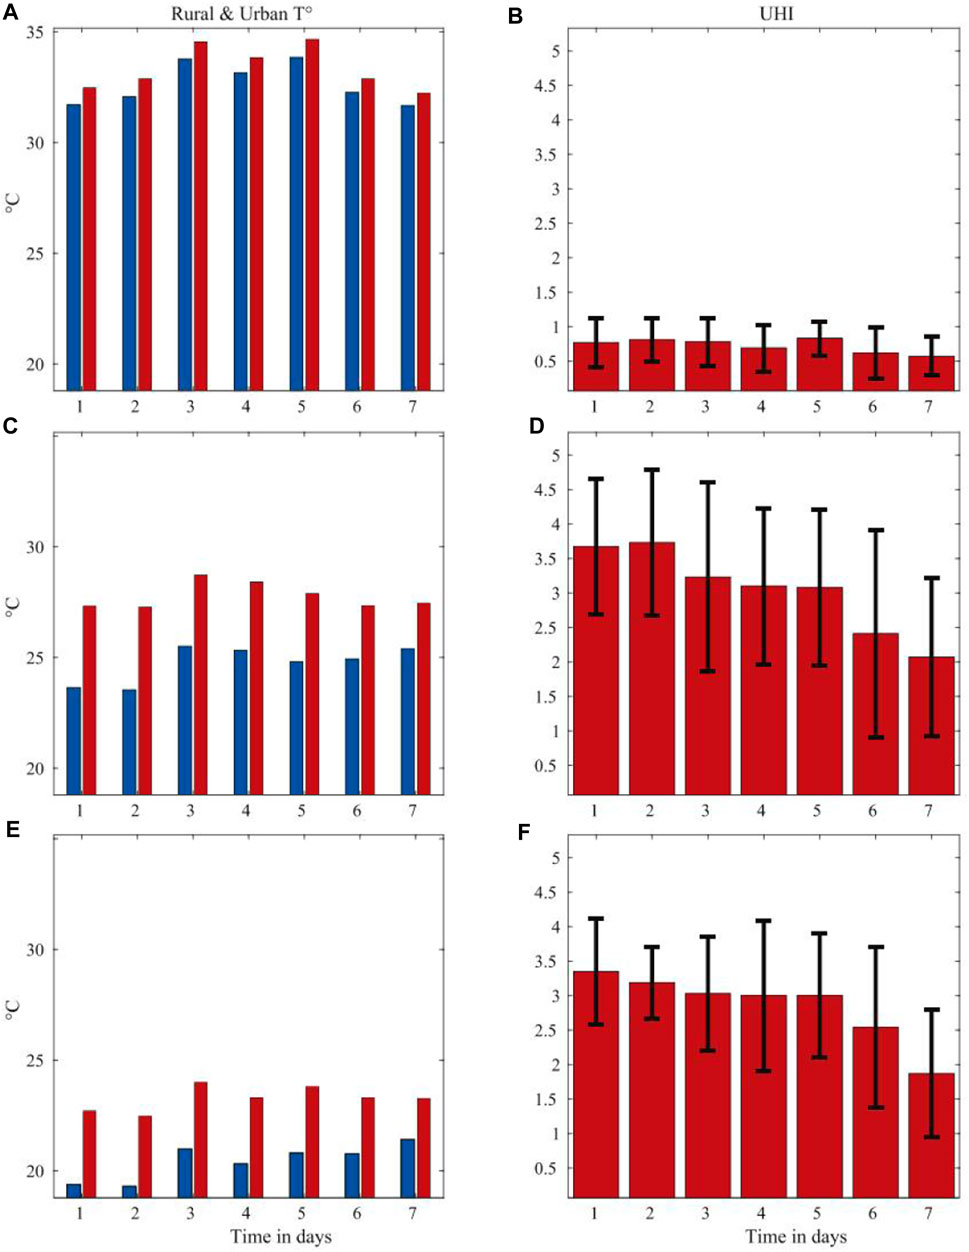
Figure 2. Mean rural temperature, urban temperature, and UHI intensity for the first 7 days during long HS&HW. (A,B): Afternoon (1300–1700 UTC). (C,D) Evening (1900–2300 UTC). (E,F) Night (0000–0400 UTC). (A), (C), and (E): T◦C (rural in blue, urban in red). (B), (D), and (F) UHI intensity in K (mean±SD indicated by black error bars) (Rogers et al., 2019).
3 The influence of definition of HWs on the synergies of HWs and CUHI
HWs usually refer to sustained high-temperature weather processes. Most studies only utilize a single variable to identify heat waves, such as the highest daily temperature occurring during the afternoon or the lowest daily temperature occurring in the early morning hours (Bador et al., 2017; You et al., 2017; Oswald, 2018; Ren et al., 2020). Due to the diverse geographical environments, there are differences in the definition of HWs among different countries and regions. For instance, the World Meteorological Organization (WMO) recommends a heat wave event with a daily maximum temperature exceeding 32°C and lasting for more than 3 days. When the daytime heat wave index exceeds 40.5°C for three consecutive hours or is expected to exceed 46.5°C at any given time, the National Oceanic and Atmospheric Administration (NOAA) of the United States issues a high temperature warning. The Royal Netherlands Meteorological Institute (KNMI) defines a heatwave event as a daily maximum temperature exceeding 25°C and lasting for more than 5 days, with at least 3 days of maximum temperature exceeding 30°C. The heatwave standard set by the China Meteorological Administration (CMA) is that the maximum temperature exceeds 35°C for three consecutive days. Fenner et al. (2019a) noted that if hot weather episodes are defined as the ten percent hottest days or nights during May–September, and identified based on daytime conditions or nighttime conditions at inner-city sites, the nighttime CUHI is exacerbated. However, if hot weather episodes are identified based on nighttime conditions at rural sites, the night-time CUHII is reduced. Fenner et al. (2019b) provided an overview of all identified HWs by any of the ten definitions, illustrating the number of definitions that identify a certain calendar day as a HW day. As shown in Figure 3, different methods to identify and define the HWs could affect the occurrence time, duration, and frequency of HWs to a certain extent.
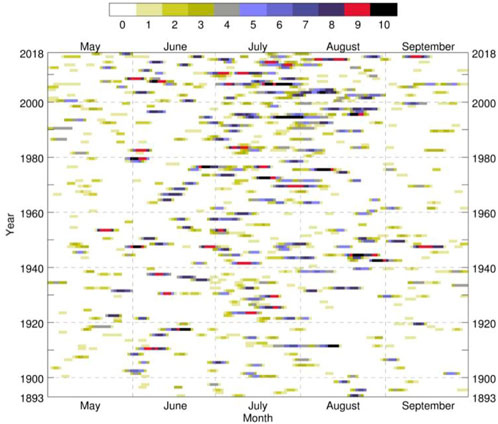
Figure 3. The occurrences of HWs at site Potsdam from 1893 to 2017 during the warm season (May–September) for ten different HW definitions. Each colour corresponds to the number of definitions agreeing for each day to be a HWs day and not to an individual HWs definition.
Some scholars have attempted to use bivariate identification of heat waves, such as a method that considers both the maximum and minimum daily temperatures to be above a threshold for multiple consecutive days (Kuglitsch et al., 2010; Chen and Li, 2017; Freychet et al., 2017). Additionally, there are studies that require the occurrence of extreme daytime high temperatures and extreme nighttime high temperatures to follow a specific order (Cowan et al., 2014; Oswald and Rood, 2014). As exemplified by Cowan et al. (2014), who specified that extreme daytime high temperatures must persist continuously for more than 3 days, with extreme nighttime high temperatures occurring on the second and third days. An and Zuo (2021) conducted a study on the HWs observed by meteorological stations in China. Taking Beijing as an example, they found that some HWs only involve extreme daytime high temperatures (Figure 4A), while others are limited to extreme nighttime high temperatures (Figure 4B). Additionally, there are instances where both daytime and nighttime high temperatures are part of the HWs. Furthermore, there is a specific temporal sequence in the occurrence of daytime and nighttime high temperatures (Figures 4C, D). Currently, there is no unified standard for the definition of heat waves, which can introduce some uncertainty in the attempt to gain a deeper understanding of the interaction between HWs and CUHI.
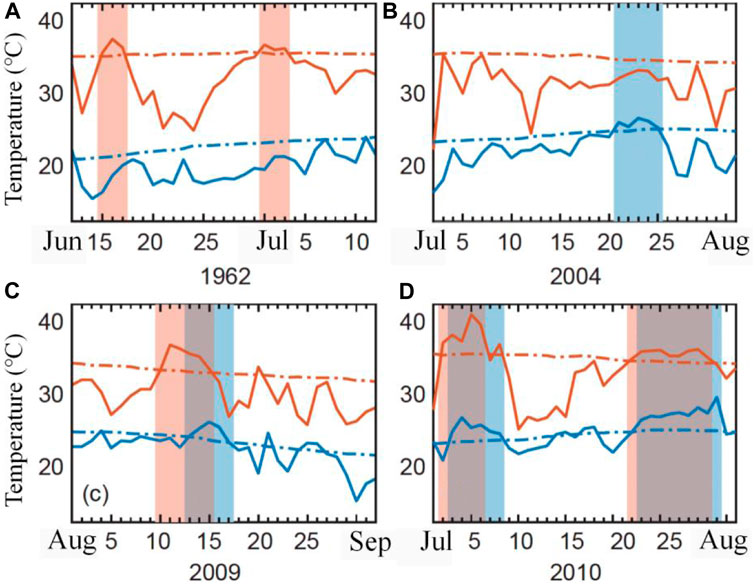
Figure 4. Observation cases of HWs in the Beijing Area. (A–D) are different heat waves periodss. The red solid line and dotted line are the time series of the daily maximum temperature and its 90th quantile, while the blue solid line and dotted line are the time series of the daily minimum temperature and its 90th quantile, respectively. The heat wave process is indicated by shadows (An and Zuo, 2021).
4 The influence of climate background and local circulation on the synergies between HWs and CUHI
In addition to the definition of HWs, the difference in the synergies between HWs and CUHI is also related to the climate background and local circulation (meteorological elements in the boundary layer such as solar radiation, wind speed, wind direction, humidity). HWs are usually caused by synoptic scale high-pressure systems (Matsumura et al., 2015), which severely inhibit the formation of convective clouds (He et al., 2015). Therefore, the synoptic background during heat waves periods is usually breezy and cloudless. Although the synergies of HWs and CUHI has been confirmed in different regions, different results have also been observed in cities under different climate backgrounds (Xie and Zhou, 2023). Liao et al. (2018) studied the HWs in China from 1961 to 2014 and believed that the increasing trends of HWs in urban areas are greater than those in rural areas in wet climates, suggesting a positive contribution of urbanization to HW trends. However, the urbanization contribution to HW trends is smaller and even negative in wet climates. Zhao et al. (2018) found that the synergistic effect of HWs and CUHI is more significant in temperate climate regions of the United States, but not in arid regions. Basara et al. (2010) studied the HWs in Oklahoma in 2008 and observed that the HW at nighttime was stronger than that at daytime. Jiang et al. (2019) studied the excess warming of megacities with different climate backgrounds and found that during the heat waves periods, the CUHII of Beijing (temperate semi humid monsoon climate) and Guangzhou (Marine subtropical monsoon climate) at nighttime was higher than that at daytime, while the diurnal variation of Shanghai (subtropical humid monsoon climate) heat island was completely opposite when selecting coastal stations as rural stations.
In addition to the climate background, the local circulation caused by different geographical environments has a significant impact on the temporal and spatial distribution of extreme high temperature in cities (Zhang et al., 2011; Zhou et al., 2020; Chen et al., 2022). Sea land breeze circulation is a secondary atmospheric circulation caused by uneven heating of the underlying surface, and is one of the most prominent mesoscale characteristics in coastal areas (Wagner et al., 2012; He et al., 2020). Yang et al. (2023) selected a day with sea–land breeze (24 September 2013) and a day without sea–land breeze (25 September 2013) and analyzed the diurnal variation of the wind vectors and the CUHII on these 2 days. The daytime CUHII was lower at the coastal sites on days with a sea–land breeze than on days without a sea–land breeze as a result of the influence of the transport of cold and wet air from the sea. The daytime CUHII at downwind urban sites was affected by heat transport and was stronger on days with a sea-land breeze (As shown in Figure 5).
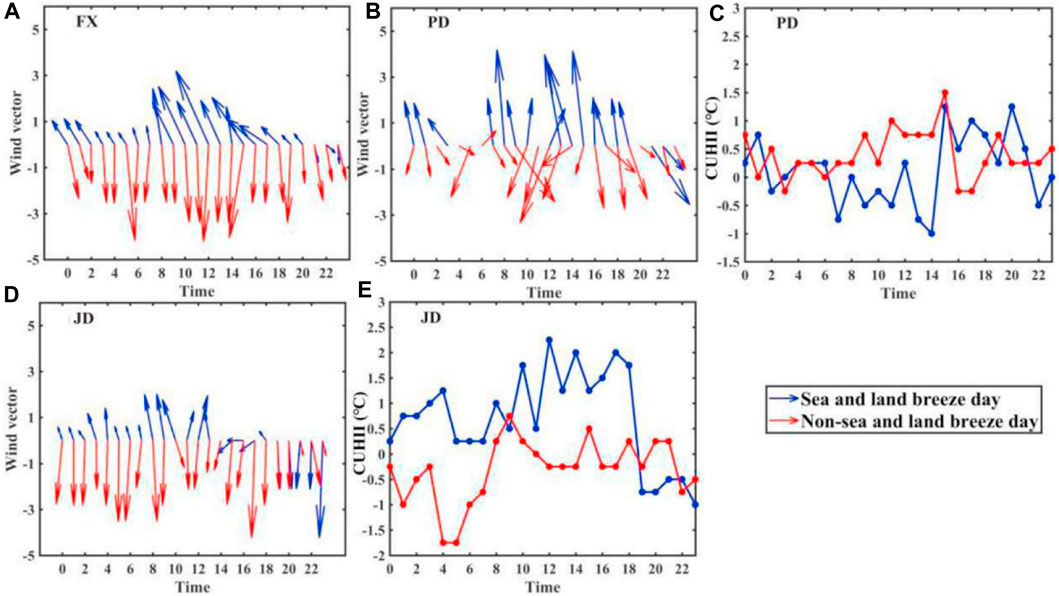
Figure 5. Diurnal variation of the (A,B and D) wind direction at sites FX, PD and JD and (C,E) the CUHII at sites PD and JD on a day with a sea–land breeze (24 September 2013) and a day without a sea–land breeze (25 September 2013) (Yang et al., 2023).
The results confirm that sea breezes reduce the CUHII in coastal site of Shanghai. The formation principle of mountain-valley wind is similar to that of land and sea wind, which is caused by temperature and pressure (Xue et al., 2023). Due to the thermal difference between the valley and its surrounding air, the wind blows from the valley to the hillside at daytime and from the hillside to the valley at nighttime. Taking Lanzhou as an example, during HW periods, the WS increased at almost all moments (Figure 6A). The weather stations were all located in the southern part of the main urban area, so the valley wind circulation of these stations in summer was mainly regulated by the southern mountains. It can be seen from Figure 6B that the local wind circulation had obvious diurnal variations, with negative anomalies during the day (northeast wind) in the u and v directions, and positive anomalies (southwest wind) at night. The anomaly amplitudes of the local wind components in the u and v directions during HW periods were larger than those in NHW periods (Figure 6B), indicating that the local wind had a greater influence in HW periods. During the heat wave, the mountain-valley wind circulation increases the wind speed, which is not conducive to the occurrence of HWs and strong CUHII (Ngarambe et al., 2020; Zong et al., 2021). But it also enhances the surface heat flux and offsets the increased advection cooling (Li and Bou-Zeid, 2013). In addition, the foehn wind is a local airflow movement caused by the mountains, that is, a local wind in which the airflow over the mountains sinks on the leeward slope and becomes dry and hot (McGowan, 1997). Wang et al. (2012) used the observation of multi-element auto weather stations (AWSs) to analyze the foehn effect that occurred on the east slope of Taihang Mountains. The results showed that there are two foehn centers in the northern and southern parts of Taihang Mountains, causing the rapid rising temperature in Hebei Plain. On the whole, the formation mechanism of urban excess warming under different climate backgrounds and local circulation still lacks complete understanding.
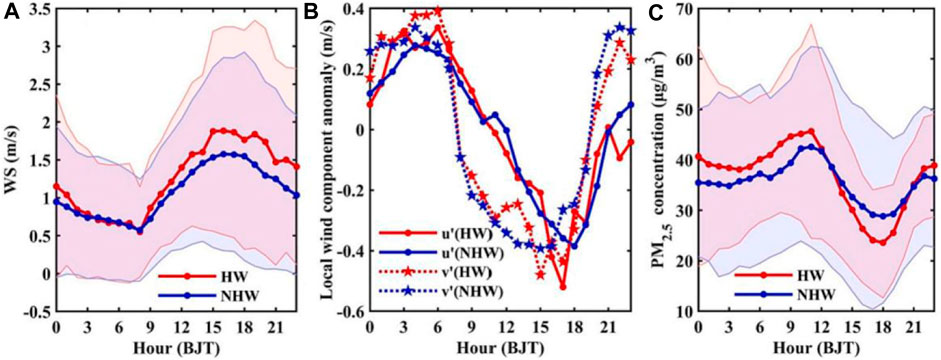
Figure 6. Diurnal variation of WS (A) and the local wind component anomaly (B) in the summertime (July–August) of 2013–2018. Diurnal variation of PM2.5 concentration (C) in the summertime (July–August) of 2014–2018. HW and NHW periods are indicated by red and blue, respectively. Shaded areas denote the standard deviation (Xue et al., 2023).
5 The influence of urban morphologies on the synergies between HWs and CUHI
At present, a broad consensus has been reached that the spatial heterogeneity of urban areas (such as land cover, roughness of urban underlying surface, height of buildings, and sky view factor) can directly lead to the spatial non-uniform distribution of near surface air temperature (Fenner et al., 2017). Compared with rural areas, the urban land surface albedo is lower, which can amplify the CUHI by absorbing more solar radiation (Oke, 1982), and the reduction of evaporation in urban areas further aggravates the CUHI effect (Taha, 1997; Zhao et al., 2018). In addition, urban buildings increase surface roughness, and reduce wind speed, and urban heat is not easy to dissipate (Fujibe, 2003). In the traditional researches on the CUHI effect, the study areas were simply divided into urban and suburban types, that is, the CUHII was calculated by the average temperature difference between urban stations and reference stations. However, this single division calculation ignored the differences of meteorological elements within the city, thus affecting the accurate assessment of CUHI (Ren and Ren, 2011; Yang et al., 2013; Li et al., 2015; Shi et al., 2022).
Stewart&oke (2012) proposed a set of local climate zones (LCZs), which divides the urban underlying surface into 17 basic types according to the characteristics of the urban surface and differences in human activities (Figure 7). Using the temperature calculation of different types of LCZs can more accurately carry out the comparative study of CUHI at regional and global scales. A few scholars used LCZs to study urban excess warming and promoted the quantitative study of the synergies of HWs and CUHI from the perspective of urban morphologies (Ngarambe et al., 2020; Zheng et al., 2022; Xue et al., 2023; Yang et al., 2023). The CUHII under different LCZs was significantly different and was jointly determined by HWs, wind speed and the location of LCZs from the city center (Xue et al., 2023). For example, in LCZs with a high density of buildings that favor CUHII growth, HWs may last longer. The spatial characteristics of extreme high temperatures of different LCZs in Shanghai show that (Figure 8), the CUHII, the number and duration of HWs of high-density LCZ1 and LCZ2 are significantly higher than those of low-density LCZ4, but the average CUHII of low-density LCZ5 is similar to that of high-density LCZ1 (Yang et al., 2023). High-density buildings reduce wind speed, prolong the duration of HWs, and enhance the synergies between HWs and CUHI (Gemechu, 2022). The CUHII is also affected by anthropogenic heat flux, especially in high-density and high-rise building areas (Zhang et al., 2015). In addition, when the wind speed reaches the threshold of horizontal heat transfer (He, 2018), the CUHII of low-density LCZ5 in the downwind direction increases for urban areas with a large number of heat emissions (Yang et al., 2023). It is worth noting that few studies have focused on the thermal differences between regions located in different directions within the urban area. Therefore, it is necessary to expand the research focus from a single suburb to the interior of cities, and analyze the impact of different urban morphologies indicators on the local thermal environment, so as to carry out the research on the synergies of HWs and CUHI in megacities.
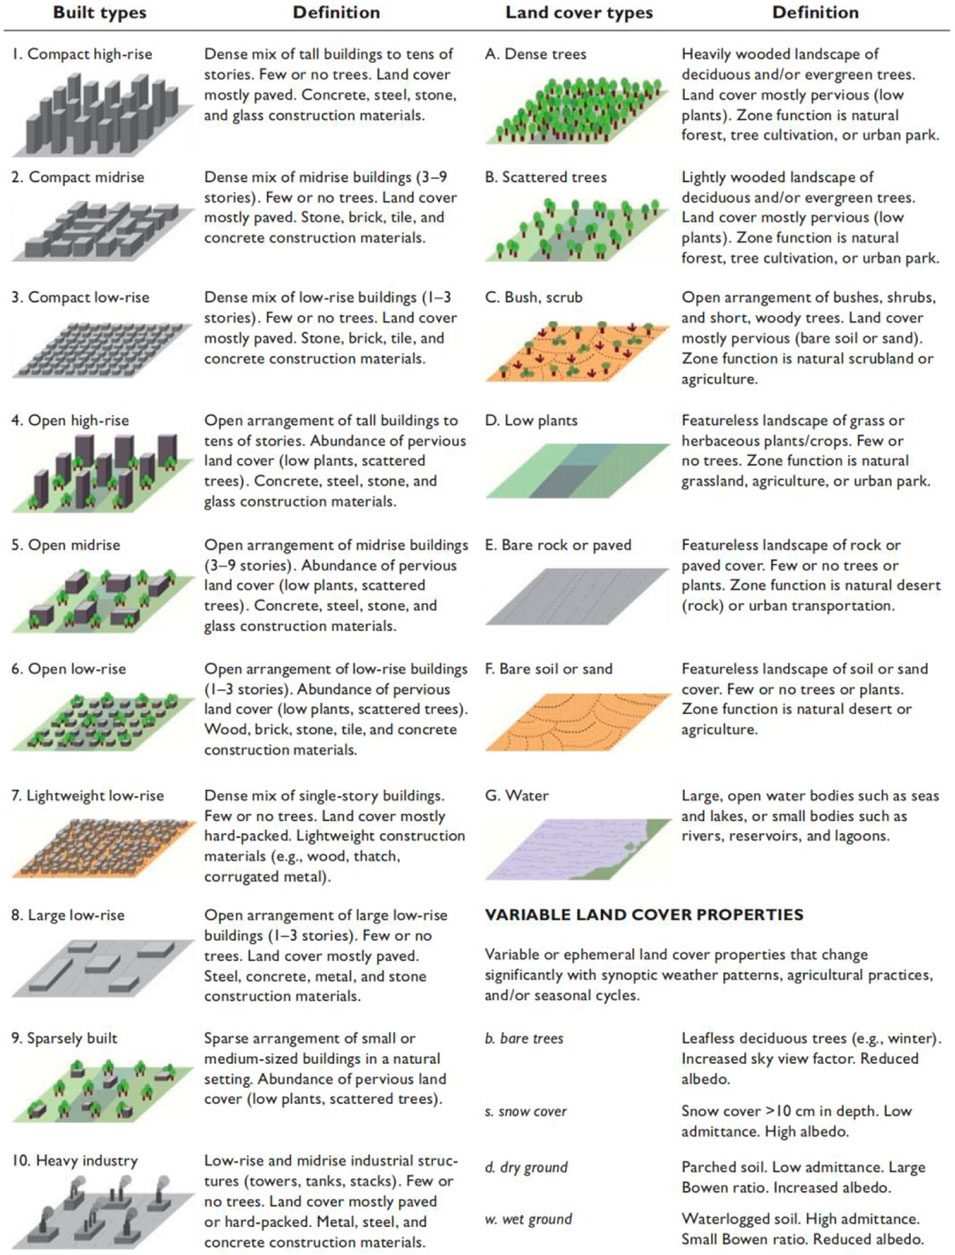
Figure 7. Schematic diagram of local climate zoning (Stewart and Oke, 2012).
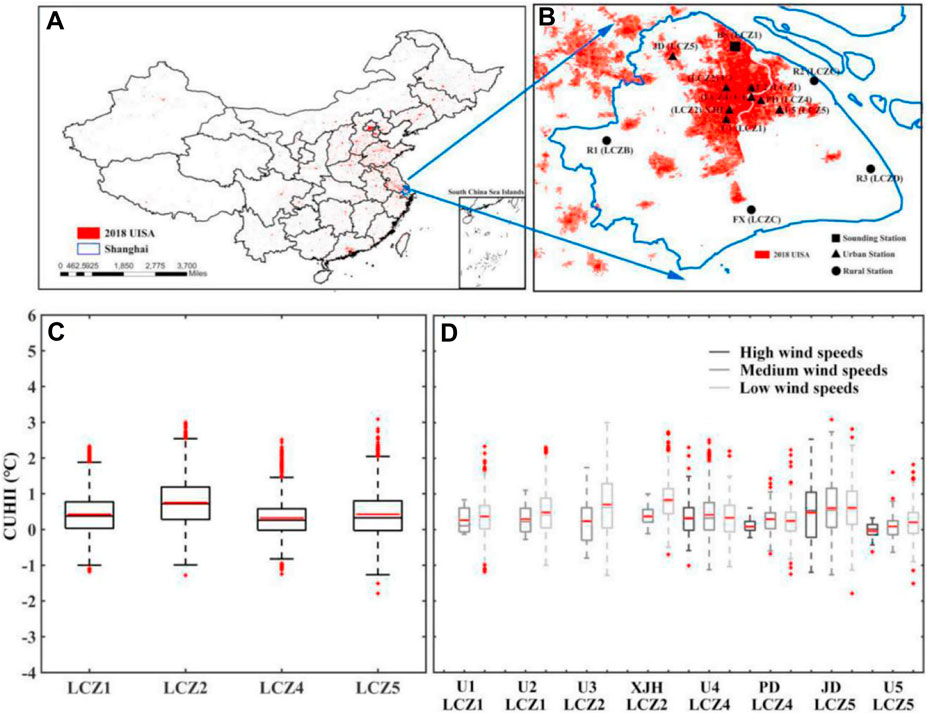
Figure 8. Overview of the study area (A) and spatial distribution of Shanghai automatic weather stations (B). Box-whisker plots for the CUHII values (C) in each LCZ and (D) at different wind speeds for each urban station during 2013–2018. The black solid lines are the maximum, upper quartile, median, lower quartile and minimum values from top to bottom, the central red solid line represents the average and the red plus symbols represent outliers (Yang et al., 2023).
6 Conclusion
This paper reviewed the research on the difference in the research on the synergies between HWs and CUHI and analysed their formation mechanism from the aspects of definition of HWs, climate backgrounds, local circulations, urban morphologies. In general, the interaction between HWs and CUHI is affected by natural factors (such as humidity, wind speed, and geographical location) and human factors (such as anthropogenic heat emissions, land use change and the definitions of HWs). Different methods to identify and define the HWs could affect the occurrence time, duration, and frequency of HWs to a certain extent. The synergies between HWs and CUHI is also related to the climate background and local circulation. The difference in urbanization degree (such as urban morphologies, urban scale, land cover, and anthropogenic heat flux) also affect the synergies between HWs and CUHI. In summary, influenced by different geographical locations, climate backgrounds, local circulations and urban morphologies, the spatiotemporal distribution of urban excess warming is uneven, and its influencing factors also show complexity, diversity, and variability.
In the context of global warming and rapid urbanization, the synergies between HWs and CUHI poses a significant challenge to human health, production safety, environmental protection, and sustainable urban development. The urgent need is to gain a more comprehensive understanding of the mechanisms and regulatory factors responsible for urban excessive warming caused by HWs and CUHI, which will enable better prediction and assessment of future extreme high temperature events. Table 1.
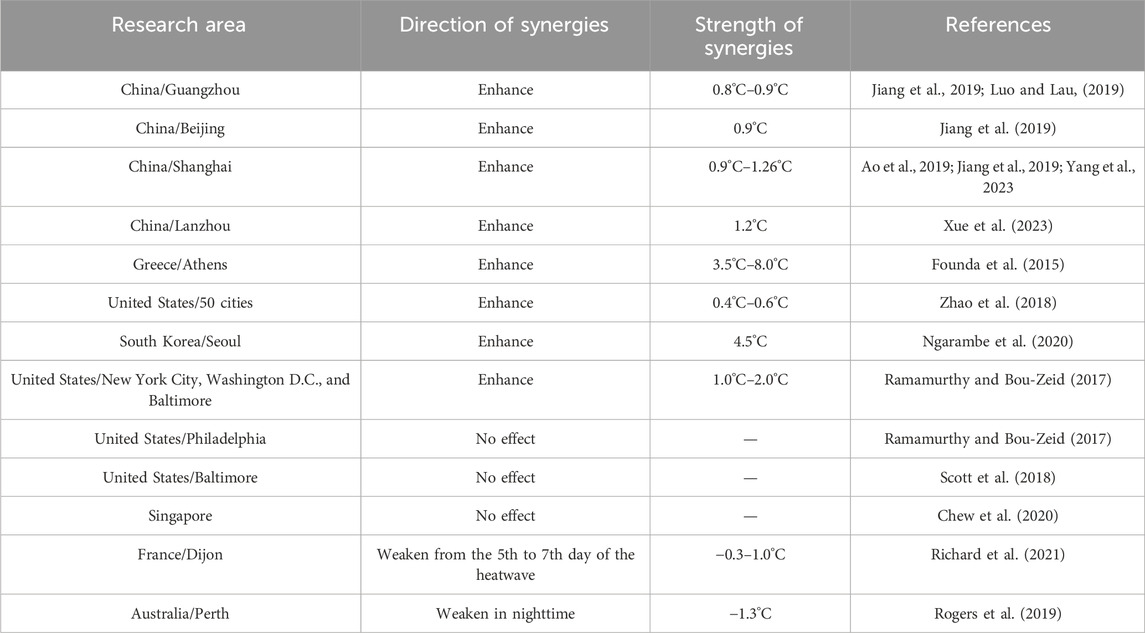
Table 1. The difference of research results on the synergies between heat wave and canopy heat island in recent years (self-drawing).
Author contributions
TS: Writing–original draft, writing–review and editing. LL: Software, methodology, writing–review and editing. XW: Data curation, writing–review and editing. PQ: Writing–review and editing, methodology, funding acquisition, formal analysis.
Funding
The author(s) declare that financial support was received for the research, authorship, and/or publication of this article. This study was supported by National Natural Science Foundation of China (42105147), the Joint Research Project for Meteorological Capacity Improvement (22NLTSQ013), and the Collaborative Innovation Fund of Education Department of Anhui Province (GXXT-2023-050). The data that support the findings of this study are openly available.
Conflict of interest
The authors declare that the research was conducted in the absence of any commercial or financial relationships that could be construed as a potential conflict of interest.
Publisher’s note
All claims expressed in this article are solely those of the authors and do not necessarily represent those of their affiliated organizations, or those of the publisher, the editors and the reviewers. Any product that may be evaluated in this article, or claim that may be made by its manufacturer, is not guaranteed or endorsed by the publisher.
References
An, N., and Zuo, Z. (2021). Changing structures of summertime heatwaves over China during 1961–2017. Scientia Sinica (Terrae), 51 (8), 1214–1226. doi:10.1360/N072020-0380
Ao, X., Wang, L., Zhi, X., Gu, W., and Yang, H. (2019). Observed synergies between urban heat islands and heat waves and their controlling factors in Shanghai, China. J. Appl. Meteorology Climatol. 58, 1955–1972. doi:10.1175/jamc-d-19-0073.1
Bador, M., Terray, L., Boé, J., Somot, S., Alias, A., Gibelin, A. L., et al. (2017). Future summer mega-heatwave and record-breaking temperatures in a warmer France climate. Environ. Res. Lett. 12, 074025. doi:10.1088/1748-9326/aa751c
Basara, J. B., Basara, H. G., Illston, B. G., and Crawford, K. C. (2010). The impact of the urban heat island during an intense heat wave in Oklahoma City. Adv. Meteorology 2010, 1–10. doi:10.1155/2010/230365
Basara, J. B., Hall, P. K., Schroeder, A. J., Illston, B. G., and Nemunaitis, K. L. (2008). Diurnal cycle of the Oklahoma city urban heat island. J. Geophys. Res. Atmos. 113. doi:10.1029/2008JD010311
Chen, S., Yang, Y., Deng, F., Zhang, Y., Liu, D., Liu, C., et al. (2022). A high-resolution monitoring approach of canopy urban heat island using a random forest model and multi-platform observations. Atmos. Meas. Tech. 15, 735–756. doi:10.5194/amt-15-735-2022
Chen, Y., and Li, Y. (2017). An inter-comparison of three heat wave types in China during 1961–2010: observed basic features and linear trends. Sci. Rep. 7 (1), 45619. doi:10.1038/srep45619
Chew, L. W., Liu, X., Li, X. X., and Norford, L. K. (2020). Interaction between heat wave and urban heat island: a case study in a tropical coastal city, Singapore. Atmos. Res. 247, 105134. doi:10.1016/j.atmosres.2020.105134
Cowan, T., Purich, A., Perkins, S., Pezza, A., Boschat, G., and Sadler, K. (2014). More frequent, longer, and hotter heat waves for Australia in the twenty-first century. J. Clim. 27 (15), 5851–5871. doi:10.1175/JCLI-D-14-00092.1
Fenner, D., Holtmann, A., Krug, A., and Scherer, D. (2019b). Heat waves in Berlin and Potsdam, Germany–Long-term trends and comparison of heat wave definitions from 1893 to 2017. Int. J. Climatol. 39, 2422–2437. doi:10.1002/joc.5962
Fenner, D., Holtmann, A., Meier, F., Langer, I., and Scherer, D. (2019a). Contrasting changes of urban heat island intensity during hot weather episodes. Environ. Res. Lett. 14, 124013. doi:10.1088/1748-9326/ab506b
Fenner, D., Meier, F., Bechtel, B., Otto, M., and Scherer, D. (2017). Intra and inter 'local climate zone' variability of air temperature as observed by crowdsourced citizen weather stations in Berlin, Germany. Meteorol. Z. 26 (5), 525–547. doi:10.1127/metz/2017/0861
Fouillet, A., Rey, G., Laurent, F., Pavillon, G., Bellec, S., Guihenneuc-Jouyaux, C., et al. (2006). Excess mortality related to the August 2003 heat wave in France. Int. Archives Occup. Environ. Health 80 (1), 16–24. doi:10.1007/s00420-006-0089-4
Founda, D., Pierros, F., Petrakis, M., and Zerefos, C. (2015). Interdecadal variations and trends of the urban heat island in Athens (Greece) and its response to heat waves. Atmos. Res. 161-162, 1–13. doi:10.1016/j.atmosres.2015.03.016
Freychet, N., Tett, S., Wang, J., and Hegerl, G. (2017). Summer heat waves over Eastern China: dynamical processes and trend attribution. Environ. Res. Lett. 12 (2), 024015. doi:10.1088/1748-9326/aa5ba3
Fujibe, F. (2003). Long-term surface wind changes in the Tokyo metropolitan area in the afternoon of sunny days in the warm season. J. Meteorological Soc. Jpn. 81 (1), 141–149. doi:10.2151/jmsj.81.141
Gao, J., Sun, Y., Liu, Q., Zhou, M., Lu, Y., and Li, L. (2015). Impact of extreme high temperature on mortality and regional level definition of heat wave: a multi-city study in China. Sci. Total Environ. 505, 535–544. doi:10.1016/j.scitotenv.2014.10.028
Gemechu, F. G. (2022). How the interaction of heatwaves and urban heat islands amplify urban warming. Adv. Environ. Eng. Res. 3, 2. doi:10.21926/aeer.2202022
Gershunov, A., Cayan, D. R., and Iacobellis, S. F. (2009). The great 2006 heat wave over California and Nevada: signal of an increasing trend. J. Clim. 22, 6181–6203. doi:10.1175/2009JCLI2465.1
He, B. J. (2018). Potentials of meteorological characteristics and synoptic conditions to mitigate urban heat island effects. Urban Clim. 24, 26–33. doi:10.1016/j.uclim.2018.01.004
He, B. J., Ding, L., and Prasad, D. (2020). Outdoor thermal environment of an open space under sea breeze: a mobile experience in a coastal city of Sydney, Australia. Urban Clim. 31, 100567. doi:10.1016/j.uclim.2019.100567
He, B. J., Wang, J., Liu, H., and Ulpiani, G. (2021). Localized synergies between heat waves and urban heat islands: implications on human thermal comfort and urban heat management. Environ. Res. 193, 110584. doi:10.1016/j.envres.2020.110584
He, C., Zhou, T., Lin, A., Wu, B., Gu, D., Li, C., et al. (2015). Enhanced or weakened western north pacific subtropical high under global warming? Sci. Rep. 5 (1), 16771. doi:10.1038/srep16771
IPCC (2021). Climate Change 2021: the physical science basis. Contribution of working group I to the sixth assessment report of the intergovernmental panel on climate change. New York: Cambridge University Press.
Jiang, S., Lee, X., Wang, J., and Wang, K. (2019). Amplified urban heat islands during heat wave periods. J. Geophys. Res. Atmos. 124, 7797–7812. doi:10.1029/2018jd030230
Khan, H. S., Paolini, R., Santamouris, M., and Caccetta, P. (2020). Exploring the synergies between urban overheating and heatwaves (HWs) in Western Sydney. Energies 13 (2), 470. doi:10.3390/en13020470
Kuglitsch, F. G., Toreti, A., Xoplaki, E., Della-Marta, P. M., Zerefos, C. S., Türkeş, M., et al. (2010). Heat wave changes in the eastern Mediterranean since 1960. Geophys. Res. Lett. 37, 4. 2009GL041841. doi:10.1029/2009GL041841
Li, D., and Bou-Zeid, E. (2013). Synergistic interactions between urban heat islands and heat waves: the impact in cities is larger than the sum of its parts. J. Appl. Meteorology Climatol. 52 (9), 2051–2064. doi:10.1175/JAMC-D-13-02.1
Li, Y., Shi, T., Yang, Y., Wu, B. W., Wang, L. B., Shi, C. E., et al. (2015). Satellite-based investigation and evaluation of the observational environment of meteorological stations in anhui province, China. Pure Appl. Geophys. 172 (6), 1735–1749. doi:10.1007/s00024-014-1011-8
Liao, W., Liu, X., Li, D., Luo, M., Wang, D., Wang, S., et al. (2018). Stronger contributions of urbanization to heat wave trends in wet climates. Geophys. Res. Lett. 45 (11), 310–311. doi:10.1029/2018GL079679
Liu, W., Ji, C., Zhong, J., Jiang, X., and Zheng, Z. (2007). Temporal characteristics of the Beijing urban heat island. Theor. Appl. Climatol. 87, 213–221. doi:10.1007/s00704-005-0192-6
Luo, M., and Lau, N. C. (2019). Urban expansion and drying climate in an urban agglomeration of east China. Geophys. Res. Lett. 46 (2), 6868–6877. doi:10.1029/2019GL082736
Matsumura, S., Sugimoto, S., and Sato, T. (2015). Recent intensifi-cation of the western Pacific subtropical high associated with the East Asian summer monsoon. J. Clim. 28 (7), 2873–2883. doi:10.1175/JCLI-D-14-00569.1
Mcgowan, H. A. (1997). Meteorological controls on wind erosion during foehn wind events in the eastern Southern Alps, New Zealand. Can. J. Earth Sci. 34 (11), 1477–1485. doi:10.1139/e17-120
Mishra, V., Ganguly, A. R., Nijssen, B., and Lettenmaier, D. P. (2015). Changes in observed climate extremes in global urban areas. Environ. Res. Lett. 10, 024005. doi:10.1088/1748-9326/10/2/024005
Mughal, M. O., Li, X., and Norford, L. K. (2020). Urban heat island mitigation in Singapore: Evaluation using WRF/multilayer urban canopy model and local climate zones. Urban Clim. 34, 100714. doi:10.1016/j.uclim.2020.100714
Ngarambe, J., Nganyiyimana, J., Kim, I., Santamouris, M., and Yun, G. Y. (2020). Synergies between urban heat island and heat waves in Seoul: the role of wind speed and land use characteristics. PLoS ONE 15, e0243571. doi:10.1371/journal.pone.0243571
Oke, T. R. (1982). The energetic basis of the urban heat island. Q. J. R. Meteorological Soc. 108, 1–24. doi:10.1002/qj.49710845502
Oswald, E. M. (2018). An analysis of the prevalence of heat waves in the United States between 1948 and 2015. J. Appl. Meteorology Climatol. 57, 1535–1549. doi:10.1175/JAMC-D-17-0274.1
Oswald, E. M., and Rood, R. B. (2014). A trend analysis of the 1930–2010 extreme heat events in the continental United States. J. Appl. Meteorology Climatol. 53 (3), 565–582. doi:10.1175/jamc-d-13-071.1
Perkins, S. E. (2015). A review on the scientific understanding of heatwaves-their measurement, driving mechanisms, and changes at the global scale. Atmos. Res. 164, 242–267. oct.-no. doi:10.1016/j.atmosres.2015.05.014
Ramamurthy, P., and Bou-Zeid, E. (2017). Heatwaves and urban heat islands: a comparative analysis of multiple cities. J. Geophys. Res. Atmos. 122, 168–178. doi:10.1002/2016JD025357
Ren, G., Li, J., Ren, Y., Chu, Z., Zhang, A., Zhou, Y., et al. (2015). An integrated procedure to determine a reference station network for evaluating and adjusting urban bias in surface air temperature data. J. Appl. Meteorology Climatol. 54, 1248–1266. doi:10.1175/JAMC-D-14-0295.1
Ren, L., Wang, D., An, N., Ding, S., Yang, K., Freychet, N., et al. (2020). Anthropogenic influences on the persistent nighttime heat wave in summer 2018 over northeast China. Bull. Am. Meteorological Soc. 101, S83–S88. doi:10.1175/BAMS-D-19-0152.1
Ren, Y., and Ren, G. (2011). A remote-sensing method of selecting reference stations for evaluating urbanization effect on surface air temperature trends. J. Clim. 24, 3179–3189. doi:10.1175/2010JCLI3658.1
Richard, Y., Pohl, B., Rega, M., Pergaud, J., Thevenin, T., Emery, J., et al. (2021). Is Urban Heat Island intensity higher during hot spells and heat waves (Dijon, France, 2014–2019)? Urban Clim. 35, 100747. doi:10.1016/j.uclim.2020.100747
Rogers, C. D., Gallant, A. J., and Tapper, N. J. (2019). Is the urban heat island exacerbated during heatwaves in southern Australian cities? Theor. Appl. Climatol. 137, 441–457. doi:10.1007/s00704-018-2599-x
Scott, A. A., Waugh, D. W., and Zaitchik, B. F. (2018). Reduced urban heat island intensity under warmer conditions. Environ. Res. Lett. 13, 064003. doi:10.1088/1748-9326/aabd6c
Seto, K. C., Guneralp, B., and Hutyra, L. R. (2012). Global forecasts of urban expansion to 2030 and direct impacts on biodiversity and carbon pools. Proc. Natl. Acad. Sci. 109 (40), 16083–16088. doi:10.1073/pnas.1211658109
Shi, T., Huang, Y., Shi, C., and Yang, Y. (2015). Influence of urbanization on the thermal environment of meteorological stations: satellite-observational evidence. Adv. Clim. Change Res. 1, 7–15. doi:10.1016/j.accre.2015.07.001
Shi, T., Sun, D., Huang, Y., Lu, G., and Yang, Y. (2021). A new method for correcting urbanization-induced bias in surface air temperature observations: insights from comparative site-relocation data. Front. Environ. Sci. 9. doi:10.3389/fenvs.2021.625418
Shi, T., Yang, Y., Sun, D., Huang, Y., and Shi, C. (2022). Influence of changes in meteorological observational environment on urbanization bias in surface air temperature: a review. Front. Clim. 3. doi:10.3389/fclim.2021.781999
Stewart, I. D., and Oke, T. R. (2012). Local climate zones for urban temperature studies. Bull. Am. Meteorological Soc. 93 (12), 1879–1900. doi:10.1175/BAMS-D-11-00019.1
Su, Q., and Dong, B. (2019). Recent decadal changes in heat waves over China: drivers and mechanisms. J. Clim. 32, 4215–4234. doi:10.1175/JCLI-D-18-0479.1
Sun, X., Ren, G., Ren, Y., Fang, Y., Liu, Y., Xue, X., et al. (2017). A remarkable climate warming hiatus over Northeast China since 1998. Theor. Appl. Climatol. 133, 579–594. doi:10.1007/s00704-017-2205-7
Taha, H. (1997). Urban climates and heat islands: albedo, evapotranspiration, and anthropogenic heat. Energy Build. 25 (2), 99–103. doi:10.1016/S0378-7788(96)00999-1
Tan, J., Zheng, Y., Tang, X., Guo, C., Li, L., Song, G., et al. (2010). The urban heat island and its impact on heat waves and human health in Shanghai. Int. J. Biometeorology 54 (1), 75–84. doi:10.1007/s00484-009-0256-x
Wagner, N. L., Riedel, T. P., Roberts, J. M., Thornton, J. A., Angevine, W. M., Williams, E. J., et al. (2012). The sea breeze/land breeze circulation in Los Angeles and its influence on nitryl chloride production in this region. J. Geophys. Res. Atmos. 117. doi:10.1029/2012JD017810
Wang, Z., Ding, Y., Zhang, Y., et al. (2012). Feature and mechanism of the foehn weather on east slope Taihang mountains?:statistic feature. Plateau Meteorol. 31 (2), 555–561. doi:10.1007/s11783-011-0280-z
Xie, W., and Zhou, B. (2023). On the atmospheric background for the occurrence of three heat wave types in East China. Weather Clim. Extrem. 39, 100539. doi:10.1016/j.wace.2022.100539
Xue, J., Zong, L., Yang, Y., Bi, X., Zhang, Y., and Zhao, M. (2023). Diurnal and interannual variations of canopy urban heat island (CUHI) effects over a mountain–valley city with a semi-arid climate. Urban Clim. 48, 101425. doi:10.1016/j.uclim.2023.101425
Yang, J., Hu, L., and Wang, C. (2019). Population dynamics modify urban residents' exposure to extreme temperatures across the United States. Sci. Adv. 5, eaay3452. doi:10.1126/sciadv.aay3452
Yang, Y., Guo, M., Wang, L., Zong, L., Liu, D., Zhang, W., et al. (2023). Unevenly spatiotemporal distribution of urban excess warming in coastal Shanghai megacity, China: roles of geophysical environment, ventilation and sea breezes. Build. Environ. 235, 110180. doi:10.1016/j.buildenv.2023.110180
Yang, Y., Wu, B., Shi, C., Zhang, J. H., Li, Y. B., Tang, W. A., et al. (2013). Impacts of urbanization and station-relocation on surface air temperature series in Anhui province, China. Pure Appl. Geophys. 170 (11), 1969–1983. doi:10.1007/s00024-012-0619-9
Yang, Y., Zheng, Z., Yim, S. Y. L., Roth, M., Ren, G., Gao, Z., et al. (2020). PM 2.5 pollution modulates wintertime urban heat island intensity in the BeijingTianjin-hebei megalopolis, China. Geophys. Res. Lett. 47 (1), 1–12. doi:10.1029/2019GL084288
Yoon, D., Cha, D. H., Lee, G., Park, C., Lee, M., and Min, K. (2018). Impacts of synoptic and local factors on heat wave events over southeastern region of Korea in 2015. J. Geophys. Res. Atmos. 123. doi:10.1029/2018JD029247
You, Q., Jiang, Z., Kong, L., Wu, Z., Bao, Y., Kang, S., et al. (2017). A comparison of heat wave climatologies and trends in China based on multiple definitions. Clim. Dyn. 48, 3975–3989. doi:10.1007/s00382-016-3315-0
Zhang, N., Wang, X., Chen, Y., and Dai, W. (2015). Numerical simulations on influence of urban land cover expansion and anthropogenic heat release on urban meteorological environment in Pearl River Delta. Theor. Appl. Climatol. 126, 469–479. doi:10.1007/s00704-015-1601-0
Zhang, N., Zhu, L., and Zhu, Y. (2011). Urban heat island and boundary layer structures under hot weather synoptic conditions: a case study of Suzhou City, China. Adv. Atmos. Sci. 28 (4), 855–865. doi:10.1007/s00376-010-0040-1
Zhang, Y., Peng, M., Wang, L., and Yu, C. (2018). Association of diurnal temperature range with daily mortality in England and Wales: a nationwide time-series study. Sci. Total Environ. 621, 291–300. doi:10.1016/j.scitotenv.2017.11.056
Zhao, L., Oppenheimer, M., Zhu, Q., Baldwin, J. W., Ebi, K. L., Bou-Zeid, E., et al. (2018). Interactions between urban heat islands and heat waves. Environ. Res. Lett. 13 (3), 034003. doi:10.1088/1748-9326/aa9f73
Zheng, Z., Ren, G., Gao, H., and Yang, Y. (2022). Urban ventilation planning and its associated benefits based on numerical experiments: a case study in beijing, China. Build. Environ. 222, 109383. doi:10.1016/j.buildenv.2022.109383
Zheng, Z., Ren, G., Wang, H., Dou, J., Gao, Z., Duan, C., et al. (2018). Relationship between fine-particle pollution and the urban heat island in Beijing, China: observational evidence. Boundary-layer Meteorol. 169, 93–113. doi:10.1007/s10546-018-0362-6
Zhou, X., Okaze, T., Ren, C., Cai, M., Ishida, Y., Watanabe, H., et al. (2020). Evaluation of urban heat islands using local climate zones and the influence of sea-land breeze. Sustain. Cities Soc. 55, 102060. doi:10.1016/j.scs.2020.102060
Zinzi, M., Agnoli, S., Burattini, C., and Mattoni, B. (2020). On the thermal response of buildings under the synergic effect of heat waves and urban heat island. Sol. Energy 211 (10), 1270–1282. doi:10.1016/j.solener.2020.10.050
Keywords: heat wave, canopy urban heat island, synergies, climatic background, local circulation, urban morphologies
Citation: Shi T, Liu L, Wen X and Qi P (2024) Research progress on the synergies between heat waves and canopy urban heat island and their driving factors. Front. Environ. Sci. 12:1363837. doi: 10.3389/fenvs.2024.1363837
Received: 31 December 2023; Accepted: 28 February 2024;
Published: 12 March 2024.
Edited by:
Zhiyuan Hu, Sun Yat-sen University, ChinaReviewed by:
Yuanjian Yang, Nanjing University of Information Science and Technology, ChinaXuelin Zhang, Sun Yat-sen University, China
Copyright © 2024 Shi, Liu, Wen and Qi. This is an open-access article distributed under the terms of the Creative Commons Attribution License (CC BY). The use, distribution or reproduction in other forums is permitted, provided the original author(s) and the copyright owner(s) are credited and that the original publication in this journal is cited, in accordance with accepted academic practice. No use, distribution or reproduction is permitted which does not comply with these terms.
*Correspondence: Ping Qi, cWlwaW5nOTI5QHRsdS5lZHUuY24=