 Bwalya Mutale1†
 Fan Qiang2*
- 1School of Surveying, Mapping and Geographical Sciences, Liaoning Technical University, Fuxin, China
- 2School of Geomatics, Liaoning Technical University, Fuxin, China
Accurate predictions of changes in Land-use and Land-cover (LULC) are crucial in climate modeling, providing valuable insights into the possible effects of land-use alterations on Earth’s intricate system. This study focuses on forecasting and examining future LULC changes in the Ndola district from 2022 to 2042, considering three scenarios: Traditional mode (TM), Ecological protection (EP), and Economic Development (ED). TM reflects past land use changes, EP prioritizes environmental conservation, and ED emphasizes economic growth and urbanization. Using the patch-generating land use simulation (PLUS) model, we achieved precise predictions of LULC changes in Ndola district. The model, which combines LEAS rule-extraction with a CA model using CARS, addresses limitations of previous models like CLUE-S, CA-Markov, and FLUS by accurately simulating scattered LULC patterns and the mutual attraction and evolution of open space and urban land under different policies. Using LULC data from the livingatlas platform for the base period (2017–2022), the model demonstrated a Kappa coefficient of 78% and a FoM value of 0.34. Key findings indicate significant trends, such as reductions in forest and agricultural lands in the TM and ED scenarios, with rangeland expanding consistently across all scenarios, particularly in the ED scenario. The decline in agricultural and forest lands raises concerns about household food security, habitat fragmentation, biodiversity loss, and diminished ecosystem services. Urban sprawl onto other land uses could further strain urban infrastructure and public services. Future research should incorporate uncertainty analysis methods such as fuzzy logic or Bayesian methodologies to quantify and differentiate uncertainties related to modeling simulations.
1 Introduction
One cannot overstate the importance of land areas, which serve as invaluable habitats for human existence while simultaneously serving as platforms for social progress and ecological enhancement. Recognizing the pivotal role of land space pattern modifications as the primary drivers of environmental change, it becomes evident that these alterations directly influence the provision of essential ecosystem services (Emiru et al., 2018). Interwoven intricately with ecosystems and human wellbeing, these services constitute a significant focal point in land and spatial planning endeavors (Lu et al., 2022). The disproportionate burden of deforestation is starkly evident in developing nations across Latin America, Asia, and Africa compared to their developed counterparts, highlighting a pressing global concern (Humphreys, 2009). This alarming reality underscores the critical necessity for targeted interventions and sustainable land management practices in these regions. Land-use and land-cover (LULC) emerge as pivotal climatic factors in environmental research, extensively applied across diverse studies encompassing earth system modeling, natural resource management, food security, and conservation biology, underscoring their profound significance (Zhang et al., 2022). Human-induced alterations in LULC yield far-reaching consequences, disrupting fundamental carbon and nitrogen cycling, emitting copious quantities of Chlorofluorocarbon effluents, and causing severe damage to fragile ecosystems and biodiversity (Hong et al., 2021).
In recent years, urbanization has surged globally, with over half of the world’s population living in cities since 2014, and it is projected to reach 66 percent by 2050 (Xu et al., 2022). This rapid urban growth poses significant environmental challenges, emphasizing the need for a holistic understanding of its implications. Urban areas face the task of accommodating expanding populations while maintaining environmental sustainability. Effective land use and cover dynamics management is crucial, serving as indicators of human impacts on natural systems (Li et al., 2021).
Monitoring and predicting changes in land use patterns are essential for understanding urbanization trends and their ecological consequences (Bimenyimana et al., 2022). Such analyses support the formulation of sustainable land use plans, which are vital for fostering a balanced relationship between nature and society in cities.
Remote sensing is indispensable for comprehensively studying LULC changes across diverse geographical contexts. It allows for the acquisition of high-quality land classification data, facilitating accurate land use simulations (Yu et al., 2021). These simulations are vital for anticipatory planning and proactive decision-making by policymakers and urban planners, enabling effective management of LULC transitions under varying scenarios. Understanding the potential trajectories of LULC changes is crucial for developing strategies aligned with sustainable development objectives and mitigating environmental impacts. Through LULC analysis and remote sensing, we can pave the way toward a more ecologically resilient and socially harmonious urban future (Wang et al., 2022).
The rapid pace of urbanization in the Ndola district has given rise to a concerning disparity between urban expansion and the concurrent development of essential infrastructure. This disjunction has manifested prominently in unplanned urban settlements, a prevailing feature in Zambia’s urban landscape, with Ndola city experiencing particular challenges. The district grapples with a spectrum of issues linked to urban expansion, encompassing inadequate waste management, suboptimal water supply and sanitation (especially in low-income areas), proliferation and challenges associated with informal settlements, limited public health services, and congestion in the Central Business District. The lack of coordinated strategic planning exacerbates these challenges, exacerbating the deterioration of urban living conditions. As Ndola expands to accommodate its burgeoning population, the consequences include clearing forests, converting agricultural land into urban spaces, and narrowing the Kafubu River channel due to construction on the river buffer zone. Currently, the trend of land use is a continuous conversion of other land uses, such as cropland and vegetation, to built-up areas. Addressing these adverse effects and steering Ndola toward a sustainable future is imperative. Strengthening institutional capacities for city-wide service delivery and fostering coordinated strategic planning are essential components of this effort. A balanced approach to urban development, mindful of preserving natural resources, is crucial to mitigating environmental degradation and forging a sustainable path forward for Ndola. Unfortunately, there is a lack of comprehensive research quantifying the factors that drive changes in land-use and forest cover in the Ndola district and the future development trends in LULC.
The Patch-Generating Land Use Simulation (PLUS) model is a versatile LULC simulation model that predicts changes based on key factors driving land-use transitions. It considers climate conditions, interaction and competition between various land use types during simulation training, and other relevant factors (population, natural water bodies, transportation systems, etc.). The PLUS model excels in simulating scattered LULC patterns, addressing shortcomings found in other models like CLUE-S, CA-Markov, and FLUS. It overcomes limitations such as the inability to simulate the mutual attraction and evolution of open space and urban land under different policies. Additionally, research indicates that the PLUS model effectively simulates LULC and landscape patterns, surpassing the accuracy of models like FLUS, CLUE-S, and ANN-CA (Liang, et al., 2020; Lu et al., 2022). Hence, this study aims to address this gap by utilizing the PLUS model to simulate various scenarios and forecast the future patterns of land use and forest cover to offer a practical and methodological solution for the spatial planning of the Ndola district.
By employing this approach, we aspire to gain insights into the complex interplay of factors shaping land use decisions, including the implications for forest conservation and the sustainable management of resources. Ultimately, this research supports environmentally conscious decision-making processes, fosters sustainable development, and promotes preserving the Ndola district’s natural heritage.
In this research endeavor, our primary aim was to effectively represent and examine LULC changes within the Ndola district. To achieve this, we pursued the following main research objectives:
1) To assess the fidelity of the PLUS model in conjunction with specific influential factors in accurately simulating the LULC patterns observed in the Ndola district.
2) To investigate the anticipated alterations in LULC within the Ndola district between 2022 and 2042 under varying scenarios.
2 Materials and methods
2.1 Study area
Ndola district, a vital town and the provincial capital of a copper-producing province in Zambia (Copperbelt Province), stands as a symbolic example of the dynamic transformations in global land and resource utilization during the past few decades. This region has witnessed intensive human activities, the rapid expansion of urban agglomeration, a substantial decline in forest coverage, and intense conflicts over land space. The city has an area of 1,108 km2 and is situated within the latitudinal range of 12°43′ to 13°10′ South and the longitudinal range of 28°18′ to 28°46′ East. It shares its borders with three districts, namely, Masaiti, Luanshya, and Kitwe, and to the north, it has an international boundary with the Democratic Republic of Congo (DRC). The Kafubu River meanders through the district, which consequently drains into the Kafue River in another district. Ndola has a population that has been steadily growing over the years. The population is currently around 475,000, with an expansion rate of 2.8% (Zambia Statistics Agency, 2022), reflecting the urbanization trend in the city. The city experiences moderate rainfall, with an average annual precipitation of approximately 1232 mm. This rainfall is crucial for supporting various activities, including agriculture and water supply.
The rapid urbanization observed in the Ndola district serves as a microcosm of broader regional trends, highlighting the challenges that resonate across Zambia’s urban landscape. The evident disparity between urban expansion and the concurrent development of essential infrastructure mirrors a pattern seen in many rapidly growing urban areas in the region. Ndola’s struggle with unplanned urban settlements is not unique but emblematic of a prevailing feature in Zambia’s urbanization. The district’s problems, which include poor waste management, limited water supply, poor sanitation, a proliferation of informal settlements, and associated problems, reflect common issues in urban centers undergoing rapid transformation. The persistent tendency of land-use conversion, which converts vegetation and agriculture into built-up regions, is especially concerning. This trend is not unique to Ndola; it is a reflection of the difficulties urban areas in the region face as conflicting demands for land resources change the topography. Studying Ndola’s LULC changes provides valuable insights into regional dynamics. The challenges faced by the district serve as a representative case, offering a lens through which broader regional trends in urbanization, infrastructure development, and environmental sustainability can be understood. Addressing these challenges in Ndola is essential for its residents’ wellbeing and carries implications for sustainable urban development practices across Zambia and sub-Sahara Africa. Figure 1 provides a visual representation of the study area.
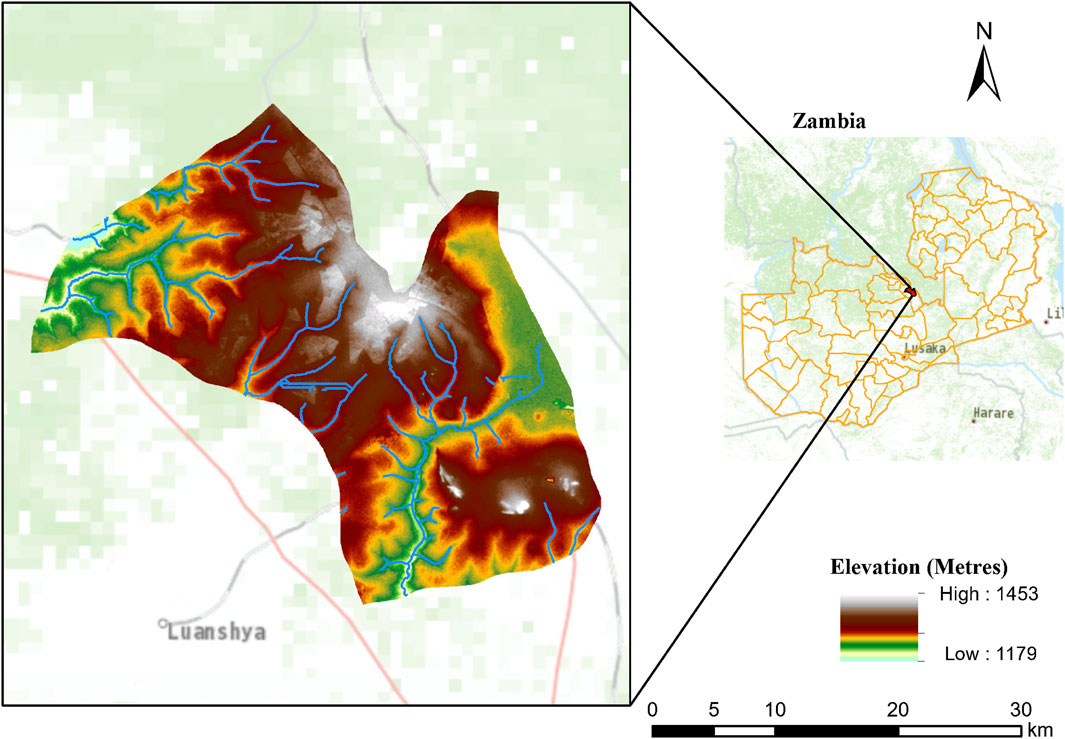
FIGURE 1. Location of the study area.
2.2 Data sources
A holistic understanding of the multifaceted dynamics is paramount in the field of studies on land-use change and urban growth, where physical, spatiotemporal, and infrastructure data are crucial. Aburas et al. (2016) underscored the significance of these datasets, which are widely recognized and utilized for simulating future trends in land use and urban development. Satellite image processing stands out as a pivotal tool in generating LULC maps, offering cost-efficient access to expansive Earth surface data. Researchers can use this methodology to accurately classify various land cover types and detect changes across diverse spatial scales.
We considered natural, social, and economic dimensions to delve deeper into the intricate web of factors influencing land-use alterations. The driving factors selected for our analysis encompass elevation, population, precipitation, temperature, slope, soil type, population density, and distance to primary roads, tertiary roads, and railways. These factors collectively contribute to the complex interactions shaping changes in land use types. Amidst this comprehensive approach, we made a conscious choice to utilize publicly available data sources, such as those provided by the National Aeronautics and Space Administration (NASA) and the U.S. Geological Survey (USGS), ensuring our study benefits from a rich depository of information for a nuanced exploration of land-use dynamics.
These factors were evaluated based on Euclidean distances, with elevation data derived from ArcGIS software as shown in Figure 2. This research employed LULC data obtained from Esri and Microsoft’s livingatlas platform, spanning the timeframes between June to October 2017 and 2022. The dataset can be accessed at https://livingatlas.arcgis.com/landcover/. The objective was to categorize various land use types, including forest, flooded vegetation, cropland (Agriculture), water bodies, bare land, built-up areas, and rangeland. A comprehensive description of the LULC classification can be found in Table 1.
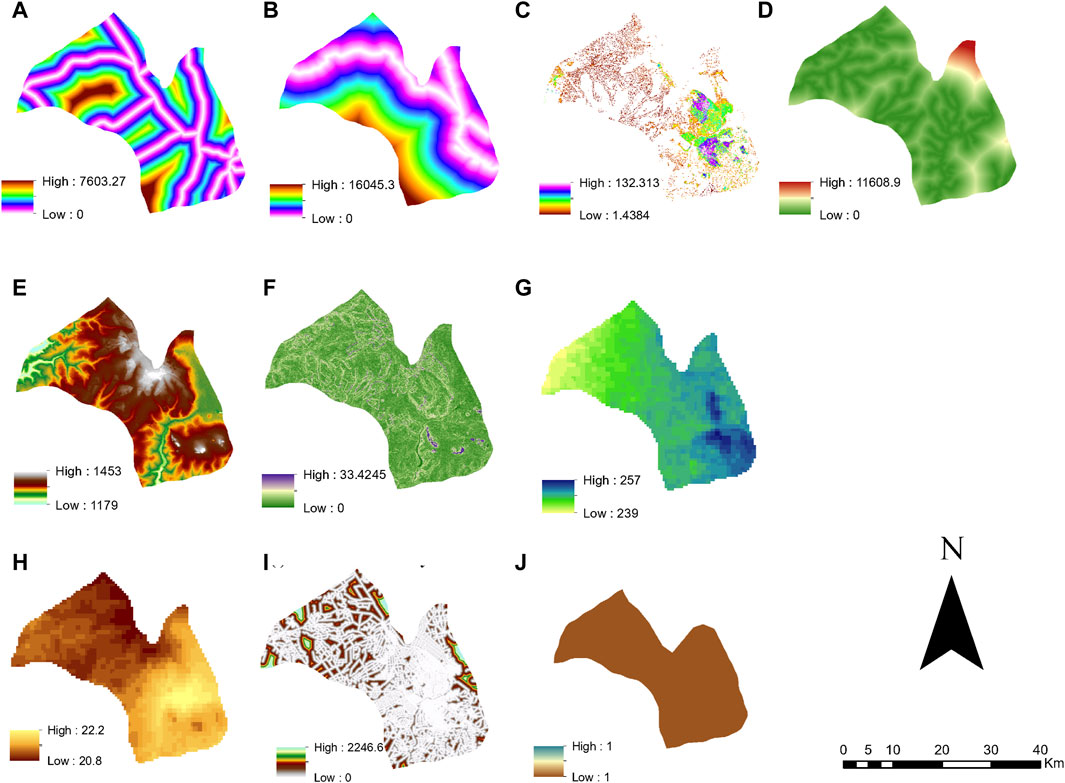
FIGURE 2. Driving factors: (A) distance to road, (B) distance to the railway, (C) population, (D) distance to waterways, (E) digital elevation model (DEM), (F) slope, (G) annual precipitation, (H) annual temperature, (I) distance to tertiary roads, (J) Soil type.

TABLE 1. LULC classification system utilizing deep learning AI by Impact Observatory.
The digital elevation model (DEM) employed in the analysis was sourced from the U.S. Geological Survey, obtainable at https://earthexplorer.usgs.gov/. This model has a spatial resolution of 30 m. Additionally, the shapefile for administrative areas of the Ndola district was downloaded from DIVA-GIS.
Moreover, the driving factors and other datasets, originating from different providers and systems, carried inherent geographical representations and spatial referencing variations. A thorough process of geographic unification was carefully carried out to address these discrepancies. This required the datasets to be precisely aligned using a uniform geographic and projection system, specifically adopting the WGS84/UTM Zone 35S. By doing so, a consistent and cohesive spatial framework was established, facilitating a unified analysis that allows for meaningful comparisons and correlations across the entirety of the dataset. In essence, the geo-referencing and unification efforts were crucial steps undertaken to ensure not only the compatibility of diverse datasets but also to create a unified, standardized spatial context essential for a comprehensive understanding of the complex interactions within the study area. This standardized framework lays the foundation for accurate and meaningful analyses, enabling us to draw reliable insights from the amalgamation of diverse data sources with distinct spatial characteristics while uniformly resampling the spatial resolution to 30 m.
Notably, areas classified as perennial water bodies were designated zones with restricted development. The driving factors utilized for the study were drawn from a variety of sources of vector and raster data accessible to the public. Detailed information regarding the acquired data can be found in Table 2.

TABLE 2. The spatial driving factors of the land use change in this study.
The southern portion of the study area exhibits a higher density of proximity to the nearest primary road, while the middle to northern regions display increased distances to primary roads, resulting in a less extensive road network; this is shown in Figure 2A. Figure 2B, which depicts the distance to the railway, shows that the railway tracks are positioned on the periphery of the study area, with the closest distances found in developed areas. Most of the study area is a considerable distance from the nearest railway proximity. The population is most densely concentrated in the southeastern to south-central region of the study area, representing the primary agglomeration, as shown in Figure 2C. The remaining areas of the study exhibit lower population density. Figure 2D shows the closest distances to water bodies, which are primarily concentrated in the agglomeration region where the main river flows, situated in the south-central part of the study area. The most significant distances extend towards the northern region, approaching the study area’s border with the Democratic Republic of the Congo. The elevation across the study area is consistently high, with minor variations between the highest and lowest points.
The lower regions primarily correspond to the path of the sole river in the study area, flowing from the southeast to the southern part of the region, as is shown in Figure 2E. Elevated slopes are distributed throughout the study area, with a notable concentration in the south section. On average, the slope is gentle or low across the entire study area; this is shown in Figure 2F. Figure 2G, which depicts the annual precipitation, shows that, on average, the study area experiences significant rainfall, with the southern region receiving a relatively higher amount of precipitation. The warmest part of the study area is the agglomeration region, with a gradual decrease in temperature moving from the central location towards the north, as shown in Figure 2H. Tertiary roads are distributed relatively uniformly across the study area, with short distances to them. Nevertheless, the closest distances are more concentrated in the urban agglomeration region, situated in the south-central area of the study area; this is shown in Figure 2I. Figure 2J depicts Soil type, overall, the study area predominantly features a uniform soil type, characterized as clay-loam with varying proportions of clay and other minerals.
2.3 The PLUS model
The High-performance Spatial Computational Intelligence at China University of Geoscience (HPSCIL@CUG) laboratory development team created the PLUS model, a simulation model for land use change generated through patches (Yue, et al., 2023). The PLUS algorithm is designed to synergistically combine knowledge discovery, policy-making, and simulation, empowering policymakers and researchers with meaningful information to address the challenges associated with land use and land cover transformations (Liang, et al., 2020). Its simulation process comprises three primary stages, each contributing to a comprehensive understanding of the dynamics at play:
1. Extracting land expansion: The first step involves comparing land use and land cover maps from different years, such as 2017 and 2022. The model identifies cells that underwent a land category transition during the specified timeframe by examining changes between these maps. This information serves as a basis for further analysis and modeling.
2. Land expansion analysis strategy (LEAS): In the second step, a random forest regression (RFR) is employed, utilizing the land expansion map obtained from the previous stage and various assembled variables. The number of regression trees can be adjusted to accommodate user preferences and specific research objectives. The “mTry” parameter determines the number of attributes used to train the RFR model, which should correspond to the count of contributing factors influencing land-use changes. This process yields raster layers representing the growth potential of each land use category across the study area.
3. Cellular Automata based on multiple random seeds (CARS): The third step leverages the land use map from the initial year and the growth potential layers derived through LEAS. Several parameters are considered in this phase, including neighborhood size, patch generation threshold (Yang, et al., 2022), expansion coefficient, percentage of seeds, and conversion constraint. A conversion constraint represents a spatial feature that remains immutable throughout the simulation process, often designated as water bodies due to their inherent resistance to land-use change (Liang, et al., 2022). The land expansion map derived in the first step determines the neighbourhood weights assigned to each land use category, with the weight of a category equaling the ratio of cells transitioning to that category in the last year to the total number of cells that changed during that year. The land demands, which indicate the desired number of cells for each land use category in the final simulation maps, are estimated through linear regression and Markov chain methods.
Once the simulation process is complete, the CARS analysis is repeated to assess the precision of the PLUS model. This evaluation involves predicting the land use for a specific year, such as 2022, and comparing it with that year’s factual land use map. Employing the land use map of 2017, the simulated results are rigorously compared to the real-world data, allowing for the calculation of the Kappa coefficient—a statistical measure that assesses the level of agreement between the simulated and actual land use maps (Mei, et al., 2018).
With its robust methodology and advanced features, the PLUS model offers a comprehensive approach to understanding and predicting land use changes. Integrating knowledge discovery, policy-making, and simulation provides valuable insights for policymakers and researchers. The capacity of the model to capture the complex dynamics of land expansion and accurately project landscape patterns makes it an indispensable tool for decision-making processes and sustainable land management strategies. Figure 3 shows the workflow of the model.
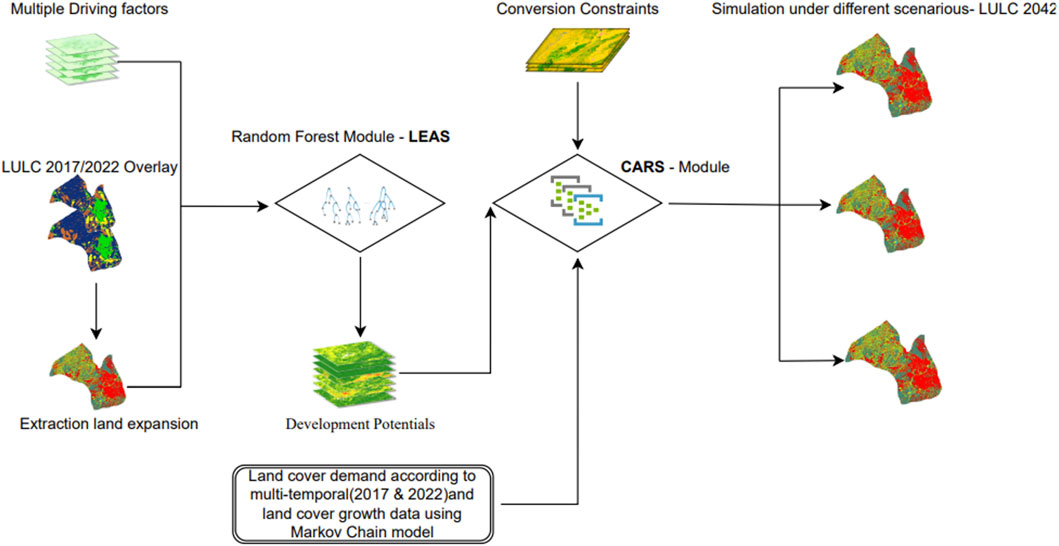
FIGURE 3. Basic workflow of the patch-generating land use simulation model.
2.4 Extracting land expansion
The primary objective of this stage involves extracting a map depicting land expansion, enabling the exploration of growth potentials across various land-use categories (Figure 4 provides a visual representation) within the Land Expansion Analysis Strategy (LEAS) phase. This land expansion map is pivotal in comprehending neighborhood influences and transition matrices, both of which serve as inputs for the Cellular Automata model based on multiple random seeds (CARS) (Aytac, 2020). LULC maps from 2017 to 2022 were employed to accomplish this.
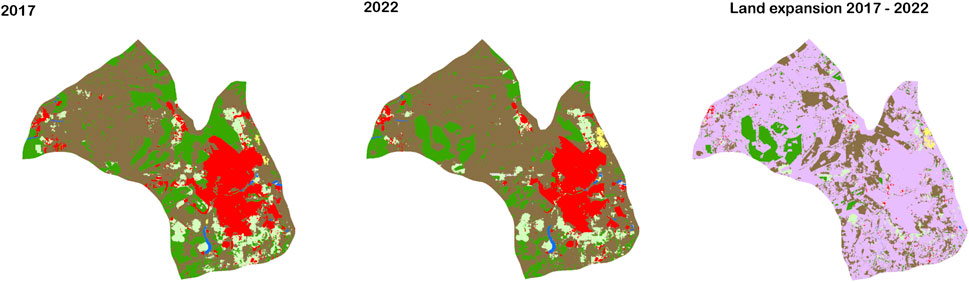
FIGURE 4. Illustrates the resultant land expansion map alongside the LULC maps from 2017 and 2022.
2.5 Model training
Employing the Land Expansion Analysis Strategy menu, the training process is carried out. Here, the model harnesses the capabilities of random forest regression (RFR) to unveil the latent developmental potential harbored by each land-use category. RFR, an innovation attributed to Leo Breiman, rests upon a tree-structured regression model approach. This machine learning paradigm derives predictive insights from extensive datasets, often represented in algorithms (Aytac, 2022). Distinguished by its resilience to outliers and capacity to aptly approximate variables marked by non-linear relationships, RFR boasts robust performance (Aytac, 2022). The methodology hinges upon the bagging technique (Zhao, et al., 2019), where subsets of training data generate random samples (weak learners). These weak learners collectively train the model, culminating in learning outcomes according to Eq. 1.
Here, B signifies the count of base models, while (X) embodies the output of base models. Notably, two pivotal parameters warrant meticulous tuning for RFR optimization: nTree and mTry (Aytac, 2022). The former denotes the count of grown regression trees, while the latter signifies the count of factors considered at each interval, decided through a randomly selected subset of factors (Zhao, et al., 2019). The generated expansion map (2017–2022), together with the ten driving factors, was run in the LEAS module. Optimal settings were selected, with nTree set at 20 and mTry at 10—aligning with the count of contributing factors. A sampling frequency of 0.10 was adopted. Following the training, the outcome encompassed growth potential maps of each land use.
2.6 Model calibration and validation
The subsequent phase involves the Cellular Automata model based on multiple random seeds (CARS) to simulate future LULC changes. However, before delving into simulation, a prerequisite entailed calibrating and validating the model. This initial application of the CARS step is aimed at model calibration. CARS leverages cellular automata principles and incorporates a patch-producing mechanism guided by multiple random land-use seeds (Liang, et al., 2020). Originating from the late 1940s, the cellular automaton approach, conceptualized by von Neumann and Ulam, orchestrates interactions between cells based on user-defined regulations, emulating autoreplicating intricate systems through discretization of both temporal and spatial dimensions (Fuyong et al., 2020). Cellular automata (CA) have found versatile applications in simulating diverse systems such as land behavior, river dynamics, fire propagation, bacterial growth, population dynamics, and vegetation development forecasts (Silva, et al., 2019).
In the context of land-use predictions, CA models typically represent each cell as a spatial unit and assign different land-use types to them. These models leverage neighborhood influences to simulate how the state of a cell, such as its land-use type, is influenced by neighboring cells. A neighborhood function, like the Moore neighborhood, often determines this influence, which includes the 8 cells surrounding a central cell. The states of these neighboring cells can impact the transition of the central cell’s state based on predefined rules. Additionally, transition matrices define the probabilities or rules governing how the state of a cell changes over time based on its current state and the states of its neighbors. These matrices encapsulate the transition rules of the CA model, shaping the dynamics of land-use change. By adjusting neighborhood influences and transition matrices, modelers can explore different scenarios and study the impacts of various factors, such as policy interventions or environmental changes, on land-use dynamics. Overall, these parameters play crucial roles in shaping the predictive capabilities of CA models in simulating land-use changes.
2.6.1 Calibration
Inputs of CARS module included the initial 2017 LULC map, growth potential maps from the LEAS phase, 2022 future land demands, and the conversion constraints map. We utilized water bodies as spatial constraints in our study, with neighborhood effects quantified using the 3 × 3 Moore neighborhood. The patch generation and expansion coefficients were specifically set to 0.5 and 0.1, respectively, and determined through a trial-and-error method to validate each parameter (Liang et al., 2020). Simulation parameters encompassed land-use demand, transition matrix, and neighborhood weights. To project future land demands for 2022, we employed a Markov chain model, following the methodology outlined in Liang, et al. (2018), which is integrated into the PLUS software. This investigation employed changes in the overall LULC composition from 2017 to 2022 to characterize neighborhood weights and future land-use demands. In configuring the transition matrix parameters, a value of 1 signified allowance for conversion, while a value of 0 indicated the impossibility of conversion. The transition matrix was constructed based on prior expertise and knowledge about the study area, with adjustments made depending on the simulated scenario. This approach comprehensively represents the dynamic land-use changes over the specified timeframe.
2.6.2 Validation
After integrating requisite data for calibration and validation, the simulated representation of 2022 LULC requirements followed. The subsequent evaluation relied on Cohen’s kappa coefficient, a conventionally deployed metric for data consistency. The coefficient’s values range between −1 and 1, although practical values hover between 0 and 1. Proximity to 1 indicates high consistency, with values exceeding 0.6 implying substantial concurrence between two images. In this case, the kappa coefficient and figure of merit (FoM) were used to assess the consistency; the kappa coefficient stood at 0.78, and the FoM value was 0.32. This underscores the PLUS model’s efficacy, explicitly concerning the ten drivers outlined in this study, in achieving highly accurate and confident LULC prediction outcomes.
In the given expression: n represents the total number of validation pixels, nii is the count of correctly classified pixels for the ith class, n + i denotes the total number of pixels classified as the ith class, n + i signifies the total number of pixels of the ith class in the reference data, and k represents the total number of classes.
FoM value can be calculated as below:
A represents the area attributed to inaccuracy resulting from noted transition being forecasted as tenacity, B denotes the area corresponding to precision arising from noted change being correctly projected as transformation, C signifies the area linked to inaccuracy stemming from noted change being forecasted as transitioning to wrongly assigned grouping, and D accounts for the area associated with inaccuracy due to forecasted tenacity being inaccurately forecasted as transition (Liu, et al., 2017).
3 Results and discussions
3.1 Scenario description
In this comprehensive investigation, we meticulously classified potential developments into three overarching categories, each distinctively defined by predictive scenarios that offer valuable insights into the future landscape of the Ndola district. Our methodological framework encompasses the traditional mode (TM), the ecological protection scenario (EP), and the economic development scenarios (ED).
3.1.1 Traditional Mode (TM)
The scenario serves as a reflective lens, offering a comprehensive look at the historical trajectory of land use alterations within the Ndola district. By extrapolating from past trends, this scenario provides a nuanced understanding of the probable trajectory in the absence of significant interventions. The TM acts as a baseline against which the other scenarios can be compared, aiding in the identification of potential deviations from the status quo. Analyzing historical patterns in land use allows researchers and policymakers to grasp the dynamics that have shaped the landscape over time, providing essential context for evaluating the impact of alternative scenarios.
3.1.2 Ecological Protection (EP)
This scenario embodies a developmental paradigm that places paramount importance on safeguarding environmental integrity within the Ndola district. In this scenario, socio-economic progress becomes intricately intertwined with the imperative of ecological conservation. This forward-thinking approach seeks to balance human development and environmental preservation harmoniously. The EP scenario explores the potential implications of adopting a strategy prioritizing sustainability and ecosystem health. Considering the trade-offs and synergies between development and conservation, it aims to foster a sustainable future for the Ndola district, where economic growth coexists with responsible environmental stewardship.
3.1.3 Economic Development (ED):
Conversely, ED scenarios prioritize a trajectory characterized by robust economic advancement, urban agglomeration, and fiscal augmentation as primary objectives. This scenario envisions a dynamic landscape characterized by rapid economic growth and urban expansion, serving as a potential catalyst for transformative changes within the Ndola district. The ED scenarios delve into the potential consequences of a development path that heavily emphasizes economic progress. This involves the promotion of urbanization, industrialization, and increased fiscal activities on land use patterns. By highlighting the opportunities and challenges associated with an economically focused approach, the ED scenarios contribute valuable insights into the potential future landscape of the Ndola district and its implications for sustainable development.
Our multidimensional approach classifies potential developments and provides an extensive analysis of the composite dynamic relationship between human activities and the evolving landscape. Through the lens of these predictive scenarios and the application of advanced modeling techniques, our study contributes significantly to the elucidation of future land use dynamics in the Ndola district, ultimately enhancing our comprehension of the intricate factors shaping its developmental trajectory.
3.2 LULC dynamic simulation
The simulation procedure was initiated by ascertaining future land demands, a task facilitated by the PLUS model utilizing the Markov chain technique. Markov chain models constitute class-focused transition matrices, extensively employed to ascertain the odds of LULC transitions between sequential time intervals. The essence of the Markov chain model lies in forecasting the future condition predicated upon the present state, alongside the probabilities of transitioning between states (Hu, et al., 2013).
We used the input maps of 2017 and 2022 as the start and end years, respectively, and then selected 2042 as the predicted year. After acquiring outcomes from the Markov model, we executed LULC simulations after the resulting kappa coefficient showed a strong agreement in the previous validation step. We projected potential land use configurations for 2042 under the scenarios mentioned, offering insights into economic and ecological implications, as seen in Figure 5.
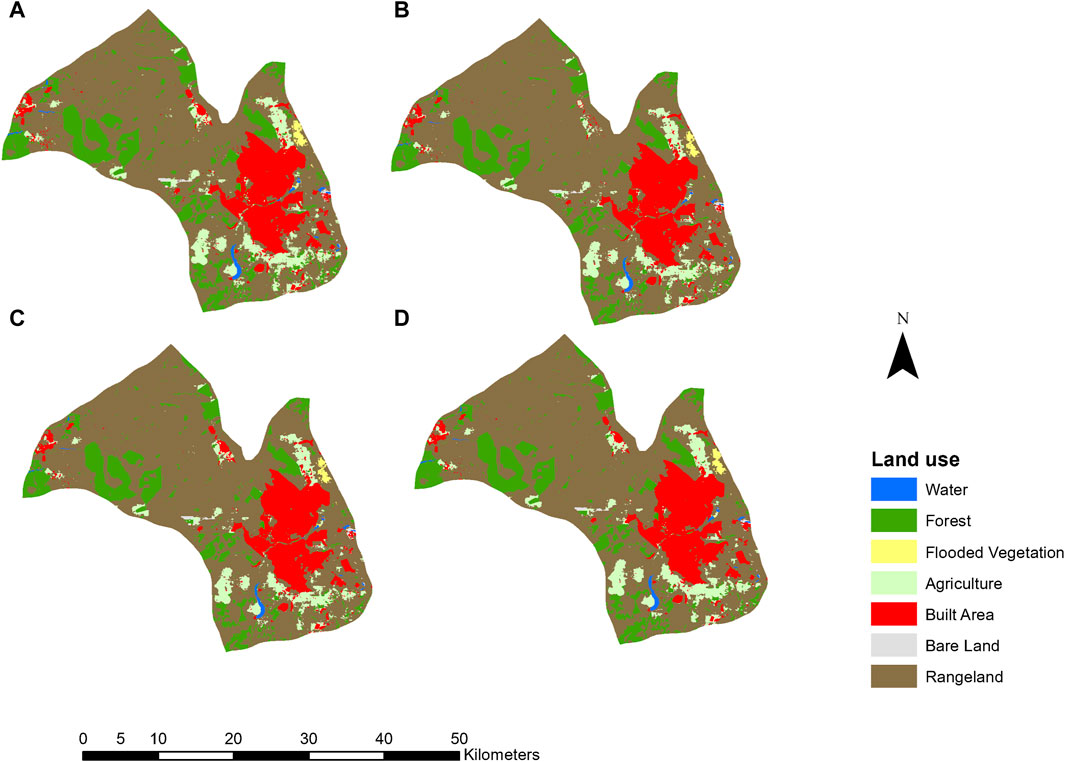
FIGURE 5. Forecasted land use for the year 2042 under distinct scenarios: (A) LULC 2022, (B) economic development scenario, (C) ecological protection scenario, (D) traditional mode scenario.
In both TM and ED scenarios, the dominant trends in land use alteration encompassed substantial diminution in Forest and Agriculture lands relative to the existing 2022 land use, with the TM variant exhibiting a more consolidated reduction (Forest contracting to 14269ha and 14270ha, respectively from 14322ha in 2022; Agriculture receding to 6220ha and 6193ha from 6256ha in 2022). Land area expansion under TM and ED scenarios manifested as sprawling rangeland clusters. Notably, the TM scenario witnessed a proliferation of built-up zones encroaching upon forestland. The rangeland land-use expanded cohesively across all scenarios. The most extensive rangeland expansion occurred within the ED scenario, indicative of deforestation for energy and economic purposes as the built-up area expanded. While agricultural land dwindled in the ED scenario, the reduction was comparably milder than in the TM scenario, potentially yielding more significant economic benefits at the expense of encroaching upon forestland.
Consequently, forest patches under ED and TM scenarios exhibited a trajectory of diminishing size. Conversely, the EP scenario demonstrated the greatest need for forests while maintaining relatively intact forest patches, albeit with no expansion observed. Intriguingly, both the ED and TM scenarios exhibited analogous trends in agriculture and forestland decline, barring water areas. This hints at an expansion strategy that avoids encroachment upon water bodies, fostering a more sustainable urban developmental trajectory. The TM scenario’s projected loss of most agriculture and forestland is noteworthy, signaling a necessity for heightened vigilance in safeguarding these resources amidst the prevailing course of land use transformation.
This study presents an innovative framework for rule mining, focusing on an analytical strategy termed LEAS. This framework sheds new light on LULC dynamics within a specific study area. The LEAS method streamlines the assessment of land use changes, accommodating complex, multi-category modifications. Building upon the growth probabilities derived from LEAS, a CA model named CARS was introduced. Based on diverse random patch seed types, this model greatly enhanced the accuracy of simulating fine-scale patch growth across diverse land use types. The result is a more authentic representation of landscape patterns with potential applications in decision-making dealing with the complex challenge of aligning diverse land use patterns in urban areas of developing countries.
This model examined the fundamental factors driving these dynamics and accurately simulated the evolution of land use patches. Validation using simulation data from Ndola (2017–2022) demonstrated that the PLUS model has a profound precision and close alignment with real-world landscape patterns. Utilizing the model, we projected potential land use configurations for 2042 under various scenarios, offering insights into economic and ecological implications. These findings are of utmost importance for policymakers shaping the district’s future development trajectories. In both TM and ED scenarios, the main land-use change trends involved significant reductions in forest and agricultural lands compared to the 2022 baseline. TM showed a more pronounced reduction. Rangeland clusters expanded in both scenarios, with TM witnessing built-up zones encroaching on forestland. The most extensive rangeland expansion occurred in the ED scenario, reflecting deforestation for energy and economic purposes. Although agricultural land decreased in the ED scenario, the reduction was less severe than in TM, potentially yielding more significant economic benefits at the expense of forestland. Forest patches under ED and TM scenarios consistently decreased in size. The EP scenario demonstrated the highest demand for forestland without expansion. Interestingly, ED and TM scenarios exhibited similar trends in agriculture and forestland decline, excluding water areas, suggesting a strategy that avoids encroaching on water bodies for more sustainable urban development. The TM scenario projected significant losses in agriculture and forestland, emphasizing the need for increased vigilance in protecting these resources during land use transformation.
3.3 Potential impacts of the predicted LULC changes
3.3.1 TM scenario
3.3.1.1 Socio-economic impacts
The TM scenario, reflective of historical trends, poses significant socio-economic challenges in the Ndola district. The significant reduction in agricultural and forest lands and the encroachment of urban areas upon forested regions signifies entrenched urbanization patterns driven by historical norms. This historical trajectory may result in socio-economic challenges, with implications for housing, infrastructure development, and employment opportunities. The increased demand for land in urban areas, exacerbated by historical urbanization patterns, will likely drive up land acquisition and rental costs. This, in turn, could contribute to the sprawl of slums as individuals seek more affordable alternatives, further straining urban infrastructure and services. The reduction in agricultural land not only raises concerns about food security but also poses a direct threat to the livelihoods of those dependent on agriculture. In a region where agriculture often serves as a primary source of income, this trend may exacerbate existing poverty levels. The Ndola district, which has not fully recovered from the economic downturn resulting from the closure of industries in the late 1990s to early 2000s, witnessed a notable increase in poverty and unemployment during that period. The consequences were evident in the emergence of street kids and increased destitution, reflecting the vulnerability of households to economic shocks.
3.3.1.2 Environmental sustainability
The encroachment on forested areas in the TM scenario raises alarms for environmental sustainability. Loss of forest cover may result in habitat fragmentation, biodiversity loss, and reduced ecosystem services. It has been noticed that Ndola city council has challenges with regulating unplanned settlements; for example, houses have been built in the buffer zone of the river, and green spaces are restricted as water recharge points are slowly being encroached. Additionally, the historical trend of diminishing forest patches may contribute to climate change and exacerbate urban heat island effects. Balancing urban development needs with conservation efforts becomes imperative to ensure the long-term environmental health of the city.
3.3.2 ED scenario
3.3.2.1 Socio-economic impacts
The potential socio-economic impacts are multifaceted in the ED scenario, marked by robust economic advancement. The milder reduction in agricultural land suggests economic diversification and growth in alternative sectors, signaling opportunities for job creation and increased incomes. This economic expansion would likely lead to increased government revenue increasing spending on critical infrastructure, social programs, education, and healthcare. Consequently, improved public services and societal wellbeing become feasible outcomes.
However, the extensive rangeland expansion and deforestation for economic purposes present challenges. The trade-off between economic development and environmental conservation becomes evident, with potential impacts on the health and wellbeing of urban residents. The rapid urbanization associated with economic growth brings the promise of improved infrastructure, but it also introduces challenges such as heightened traffic congestion and increased demand for housing. This surge in urban development may necessitate strategic urban planning to manage the evolving demands and ensure a balanced socio-economic landscape.
3.3.2.2 Environmental sustainability
The extensive deforestation observed in the ED scenario raises significant concerns for environmental sustainability. Balancing economic growth with environmental conservation is crucial to mitigate adverse impacts on air and water quality, soil erosion, and the overall ecological balance. In the context of Copperbelt towns, industrial pollution from mine effluent (air and water) has been documented, making vigilant monitoring and stringent implementation imperative as the district develops under this scenario.
3.3.3 EP scenario
3.3.3.1 Socio-economic impacts
In the EP scenario, where ecological conservation takes precedence, a distinct set of socio-economic dynamics emerges. The prioritization of ecological integrity underscores a commitment to environmental sustainability, emphasizing forests’ crucial role and maintaining intact forest patches. This commitment paves the way for innovative agricultural practices such as climate-smart agriculture and agroforestry. These approaches promote household food security and offer cost-effective solutions compared to conventional agriculture methods. The emphasis on climate-smart agriculture and agroforestry enhances food production and fosters resilience to climate change and environmental degradation. By integrating trees into agricultural landscapes and implementing sustainable farming techniques, communities can mitigate the impacts of climate variability, improve soil health, and conserve water resources. This enhances local food security and reduces reliance on external inputs, thereby contributing to long-term economic sustainability.
Moreover, the EP scenario creates opportunities for developing eco-friendly industries, sustainable tourism, and green technologies within urban development. By preserving natural habitats and promoting sustainable land management practices, urban areas can become more attractive to environmentally conscious investors and businesses. Sustainable tourism initiatives centered around pristine natural environments and ecologically sensitive areas can generate economic opportunities while preserving the integrity of ecosystems. For instance, a significant portion of land currently designated for commercial pine forestry, managed by a quasi-governmental entity like ZAFFICO, instead of clear-felling, some sections could be repurposed for urban eco-tourism activities.
Furthermore, aligning urban development with global sustainability goals enhances the city’s reputation on the international stage, attracting investment and fostering partnerships with organizations committed to environmental stewardship. This stimulates economic growth and promotes social equity and environmental justice, ensuring that all residents share development benefits equally. In summary, the EP scenario offers a vision of urban development that prioritizes environmental sustainability and fosters inclusive economic growth.
3.3.3.2 Environmental sustainability
The EP scenario stands out for its commitment to environmental sustainability. This scenario fosters a more balanced and ecologically sustainable urban development by preserving intact forest patches and avoiding extensive encroachment on water bodies. The emphasis on ecological protection is likely to result in improved water quality provided by Kafubu Water and Sewerage Company (KWSC), which is currently a challenge, enhanced biodiversity, and overall resilience to the impacts of climate change.
3.4 Limitations and future areas of research
The accuracy of the study’s findings relies heavily on the quality and accessibility of input data. Inaccuracies, gaps, or low resolutions in the data used for modeling could impact the reliability of the results, particularly given our reliance on freely available data sources, which often offer coarse spatial and spectral resolutions compounded by limited datasets in developing countries. Additionally, the study employed the PLUS model to forecast future LULC changes. However, like any modeling approach, this method entails certain assumptions and simplifications that may not fully encompass the intricacies of real-world processes. For example, the model may overlook unforeseen events or alterations in policies (political or economic) that could profoundly influence land use patterns. Subsequent studies could incorporate uncertainty analysis techniques, such as fuzzy logic or Bayesian methods, to quantify and delineate uncertainties associated with modeling assumptions. Forecasting future LULC inherently involves uncertainty, adding a fuzzy dimension to simulations. Thus, integrating such approaches may enhance the reliability of model predictions and provide valuable insights for decision-making under uncertain conditions.
4 Conclusion
To summarize, the PLUS model delivers results characterized by enhanced accuracy, consistent landscape patterns, and valuable insights into the forces driving land expansion. Furthermore, it provides substantial guidance for policymakers dealing with the challenge of managing diverse land use patterns aligned with various developmental objectives. We advocate for the broader adoption of this approach, especially in urban areas of developing countries, to unravel and determine the best land-use and the mechanisms underlying land expansion configurations within different policy frameworks.
Data availability statement
The original contributions presented in the study are included in the article/Supplementary Material, further inquiries can be directed to the corresponding author.
Author contributions
BM: Data curation, Formal Analysis, Methodology, Software, Visualization, Writing–original draft, Writing–review and editing. FQ: Conceptualization, Supervision, Writing–review and editing.
Funding
The author(s) declare that no financial support was received for the research, authorship, and/or publication of this article. No funding was received for conducting this study.
Acknowledgments
The authors would like to acknowledge and thank postgraduate students and academics at Liaoning Technical University, especially in the School of Geomatics, who have a good knowledge of the PLUS Model for their help in providing useful information for this study. The authors thank the editor and reviewers for their valuable time reviewing the manuscript.
Conflict of interest
The authors declare that the research was conducted in the absence of any commercial or financial relationships that could be construed as a potential conflict of interest.
Publisher’s note
All claims expressed in this article are solely those of the authors and do not necessarily represent those of their affiliated organizations, or those of the publisher, the editors and the reviewers. Any product that may be evaluated in this article, or claim that may be made by its manufacturer, is not guaranteed or endorsed by the publisher.
References
Aburas, M. M., Ho, Y. M., Ramli, M. F., and Ash’aari, Z. H. (2016). The simulation and prediction of spatio-temporal urban growth trends using cellular automata models: a review. Int. J. Appl. Earth Observation Geoinformation 52, 380–389. doi:10.1016/j.jag.2016.07.007
Aytac, E. (2020). Unsupervised learning approach in defining the similarity of catchments: hydrological response unit based k-means clustering, a demonstration on Western Black Sea region of Turkey. Int. Soil Water Conservation Res. 8, 321–331. doi:10.1016/j.iswcr.2020.05.002
Aytac, E. (2022). Modeling future impacts on land cover of rapid expansion of hazelnut orchards: a case study on samsun, Turkey. Eur. J. Sustain. Dev. Res. 6, em0193. doi:10.21601/ejosdr/12167
Bimenyimana, T., Bugenimana, E., Habineza, E., Bushesha, M., and Ali., M. (2022). Impact of urbanization on land use and land cover changes in growing cities of Rwanda. J. Korean Soc. Environ. Eng. 44, 258–266. doi:10.4491/KSEE.2022.44.8.258
Emiru, T., Naqvi, H. R., and Athick, M. A. (2018). Anthropogenic impact on land use land cover: influence on weather and vegetation in Bambasi Wereda, Ethiopia. spatial Inf. Res. 26, 427–436. doi:10.1007/s41324-018-0186-y
Fuyong, S. U., Wenli, L. I. U., and Zhi, W. E. N. (2020). Three-dimensional cellular automaton simulation of austenite grain growth of Fe-1C-1.5Cr alloy steel. J. Mater. Res. Technol. 9, 180–187. doi:10.1016/j.jmrt.2019.10.043
Hong, C., Burney, J. A., Julia, P., JuliaNabel, E. M. S., Mueller, N. D., Jackson, R. B., et al. (2021). Global and regional drivers of land-use emissions in 1961–2017. Nature 589, 554–561. doi:10.1038/s41586-020-03138-y
Hu, Y., Zheng, Y., and Zheng, X. (2013). Simulation of land-use scenarios for Beijing using CLUE-S and Markov composite models. Chin. Geogr. Sci. 23, 92–100. doi:10.1007/s11769-013-0594-9
Humphreys, D. (2009). Deforestation and the crisis of global governance. New York: Taylor & Francis.
Li, C., Yang, M., Li, Z., and Wang, B. (2021). How will Rwandan land use/land cover change under high. Appl. Sci. 11, 5376. doi:10.3390/app11125376
Liang, X., Guan, Q., Clarke, K. C., Liu, S., Wang, B., and Yao, Y. (2020). Understanding the drivers of sustainable land expansion using a patch-generating land use simulation (PLUS) model: a case study in Wuhan, China. Comput. Environ. Urban Syst. 85, 101569. doi:10.1016/j.compenvurbsys.2020.101569
Liang, X., Guan, Q., Clarke, K. C., Liu, S., Wang, B., and Yao, Y. (2022). User manual of the PLUS model. Wuhan: High-performance Spatial Computational Intelligence Lab.
Liang, X., Liu, X. P., Li, D., Zhao, H., and Chen, G. Z. (2018). Urban growth simulation by incorporating planning policies into a CA-based future land-use simulation model. Int. J. Geogr. Inf. Sci. 32, 2294–2316. doi:10.1080/13658816.2018.1502441
Liu, X. P., Liang, X., Li, X., Xu, X. C., Ou, J. P., Chen, Y. M., et al. (2017). A future land use simulation model (FLUS) for simulating multiple land use scenarios by coupling human and natural effects. Landsc. Urban Plan. 168, 94–116. doi:10.1016/j.landurbplan.2017.09.019
Lu, C., Qi, X., Zheng, Z., and Jia, K. (2022). PLUS-model based multi-scenario land space simulation of the lower yellow river region and its ecological effects. Sustainability 14, 6942. doi:10.3390/su14116942
Mei, Z., Wu, H., and Li, S. (2018). Simulating land-use changes by incorporating spatial autocorrelation and self-organization in CLUE-S modeling: a case study in Zengcheng District, Guangzhou, China. Front. Earth Sci. 12, 299–310. doi:10.1007/s11707-017-0639-y
Silva, A. R., Silva, A. R., and Gouvea, M. M. (2019). A novel model to simulate cloud dynamics with cellular automaton. Environ. Model. Softw. 122, 104537. doi:10.1016/j.envsoft.2019.104537
Wang, J., Zhang, J., Xiong, N., Liang, B., Wang, Z., and Cressey, E. L. (2022). Spatial and temporal variation, simulation and prediction of land use in ecological conservation area of western beijing. Remote Sens. 14, 1452. doi:10.3390/rs14061452
Xu, L., Liu, X., Tong, D., Liu, Z., Yin, L., and Zheng, W. (2022). Forecasting urban land use change based on cellular automata and the PLUS model. Land 11, 652. doi:10.3390/land11050652
Yang, R., Chen, S., and Ye, Y. (2022). Toward potential area identification for land consolidation and ecological restoration: an integrated framework via land use optimization. Environ. Dev. Sustain. 26, 3127–3146. doi:10.1007/s10668-022-02767-9
Yu, X., Shan, L., and Wu, Y. (2021). Land use optimization in a resource-exhausted city based on simulation of the F-E-W nexus. Land 10, 1013. doi:10.3390/land10101013
Yue, H., Fangting, X., Zhenjiang, S., and Zhu, S. (2023). Evolution and multi-scenario prediction of land use and carbon storage in jiangxi province. Forests 14, 1933. doi:10.3390/f14101933
Zambia Statistics Agency (2022). Census of the population and housing. Lusaka: Zambia Statistics Agency.
Zhang, S., Yang, P., Xia, J., Wang, W., Cai, W., Chen, N., et al. (2022). Land use/land cover prediction and analysis of the middle reaches of the Yangtze River under different scenarios. Sci. total Environ. 833, 155238. doi:10.1016/j.scitotenv.2022.155238
Keywords: LULC, PLUS model, driving factors, cellular automata, land-use simulation, Ndola district
Citation: Mutale B and Qiang F (2024) Modeling future land use and land cover under different scenarios using patch-generating land use simulation model. A case study of Ndola district. Front. Environ. Sci. 12:1362666. doi: 10.3389/fenvs.2024.1362666
Received: 28 December 2023; Accepted: 21 February 2024;
Published: 11 March 2024.
Edited by:
Kun Jia, Beijing Normal University, ChinaReviewed by:
Cuicui Jiao, Sichuan University of Science and Engineering, ChinaGuoqi Wen, Laval University, Canada
Copyright © 2024 Mutale and Qiang. This is an open-access article distributed under the terms of the Creative Commons Attribution License (CC BY). The use, distribution or reproduction in other forums is permitted, provided the original author(s) and the copyright owner(s) are credited and that the original publication in this journal is cited, in accordance with accepted academic practice. No use, distribution or reproduction is permitted which does not comply with these terms.
*Correspondence: Fan Qiang, bG50dWZhbnFpYW5nQDEyNi5jb20=
†ORCID ID: Bwalya Mutale, orcid.org/0009-0000-2158-5624