 Yangying Zhan1,2
 Chunyi Li
94% of researchers rate our articles as excellent or good
Learn more about the work of our research integrity team to safeguard the quality of each article we publish.
Find out more
ORIGINAL RESEARCH article
Front. Environ. Sci., 25 July 2024
Sec. Water and Wastewater Management
Volume 12 - 2024 | https://doi.org/10.3389/fenvs.2024.1352544
This article is part of the Research TopicImpact of Climate Changes on Groundwater ResourcesView all 6 articles
The blue and green water resource distribution of the Jing River Basin, a cradle of Chinese civilization on the Loess Plateau, was studied using the Soil and Water Assessment Tool and the Sequential Uncertainty Fitting algorithm (vers. 2). Understanding these resources aids in the ecological preservation of the Yellow River Basin and its high-quality development. Future climate conditions were simulated using the Statistical Downscaling Model (SDSM). The data came from the Shared Socioeconomic Pathway (SSP) projections (SSP1-2.6, SSP2-4.5, and SSP5-8.5) in the Canadian Earth System Model (vers. 5), covering the 2030s, 2060s, and 2090s (based on 2015–2045, 2046–2075, and 2076–2100 climate projections, respectively). The SDSM accurately simulated temperature and precipitation trends, with its temperature predictions being more accurate. The results show that the maximum temperature, minimum temperature, and precipitation tend to increase under the three future climate scenarios, and the amount of blue and green water continues to increase in the future, with the SSP5-8.5 scenario showing the highest amount of blue and green water, and the SSP1-2.6 scenario showing the lowest amount of blue and green water, in terms of the climate scenarios. In terms of temporal distribution, 2090s has the most abundant blue and green water and 2030s has the least blue and green water content. Forecasting blue and green water changes due to climate change is vital for regional water management and risk assessment.
Given that water scarcity is one of the three significant global systemic risks, learning how to sustainably manage water resources is a current research hotspot (Hoekstra, 2014). The inevitable impact of global warming on meteorological and hydrological factors such as evaporation, precipitation, and runoff could also result in a significant increase in the frequency of the occurrence of extreme hydrological events (Berg et al., 2013). Evaluating both blue and green water resources is crucial for enhancing the management of water resources since it helps determine water availability and security (Dey and Remesan, 2022). Blue water refers to “exposed water,” which includes river runoff on the land surface, soil runoff, and subsurface runoff (Chahed et al., 2008). Falkenmark and Rockström (2006) used the term “green water” to refer to “hidden water,” which encompasses both water in the soil and water that has evaporated. Green water is the most crucial source of water for food production, supporting rain-fed agriculture on about 80% of the global arable land area and providing food security to more than seven billion people worldwide (Alexandratos, 1995). Blue water affects human life and development from several perspectives, such as by providing water for daily life, industrial production, and agricultural irrigation (Zhao D. et al., 2021). Consequently, analyzing future water cycle patterns from the perspective of climate change, while particularly assessing blue and green water resources, can improve the equilibrium between water supply and demand as well as provide guidance for managing water resources in a basin, optimizing the environment, and enhancing the configuration of the water cycle.
Situated in northwest China’s arid and semi-arid terrain, the Jing River Basin has advanced agricultural and animal husbandry practices (Xie et al., 2020). In the basin, agriculture and animal husbandry have prospered. Numerous issues, including rising water demand and excessive water consumption, have resulted in the basin (Shen et al., 2018; Zhao B. et al., 2021). The Jing River Basin has had significant constraints on its social and economic development due to a number of issues, including excessive water usage (Zhang et al., 2018). Because a lack of available water resources has created a substantial danger for human society as a result of the continued warming of the global climate (Kim et al., 2007; Chu et al., 2010), it is crucial to investigate the possibilities for future blue and green water transitions in the Jing River Basin. For Jing river, climate variability is a serious obstacle to efforts aimed at sustainable development and the elimination of poverty (Chen Y. et al., 2020). Jing river is the most vulnerable region to the consequences of climate change because of its reliance on rainfed agriculture. This position has also been influenced by its weak ability to adapt and increasing reliance on natural resources for subsistence (Chen Y. et al., 2020; Yang et al., 2023). Climate change is currently having a significant impact on the country’s revenue, thus study into creating the best adoption strategies based on scientific data has focused on this problem. Compared to other global climate models, the Coupled Model Intercomparison Project Phase 6 (CMIP6) increases the accuracy of the model’s ability to predict future climatic data by simulating future climate with physical and biological processes that are more comparable to the actual ones (Chen H. et al., 2020; Haji-Aghajany et al., 2022). In light of the above, In order to increase the future climate’s accuracy, the Jing River Basin’s future climate is simulated in this research using cmip6.
This paper simulates the future climate of the Jing River Basin using the CMIP6 CanESM5 model. Compared to CMIP5, CMIP6 offers a more trustworthy understanding of the hydrologic effects of climate change and draws on results from earlier community modeling projects (Bian et al., 2021). When CMIP6 and CMIP5 homology modes (such as CanESM5 mode in CMIP6 and CanESM2 mode in CMIP5) are examined, it is discovered that CMIP6 homology modes have a significantly better simulation capability than CMIP5 homology modes (Wang et al., 2021; Yang et al., 2021). CanESM5 is a global climate model capable of simulating and predicting the complex interactions between the atmosphere, oceans, land, and cryosphere, which is particularly important for a country like China with a vast area and diverse climates. CanESM5 has a high degree of accuracy and reliability in simulating climate change and extreme weather events in China, which is important for addressing the challenges posed by climate change and formulating The high accuracy and reliability of CanESM5 in modeling climate change and extreme weather events in China is of great significance in addressing the challenges posed by climate change and formulating coping strategies (Hamed et al., 2022).
Song et al. (2021) used the CMIP6 model to predict climate extremes in China, including simulating the spatial distribution and trends of temperature patterns. Zhao B. et al. (2021) analyzed the change in future rainstorm risk in China based on the CMIP6 model; the results showed that the number of days with rainstorms is predicted to continue to increase in an increasingly warm global climate, while the frequency and intensity of rainstorms will also tend to increase. Xiao et al. (2021) used CMIP6 model data to predict temperature and precipitation in the Yellow River Basin for the next 86 years based on a multi-model averaging approach; the results compared the hydrological environment of the future basin under four warming scenarios, including 1.5°C and 2.0°C global warming, carbon neutrality, and carbon peaking; it was found that drought in the Yellow River Basin would be mitigated the most under carbon neutral conditions. The Jing River Basin, one of the major tributaries of the Yellow River’s upper reaches, has a significant influence on Northwest China’s socioeconomic development and ecological environment. The forecasting and management of future water supplies in the Jing River Basin have gained significant importance due to the acceleration of global climate change.
Blue water and green water changes can be simultaneously assessed with success using hydrologic modeling. The Soil and Water Assessment Tool (SWAT) model is a dispersed watershed hydrological model that can simulate a lengthy time series of processes involved in the hydrological cycle (Arnold et al., 1995; Hlavinka et al., 2011). For instance, Chen et al. (2022) combined the SWAT and downscaling models with future scenario meteorological data from multiple models of CMIP6 and data required for hydrological models to simulate future runoff in the Huai River. In line with the findings, the typical amount of runoff that occurs each year is expected to keep increasing for the foreseeable future. Chen et al. (2021) were able to estimate runoff in the Palo Duro watershed (Texas, United States) using the SWAT model, as well as explore the geographical and temporal distribution characteristics of blue–green water resources in this watershed. Ultimately, the critical role of blue and green water in the expansion of crop yields was elucidated. Woldesenbet et al. (2022) analyzed the blue–green water in the Nile River Basin using the SWAT model, focusing on the different types of land use occurring in the basin. Protecting the watershed ecology and managing the environmental sustainability of water resources involved investigating the yield estimation and regional and temporal distribution patterns of blue-green water in the Jing River using the SWAT model as a technique.
In the Yellow River Basin, the Jing River is a small and transparent tributary originating in the Liupan Mountain, which has been designated as a national natural reserve. Due to extreme climate change and the basin’s unequal regional and temporal distribution of precipitation, the basin’s hydrology is becoming increasingly unstable; the Jing River Basin is not only one of the severe soil erosion sites on the Loess Plateau but also one of the storm-prone areas in northwestern China (Xu et al., 2010). Therefore, examining the water resources of the Jing River Basin from the perspective of climate processes is critical for planning water allocation and consolidating the ecosystem balance in this basin. However, previous studies have primarily explored historical changes and drivers of runoff in this basin (Wang et al., 2014; Huang et al., 2017; Li et al., 2022). To the best of our knowledge, current research has not focused on the amount of blue and green water in the Jing River Basin and the spatial distribution thereof and progress over time in light of climate change. Thus, we selected the Jing River as the study area. Therefore, the following are the main goals of this study: (1) employ the simulation results of the SWAT model to analyze the spatial and temporal change characteristics of blue and green water in the Jing River Basin, including the historical trend and the future long-term series; (2) utilize the SDSM model to model the future climate change in the Jing River Basin; (3) analyze the patterns of changes in the baseline and future periods in terms of the spatial and temporal changes of blue and green water.
The Jing River Basin lies in the middle of the Loess Plateau in China, with geographical coordinates of 34°46′–37°19′N and 106°14′–108°42′E, with an elevation of 440–2200 m, and topography of northwest high and southeast low (Figure 1). The Jing River, which begins in the eastern base of Liupan Mountain in Ningxia Autonomous Region in China, is the first major tributary of the Wei River. Notably, the first-class watershed of China’s Yellow River covers a total distance of 455.1 km, with an area of 45,421 km2, and an average runoff of 2.140 billion m3, flowing through Ningxia as well as Gansu and Shaanxi provinces. The annual average temperature of the basin is 8°C. The highest average temperature (29°C) occurs in July, and the lowest average temperature (−13°C) is observed in January. The yearly precipitation ranges from 350 to 650 mm across this basin. The summer climate is wet and rainy, with more than 60% of the annual precipitation falling in summer. The arable land in the flat and vast Jing River Basin accounts for nearly 60% of the entire basin area, providing a guarantee for food production in the northwest of China.
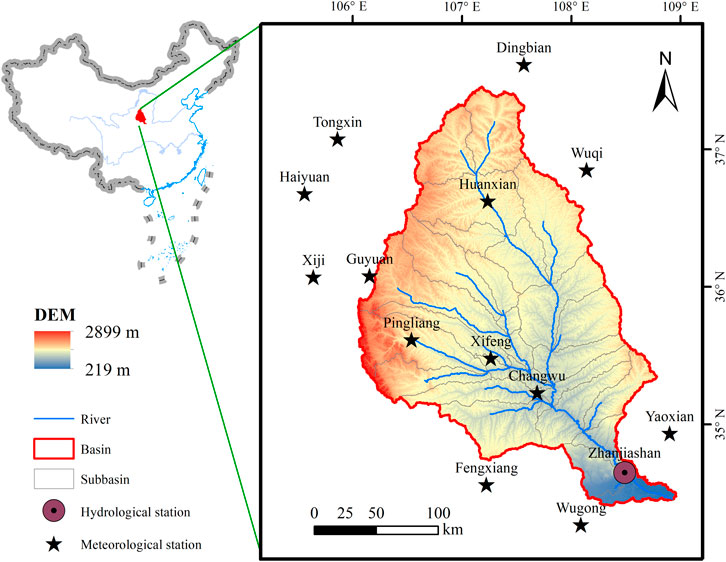
Figure 1. A topographical profile of the Jing River Basin created using a digital elevation model (DEM) with locations of hydrological and meteorological stations in and near the basin. An inset map shows the geographical location of the basin in an outline map of China.
The SWAT model data inputs of the present study are diverse and include both geographical and data display. Spatial data generally contains georeferenced DEM data, soil type allocation data, land use spread data, and DEM data from the geospatial data cloud. These data were downloaded, preprocessed, and then cropped based on the watershed boundaries. Land use data is GlobeLand30 data (https://shop.geospatial.com/), which had been classified into seven types according to the primary classification criteria in the latest revision of the Current Land Use Classification system of China (GB/T21010-2017); land categories include agricultural land, forest areas, grassland, marsh, water bodies, urbanized land, and bare soil. Soil data (https://gaez.fao.org/pages/hwsd) were applied in the SWAT model by creating a soil database, which had to be converted to a uniform soil grain size standard (US-made) before the model could be run; soil parameters were calculated using Soil-Plant-Air-Water (SPAW) software. The China Meteorological Science Data Sharing Service (1979–2019) was consulted for meteorological information (https://climate-scenarios.canada.ca/); solar radiation data were calculated based on day-by-day sunshine hour data (Jin et al., 2005). The hydrological data were obtained from the Hydrological Yearbook of the People’s Republic of China; month-by-month runoff data from 1981 to 2019 were selected from data provided by the Zhangjiashan Hydrological Station. The spatial data supplied to the SWAT model required a unified projection coordinate system; the projection coordinate system employed in this research is WGS 1984 UTM Zone 49N.
The data needed for the SDSM include National Centers for Environment Prediction (NCEP) reanalysis, CanESM5 atmospheric circulation model, and historical meteorological data. The NCEP reanalysis information for 26 daily series atmospheric circulation factors for 1979–2014 CanESM5 data were obtained from the Canadian Climate Impact Scenarios Network (https://climate-scenarios.ca/); based on the Jing River Basin and the latitude and longitude of each weather station selected for the BOX_039X_45Y grid, three Shared Socioeconomic Pathway climate change scenarios, SSP1-2.6, SSP2-4.5, and SSP5-5.8, were employed. From 1979 to 2014, measurements were taken of the daily maximum temperature, daily lowest temperature, and daily precipitation.
The SWAT simulation of the irrigation services procedures in a watershed required adherence to the water balance principle, formulated shown in Eq. 1:
where
The equations should be inserted in editable format from the equation editor. To simulate future precipitation and air temperature, the SDSM model integrates several linear regression and meteorological data generator approaches (Zhou and Li, 2002; Li et al., 2022). Where there is no temperature stochasticity, only precipitation needs to be considered (Wilby et al., 2003); the principle is as follows.
(1) Calculate the probability of precipitation as shown in Eq. 2:
where
(2) Simulate the precipitation as shown in Eq. 3:
where
The model’s applicability depends on four indicators including R2, Nash-Sutcliffe efficiency (NSE), percent bias (PBIAS), and root mean square error (RSR). First, R2 indicates the fit between the model simulation and the input measured values; the closer the value is to 1, the less the difference is between the simulated values of the model and the measured input values, the better the fit between the two results, and the smaller the deviation between the two results (Zuo et al., 2015). Percent bias is the average trend between model-simulated values and input-measured values, with PBIAS > 0 indicating small model-simulated values and, conversely, PBIAS > 0 indicating large model-simulated values (Geza and McCray, 2008). The RSR is the proportion of the average root mean square error to the confidence interval of the recorded input values; the lower the significant value of the RSR, the more accurate the simulation (Gupta et al., 1999).
The R2, NSE, PBIAS, and RSR were calculated as shown in Eqs 4–7:
where
The calculated blue–green water yields depend on SWAT model outputs, where the output of blue water yield is expressed as the value of water yield per sub-basin plus deep aquifer recharge. The green water yield is the sum of the actual evapotranspiration and soil water content for each RHU in the output (Moriasi et al., 2007). The Eqs 8–10 were applied to derive the coefficients for blue, green, and green water:
where G and B indicate the quantity of green and blue water resources, respectively, and GWC indicates the green water coefficient.
The river network water system of the Jing River Basin was extracted using DEM data and divided into 29 sub-basins. Then, using land use, soil, and weather data, 342 hydrological response units were created and entered into the SWAT model one at a time. To reduce the effect of initial conditions on the model simulation results (Akhavan et al., 2010), 2 years of data from 1979 to 1980 were used as the model warm-up period, the model past an exponential period of 1981–2000, while the model evaluation period was 2001–2019. The data inputs and parameters in both calibration and validation in the SWAT model are consistent.
There are many parameters in the SWAT model, each with a distinct physical meaning. Parameter values must be changed during model calibration and validation in order to make the modeled runoff compatible with the observed data. The suggested runoff matches the data that was observed. Certain parameters have minimal impact on the model simulation, although certain parameters that are sensitive have minimal impact as well. Certain sensitive parameters have a significant influence on the model simulation, whereas other parameters have no effect. Sensitivity assessments of model parameters can be a helpful modeling tool to determine which parameters have a higher impact and to grade them. and rate calibration can help minimize the amount of parameters that require adjustment. The Lat-in hypercube sampling - one at a time (LHS - OAT) method in the SWAT CUP2019 software was used to do parameter sensitivity analysis. This method regresses the parameters produced by Latin hypercube sampling against the values of the objective function, analyzing each parameter individually. The SWAT-calibration-and-uncertainty-analysis program was applied to conduct a global risk assessment of 28 runoff three-dimensional computer factors (Zadeh et al., 2017); meanwhile, the 16 parameters with the highest sensitivity were finally selected as the rate parameters for the Jing River Basin (Table 1) (Figure 2).
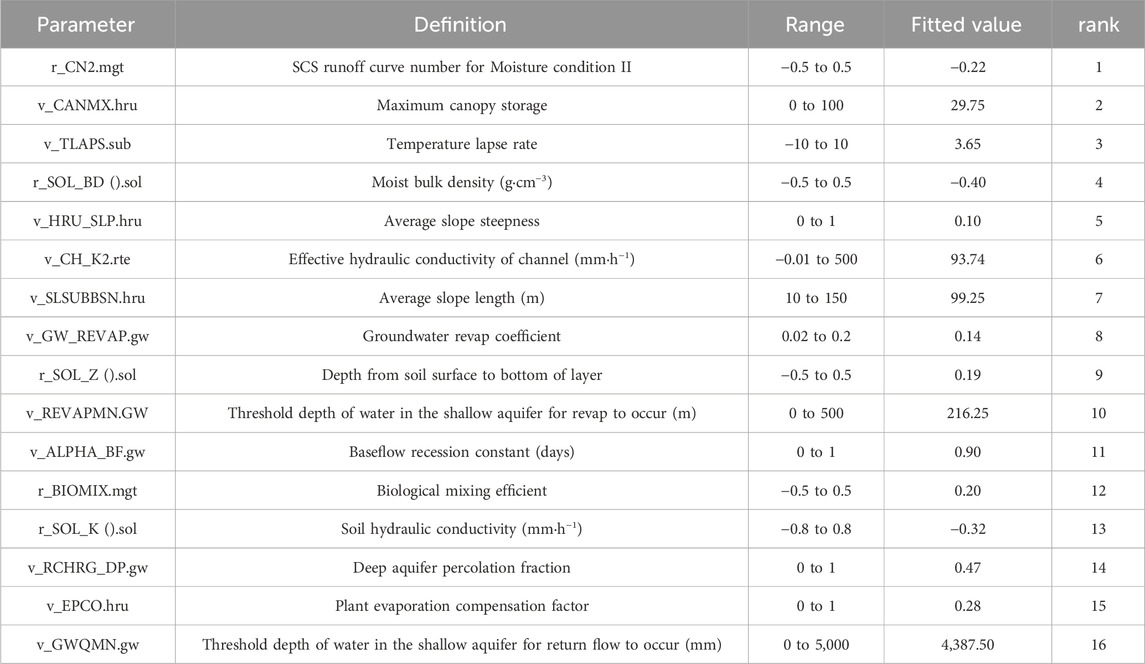
Table 1. Definition of parameters and calibration results.

Figure 2. Parameter sensitivity result.
The SWAT model simulation results (Figure 3), rate regular, and validation period results) are shown in Table 2. According to Morsi, the model provides a better simulation when R2 > 0.7, NSE > 0.5, |PBIAS| ≤ 25%, and RSR ≤ 0.7 (Singh et al., 2005) (Table 2). According to the findings in the present study, it appears that the SWAT model was a good choice for analyzing how the influence of climate change would manifest itself in the blue–green water resources of the Jing River Basin.
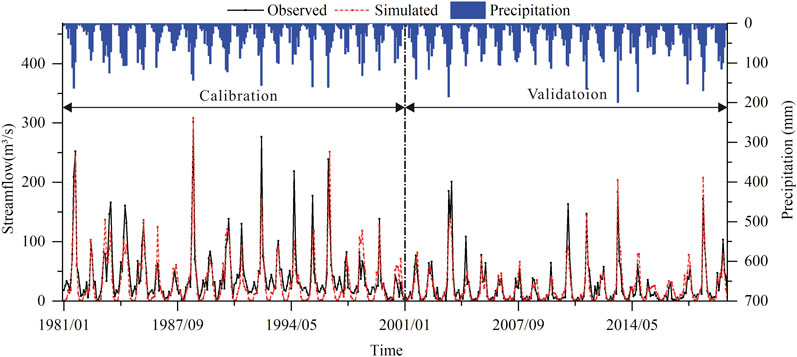
Figure 3. Monthly precipitation, observed streamflow, and simulated streamflow during the calibration and validation periods at a hydrological station.
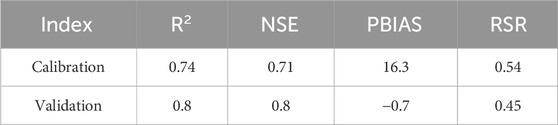
Table 2. Simulation index results.
The SWAT water balance analysis is critical to assessing the model’s performance during the calibration and validation phases to determine the degree to which water constituents are predicted. Table 3 presents the annual basin averages of the different water balance elements for the rate period and validation period simulated by the model. Green water is the sum of actual evapotranspiration (ET) and soil water content (SW). Soil water content (SW) represents the water content of the soil profile at the end of the period. Actual evapotranspiration (ET) is an important component of green water, and the predicted high evapotranspiration rate may be related to the vegetation type and high temperatures in the area. Blue water is the sum of total water yield (WYLD) and deep aquifer recharge (DA_RCHG). The total water yield (WYLD) represents the amount of water flowing out of the basin outlet during the time step, which mainly consists of the amount of groundwater recharged to the river (GW_Q), the lateral flow to the river (LATQ), and the amount of surface runoff recharged to the river during the time step (SURQ). The contribution of groundwater to the river (GW_Q) in the Jing River Basin is almost zero, and GW_Q refers to the amount of water returning to the river from the shallow aquifer during the time step. The topographic slope has a huge impact on lateral flow (LATQ), which is calculated as a percentage of mean annual rainfall and is small in shallow-slope terrain. Precipitation is the main determinant of surface runoff (SURQ). Typically, changes in deep seepage and streamflow are proportional to precipitation, indicating the importance of precipitation in semi-arid regions. Deep aquifer recharge (DA_RCHG) indicates the amount of water entering the deep aquifer from the root zone during the time step. Figure 4 shows the water balance components at the annual scale for the Jing River Basin, the results of this study are consistent with previous studies (Wu et al., 2022; Luo and Moiwo, 2023).
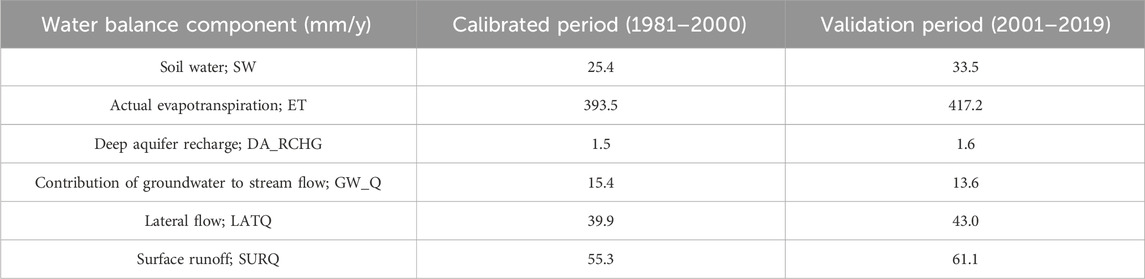
Table 3. Water balance components calculated with SWAT model.
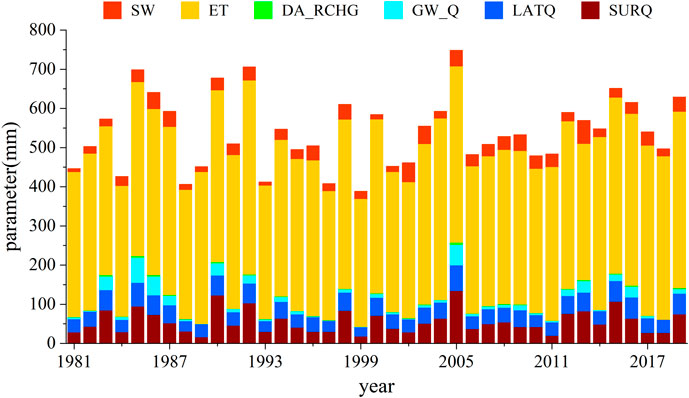
Figure 4. Water balance diagrams for calibration and validation in the SWAT model.
The SDSM downscaling method has the following steps. First, the relevant forecast factors are selected, and the relationship between them is established with forecast quantities based on statistical methods; then, the factors are verified with measured data. Finally, the future daily series of the meteorological elements at the station are produced by feeding the large-scale meteorological parameters from the CanESM5 model into the established model. The principles for selecting predictors for SDSM are as follows: (1) a strong correlation and consistency exists between the predictors and the forecast quantities; (2) the predictors and the forecast quantities are linked by physical processes; (3) the links between the predictors are weak or uncorrelated; (4) the predictors are common to both the CanESM5 model and the NCEP reanalysis data; and (5) the predictors can be accurately simulated by CanESM5.
The years 1979–2000 were selected as the model rate period and the years 2001–2014 as the model validation period to construct a daily model of the mathematical connection between anticipated components and anticipated quantities, in which the maximum and minimum temperatures were selected as unconditional processes while precipitation was selected as a conditional process. Since the precipitation data was not normally distributed, these data were transformed by a quadratic root transformation (Wilby et al., 2002). The model results were evaluated using explained variance (R-squared) and standard error (SE). Table 4 shows that related scholars have indicated that the mean value of the explained variance of the daily maximum temperature at these 13 stations was above 0.7, with a standard error of 2.01°C–2.40°C. The mean value of the explained variance of the daily minimum temperature was above 0.6, with a standard error of about 2°C (Table 4). The explained variance of the daily rainfall was 0.20–0.35, with a standard error of 0.21–0.30 mm. Related studies have shown that the explained variance in temperature is more reasonable when it falls above 0.6 (Jia et al., 2015) (Table 4). This paper’s lowest explained precipitation variance is consistent with the literature’s findings, primarily because the precipitation process is complex and influenced by multiple factors (Bai et al., 2022). In general, the research method used in this paper is more reliable than previous methods, the model’s temperature and precipitation are simulated with high accuracy in both the rate and validation periods, the simulated values compare well with the measured values, and the assessment of the future climate by the SDSM model satisfies the requirements that were anticipated.

Table 4. Performance assessment of SDSM during validation period (2001–2014).
The daily maximum temperature, minimum temperature, and precipitation for each month at 13 stations in the Jing River Basin from 1979 to 2014 were used as the base period; the same daily collected from 2015 to 2100 were derived using the CanESM5 model SSP1-2.6, SSP2-4.5, and SSP5-5.8 emission scenario data. Figures 3, 5, 6 show a box plot comparing the base period and the future forecast data. The five short horizontal lines of the box plot represent the upper limit, upper quartile position, median value, lower quartile position, and lower limit in order from top to bottom; any points that are not in the range are called individual extreme points.
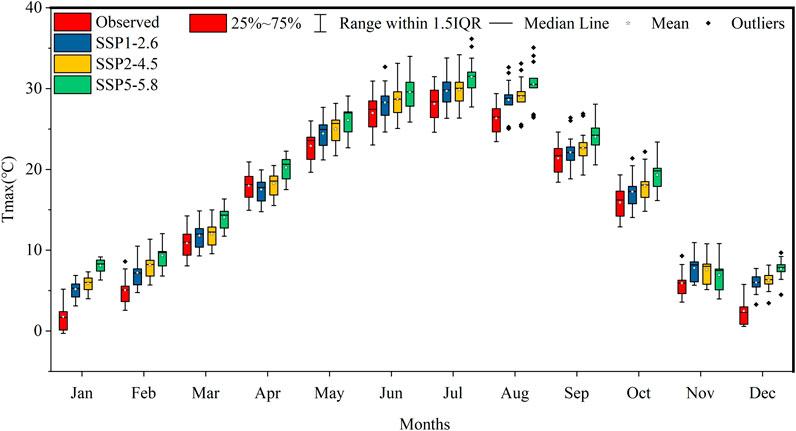
Figure 5. Monthly mean maximum temperature for the base and forecast periods in the Jing River Basin. Note: Shared Socioeconomic Pathway projections include SSP1-2.6, SSP2-4.5, and SSP5-8.5.
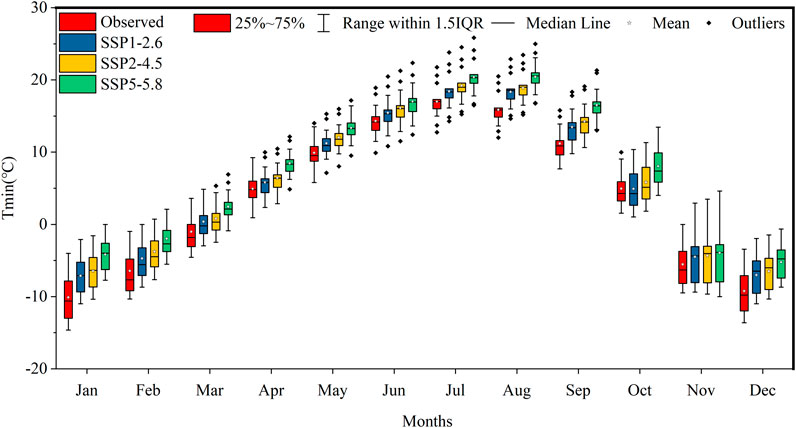
Figure 6. Monthly mean lowest temperature for the base and forecast periods in the Jing River Basin. Note: Shared Socioeconomic Pathway projections include SSP1-2.6, SSP2-4.5, and SSP5-8.5.
According to the assessment results of the three simulations (SSP1-2.6, SSP2-4.5, and SSP5-8.5), the future monthly average maximum temperature in the study area is predicted to increase significantly (Figure 5). In particular, a significant increase in monthly mean temperatures in January and December was predicted. For instance, based on the average of January observations, the warming of SSP1-2.6, SSP2-4.5, and SSP5-8.5 was predicted to be 3.42, 4.13, and 6.32°C, respectively; in December, in temperatures were predicted to increase by 3.54, 3.83, and 5.12°C in SSP1-2.6, SSP2-4.5, and SSP5-8.5, respectively. Subsequently, more significant increases were predicted in February and August, with SSP1-2.6, SSP2-4.5, and SSP5-8.5 increasing by 2.14, 3.13, and 4.29°C in February, respectively, and SSP1-2.6, SSP2-4.5, and SSP5-8.5 increasing by increasing by 2.26, 2.63, and 4.19°C in August. However, the warming in the other months was insignificant, with SSP1-2.6, SSP2-4.5, and SSP5-8.5 increasing by about 1.5, 2, and 2.5°C, in other months, respectively.
The future monthly mean minimum temperature in the Jing River Basin was predicted to increase significantly (Figure 6). Simulated temperature under the SSP1-2.6 scenario increased by 1°C–3°C relative to the baseline period, with significant temperature increases in January, August, September, and December, rising by 2.99°C, 2.46°C, 2.28°C, and 2.24°C, respectively, with smaller increases of about 1°C predicted in other months. Meanwhile, in the SSP2-4.5 scenario, the predicted temperatures were 1°C–4°C higher relative to that in the base period, with temperature in January and September increasing by 3.64°C and 3.08°C, respectively; under this scenario temperature increases of 2°C or more were predicted in February, May, July, August, and December while increases of about 1.5°C were predicted in other months. In the SSP5-8.5 scenario, temperature increases of 5.95°C and 5.31°C were predicted in January and September, respectively; under this scenario temperature increases of 4.45°C, 4.54°C, and 4.01°C were predicted in February, August, and December, respectively, while increases in other months were about 3°C with overall temperature increases of 3°C–6°C relative to the base period.
The projected mean monthly rainfall in the Jing River Basin has increased significantly during the study period (Figure 7). In particular, the predicted increase in monthly average precipitation in June and September was significant. For illustration, according to the average June observational data, the precipitation in the SSP1-2.6, SSP2-4.5, and SSP5-8.5 scenarios rose by 0.91, 1.3, and 1.63 mm, respectively, while in September the projected increases were 1.66, 1.79, and 1.85 mm, respectively, in the same scenarios. The next more pronounced month was October, when predicted increases in precipitation of 0.25, 0.41, and 0.96 mm for the same three scenarios, respectively. However, the predicted precipitation increases in other months were insignificant in the same three scenarios increasing by about 0.1, 0.2, and 0.4 mm, respectively.
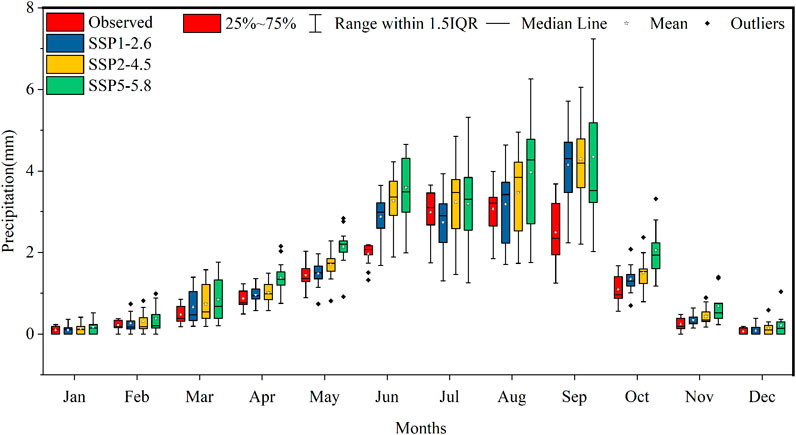
Figure 7. Monthly average precipitation for the base and projected periods in the Jing River Basin. Note: Shared Socioeconomic Pathway projections include SSP1-2.6, SSP2-4.5, and SSP5-8.5.
The altered parameters were input into the SWAT model, and the model was launched to output the hydrological data of the Jing River Basin during the base period; data related to the blue and green water resources were acquired after calculation (Figure 8). The number of green water resources in the Jing River Basin is significantly higher than the number of blue water resources; the multi-year average amount of green water resources in the reference period was 433 mm, while the quantity of blue water resources was only 109 mm; the green water coefficient was higher, as high as 80.66%. The basin contained a reasonable amount of total water resources, most notably green water resources, which were ten times more plentiful than blue water resources. This is primarily because the Jing River Basin is located in the center of the arid Loess Plateau, where precipitation is scarce, with an annual average of only 525 mm. Predicted precipitation was positively correlated with the proportion of blue–green water in the basin. In contrast, the predicted coefficient for green water was negatively linked with precipitation, demonstrating that green water resources play a crucial role in preserving an environmental balance.
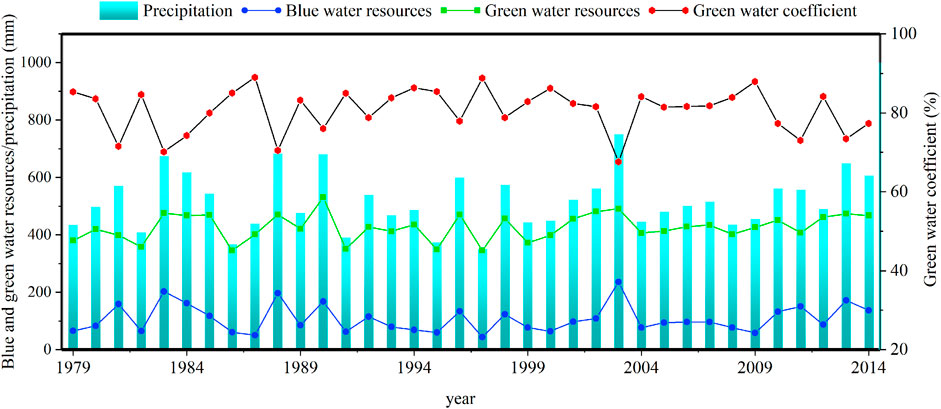
Figure 8. The annual change of blue and green water resources and the coefficients for green water from 1979 to 2014.
The predicted concentration of blue and green water resources in the Jing River Basin shows significant spatial divergence (Figure 9). The pattern of precipitation, which decreases from the southeastern to the northwestern parts of China, is reflected geographically in the range of blue and green water resources that are found across the country (Figure 9). However, the spatial distribution of the coefficient for green water is diametrically opposed to that of rainwater.
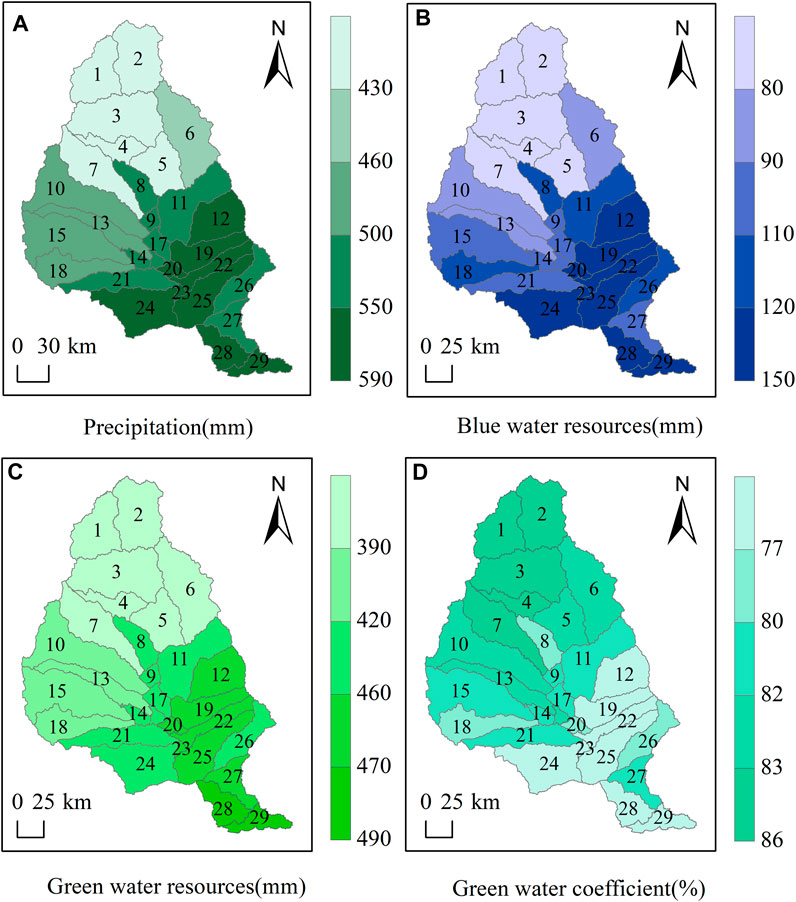
Figure 9. Spatial distribution of historical blue and green water in 29 sub-basins of the Jing River, 1979–2014; (A) annual precipitation (mm); (B) amount of blue water resources (mm); (C) amount of green water resources (mm); (D) green water coefficient (%).
Figure 9B shows the percentage of blue water in each sub-basin was within 150 mm. Among them, downstream sub-basins 28 and 29 had the most abundant blue water resources, up to 150 mm, while upstream sub-basins 2, 5, and 7 had the fewest blue water resources, with blue water amounts below 80 mm (Figure 9B). The spatial pattern of precipitation mainly influences the geographic variation of blue water resources; the two are substantially associated (p < 0.01), achieving a high correlation of 0.95. Figure 9C shows the green water resources were more abundant, with more than 490 mm of green water resources in each sub-basin. The upstream sub-basins 1–7 had fewer than 390 mm of green water on average, whereas the downstream sub-basin 28 had up to 490 mm of green water on average (Figure 9C). Among them, the downstream sub-basin 28 had the highest concentration of green water (Figure 9C). The spatial pattern of precipitation also influences the geographical distribution of green water quantity; the correlation coefficient r between the two reached 0.97 (p < 0.01). Figure 9D shows the Jing River Basin has a high percentage of green water, which is altogether greater than 75%. The geographical distribution pattern of the green water coefficient was completely contradictory to the distribution pattern of the blue–green water coefficient; the distribution of the green water coefficient became lower from the headwaters to the tailwaters downstream (Figure 9D). The lowest green water coefficients (<77%) were found in the lower reaches of sub-basins 28 and 29; in the lower and middle portions of sub-basins 2 and 7, green water coefficients of 86% were observed (Figure 9D).
Using the rate-determined SWAT model as the baseline, the downscaled daily precipitation and temperature data for 2015–2100 were input into the model. All other parameters were kept constant to obtain predictions of the amounts of blue–green water for 2015–2100 under each emission concentration scenario. Figure 10 shows that the quantity of blue–green water shows an increasing trend in different future scenarios while the coefficient of green water decreases. The degree of increase of blue–green water in three situations was predicted as follows: the scenario with the largest increase in blue–green water was SSP5-8.5, followed by SSP2-4.5 and SSP1-2.6. Table 5 provides the data related to the discussion below (Figure 10).
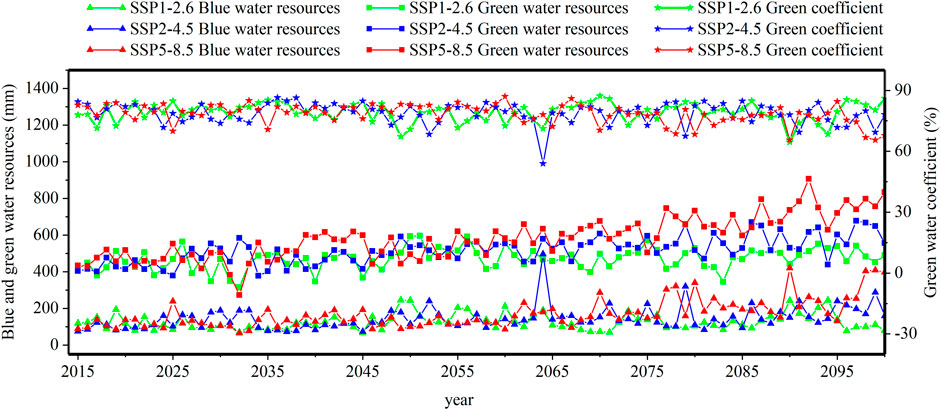
Figure 10. Blue and green water simulation in the Jing River Basin under a range of future climatic scenarios for 2015 to 2100. Note: Shared Socioeconomic Pathway projections include SSP1-2.6, SSP2-4.5, and SSP5-8.5.
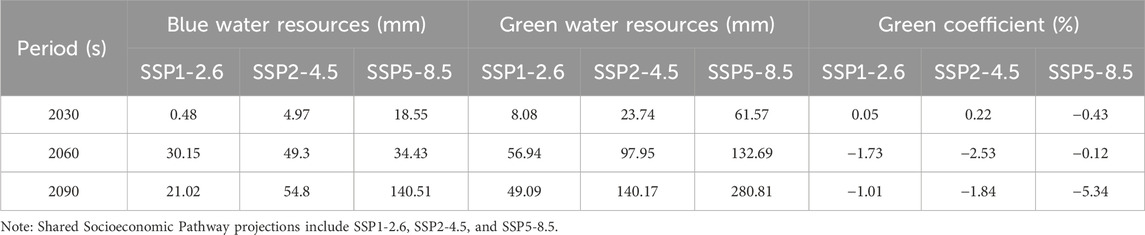
Table 5. Annual blue and green water in the Jing River Basin under climate scenarios for the 2030s, 2060s, and 2090s.
The years 2015–2100 were divided into three periods, referred to here as the 2030s (2015–2045), the 2060s (2046–2075), and the 2090s (2076–2100). Under the SSP1-2.6 scenario, the amount of blue water (1) slower growth in the 2030 period compared to the base period and (2) increased during the 2060s and 2090s relative to that of the base period. Furthermore, under the SSP2-4.5 scenario, the amount of blue water was predicted to increase greatly during 2030s, 2060s, and 2090s, with even greater increases predicted for all three periods in the SSP5-8.5 scenario (Figure 10). Overall, the 2090s were predicted to have the most blue water, while the 2030s were predicted to have the least (Figure 10).
Table 5 presents the overall trend of future green water resources in the Jing River Basin showed an increase compared with the base period. The green water resources increase by almost 110% under the SSP1-2.6 scenario and by almost 1.2 times under the SSP2-4.5 scenario. In the SSP5-8.5 scenario, the amount of green water increased also by nearly 105% (Table 5). The SSP1-2.6 and SSP5-8.5 scenarios had the least and most green water, respectively (Table 5).
In all projections and periods, the future green water coefficient is predicted to decline in comparison to the base period, except for the increase in the 2030s under the SSP1-2.6 scenario. This would occur in the 2030s. In the SSP5-8.5 scenario, the green water coefficient decreased by 5.34% in the 2090s when compared to the base period. This was because the largest amount of green water is predicted to be produced during the 2090s.
Figure 11 depicts the regional distribution of blue water in the Jing River Basin for the next three eras. The western half of the basin currently has the most plentiful blue water area; the total geographical distribution of blue water is predicted to become more abundant in the central region in the future, with a predicted tendency to diminish from the central to the north–south regions (Figure 11). The most blue water was predicted to occur in the 2060s era under the SSP1-2.6 scenario, where the volume of blue water was greater than 90 mm in all regions except in sub-basins 28 and 29 (Figure 11A). In comparison, the least amount of blue water was found in the 2030s period, where the amount of blue water was less than 150 mm in the entire basin (Figure 11A1). The blue water in the 2030s is predicted to be lowest under the SSP2-4.5 scenario (blue water < 160 mm); in sub-basins 28 and 29, the predicted blue water is < 100 mm (Figure 11B1). The blue water volume in the 2060s under the SSP2-4.5 scenario is predicted to be > 110 mm in all sub-basins except in sub-basins 1–3 (Figure 11B2). Meanwhile, the blue water volume in the 2090s under the SSP2-4.5 scenario is predicted to be > 100 mm (Figure 11B3). The SSP5-8.5 scenario is predicted to result in the least amount of blue water in the 2030s (<150 mm) in the entire basin (Figure 11C1), which is less than the historic amounts (<170 mm) predicted for the 2060s (Figure 11C2). However, blue water is predicted to be the most plentiful in the 2090s, with up to 310 mm in sub-basin 13 (Figure 11C3).
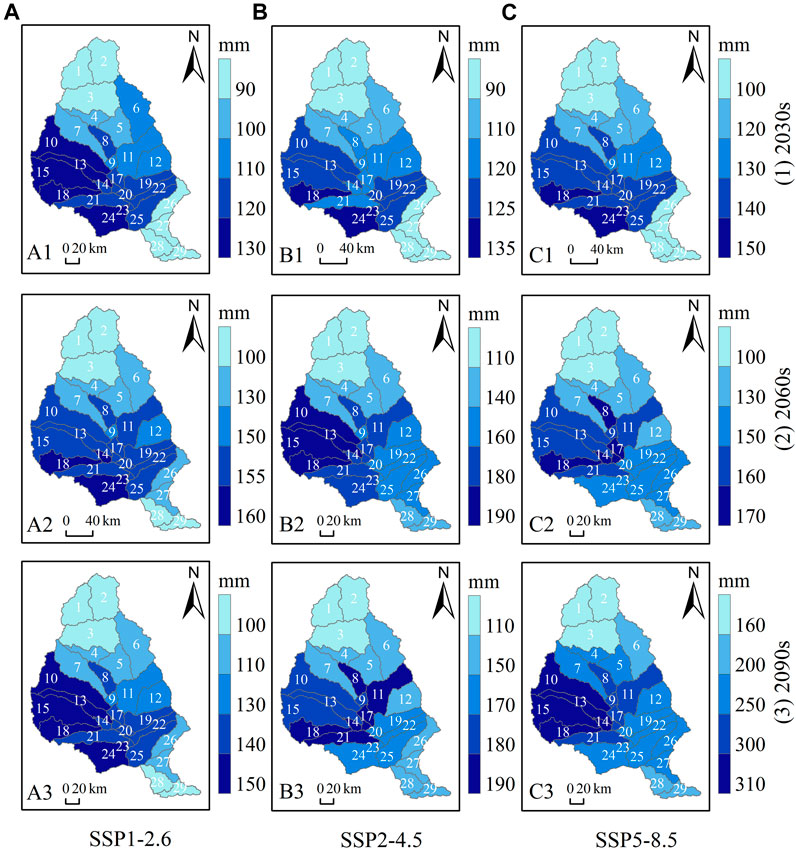
Figure 11. Spatial variations of blue water in the Jing River Basin under three Shared Socioeconomic Pathway projections: columns (A) SSP1-2.6, (B) SSP2-4.5, and (C) SSP5-8.5; rows (1) 2030s, (2) 2060s, and (3) 2090s.
The spatial distribution of green water in the Jing River Basin in the next three periods is shown in Figure 12. The projected spatial distribution pattern of green water in the Jing River Basin reveals that the southeastern region is predicted to be richer in green water, the northwestern region is predicted to be less rich in green water, and the area around the sub-basin 20 is predicted to be have the highest concentration of green water of any sub-basin (Figure 12). The regional distribution patterns of green water resources throughout the 2030s are predicted to remain stable, while the green water quantities for SSP2-4.5 and SSP5-8.5 are predicted to be very comparable to one another. By contrast, the green water volume is predicted to be smallest in the SSP1-2.6 scenario, reaching up to 480 mm in sub-basin 20 (Figure 12C). The SSP1-2.6 scenario had the least amount of green water during the 2060s, with levels predicted to be below 450 mm in sub-basins 1–7 (Figure 12A2); meanwhile, the SSP5-8.5 scenario is predicted to have the most amount of green water (>620 mm) in the entire basin (Figure 12C). The SSP1-2.6 scenario had the lowest predicted amount of green water during the 2090s (<530 mm) throughout the entire basin (Figure 12A). The SSP5-8.5 scenario had the highest predicted amount of green water, with up to 840 mm in sub-basins 26 and 27 (Figure 12C). In the SSP1-2.6 scenario, the 2090s are projected to have the least amount of predicted green water, at 420 mm (Figure 12A3).
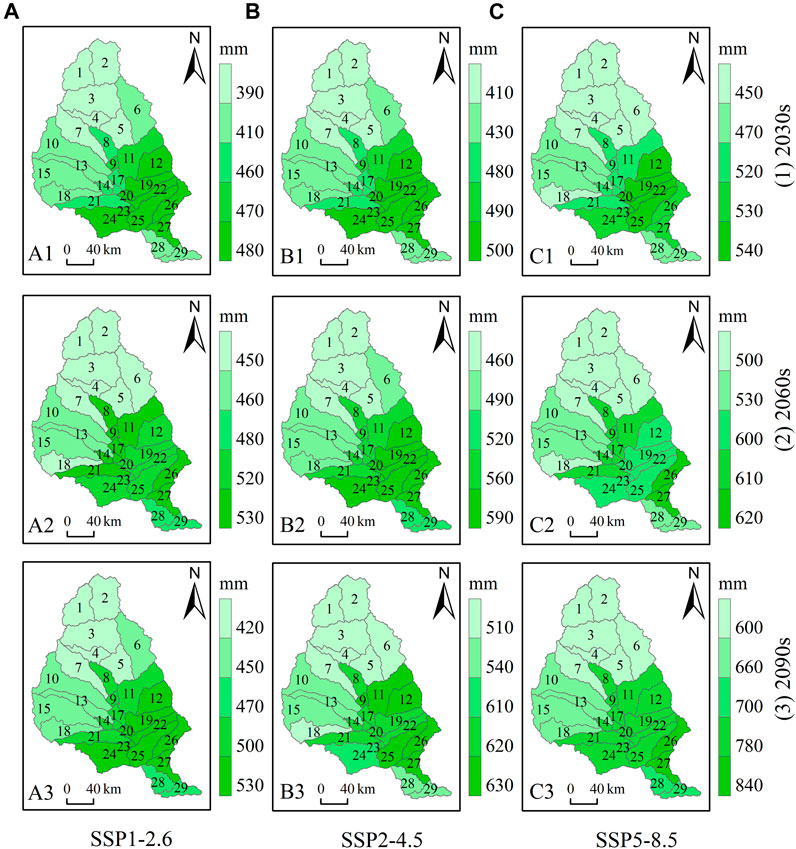
Figure 12. Spatial differences of green water in the Jing River Basin under three Shared Socioeconomic Pathway projections: columns (A) SSP1-2.6, (B) SSP2-4.5, and (C) SSP5-8.5; rows (1) 2030s, (2) 2060s, and (3) 2090s.
The predicted green water coefficients of the Jing River Basin in the next three time periods are shown in Figure 13. The spatial distribution pattern of future green water coefficients in the Jing River Basin is predicted to be very different from those of blue water, with a high north-south pattern overall, low in the central region, and the lowest green water coefficient in the western region of the basin (Figure 13). Under the SSP1-2.6 scenario, it was predicted that the era in the 2030s had the largest green water coefficient, which was above 77% for the entire basin (Figure 13A1). In comparison, the SSP5-8.5 scenario is predicted to have the lowest green water coefficient in the 2090s timeframe, which was below 79.5% for the entire basin (Figure 13C2).
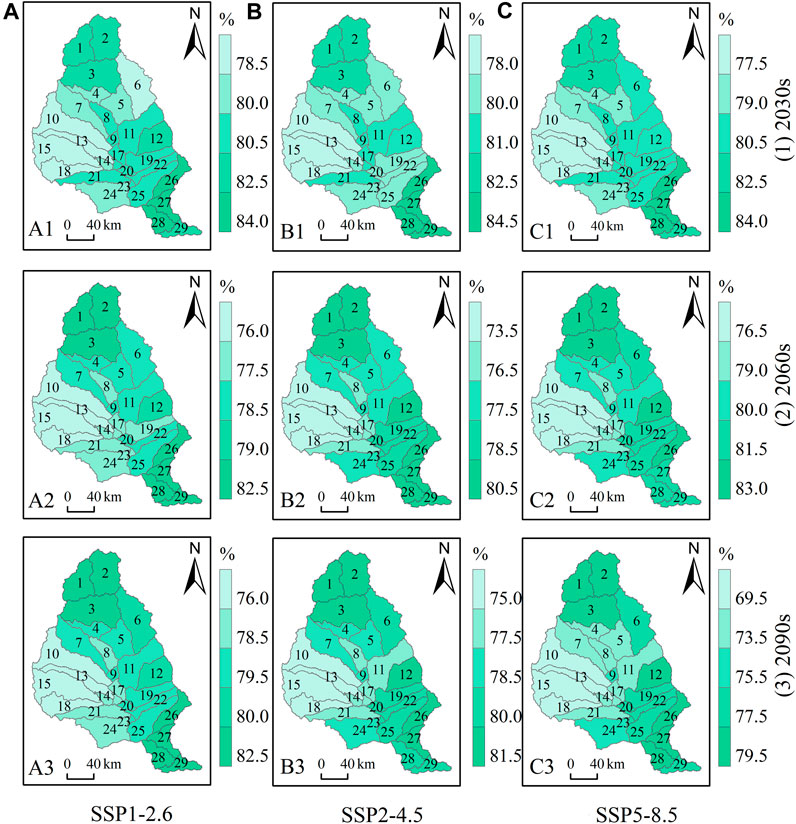
Figure 13. Spatial changes of green coefficient in the Jing River Basin under various three Shared Socioeconomic Pathway projections: columns (A) SSP1-2.6, (B) SSP2-4.5, and (C) SSP5-8.5; rows (1) 2030s, (2) 2060s, and (3) 2090s.
A significant amount of water resources in semi-arid and arid regions are made up of green water. The process of vegetation evapotranspiration on the basin’s surface has consumed green water as green water flow, which is appropriate for the semi-arid and sub-humid climate features of the Jing River. Our research indicates that the Jing River Basin has a green water coefficient of 90% or higher, which is in line with data from the Yellow River Basin headwaters (Zhang et al., 2014). Additionally, Liu et al. (2021) discovered that between 2010 and 2018, the Yellow River Basin’s green water amount was greater than its blue water amount. The patterns observed in the blue water and precipitation spatial and temporal distributions align more closely with the conclusions stated by Zhu et al. (2018). Gao et al. (2018) noted a similar regular trend and noted that temperature was a significant influencing element for both blue water and green water resources.
Talib and Randhir (2017) pointed out that the effects of climate change will certainly have an impact on both the geographical and temporal aspects of the hydrological cycle, which will result in alterations to the seasonality of river ecosystems. SDSM models suitable for simulating future climate change (Wilby et al., 2002; Hassan et al., 2014). Many scholars have shown that the SDSM model simulates temperature with higher accuracy than precipitation because the processes involved in precipitation are more complex and consist of several factors, such as atmospheric pressure and humidity (Phatak et al., 2011; Yan et al., 2017). This result is in line with the conclusion that was reached by Peng et al. (2010) as well as the overall pattern of precipitation in China (Beyene et al., 2010; Xu et al., 2010) concluded that the future temperatures that were simulated by the SDSM model are in line with the trend of predicted temperature change in the twenty-first century, that the model simulates the temperature better than precipitation, and that the primary reason for the increase in future temperatures will be the consistent increase in greenhouse gas concentrations that have been observed since the 1960s (IPCC) (Jankó et al., 2014). The validation results of the SDSM model (Khan et al., 2006) in the present study showed a relatively good empirical statistical relationship in the multilinear regression model between forecast quantities and predictors, with higher R2 values for temperature predictions when compared with similar studies (Gulacha and Mulungu, 2017; Chim et al., 2021). The predicted precipitation results are better than the findings of similar studies (Wilby et al., 2002) with better simulation results. The Jing River Basin’s future temperature and precipitation are examined in this study. The results demonstrate that the simulation is accurate and that the conclusions of Zhao et al. (2020) about the future climate are consistent, indicating a large increase in future temperatures. The Jing River Basin is better suited for the SDSM model, which performed better at replicating precipitation in the arid zone than in the wet zone (Sigdel and Ma, 2016).
The Jing River Basin has somewhat more precipitation than blue and green water. The relative error between the two types of water resources—blue and green water—and precipitation is 1.51%, with one of the mistakes being related to the SWAT model’s parameter settings (Wu et al., 2021). CN2 is the number of SCS runoff curves under soil moisture condition II, which is a combination of soil infiltration characteristics, land use type, and pre-existing soil moisture conditions; the larger the CN2, the greater the yield (Liu et al., 2017; Zhang et al., 2024). The land cover, soil type, and management condition in the Yellow River basin are particularly sensitive to the setting of CN2 (Jin et al., 2023). The Jing River basin is hilly and mountainous, rainfall is easy to forms surface runoff, and the soil and vegetation cover conditions directly affect the runoff volume (Gao et al., 2020). The SWAT calibration and uncertainty analysis software has been widely used in SWAT model-related studies to combine automatic and manual calibration (Schuol et al., 2008). The present study of the Jing River Basin referred to previous knowledge and experience and assigned values to the model parameters or limits the range of parameter calibration to the actual situation of the study region (Hu et al., 2007; Li et al., 2010; Ng et al., 2010). Abbaspour et al. (2017) stated that a model is more accurate if the values it predicts match the observed values. Krause et al. (2005) found that the daily runoff simulation for the Wilde Gera watershed in Germany was calibrated based on R2 alone, and the calibrated R2 increased from 0.23 to 0.93. However, the calibrated model value underestimated the observed value, with an NSE of −1.66. Applying a single evaluation metric to calibrate the model increases model uncertainty of the model results and results in a significant error (Gan et al., 1997; Uhlenbrook et al., 2004; Moriasi et al., 2007), so multiple metrics should be selected for evaluation (Arnold et al., 2012). The present study used a combination of R2, NSE, PBIAS, and RSR as model evaluation metrics to reduce model error. The quality of calibrated observational data also determines the accuracy of model simulations (Nair et al., 2011; Krysanova and White, 2015; Vigiak et al., 2015). The data source must be authentic and reliable; for the present study, the data acquired from the Zhangjiashan Hydrological Station in the Jing River Basin were obtained from hydrological observations, which reduced the simulation error caused by poor data quality. When dividing the rating and validation periods, both should contain similar hydrological conditions to facilitate the data’s typicality (Masih et al., 2011).
The most significant factor that is having an impact on the hydrological water supply in arid sections of the Jing River Basin is climate change. Precipitation and temperature are the most important hydrothermal combinations of climate factors that affect blue–green water (Liang et al., 2020; Serur, 2020; Cooper et al., 2022). The CMIP6 climatic models are generally better at simulating temperature and precipitation than earlier models and also have better applicability (Chen and Sun, 2022; Huang et al., 2022; Li et al., 2022). The present study demonstrates that the geographical extent of blue–green water is consistent with the distribution of precipitation and that meteorological changes alter precipitation patterns and temperature distribution patterns in the Jing River Basin; these, in turn, result in shifts in the yield as well as the geographical and temporal characteristics of blue–green water resources in the basin (Worku et al., 2020), which is in line with the results of the present study; both of these studies confirm that the main cause of these changes is the alteration of precipitation patterns and temperature distribution patterns.
The climatic factor contributes 96% to green water variability in the Jing River Basin (Zhao et al., 2016), while evapotranspiration also plays a relatively critical role in climate-driven green water variability. Temperature is an important factor affecting the green water coefficient (Mengistu et al., 2021). Increased temperatures are predicted to result in a shift from blue water to green water, which causes the green water coefficient to decrease. As a result of this transition, the amount of subsurface water storage increases in dry and semi-arid regions, which is an important factor in the region’s capacity to sustain its water supplies (Zhao et al., 2016). The discovery that blue–green water is mostly obtained from precipitation remains true for the Wei River Basin as well, despite the fact that temperature has a significant role in regulating the proportion of blue–green water (Xie et al., 2020).
The present study investigated the formation of blue–green water in the past and future, as well as its regional and temporal distribution. However, even though the distribution of blue and green water has been mapped out, the mechanism and regulation of blue–green water interconversion are not yet understood. Thus, additional research is required to alleviate the problem of insufficient food crop production more rationally and effectively when caused by water shortages (Huang and Li, 2010). In particular, the study of green water and its use in the Jing River Basin in the arid areas of the Loess Plateau is beneficial to alleviating the water scarcity crisis and the pressure on ecosystem balance in these areas (Zang and Liu, 2013). Following this, it becomes critical to undertake a more comprehensive analysis of the geographic dispersion and evolving trends of blue and green water within the Jing River Basin. Simultaneously, there’s a pressing need to address the scientific complexities linked with pivotal water cycles and ecosystems in arid regions. Moreover, a thorough exploration of methods for sustainable utilization and efficient management of water resources within the basin is warranted. The ultimate objective is to achieve environmental sustainability within the basin, supported by a robust theoretical framework and practical applicability.
The Jing River Basin served as the research object in this study. The climate data-driven SWAT model included in the CanESM5 model was used to simulate the hydrological cycle processes in the basin between 1979 and 2014 as well as the predicted climate change from 2015 to 2100. This permitted a deeper investigation of the regional and temporal variability characteristics of the basin’s present and future blue–green water resources, leading to the following conclusions.
(1) The SWAT model, when fueled by historical meteorological data, produced commendable simulation outcomes, yielding an r-squared (R2) coefficient of 0.74 and a Nash-Sutcliffe Efficiency (NSE) value of 0.71 during the calibration period. In the validation period, the model continued to perform well, yielding an r-squared (R2) coefficient of 0.8 and an NSE value of 0.8.
(2) Compared to the base period (1979–2014), the future CanESM5 model under the SSP1-2.6, SSP2-4.5, and SSP5-8.5 scenarios predicted 0.27, 0.44, and 0.66 mm more precipitation, respectively, and 1.62°C, 2.1°C, and 3.36°C higher mean temperatures, respectively. With the increase in the total relative area of radiative emissions in these three scenarios, the precipitation and temperature of the Jing River Basin were predicted to continue increasing.
(3) During the reference period (1979–2014), the average multi-year blue and green water resources in the Jing River Basin were 109 and 433 mm, respectively. Compared with the base period, during 2015–2100, the predicted blue water resources in the SSP1-2.6, SSP2-4.5, and SSP5-8.5 scenarios were 17, 36, and 34 mm, respectively, and the predicted green water resources were 38, 79, and 101 mm more, respectively.
(4) The general spatial distribution of future blue water in the Jing River Basin was richer in the central region than the northern and southern regions, with the greatest concentration of blue water in the western region. The future geographical distribution pattern of green water was predicted to have a higher concentration of blue in the southeastern region than the northwestern region; the area around sub-basin 20 was predicted to have the highest concentration of green water. We concluded that the future spatial distribution pattern of the green water coefficient would be high overall in the northern and southern regions and low in the central and western regions, thereby differing considerably from blue water.
The GlobeLand 30 data are available from https://shop.geospatial.com/product/ZKF5THRENB504MESMXQA2EY3N1/ (accessed on 6 November 2023); The soil data are available from https://gaez.fao.org/pages/hwsd/ (accessed on 6 November 2023); The meteorological science data are available from https://climate-scenarios.canada.ca/ (accessed on 6 November 2023).
YZ: Writing–original draft, Data curation, Investigation. CL: Funding acquisition, Methodology, Writing–review and editing. JT: Writing–review and editing, Investigation. YN: Writing–review–editing, Resources. GF: Writing–original draft, Investigation, Visualization. LD: Writing–original draft, Resources, Visualization. HM: Writing–review–editing, Supervision.
The author(s) declare that financial support was received for the research, authorship, and/or publication of this article. This research was funded by the Fundamental Research Funds for the Central Non-profit Research Institution of Chinese Academy of Forestry (CAFYBB2020SZ006).
We want to express our sincere gratitude to the LetPub team for providing touch-up services that improved the quality of the manuscript. We also thank the journal editors and reviewers for their hard work on this research paper.
The authors declare that the research was conducted in the absence of any commercial or financial relationships that could be construed as a potential conflict of interest.
All claims expressed in this article are solely those of the authors and do not necessarily represent those of their affiliated organizations, or those of the publisher, the editors and the reviewers. Any product that may be evaluated in this article, or claim that may be made by its manufacturer, is not guaranteed or endorsed by the publisher.
Abbaspour, K. C., Vaghefi, S. A., and Srinivasan, R. (2017). A guideline for successful calibration and uncertainty analysis for soil and water assessment: a review of papers from the 2016 international SWAT conference. Water 10 (1), 6. doi:10.3390/w10010006
Akhavan, S., Abedi-Koupai, J., Mousavi, S.-F., Afyuni, M., Eslamian, S.-S., and Abbaspour, K. C. (2010). Application of SWAT model to investigate nitrate leaching in Hamadan–Bahar Watershed, Iran. Agric. Ecosyst. Environ. 139 (4), 675–688. doi:10.1016/j.agee.2010.10.015
Arnold, J. G., Moriasi, D. N., Gassman, P. W., Abbaspour, K. C., White, M. J., Srinivasan, R., et al. (2012). SWAT: model use, calibration, and validation. Trans. ASABE 55 (4), 1491–1508. doi:10.13031/2013.42256
Arnold, J. G., Williams, J. R., and Maidment, D. R. (1995). Continuous-time water and sediment-routing model for large basins. J. Hydraulic Eng. 121 (2), 171–183. doi:10.1061/(asce)0733-9429(1995)121:2(171)
Bai, J., Zhou, Z., Li, J., Liu, T., Zhu, Q., and Zheng, T. (2022). Predicting soil conservation service in the Jinghe River Basin under climate change. J. Hydrology 615, 128646. doi:10.1016/j.jhydrol.2022.128646
Berg, P., Moseley, C., and Haerter, J. O. (2013). Strong increase in convective precipitation in response to higher temperatures. Nat. Geosci. 6 (3), 181–185. doi:10.1038/ngeo1731
Beyene, T., Lettenmaier, D. P., and Kabat, P. (2010). Hydrologic impacts of climate change on the Nile River Basin: implications of the 2007 IPCC scenarios. Clim. change 100 (3-4), 433–461. doi:10.1007/s10584-009-9693-0
Bian, G., Zhang, J., Chen, J., Song, M., He, R., Liu, C., et al. (2021). Projecting hydrological responses to climate change using CMIP6 climate scenarios for the Upper Huai River Basin, China. Front. Environ. Sci. 9, 602. doi:10.3389/fenvs.2021.759547
Chahed, J., Hamdane, A., and Besbes, M. (2008). A comprehensive water balance of Tunisia: blue water, green water and virtual water. Water Int. 33 (4), 415–424. doi:10.1080/02508060802543105
Chen, C., Gan, R., Feng, D., Yang, F., and Zuo, Q. (2022). Quantifying the contribution of SWAT modeling and CMIP6 inputting to streamflow prediction uncertainty under climate change. J. Clean. Prod. 364, 132675. doi:10.1016/j.jclepro.2022.132675
Chen, H., and Sun, J. (2022). Future changes in daily snowfall events over China based on CMIP6 models. Atmos. Ocean. Sci. Lett. 15 (5), 100137. doi:10.1016/j.aosl.2021.100137
Chen, H., Sun, J., Lin, W., and Xu, H. (2020a). Comparison of CMIP6 and CMIP5 models in simulating climate extremes. Sci. Bull. 65 (17), 1415–1418. doi:10.1016/j.scib.2020.05.015
Chen, Y., Marek, G. W., Marek, T. H., Porter, D. O., Brauer, D. K., and Srinivasan, R. (2021). Modeling climate change impacts on blue, green, and grey water footprints and crop yields in the Texas High Plains, USA. Agric. For. Meteorology 310, 108649. doi:10.1016/j.agrformet.2021.108649
Chen, Y., Zhang, X., Fang, G., Li, Z., Wang, F., Qin, J., et al. (2020b). Potential risks and challenges of climate change in the arid region of northwestern China. Reg. Sustain. 1 (1), 20–30. doi:10.1016/j.regsus.2020.06.003
Chim, K., Tunnicliffe, J., Shamseldin, A., and Chan, K. (2021). Identifying future climate change and drought detection using CanESM2 in the upper Siem Reap River, Cambodia. Dyn. Atmos. Oceans 94, 101182. doi:10.1016/j.dynatmoce.2020.101182
Chu, J., Xia, J., Xu, C.-Y., and Singh, V. (2010). Statistical downscaling of daily mean temperature, pan evaporation and precipitation for climate change scenarios in Haihe River, China. Theor. Appl. Climatol. 99, 149–161. doi:10.1007/s00704-009-0129-6
Cooper, C. M., Troutman, J. P., Awal, R., Habibi, H., and Fares, A. (2022). Climate change-induced variations in blue and green water usage in US urban agriculture. J. Clean. Prod. 348, 131326. doi:10.1016/j.jclepro.2022.131326
Dey, A., and Remesan, R. (2022). Multimodel quantification of green and blue water components and its error propagations through parameter transferability approach across input choices. J. Hydrology 607, 127579. doi:10.1016/j.jhydrol.2022.127579
Falkenmark, M., and Rockström, J. (2006). The new blue and green water paradigm: breaking new ground for water resources planning and management. Am. Soc. Civ. Eng. 132 (3), 129–132. doi:10.1061/(asce)0733-9496(2006)132:3(129)
Gan, T. Y., Dlamini, E. M., and Biftu, G. F. (1997). Effects of model complexity and structure, data quality, and objective functions on hydrologic modeling. J. hydrology 192 (1-4), 81–103. doi:10.1016/s0022-1694(96)03114-9
Gao, X., Yan, C., Wang, Y., Zhao, X., Zhao, Y., Sun, M., et al. (2020). Attribution analysis of climatic and multiple anthropogenic causes of runoff change in the Loess Plateau—a case-study of the Jing River Basin. Land Degrad. Dev. 31 (13), 1622–1640. doi:10.1002/ldr.3557
Gao, X., Zuo, D., Xu, Z., Cai, S., and Xianming, H. (2018). Evaluation of blue and green water resources in the upper Yellow River basin of China. Proc. Int. Assoc. Hydrological Sci. 379, 159–167. doi:10.5194/piahs-379-159-2018
Geza, M., and McCray, J. E. (2008). Effects of soil data resolution on SWAT model stream flow and water quality predictions. J. Environ. Manag. 88 (3), 393–406. doi:10.1016/j.jenvman.2007.03.016
Gulacha, M. M., and Mulungu, D. M. (2017). Generation of climate change scenarios for precipitation and temperature at local scales using SDSM in Wami-Ruvu River Basin Tanzania. Phys. Chem. Earth, Parts A/B/C 100, 62–72. doi:10.1016/j.pce.2016.10.003
Gupta, H. V., Sorooshian, S., and Yapo, P. O. (1999). Status of automatic calibration for hydrologic models: comparison with multilevel expert calibration. J. hydrologic Eng. 4 (2), 135–143. doi:10.1061/(asce)1084-0699(1999)4:2(135)
Haji-Aghajany, S., Amerian, Y., and Amiri-Simkooei, A. (2022). Function-based troposphere tomography technique for optimal downscaling of precipitation. Remote Sens. 14 (11), 2548. doi:10.3390/rs14112548
Hamed, M. M., Nashwan, M. S., Shahid, S., bin Ismail, T., Wang, X.-j., Dewan, A., et al. (2022). Inconsistency in historical simulations and future projections of temperature and rainfall: a comparison of CMIP5 and CMIP6 models over Southeast Asia. Atmos. Res. 265, 105927. doi:10.1016/j.atmosres.2021.105927
Hassan, Z., Shamsudin, S., and Harun, S. (2014). Application of SDSM and LARS-WG for simulating and downscaling of rainfall and temperature. Theor. Appl. Climatol. 116, 243–257. doi:10.1007/s00704-013-0951-8
Hlavinka, P., Trnka, M., Balek, J., Semerádová, D., Hayes, M., Svoboda, M., et al. (2011). Development and evaluation of the SoilClim model for water balance and soil climate estimates. Agric. Water Manag. 98 (8), 1249–1261. doi:10.1016/j.agwat.2011.03.011
Hoekstra, A. Y. (2014). Water scarcity challenges to business. Nat. Clim. change 4 (5), 318–320. doi:10.1038/nclimate2214
Hu, X., McIsaac, G., David, M., and Louwers, C. (2007). Modeling riverine nitrate export from an east-central Illinois watershed using SWAT. J. Environ. Qual. 36 (4), 996–1005. doi:10.2134/jeq2006.0228
Huang, F., and Li, B. (2010). Assessing grain crop water productivity of China using a hydro-model-coupled-statistics approach. Part II: application in breadbasket basins of China. Agric. Water Manag. 97 (9), 1259–1268. doi:10.1016/j.agwat.2010.02.017
Huang, J., Li, Q., and Song, Z. (2022). Historical global land surface air apparent temperature and its future changes based on CMIP6 projections. Sci. Total Environ. 816, 151656. doi:10.1016/j.scitotenv.2021.151656
Huang, S., Li, P., Huang, Q., and Leng, G. (2017). Copula-based identification of the non-stationarity of the relation between runoff and sediment load. Int. J. Sediment Res. 32 (2), 221–230. doi:10.1016/j.ijsrc.2017.03.001
Jankó, F., Móricz, N., and Vancsó, J. P. (2014). Reviewing the climate change reviewers: exploring controversy through report references and citations. Geoforum 56, 17–34. doi:10.1016/j.geoforum.2014.06.004
Jia, W., Bo-Tao, Z., and Ying, X. (2015). Response of precipitation and its extremes over China to warming: CMIP5 simulation and projection. Chin. J. Geophys. 58 (5), 461–473. doi:10.1002/cjg2.20187
Jin, T., Zhang, X., Xie, J., Liang, J., and Wang, T. (2023). Study on hydrological response of runoff to land use change in the Jing River Basin, China. Environ. Sci. Pollut. Res. 30 (45), 101075–101090. doi:10.1007/s11356-023-29526-1
Jin, Z., Yezheng, W., and Gang, Y. (2005). General formula for estimation of monthly average daily global solar radiation in China. Energy Convers. Manag. 46 (2), 257–268. doi:10.1016/j.enconman.2004.02.020
Khan, M. S., Coulibaly, P., and Dibike, Y. (2006). Uncertainty analysis of statistical downscaling methods. J. Hydrology 319 (1-4), 357–382. doi:10.1016/j.jhydrol.2005.06.035
Kim, B. S., Kim, H. S., Seoh, B. H., and Kim, N. W. (2007). Impact of climate change on water resources in yongdam dam basin, korea. Stoch. Environ. Res. Risk Assess. 21, 457–373. doi:10.1007/s00477-006-0081-2
Krause, P., Boyle, D., and Bäse, F. (2005). Comparison of different efficiency criteria for hydrological model assessment. Adv. geosciences 5, 89–97. doi:10.5194/adgeo-5-89-2005
Krysanova, V., and White, M. (2015). Advances in water resources assessment with SWAT—an overview. Hydrological Sci. J. 60 (5), 771. doi:10.1080/02626667.2015.1029482
Li, C., Qi, J., Feng, Z., Yin, R., Zou, S., and Zhang, F. (2010). Parameters optimization based on the combination of localization and auto-calibration of SWAT model in a small watershed in Chinese Loess Plateau. Front. earth Sci. china 4, 296–310. doi:10.1007/s11707-010-0114-5
Li, J., Yu, Y., Wang, X., and Zhou, Z. (2022). System dynamic relationship between service water and food: case study at Jinghe River Basin. J. Clean. Prod. 330, 129794. doi:10.1016/j.jclepro.2021.129794
Liang, J., Liu, Q., Zhang, H., Li, X., Qian, Z., Lei, M., et al. (2020). Interactive effects of climate variability and human activities on blue and green water scarcity in rapidly developing watershed. J. Clean. Prod. 265, 121834. doi:10.1016/j.jclepro.2020.121834
Liu, C., Zhang, F., Johnson, V. C., Duan, P., and Kung, H. t. (2021). Spatio-temporal variation of oasis landscape pattern in arid area: human or natural driving? Ecol. Indic. 125, 107495. doi:10.1016/j.ecolind.2021.107495
Liu, Y., Li, Y., Huang, G., Zhang, J., and Fan, Y. (2017). A Bayesian-based multilevel factorial analysis method for analyzing parameter uncertainty of hydrological model. J. hydrology 553, 750–762. doi:10.1016/j.jhydrol.2017.08.048
Luo, K., and Moiwo, J. P. (2023). Sensitivity of the land surface hydrological cycle to human activities in China. Gondwana Res. 123, 255–264. doi:10.1016/j.gr.2022.04.006
Masih, I., Maskey, S., Uhlenbrook, S., and Smakhtin, V. (2011). Assessing the impact of areal precipitation input on streamflow simulations using the SWAT Model 1. JAWRA J. Am. Water Resour. Assoc. 47 (1), 179–195. doi:10.1111/j.1752-1688.2010.00502.x
Mengistu, D., Bewket, W., Dosio, A., and Panitz, H.-J. (2021). Climate change impacts on water resources in the upper blue nile (Abay) river basin, Ethiopia. J. Hydrology 592, 125614. doi:10.1016/j.jhydrol.2020.125614
Moriasi, D. N., Arnold, J. G., Van Liew, M. W., Bingner, R. L., Harmel, R. D., and Veith, T. L. (2007). Model evaluation guidelines for systematic quantification of accuracy in watershed simulations. Trans. ASABE 50 (3), 885–900. doi:10.13031/2013.23153
Nair, S. S., King, K. W., Witter, J. D., Sohngen, B. L., and Fausey, N. R. (2011). Importance of crop yield in calibrating watershed water quality simulation tools 1. JAWRA J. Am. Water Resour. Assoc. 47 (6), 1285–1297. doi:10.1111/j.1752-1688.2011.00570.x
Ng, T. L., Eheart, J. W., Cai, X., and Miguez, F. (2010). Modeling Miscanthus in the soil and water assessment tool (SWAT) to simulate its water quality effects as a bioenergy crop. Environ. Sci. Technol. 44 (18), 7138–7144. doi:10.1021/es9039677
Peng, J., Chen, S., and Dong, P. (2010). Temporal variation of sediment load in the Yellow River basin, China, and its impacts on the lower reaches and the river delta. Catena 83 (2-3), 135–147. doi:10.1016/j.catena.2010.08.006
Phatak, A., Bates, B. C., and Charles, S. P. (2011). Statistical downscaling of rainfall data using sparse variable selection methods. Environ. Model. Softw. 26 (11), 1363–1371. doi:10.1016/j.envsoft.2011.05.007
Schuol, J., Abbaspour, K. C., Srinivasan, R., and Yang, H. (2008). Estimation of freshwater availability in the West African sub-continent using the SWAT hydrologic model. J. hydrology 352 (1-2), 30–49. doi:10.1016/j.jhydrol.2007.12.025
Serur, A. B. (2020). Modeling blue and green water resources availability at the basin and sub-basin level under changing climate in the Weyb River basin in Ethiopia. Sci. Afr. 7, e00299. doi:10.1016/j.sciaf.2020.e00299
Shen, M., Chen, J., Zhuan, M., Chen, H., Xu, C.-Y., and Xiong, L. (2018). Estimating uncertainty and its temporal variation related to global climate models in quantifying climate change impacts on hydrology. J. Hydrology 556, 10–24. doi:10.1016/j.jhydrol.2017.11.004
Sigdel, M., and Ma, Y. (2016). Evaluation of future precipitation scenario using statistical downscaling model over humid, subhumid, and arid region of Nepal—a case study. Theoretical and applied climatology. 123, 453–460.
Singh, J., Knapp, H. V., Arnold, J., and Demissie, M. (2005). Hydrological modeling of the Iroquois river watershed using HSPF and SWAT 1. JAWRA J. Am. Water Resour. Assoc. 41 (2), 343–360. doi:10.1111/j.1752-1688.2005.tb03740.x
Song, Z., Xia, J., She, D., Li, L., Hu, C., and Hong, S. (2021). Assessment of meteorological drought change in the 21st century based on CMIP6 multi-model ensemble projections over mainland China. J. Hydrology 601, 126643. doi:10.1016/j.jhydrol.2021.126643
Talib, A., and Randhir, T. O. (2017). Climate change and land use impacts on hydrologic processes of watershed systems. J. Water Clim. Change 8 (3), 363–374. doi:10.2166/wcc.2017.064
Uhlenbrook, S., Roser, S., and Tilch, N. (2004). Hydrological process representation at the meso-scale: the potential of a distributed, conceptual catchment model. J. Hydrology 291 (3-4), 278–296. doi:10.1016/j.jhydrol.2003.12.038
Vigiak, O., Malagó, A., Bouraoui, F., Vanmaercke, M., and Poesen, J. (2015). Adapting SWAT hillslope erosion model to predict sediment concentrations and yields in large Basins. Sci. Total Environ. 538, 855–875. doi:10.1016/j.scitotenv.2015.08.095
Wang, L., Li, Z., Wang, F., Li, H., and Wang, P. (2014). Glacier changes from 1964 to 2004 in the jinghe River basin, tien Shan. Cold regions Sci. Technol. 102, 78–83. doi:10.1016/j.coldregions.2014.02.006
Wang, Y., Li, H., Wang, H., Sun, B., and Chen, H. (2021). Evaluation of CMIP6 model simulations of extreme precipitation in China and comparison with CMIP5. Acta Meteorol. Sin. 79 (3), 369–386. doi:10.11676/qxxb2021.031
Wilby, R., Tomlinson, O., and Dawson, C. (2003). Multi-site simulation of precipitation by conditional resampling. Clim. Res. 23 (3), 183–194. doi:10.3354/cr023183
Wilby, R. L., Dawson, C. W., and Barrow, E. M. (2002). SDSM—a decision support tool for the assessment of regional climate change impacts. Environ. Model. Softw. 17 (2), 145–157. doi:10.1016/s1364-8152(01)00060-3
Woldesenbet, T. A. (2022). Impact of land use and land cover dynamics on ecologically-relevant flows and blue-green water resources. Ecohydrol. Hydrobiology 22 (3), 420–434. doi:10.1016/j.ecohyd.2022.03.002
Worku, G., Teferi, E., Bantider, A., and Dile, Y. T. (2020). Prioritization of watershed management scenarios under climate change in the Jemma sub-basin of the Upper Blue Nile Basin, Ethiopia. J. Hydrology Regional Stud. 31, 100714. doi:10.1016/j.ejrh.2020.100714
Wu, J., Deng, G., Zhou, D., Zhu, X., Ma, J., Cen, G., et al. (2021). Effects of climate change and land-use changes on spatiotemporal distributions of blue water and green water in Ningxia, Northwest China. J. Arid Land 13, 674–687. doi:10.1007/s40333-021-0074-5
Wu, L., Liu, X., Yang, Z., Yu, Y., and Ma, X. (2022). Effects of single- and multi-site calibration strategies on hydrological model performance and parameter sensitivity of large-scale semi-arid and semi-humid watersheds. Hydrol. Process 36 (6), e14616. doi:10.1002/hyp.14616
Xiao, D., Zhao, P., and Ren, H.-L. (2021). Climatic factors contributing to interannual and interdecadal variations in the meridional displacement of the East Asian jet stream in boreal winter. Atmos. Res. 264, 105864. doi:10.1016/j.atmosres.2021.105864
Xie, P., Zhuo, L., Yang, X., Huang, H., Gao, X., and Wu, P. (2020). Spatial-temporal variations in blue and green water resources, water footprints and water scarcities in a large river basin: a case for the Yellow River basin. J. Hydrology 590, 125222. doi:10.1016/j.jhydrol.2020.125222
Xu, D., Kang, X., Zhuang, D., and Pan, J. (2010). Multi-scale quantitative assessment of the relative roles of climate change and human activities in desertification–a case study of the Ordos Plateau, China. J. Arid Environ. 74 (4), 498–507. doi:10.1016/j.jaridenv.2009.09.030
Yan, L., Xiong, L., Guo, S., Xu, C.-Y., Xia, J., and Du, T. (2017). Comparison of four nonstationary hydrologic design methods for changing environment. J. Hydrology 551, 132–150. doi:10.1016/j.jhydrol.2017.06.001
Yang, Q., Gao, Y., Cao, X., and Yang, J. (2023). Contributions and resistances to vulnerability of rural human settlements system in agricultural areas of Chinese loess plateau since 1980. Sustainability 15 (14), 10948. doi:10.3390/su151410948
Yang, X., Zhou, B., Xu, Y., and Han, Z. (2021). CMIP6 evaluation and projection of temperature and precipitation over China. Adv. Atmos. Sci. 38, 817–830. doi:10.1007/s00376-021-0351-4
Zadeh, F. K., Nossent, J., Sarrazin, F., Pianosi, F., Van Griensven, A., Wagener, T., et al. (2017). Comparison of variance-based and moment-independent global sensitivity analysis approaches by application to the SWAT model. Environ. Model. Softw. 91, 210–222. doi:10.1016/j.envsoft.2017.02.001
Zang, C., and Liu, J. (2013). Trend analysis for the flows of green and blue water in the Heihe River basin, northwestern China. J. Hydrology 502, 27–36. doi:10.1016/j.jhydrol.2013.08.022
Zhang, F., Yushanjiang, A., and Wang, D. (2018). Ecological risk assessment due to land use/cover changes (LUCC) in Jinghe County, Xinjiang, China from 1990 to 2014 based on landscape patterns and spatial statistics. Environ. Earth Sci. 77, 491. doi:10.1007/s12665-018-7676-z
Zhang, W., Zha, X., Li, J., Liang, W., Ma, Y., Fan, D., et al. (2014). Spatiotemporal change of blue water and green water resources in the headwater of Yellow River Basin, China. Water Resour. Manag. 28, 4715–4732. doi:10.1007/s11269-014-0769-x
Zhang, Y., Gao, Y., Xu, L., Liu, Z., and Wu, L. (2024). Integrating satellite and reanalysis precipitation products for SWAT hydrological simulation in the Jing River Basin, China. Environ. Sci. Pollut. Res. 31, 20534–20555. doi:10.1007/s11356-024-32482-z
Zhao, A., Zhu, X., Liu, X., Pan, Y., and Zuo, D. (2016). Impacts of land use change and climate variability on green and blue water resources in the Weihe River Basin of northwest China. Catena 137, 318–327. doi:10.1016/j.catena.2015.09.018
Zhao, B., Sun, H., Yan, D., Wei, G., Tuo, Y., and Zhang, W. (2021a). Quantifying changes and drivers of runoff in the Kaidu River Basin associated with plausible climate scenarios. J. Hydrology Regional Stud. 38, 100968. doi:10.1016/j.ejrh.2021.100968
Zhao, D., Liu, J., Yang, H., Sun, L., and Varis, O. (2021b). Socioeconomic drivers of provincial-level changes in the blue and green water footprints in China. Resour. Conservation Recycl. 175, 105834. doi:10.1016/j.resconrec.2021.105834
Zhao, F., Wu, Y., Yao, Y., Sun, K., Zhang, X., Winowiecki, L., et al. (2020). Predicting the climate change impacts on water-carbon coupling cycles for a loess hilly-gully watershed. J. Hydro. 581, 124388.
Zhou, T.-j., and Li, Z.-x. (2002). Simulation of the East Asian summer monsoon using a variable resolution atmospheric GCM. Clim. Dyn. 19, 167–180. doi:10.1007/s00382-001-0214-8
Zhu, K., Xie, Z., Zhao, Y., Lu, F., Song, X., Li, L., et al. (2018). The assessment of green water based on the SWAT model: a case study in the Hai River Basin, China. Water 10 (6), 798. doi:10.3390/w10060798
Keywords: climate change, Jing River Basin, blue and green water, SDSM model, SWAT model
Citation: Zhan Y, Li C, Tang J, Ning Y, Fan G, Deng L and Ma H (2024) Future spatial and temporal variation of blue and green water in the Jing River Basin of central China under changing climatic conditions. Front. Environ. Sci. 12:1352544. doi: 10.3389/fenvs.2024.1352544
Received: 08 December 2023; Accepted: 01 July 2024;
Published: 25 July 2024.
Edited by:
Björn Vinnerås, Swedish University of Agricultural Sciences, SwedenReviewed by:
Zuzana Vranayová, Technical University of Košice, SlovakiaCopyright © 2024 Zhan, Li, Tang, Ning, Fan, Deng and Ma. This is an open-access article distributed under the terms of the Creative Commons Attribution License (CC BY). The use, distribution or reproduction in other forums is permitted, provided the original author(s) and the copyright owner(s) are credited and that the original publication in this journal is cited, in accordance with accepted academic practice. No use, distribution or reproduction is permitted which does not comply with these terms.
*Correspondence: Chunyi Li, bGljaHVueWlAY2FmLmFjLmNu
Disclaimer: All claims expressed in this article are solely those of the authors and do not necessarily represent those of their affiliated organizations, or those of the publisher, the editors and the reviewers. Any product that may be evaluated in this article or claim that may be made by its manufacturer is not guaranteed or endorsed by the publisher.
Research integrity at Frontiers
Learn more about the work of our research integrity team to safeguard the quality of each article we publish.