 Shibin Zhang
 Pu Zhang
94% of researchers rate our articles as excellent or good
Learn more about the work of our research integrity team to safeguard the quality of each article we publish.
Find out more
ORIGINAL RESEARCH article
Front. Environ. Sci. , 22 February 2024
Sec. Environmental Economics and Management
Volume 12 - 2024 | https://doi.org/10.3389/fenvs.2024.1352412
This article is part of the Research Topic Energy-Environment Sustainability: Progresses and Impacts of Clean Energy System Construction View all 8 articles
Agricultural non-point source pollution (ANSP) constraints on the development of the agricultural economy, grasp the interaction between the two, and develop targeted prevention and control policies in accordance with the evolution of different stages of the characteristic is essential. This study examines the economic characteristics of ANSP in Shandong Province to propose targeted countermeasures. Selected the time series data of Shandong Province from 2000 to 2020 to test the Environmental Kuznets Curve (EKC) characteristics between ANSP and agricultural economic growth (AEG), and the Vector Error Correction model (VECM) is used further to explore the dynamic relationship and mechanism. We validate the existence of an Inverted U-shaped EKC in Shandong Province, and the inflection points of pesticides, fertilizers, and agricultural films were reached in 2007 and 2008. The changes in pesticide loss and fertilizer loss have a positive impact on the dynamics of AEG in the short term, but there is an incremental inhibition in the long term. The dynamic effect of the impulse response diagram between the amount of agricultural film residues and AEG all shows a positive impact. The average explanatory contribution of pesticide loss, fertilizer loss, and agricultural film residue to AEG decreases by 12.14%, 7.7%, and 3%, respectively. Therefore, policy suggestions are proposed to realize the coordinated development of ANSP and economic development.
Solving the problem of agricultural non-point source pollution (ANSP) is necessary for the sustainable growth of the agricultural economy. ANSP mainly refers to the non-point source pollution caused by the irrational use of chemical inputs such as fertilizers and pesticides and improperly handling livestock and poultry manure and crop residues during agricultural production (Yi et al., 2021). Since the reform and opening, China has applied 58.59 million tons of chemical fertilizers in 2017 compared to 8.84 million tons in 1978. Between 1990 and 2017, the amount of plastic films and pesticides applied rose from 480,000 and 730,000 tons to 2.53 million and 1.66 million tons, respectively (Zou et al., 2020). China’s use of pesticides, fertilizers, and agricultural films is among the highest in the world (Li and Shang, 2023; Lu et al., 2023). Therefore, China, the largest developing country, faces severe ANSP problems. Some scholars have emphasized the harmful effects of ANSP on the quality of the agricultural economy (Gokmenoglu et al., 2019; Lu et al., 2023), while how to control the ANSP and realize the sustainable development of the agricultural economy is the current urgent problem to be solved.
Shandong Province, a central agricultural province in China, the total agricultural output value in 2020 was 1,019.06 billion yuan (Tian et al., 2022), becoming the first province in China to exceed one trillion yuan in total agricultural output value. However, Shandong, one of the most severe areas of ANSP in China (Zou et al., 2020), relies heavily on AEG at the expense of the ecological environment. According to statistics1, Shandong Province ranks first in terms of pesticide use, second in the country in terms of chemical fertilizer use, and has a low rate of agricultural film recycling. There is still a big gap between reality and the requirements for green and high-quality agricultural development. Therefore, to explore the deep relationship between the use of pesticides, fertilizers, agricultural films, and AEG in many aspects, to indirectly verify the existence of ANSP and the effect of bidirectional influence, it is of great practical significance to Shandong Province on how to efficiently configure the factors of agricultural production, to change the mode of growth of the agricultural economy, and to reduce the damage to the agro-ecological environment while pursuing the economic benefits, so as to realize the coordinated development of the ecological environment and the agricultural economy.
In recent years, due to the grim situation of ANSP in China, it has become a bottleneck in the development of modern agriculture (Li and Shang, 2023), which has caused many scholars to research ANSP. In the existing literature, the research mainly focuses on the following aspects. The first is a qualitative study of the current situation, causes, and countermeasures of ANSP (Pang and Wang, 2023). Qualitative research is due to the lack of data support, so the relevant conclusions are not persuasive. Secondly, the research on the factors affecting ANSP mainly focuses on economic factors, institutional factors, and human endowment factors (Yi et al., 2021; Lin et al., 2022; Duan and Li, 2023; Wang et al., 2023). With the deepening of research and China’s green sustainable development, more scholars have studied the relationship between ANSP andAEG (Shang et al., 2019; Lin et al., 2021; Cui et al., 2023), trying to explore the development trend of pollution and economy, to provide ideas for realizing the coordinated development of agricultural pollution and economy. The most representative of theories is the EKC hypothesis, and many studies support the existence of EKC to some extent (Destek and Sarkodie, 2019; Gokmenoglu et al., 2019; Rej et al., 2022; Hossain et al., 2023; Lu et al., 2023; Rahman et al., 2023), and point out that there are differences in developed and developing countries (Haider et al., 2022; Zhao et al., 2023). Meanwhile, domestic scholars have also studied the relationship between ANSP and economic development based on data from the whole country or individual provinces (Cui et al., 2023; Lin et al., 2021; Shang et al., 2019; Yu et al., 2016), and the results show that there is heterogeneity in the EKC curves of different provinces, and that the results of the study of ANSP are affected by several factors, such as the object of the study, the sample data, the time scale, the geographical characteristics and the research method.
At present, the research on ANSP and AEG in Shandong Province still has certain deficiencies, and the existing research only stays in the analysis of the current situation of pollution and the validation of the EKC curve (Shi and Jing, 2016; Xu &Gao, 2022; Xu et al., 2010), but the EKC can only intuitively express the shallow morphological characteristics of the variables and lacks a deeper investigation of the logical relationship between ANSP and AEG in Shandong Province, and the effect of the intrinsic interaction between the two. The clarification of the interaction mechanism between ANSP and AEG is an essential link in realizing the sustainable development of agriculture and needs to be analyzed.
In light of the existing knowledge gap, this study aims to contribute to the current body of knowledge using twenty-one years of annual time series data from 2000 to 2020. Firstly, based on EKC, this study aims to investigate the dynamic relationship between ANSP and agricultural economic development in Shandong Province. Secondly, this is the first time to study the interaction between ANSP and AEG in Shandong Province in realizing sustainable development of the agricultural economy. Thirdly, the variables of agricultural mechanization level, environmental regulation level, and agricultural industry structure are introduced to highlight the impacts on environmental sustainability. Fourthly, in terms of research methodology, the use of more advanced and robust techniques, such as the VEC model and impulse function, can provide more robust policy-oriented results, thus providing a better opportunity for policymakers in Shandong Province, as well as for other large agricultural provinces in developing countries to realize the sustainable development of agricultural economy.
The rest of the paper is organized as follows. Section 2 is a literature review to find the shortcomings of the current research by combing through the existing literature. Section 3 presents the research methodology and data description. Section 4 provides the results of the empirical study. Section 5 provides a discussion of the results. Section 6 concludes our findings and proposes policy implications, limitations, and prospects.
The research on ANSP is gradually enriched, mainly including the following stages. Firstly, the sources, current situation, and hazards of ANSP are studied (Zou et al., 2020; Pang and Wang, 2023). Since the early 1970 s, chemical fertilizers and pesticide inputs in agricultural production have been increasing yearly to increase food production per unit area and meet people’s demand for food (Xu et al., 2022). At the same time, agricultural plastic film has been widely promoted and used in agricultural production because of its low cost, ease of use, and significant yield increase (Wang et al., 2023), but its long degradation time and incomplete mechanical recycling have led to the increasingly serious pollution of residual mulch film in farmland. Therefore, the excessive use of pesticides, chemical fertilizers, and agricultural plastic films has resulted in increasingly severe ANSP. Secondly, the influencing factors of ANSP were studied (Yi et al., 2021; Lin et al., 2022; Duan and Li, 2023; Wang et al., 2023). Agricultural mechanization and the use of agrochemicals have contributed to the exponential growth of agricultural production and agricultural waste in many countries and exacerbated ANSP (Yi et al., 2021). The level of environmental regulation and the level of digital financial development can also mitigate ANSP (Lin et al., 2022). The adjustment of the internal structure of the agricultural industry will change the form and intensity of agricultural pollutant emissions (Wang et al., 2023), which in turn will have a particular impact on ANSP. Thirdly, the prediction of ANSP is studied, and countermeasures are proposed (Zhao et al., 2023). Some scholars construct ANSP simulation models from the farmland scale or watershed scale to predict the development of ANSP. A recent study predicted ANSP in the Yangtze River Economic Zone in China, and predicted that the pollution would decrease in 2050 compared to 2019, but still above the environmental risk threshold (Pang and Wang, 2023).
ANSP constrains the development of agricultural economy, and the relationship between economic growth and environmental pollution is often analyzed under the framework of EKC (Yi et al., 2021). The EKC curve is also widely used in studying the agricultural economy and the environment. Some studies have supported the existence of EKC to a certain extent (Rej et al., 2022; Hossain et al., 2023; Rahman et al., 2023), and pointed out that the shape of EKC in developed and developing countries are different (Haider et al., 2022; Pang and Wang, 2023; Zhao et al., 2023), and some developed countries are already in the downward stage of the Kuznets curve, but in most of the developing countries it is an inverted U-shape, especially in the low-income countries. There may be a bi-directional causality between the agricultural pollution and the agricultural economy. In recent years, the relationship between ANSP and the agricultural economy has also gradually been emphasized by scholars in China.
On the one hand, some scholars have conducted studies based on the national perspective or watershed perspective (Ding et al., 2023; Li and Shang, 2023; Wang et al., 2023). Li and Zhang (2009) examined the characteristics of China’s agricultural EKC from 1998 to 2006 and found that the overall has a significant inverted “U”-shaped curve but is in an upward stage, and there is still a distance from the inflection point. Gao et al. (2018) verified the agricultural EKC characteristics from 2006 to 2015. They found that the results were consistent with the inverted “U” curve. Still, only Shandong and Henan reached the inflection point, and other provinces’ gross agricultural output value was below the inflection point. Cui et al. (2023) further used the latest data to study the agricultural EKC characteristics of China’s 13 major grain-producing regions from 2004 to 2019. They found that most of the areas are in an inverted U-shape, except for Jiangsu, Liaoning, Hebei and other provinces, which have already crossed the highest inflection point of the inverted U-shape, and the rest of them are in the upward stage. This indicates that China’s agricultural development is gradually transforming into green and sustainable development, but there is still a long way to go before the developed countries.
On the other hand, some scholars research the relationship between ANSP and the agricultural economy in individual provinces. Sun et al. (2016) verified the “inverted U-shaped” curve of the EKC of ANSP in Guangdong Province using time series data from 1995 to 2013, and further examined the dynamic relationship between them using a VAR model, which showed that ANSP in Guangdong Province has a positive effect on economic development and a lagging negative effect.
Shang et al. (2019) verified that fertilizers, pesticides and AEG showed an inverted “U” curve relationship, while agricultural films showed a straight-line incremental relationship in Heilongjiang Province. The dynamic relationship and stage characteristics of ANSP and economic growth were analyzed using the VECM model. Lin et al. (2021) used a VAR model to study the relationship between ANSP and economic growth in Ningxia, and an “N” shape was found to be significant, and that AEG had a positive role in promoting ANSP. Xu et al. (2022b) used EKC and VAR models to study the relationship between ANSP and rural residents’ income in Shanghai from 1998 to 2019, and there is an inverted N-shaped relationship between the intensity of landfilm application and rural residents’ disposable income, while fertilizers and pesticides have a linearly decreasing relationship with the disposable income of rural residents. ANSP emissions will decrease with the increase of rural residents’ income level. Dong et al. (2023) researched the ANSP in Anhui Province, China, is characterized by an inverted N-shape, and there are large differences between the northern and southern regions. However, the harmonization of the agricultural environment and economic development in each province is heterogeneous, and the study results will be affected by many factors, such as the object of the study, the geographical characteristics, and the research method.
Meanwhile, several studies are closely related to this paper. Xu et al. (2010) first analyzed the current situation of ANSP in Shandong Province. They found that pesticides, fertilizers, and agricultural film pollution are the three major causes of ANSP in Shandong Province. Shi & Jing. (2016), based on three indicators of fertilizer, livestock farming, and farmland solid waste, verified the EKC curve of the agricultural environment in Qingdao City, Shandong Province, from 1991 to 2013. Xu & Gao. (2022) further divided Shandong Province into the northern, central, southern, and Jiaodong regions and verified that the economic growth of agriculture was the one-way Granger cause of ANSP based on the EKC. However, current research focuses on some regions of Shandong Province and lacks the ability to study Shandong Province as a whole. In addition, there is a lack of a deeper investigation of the logical relationship and the effect of internal interaction between ANSP and AEG in Shandong Province. Therefore, it is necessary to study Shandong Province as a whole based on newer time series data.
Many methods have been used to test the validity of time series data and to forecast them, among which the ones that have been applied more in the field of environmental pollution research are ARDL (Waheed et al., 2018; Rahman et al., 2023), VAR(Lin et al., 2021; Xu et al., 2022; Sun et al., 2016), VECM (Gokmenoglu et al., 2019; Pradhan and Bagchi, 2013; Shang et al., 2019). Compared to other models, the VECM was chosen for this study mainly because of the following reasons. Firstly, VECM is based on cointegration theory and can effectively handle non-stationary time series, avoiding the requirement of data smoothness in traditional models. This makes it better able to capture the long-term trends and equilibrium relationships of economic phenomena. Secondly, the endogenous variables of the model may interact with each other due to the long-term and lagged nature of ANSP, and the VECM can effectively solve the endogeneity problem. Thirdly, the VECM can reflect the short-term dynamic relationship and long-term stable equilibrium relationship of different time variables, which allows the model to consider both long-run and short-run relationships among multiple variables, improving the accuracy of forecasting and analysis. Combining the VECM based on the EKC can better reflect the evolutionary characteristics and the interaction relationship between ANSP and economic growth in Shandong Province, and formulate targeted prevention and control policies according to the evolutionary characteristics of different stages.
In conclusion, there are still three shortcomings in the existing studies. Firstly, this study explores the interaction mechanism between ANSP and economic development in Shandong Province, a traditional agricultural province in China, and enriches the application of EKC theory in the field of regional agricultural pollution in China. Secondly, regarding research methodology, the total amount of inputs such as pesticides and fertilizers are commonly used in previous studies, ignoring that not all inputs of the elements bring environmental pollution. In this study, the loss of each component is used as the pollution indicator, the research data is more accurate, the degree of ANSP can be predicted more accurately, and the more advanced and robust VEC model is used in EKC, which can provide more robust policy-oriented results, and is also a supplement to the existing research in related fields. Thirdly, regarding the content, the existing research on ANSP in Shandong Province only focuses on analyzing the current pollution status. Thirdly, in terms of research content, the existing studies on ANSP in Shandong Province only stay in the analysis of the current pollution situation and the verification of the EKC and lack of a deeper investigation of the logical relationship and the effect of the internal interaction between ANSP and AEG. In comparison, this study explores the short-term and long-term impact of ANSP and economic growth under the framework of the EKC, which can provide helpful insight for policymakers.
Shandong Province (114°47.5′-122°42.3′E, 34°22.9′-38°24.01′N), located in eastern China (Figure 1), is a traditional agricultural province in China. It is at the intersection of the Bohai-Rim Economic Zone and the Yangtze River Delta Economic Zone, as well as the center of the East Asian Economic Circle. The total land area of Shandong is 158,000 square kilometers, with a cultivated land area of 6,635,000 ha. Shandong Province has the largest production of grains and vegetables in China, accounting for a large proportion of China’s total grain and vegetable production, with vegetable production ranking first and grain production third in the country (Tian et al., 2022). Therefore, the input of agricultural chemicals such as pesticides, fertilizers and agricultural films is also relatively large (Zou et al., 2020). Shandong occupies an important strategic position in the overall pattern of China’s agricultural development, while the ANPSP problem is also the most serious, so selected as the research object is representative and meaningful.
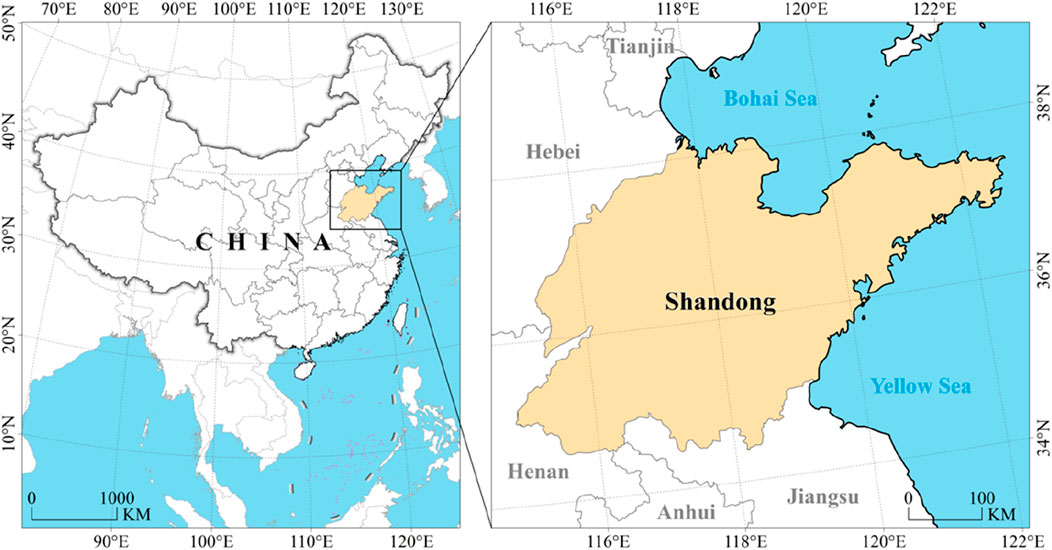
FIGURE 1. Location of Shandong province in China.
The EKC refers to the fact that when the level of economic development of a region is low, the degree of environmental pollution is light, but as the level of economic development rises, the degree of environmental pollution will also increase with economic growth. When economic development reaches a certain level after reaching a certain critical point or “inflection point,” the degree of environmental pollution gradually slows down, and the environmental quality gradually improves (Gokmenoglu et al., 2019). EKC curves are widely used in the study of agro-economic environments (Zou et al., 2020; Li and Shang, 2023; Zhao et al., 2023). It has been shown that the shape of the EKC curve is not limited to a “U” or “inverted U” shape but may also be “N” or “inverted N” shapes.
In addition to economic factors, ANSP can be influenced by other factors [(Yi et al., 2021; Duan and Li, 2023; Wang et al., 2023)]. In this paper, we select the level of mechanization, the level of environmental regulation and the structure of the agricultural industry as control variables to be added to the EKC model. The level of mechanization is a characterization of agricultural production conditions and a manifestation of agricultural technological progress, which will bring advanced production equipment and production technology that can significantly improve agricultural production conditions (Guan et al., 2023). Different agricultural production industries’ types and levels of production factor inputs are differentiated. The adjustment of the internal structure of the agricultural sector will change the form and intensity of agricultural pollutant emissions (Wang et al., 2023). Environmental regulation indicates the degree of governmental attention to and control of ANSP (Gokmenoglu et al., 2019), and strong government regulation will reduce ANSP to a certain extent (Yi et al., 2021). Since the level of mechanization, the level of environmental regulation, and the structure of the agricultural industry all affect ANSP to some extent, they are selected as control variables.
Therefore, in this paper, referring to Shafik&Bandyopadhyay (1992), the initial model of EKC is first assumed to be cubic, and in the case that the cubic form is not significant, then test the quadratic form, if it is still not substantial, then it is a linear relationship. The formula is as follows:
In Eq. 1,
This paper investigates the relationship between ANSP and economic growth based on the Granger causality test of the Vector Autoregressive Model (VAR). If the selected time series variables are smooth, the VAR model can be directly applied for estimation (Granger, 1988). If the selected time series variables are non-stationary, the cointegration relationship between the variables is examined, and the VECM is selected for estimation. The VECM captures both the long-run stable equilibrium relationship between different series and the short-term deviations from this relationship and corrects for the long-run equilibrium through short-term changes. Therefore, the variables are first analyzed to find the cointegration relationship between the variables, the long-term equilibrium relationship. This relationship constitutes the error correction term. Then, the short-term model is built by treating the error correction term as an explanatory variable and other explanatory variables reflecting short-term fluctuations (Pradhan and Bagchi, 2013). The VECM constructed in this paper is as follows:
In Eq. 2,
Based on data availability, the time-series data in Shandong Province from 2000 to 2020 is mainly from the Statistical Yearbook of Shandong Province, China Statistical Yearbook, and China Statistical Yearbook of Fixed Asset Investment. However, the issue of missing data points is resolved using the liner interpolation method. Table 1 shows the specific data source and description.
(1) The independent variable is the level of agricultural economic development, measured by the gross agricultural product of Shandong Province (Xu et al., 2022; Li and Shang, 2023). The unit is hundreds of millions of yuan.
(2) The dependent variables include the loss of pesticides, fertilizers, and agricultural plastic films. The unit is 104 tons. Drawing on existing research (Gao et al., 2018; Ge &Zhou, 2011; Yu et al., 2016), it is considered that not all inputs of fertilizers, pesticides, and agricultural films pollute the environment, but only the lost portion of these elements leads to ANSP. Among them, pesticide loss = pesticide application × (1- pesticide utilization rate), agricultural fertilizer loss = agricultural fertilizer application (pure amount) × (1-fertilizer utilization rate), plastic film residue = plastic film use × (1-plastic film recycling rate). According to related scholars’ research, the pesticides utilization rate is 30%, the utilization rate of fertilizers is 35%, and the recycling rate of plastic films is 30% (Yu et al., 2016). This paper adopts the above ratios for the conversion and then derives the indicators.
(3) The control variables include the level of mechanization, the level of environmental regulation, and the structure of the agricultural industry. The level of mechanization is measured by the amount of machinery owned at the end of the year (Guan et al., 2023). The structure of the agricultural industry is measured by the proportion of agricultural gross output value to the total output value of agriculture, forestry, animal husbandry, and fishery (Wang et al., 2023). Environmental regulation is measured by the ratio of eco-pollution investment to regional GDP (Gokmenoglu et al., 2019).
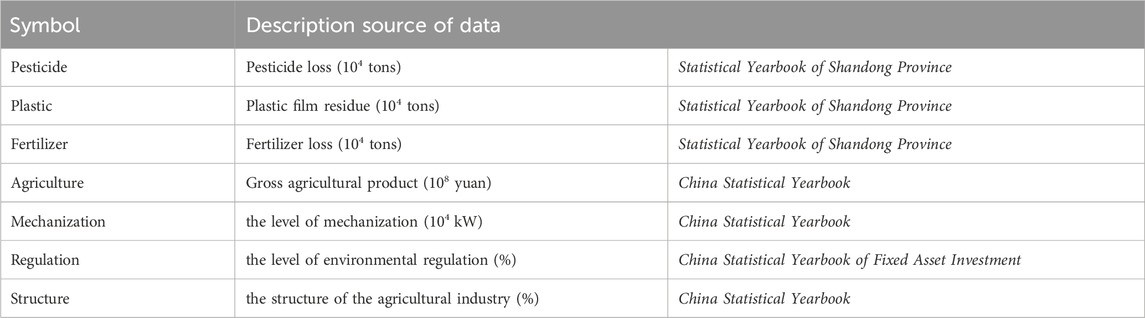
TABLE 1. Data source and description.
Before the empirical analysis, a descriptive statistical analysis of the above variables was carried out to determine the reliability of the data. The data of time series variables were standardized to eliminate heteroskedasticity’s effect and make the data more meaningful. The results are shown in Table 2. In addition, to ensure the stability and accuracy of the data analysis, it is necessary to test the multicollinearity between the explanatory variables (Liu et al., 2021), and it is generally considered that there is a severe covariance problem between the variables if the VIF value exceeds 10. The VIF value calculated is 3.19, which is less than 10, indicating no multicollinearity among this study’s explanatory variables.
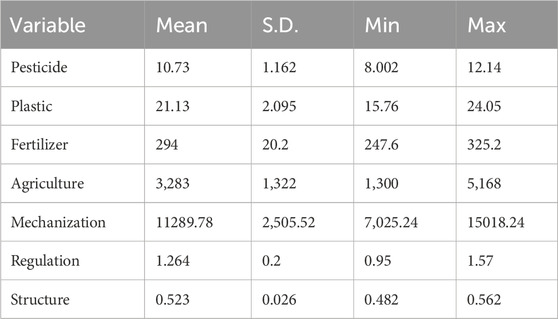
TABLE 2. Descriptive statistics of variables.
In this paper, regression analysis is conducted using data from Shandong Province from 2000 to 2020, with pesticide loss, fertilizer loss, and agricultural plastic film residue as dependent variables and gross agricultural product as independent variables. Because the results of the cubic term regression are not as significant and fit as the results of the quadratic term regression, only the results of the quadratic term of the regression equation are presented in Table 3.
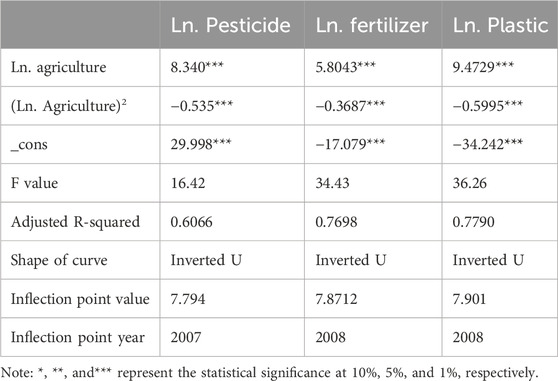
TABLE 3. Result of regression.
The regression results in Table 3 show that the coefficient of the primary term of the total agricultural output value is positive and significant at 1% level, and the coefficient of the secondary term is negative and significant at 1% level, which indicates that there is an “inverted U-curve” relationship between the ANSP and AEG in Shandong Province, which is in line with the EKC hypothesis. At the same time, the adjusted-R2 is 61%, 77%, and 78%, respectively, which are all greater than 60%, indicating that the EKC curves of ANSP and AEG are well fitted (as shown in Figure 2). The turning points of the three were reached when the total agricultural output value was 242.5 billion yuan, 262.1 billion yuan, and 270 billion yuan, respectively. The pesticide loss showed an inflection point in 2007, and the fertilizer loss and agricultural plastic film residue showed an inflection point in 2008. However, from Figure 2, the residual amount of agricultural film in Shandong Province declined slower than the loss of pesticides and fertilizers.
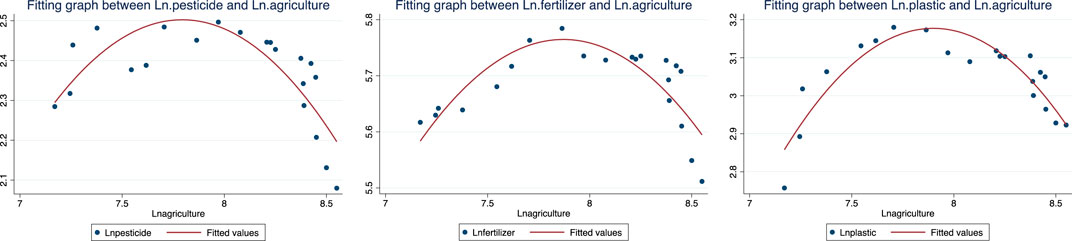
FIGURE 2. ANSP and agricultural economy fitting charts in Shandong Province.
To test the robustness of the EKC model, some control variables that have some effect on the explanatory variables were added. The results of the robustness test are shown in Table 4.

TABLE 4. Result of robustness test.
After adding the control variables, including the mechanization, the level of environmental regulation, and the structure of the agricultural industry, the coefficients are all significant. A significant inverted U-shaped curve relationship exists between the ANSP and AEG. Adding control variables does not affect the significance of the model but only changes the appearance of the turning point. The turning points are 363.5 billion yuan, 498 billion yuan, and 225.5 billion yuan, respectively. Compared with the situation without control variables, the turning points of fertilizers and pesticides are delayed, but the agricultural films reach the turning point earlier.
Next, the effect of control variables on ANSP is discussed. The use of machinery significantly increases the use of fertilizers. The possible reason is that agricultural technology has not been well applied to improve the yield, which will increase the use of fertilizers. The level of environmental regulation can significantly reduce the use of pesticides, fertilizers, and agricultural films, which shows that the strengthening of environmental regulation will have an inhibitory effect on agricultural pollution and shows the importance of policy constraints on pollution management.
Through the EKC curve to explore the characteristics of ANSP and AEG in Shandong Province, we can accurately derive the intuitive relationship between the two and the emergence of inflection points. However, the relationship between the ANSP and AEG is complex. The EKC cannot prove the existence of a logical relationship between the variables, the dynamic impact, and the intrinsic role of the mechanism. The VEC model can make up for the defects of the EKC model. Based on this, this paper adopts the VEC model for empirical analysis to explore the interaction between ANSP and economic growth in Shandong Province and to dynamically analyze the impact effect and the degree of contribution of the variables from multiple perspectives.
To test the smoothness of the time series data and avoid the pseudo-regression phenomenon in the process of time series analysis, this paper adopts the standard ADF unit root test, which is used to test the smoothness of Ln Pesticide, Ln Plastic, Ln Fertilizer, and Ln Agriculture. The test results show that the original variables are smooth only for agricultural plastic films, so performing first-order differences on the variables is necessary. Nevertheless, none of the results after their first-order difference are smooth, so they are subjected to second-order difference. After the second-order difference, the ADF values are all smaller than the critical value at the 1% significance level. All the above variables are second-order single-integrated sequences (Table 5), and there is a long-run and stable relationship. Therefore, it can be analyzed by cointegration test.
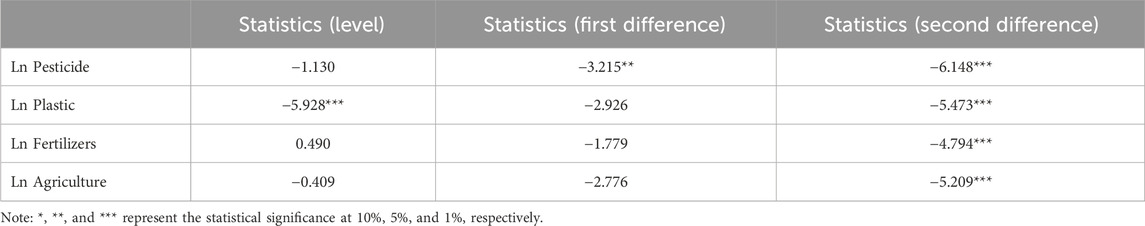
TABLE 5. ADF unit root test results.
To verify whether there is a long-run equilibrium relationship between the variables, a further Johansen cointegration test is conducted for Ln Pesticides, Ln Films, Ln Fertilizers, and Ln Agriculture (Johansen, 1988). The difference in the lagged period of VEC leads to the difference in the Johansen cointegration test, and the minimum of the AIC and SC values determines the lagged period. The optimal lag period is two. Then, the traces test is conducted with lag order two, and the results show that the hypothesis “there is no cointegration” is rejected. The hypothesis “there are at most two cointegrations” is accepted at a 5% significance level (Table 6). Therefore, the VEC model can be developed to explore further the dynamic relationship between ANSP and AEG.
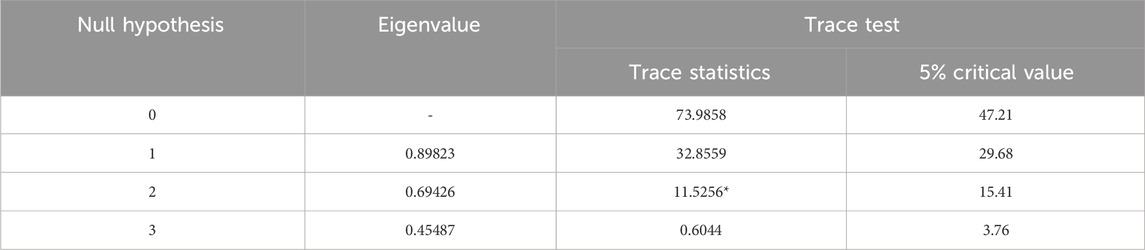
TABLE 6. Johansen cointegration test result.
According to (Granger, 1988), a set of variables with a cointegration relationship must have an error correction model. Therefore, the VECM is established, and the LM test is conducted. The test result accepts the original hypothesis of “no autocorrelation” of the residuals, indicating no autocorrelation (Gokmenoglu et al., 2019). Further, test whether the estimated VECM is smooth or not. All eigenvalues are within the unit circle, meaning that the conclusion of this paper based on the VECM is reliable.
Due to the high volatility of individual regression coefficients, the VECM analyzes the dynamic interaction of shocks among variables and the degree of explanatory contribution from a holistic perspective with the help of the impulse response function (IRF). IRF refers to the impact of the endogenous variables in the VECM on the current and future values after giving a standard deviation size shock to the random error term (Ehrmann et al., 2003), which can be very intuitively analyzed to show the intrinsic dynamic interactions and impacts among variables.
To further characterize the dynamics among the variables, a 10-period shock response was selected, and Stata17.0 was used to generate a plot of the impulse response function based on the VEC model, as shown in Figure 3, where the horizontal axis represents the number of periods tracked in the response function and the vertical axis represents the extent to which the dependent variable responds to the explanatory variables.
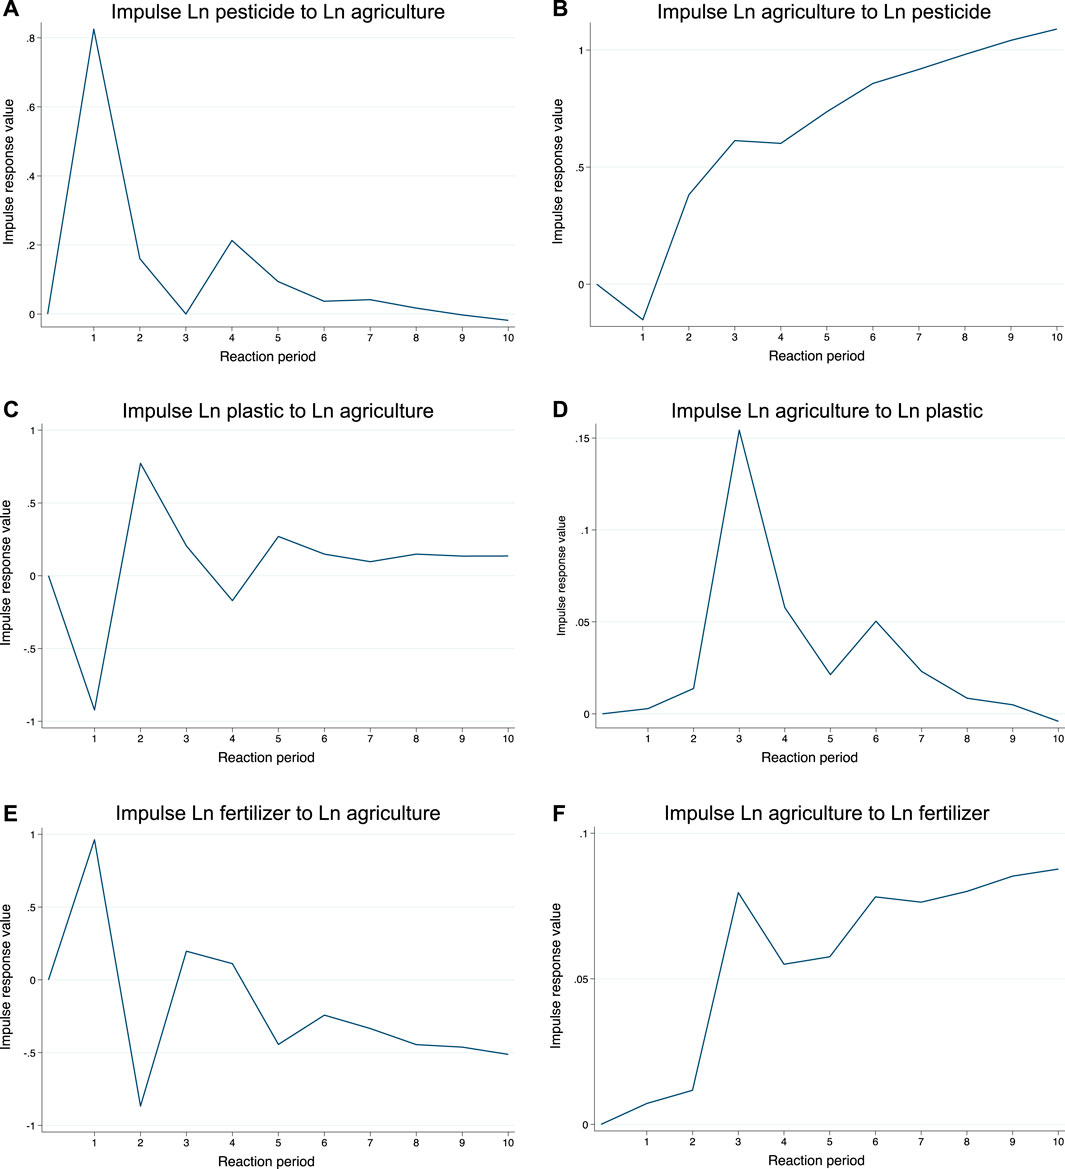
FIGURE 3. Impulse response diagram of ANSP and agricultural economy.
From Figure 3A, we can see that the response of Ln Pesticide to one standard deviation perturbation of Ln Agriculture produces an impulse response value of 0.825 in period one, with large fluctuations in the first four periods, which continues until period four after which it begins to gradually decline, and the average drive for periods 1–10 is 0.1368. The IRF value of the 10th period is −0.018 and shows signs of stable negative response convergence. This indicates a long-term close relationship between changes in pesticide loss and agricultural economy in Shandong Province. The dynamic shock effect on AEG has a positive driving effect in the short term and a negative inhibiting effect in the long term. From Figure 3B, the response of Ln Agriculture to a standard deviation perturbation of Ln Pesticide produces an impulse response value of −0.152 in the 1st period. The response value after the 2nd period is positive. It shows a slight fluctuation and growth tendency, and the average drive for periods 1–10 is 0.707. The IRF value of the 10th period is 1.09, and the overall performance of the incremental driving effect.
From Figure 3C, we can see that the response of Ln Plastic to a one standard deviation perturbation of Ln Agriculture produces an impulse response value of −0.922 in the 1st period, with more apparent fluctuations in the first five periods and then gradually leveling off after the 6th period, and the average drive for periods 1–10 is 0.0818, and a response value of 0.136 in the 10th period, and the overall performance was incremental promotion. From Figure 3D, the response of Ln Agriculture to a standard deviation perturbation of Ln Plastic produces an impulse response value of 0.0028 in period 1. The response values of periods 1-9 are positive and fluctuate within the range of [0.0028, 0.1542], and the average drive for periods 1–10 is 0.0332. The IRF value of the 10th period is −0.0041, which shows an overall positive boosting effect.
From Figure 3E, the response of Ln Fertilizer to one standard deviation perturbation of Ln Agriculture produces an impulse response value of 0.963 in period 1, with fluctuations of significant magnitude in the first four periods and a cumulative shock response value of 0.404 in periods 1–4. The fluctuation declined from the 4th period, and the average shock response value is −0.203 in the 1st to 10th period. The response value is −0.512 in the 10th period and shows an increasing inhibition effect. This indicates a long-term close relationship between changes in fertilizer loss and agricultural economy in Shandong Province, and the dynamic shock effect on AEG will have a positive promotion in the short term and a negative inhibition in the long term. From Figure 3F, the response of Ln Agriculture to one standard deviation perturbation of Ln Fertilizer produces an impulse response value of 0.0072 in the 1st period. The response values of 1–10 periods are all positive and fluctuating upward within the range of [0.0072, 0.0877], and the average drive for periods 1–10 is 0.0618. From the overall trend, it showed a boosting incremental impact.
The variance decomposition is expressed as the contribution of each endogenous variable to the system variables to evaluate the relative importance of the impulse disturbance term on the model variables (Diebold and Yılmaz, 2014). To further explore how pesticide loss, agricultural plastic film residue, and fertilizer loss contribute to the explanation of AEG, this paper further uses variance decomposition of the VECM, and the results are shown in Table 7.
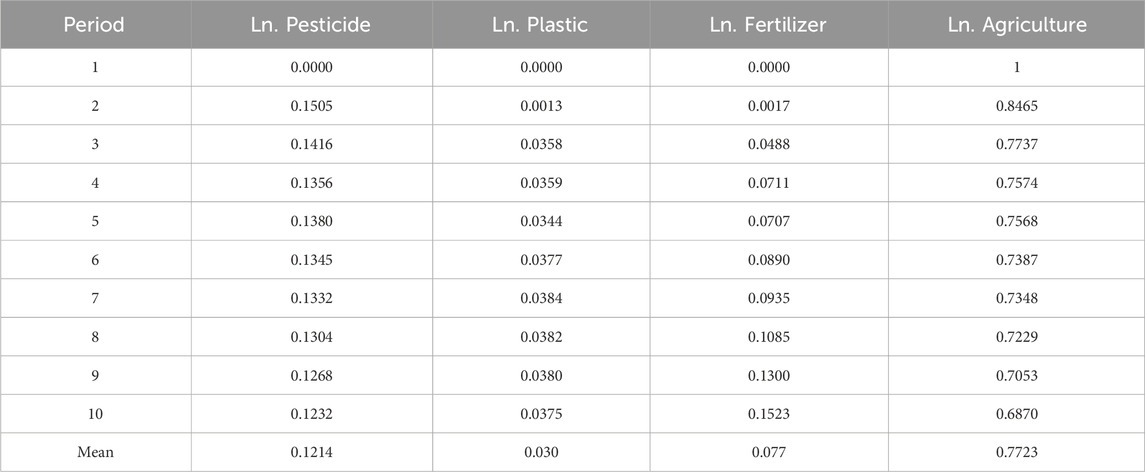
TABLE 7. Variance decomposition result.
In lag 1, the impact of pesticide loss, agricultural plastic film residue, and fertilizer loss on AEG are zero because most of the changes in the variables in period 1 come from themselves. Hence, the degree of self-contribution of agricultural GDP reaches 100%. The degree of pesticide loss contribution to explaining the agricultural economy’s growth rises to 15% from the beginning of period two. Then it shows a downward trend with minor fluctuations. The contribution of pesticide residue and fertilizer loss to AEG was small in the 2nd period and then showed a slight fluctuating growth trend from the 3rd period onwards. The average contribution of pesticides, agricultural plastic films, and fertilizers to AEG is 12.14%, 3%, and 7.7%, respectively. After excluding pesticides, fertilizers, and agricultural plastic films, the average contribution of the agricultural economy itself is 77.23%, which mainly includes scientific and technological innovation, agricultural mechanization level, labor force and agricultural production and business model, etc., (Lin et al., 2021; Shang et al., 2019).
ANSP and AEG in China are well acknowledged in the literature. However, existing studies have neglected to explore the mechanism of action between ANSP and economic development in Shandong province. This study fills these gaps by combining the EKC and VECM models. More insights can be gained by synthesizing these findings.
Firstly, the agricultural EKC curve in Shandong Province is consistent with the development of the national agricultural EKC trend, and there are other provinces that have an inverted U-shape like Shandong Province, such as Heilongjiang, Henan, Hebei and Guangdong (Cui et al., 2023; Gao et al., 2018; Shang et al., 2019; Sun et al., 2016). Table 8 compares the EKC trends in different provinces. Compared to other provinces, the EKC inflection point in Shandong province occurred earlier, which shows that the effect of ANSP control in Shandong Province is better than that in other big agricultural provinces. Shandong Province 11th Five-Year plan (Outline of the Eleventh Five-Year Plan for National Economic and Social Development of China) pointed out that the control of ANSP should be taken as an important goal and the prevention should be strengthened. However, there are also provinces with N or inverted-N trends between ANSP and AEG (Dong et al., 2023; Lin et al., 2021; Xu et al., 2022). This is mainly due to the different levels of agricultural economic development in each province. The western region develops slowly and is still in the N-type rising stage, while the eastern region develops highly and is in the second declining stage. As an eastern region, Shandong Province should learn from the advanced agricultural development province.
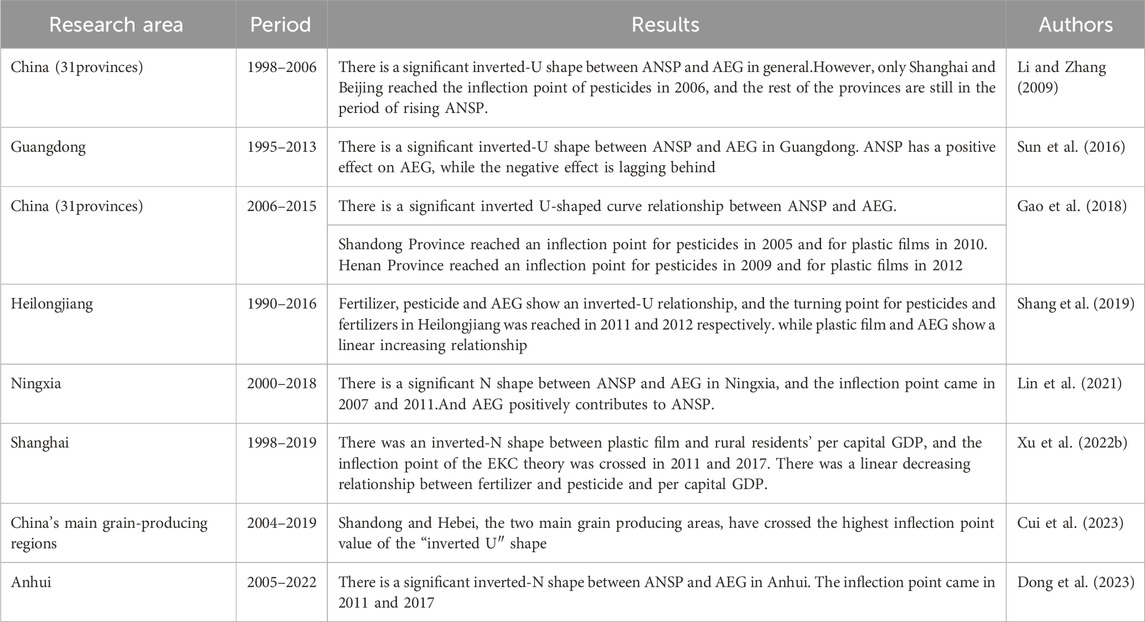
TABLE 8. Comparison of EKC hypothesis in China.
At the same time, compared to other industrial sectors in Shandong Province, the inflection points of the inverted U-shaped curve of industrial pollution and economic development occurred in 2012 (Li et al., 2016). In addition, domestic wastewater discharge and economic development were in a U-shape and a right-handed upward and have not yet reached an inflection point (Liu et al., 2019). In contrast, the inflection point for ANSP and the economy in Shandong Province occurred earlier (in 2008 and 2009), which may be attributed to the strong support of national policies. In 2005, China proposed solving the “three rural” problems (rural, agricultural, farmers). In 2006, China promulgated a plan indicating the need to change the growth mode and actively prevent and control rural surface pollution. Moreover, in recent years, Shandong Province optimized the layout of the industrial structure adjustment effect, which is remarkable after adjusting the current primary industry, which accounted for a significant decline in the proportion of the industrial structure. The transformation of “one, two, three” to “two, three, one” has been completed in the industrial structure (He et al., 2017).
Secondly, the IRF was further applied to investigate the interaction mechanism between ANSP and AEG in Shandong Province, which enriched the research results on regional ANSP in China. The results show that Shandong Province is currently highly dependent on pesticides and fertilizers. Combined with the development trend of the EKC curve in Shandong Province, pesticides and fertilizers have reached the low point on the right side. To prevent the second high point of the inverted “U” curve in Shandong Province, it is necessary to adhere to the unshakeable policy of agricultural environmental protection. Otherwise, it may turn into an “N” type. The study found that the “N” curve between pesticide and fertilizer use and AEG in Ningxia is currently in the second stage of an upward trend (Lin et al., 2021). Shandong Province should take this as a lesson to adopt more stringent agricultural environmental protection policies. By contrast, the ANSP caused using agricultural plastic films in the short term is not yet evident, and according to the studies on Heilongjiang and Guangdong provinces (Shang et al., 2019; Sun et al., 2016) show a mutually reinforcing effect between the use of agricultural films and AEG. This suggests that agricultural films are necessary to ensure high crop yields, and they can improve outcomes and promote AEG (Zou et al., 2020). But at the same time, pollution of agricultural films should be reduced. We need to strengthen technological innovation, improve the reuse rate of agricultural films, and promote the use of biodegradable agricultural films.
Thirdly, one of the most exciting findings is that the contribution of pesticides, fertilizers, and agricultural films to AEG in Shandong Province is low compared to other provinces and municipalities. Specifically, in contrast to the average contribution of the agricultural GDP itself is 77.23%, while in other regions it is around 40% (Lin et al., 2021; Shang et al., 2019), this part mainly includes scientific and technological innovation, the level of agricultural mechanization, the number of laborers, and the mode of agricultural production and management (Yi et al., 2021; Duan and Li, 2023; Wang et al., 2023). It shows that labor force capital, agricultural mechanization level, and agricultural production and management mode in Shandong Province promote agricultural economic development more than pesticides, fertilizers, and agricultural plastic films, and agricultural production activities are gradually transforming into green growth. Other studies also confirm this view that technological progress and the increase in the proportion of human capital of agricultural science and technology are the main factors of Shandong Province’s economic growth (Zhang and Liu, 2015; Tian et al., 2022)), so Shandong Province should increase the investment and accumulation of agricultural science and technology human capital and continue to improve the level of agricultural mechanization.
At the same time, the EKC curve is an empirical curve, which needs a long enough sample to be tested. Considering the availability of statistical data in Shandong Province, only 21 years of data are used in the paper, and long-term observations are needed in the future to obtain a more comprehensive understanding. In addition, the geographical conditions, climatic conditions, and economic development levels of different regions within Shandong Province vary, and to clearly illustrate the synergistic mechanism between ANSP and economic growth in the whole of Shandong Province, the spatial differentiation of ANSP needs to be further explored, so that the results of the study can be more practically guided.
Based on the time series data of Shandong Province from 2000 to 2020, this paper examines the realistic characteristics between ANSP and AEG through EKC curves. It explores the dynamic relationship and the mechanism of action between the two based on the VEC model. The main findings include the following:
(1) There is a significant inverted “U” shape between the ANSP and AEG in Shandong Province. The inflection points of pesticides appeared in 2007, and fertilizer and agricultural plastic film appeared in 2008. They have exceeded the inflection point and are on the right side of the inverted U curve. In contrast, the decline in agricultural plastic film residues is slower than that caused by pesticide and fertilizer loss. The addition of the control variables only changed the appearance of the inflection point, and the inverted U-shaped curve remained significant. The level of environmental regulation significantly suppresses ANSP, while the level of mechanization increases fertilizer use.
(2) Changes in pesticide and fertilizer loss contribute positively to the dynamic shock effect on AEG in the short term, but in the long term, the dynamic shock effect of AEG has an inhibitory incremental impact. The dynamic effect of the two-way impulse response diagram between the residual amount of agricultural plastic film and AEG shows a positive promotion effect. Therefore, it is necessary to continue to strengthen the policy constraints on the use of pesticides and fertilizers. Otherwise, it will evolve into an “N” curve. Meanwhile, it is necessary to strengthen technological innovation to reduce the pollution of agricultural plastic films.
(3) The average explanatory contribution of pesticide loss, fertilizer loss, and agricultural film residue to AEG decreases in order 12.14%, 7.7%, and 3%, and the average contribution of the agricultural gross product itself reaches 77.23%, which indicates the level of agricultural mechanization, labor capital and the method of agricultural production and management contribute more to the development of the agricultural economy than the use of pesticides, fertilizers, and agricultural plastic films.
Firstly, agricultural pollution control in Shandong Province focuses on agricultural plastic films. The reason is that the residual number of agricultural films is twice as much as that of pesticides, but it produces the most minor economic benefits. Moreover, in the long term, the continued growth of the agricultural economy will result in more pollution from agricultural plastic films. Therefore, on the one hand, it is necessary to strengthen technical research and development to produce biodegradable agricultural films. On the other hand, it is also essential to promote the technology of agricultural film recycling to reduce the harm of residual film pollution.
Secondly, the government should increase policy constraints, especially on pesticides and fertilizers. For the more severe sources of pollution, the administrative means of intervention should be strengthened. For small and scattered sources of pollution, guidance should be provided through subsidies and other market incentives. At the same time, environmental news reports and public education are strengthened to enhance farmers’ awareness of environmental protection and reduce pollution at the source.
Finally, promote the use of green and clean energy machinery and the development of agricultural machinery and equipment for intelligent integration. At the same time, the government should shift the focus of agriculture to relying on scientific and technological innovation and improving the quality of workers.
The findings of this paper have some reference value for studying the relationship between ANSP and AEG in Shandong Province, but there are also some limitations. This paper’s selection of control variables is rather limited and fails to reflect all the factors affecting ANSP. Future research can focus on a more comprehensive perspective to have a more comprehensive understanding of ANSP in China.
The datasets used and analyzed during the current study are available from the corresponding author upon reasonable request.
SZ: Conceptualization, Funding acquisition, Visualization, Writing–original draft, Writing–review and editing. YL: Data curation, Writing–original draft, Writing–review and editing. PZ: Supervision, Visualization, Writing–review and editing.
The author(s) declare financial support was received for the research, authorship, and/or publication of this article. This study was funded by the Natural Science Foundation of Shandong Province (ZR2020QG062).
The authors declare that the research was conducted in the absence of any commercial or financial relationships that could be construed as a potential conflict of interest.
All claims expressed in this article are solely those of the authors and do not necessarily represent those of their affiliated organizations, or those of the publisher, the editors and the reviewers. Any product that may be evaluated in this article, or claim that may be made by its manufacturer, is not guaranteed or endorsed by the publisher.
Cui, N., Ba, X., and Liu, J. (2023). Agricultural surface pollution and agricultural economic growth in major grain producing areas EKC test. Statistics Decis. 39, 79–83. doi:10.13546/j.cnki.tjyjc.2023.04.014
Destek, M. A., and Sarkodie, S. A. (2019). Investigation of environmental Kuznets curve for ecological footprint: the role of energy and financial development. Sci. Total Environ. 650, 2483–2489. doi:10.1016/j.scitotenv.2018.10.017
Diebold, F. X., and Yılmaz, K. (2014). On the network topology of variance decompositions: measuring the connectedness of financial firms. J. Econ. 182, 119–134. doi:10.1016/j.jeconom.2014.04.012
Ding, L., Qi, C., and Zhang, W. (2023). Distribution characteristics of non-point source pollution of TP and identification of key source areas in Nanyi Lake (China) Basin: based on InVEST model and source list method. Environ. Sci. Pollut. Res. 30 (55), 117464–117484. doi:10.1007/s11356-023-30405-y
Dong, H., Han, J., Zhang, Y., Chen, T., Sun, Z., Hou, X., et al. (2023). Measurement and temporal and spatial characteristics of agricultural eco-efficiency under climate change: a case study of Anhui, China. Front. Sustain. Food Syst. 7, 1255235. doi:10.3389/fsufs.2023.1255235
Duan, T., and Li, Y. (2023). A multiscale analysis of the spatially heterogeneous relationships between non-point source pollution–related processes and their main drivers in Chaohu Lake watershed, China. Environ. Sci. Pollut. Res. 30 (37), 86940–86956. doi:10.1007/s11356-023-28233-1
Ehrmann, M., Ellison, M., and Valla, N. (2003). Regime-dependent impulse response functions in a. Markov-switching vector autoregression model. Econ. Lett. 78, 295–299. doi:10.1016/s0165-1765(02)00256-2
Gao, R. M., Du, J., and Li, X. T. (2018). Dynamic analysis of agricultural growth and environmental pollution - verification based on panel data from 2006 to 2015. Chin. J. Agric. Resour. Regional Plan. 39, 138–145. doi:10.7621/cjarrp.1005-9121.20181219
Ge, J., and Zhou, S. (2011). Analysis of economic influencing factors of agricultural surface pollution--Based on the data of Jiangsu Province from 1978 to 2009. Chin. Rural. Econ. 05, 72–81.
Gokmenoglu, K. K., Taspinar, N., and Kaakeh, M. (2019). Agriculture-induced environmental Kuznets curve: the case of China. Environ. Sci. Pollut. Res. 26 (36), 37137–37151. doi:10.1007/s11356-019-06685-8
Granger, C. (1988). Some recent development in a concept of causality. J. Econ. 39 (1-2), 199–211. doi:10.1016/0304-4076(88)90045-0
Guan, N., Liu, L., Dong, K., Xie, M., and Du, Y. (2023). Agricultural mechanization, large-scale operation and agricultural carbon emissions. Cogent Food & Agric. 9 (1), 2238430. doi:10.1080/23311932.2023.2238430
Haider, A., Rankaduwa, W., Ul Husnain, M. I., and Shaheen, F. (2022). Nexus between agricultural land use, economic growth and N2O emissions in Canada: is there an environmental Kuznets curve? Sustainability 14 (14), 8806. doi:10.3390/su14148806
He, Z. R., Hong, M. X., and Niu, F. B. (2017). A study on regional differences in industrial structure optimization and economic growth path--Taking Shandong Province as an example. Dongyue Trib. 38, 144–150.
Hossain, M. R., Rej, S., Awan, A., Bandyopadhyay, A., Islam, M. S., Das, N., et al. (2023). Natural resource dependency and environmental sustainability under N-shaped EKC: the curious case of India. Resour. Policy 80, 103150. doi:10.1016/j.resourpol.2022.103150
Johansen, S. (1988). Statistical analysis of cointegration vectors. J. Econ. Dynam. Contr 12, 231–254. doi:10.1016/0165-1889(88)90041-3
Li, H., and Zhang, J. (2009). Empirical study on the relationship between agricultural surface pollution. and economic development in China. Res. Environ. Yangtze Basin 18, 585–590. doi:10.3969/j.issn.1004-8227.2009.06.015
Li, N., Wei, Y., Wang, L., Zeng, C., Ma, X., and Wu, H. (2016). Impact of industrialization on water protection in the huai river basin within Shandong province, China. Nat. Hazards 81, 1193–1207. doi:10.1007/s11069-015-2128-5
Li, X., and Shang, J. (2023). Spatial interaction effects on the relationship between agricultural economic and planting non-point source pollution in China. Environ. Sci. Pollut. Res. 30 (18), 51607–51623. doi:10.1007/s11356-023-25929-2
Lin, J., Wang, Y., and Fan, X. (2021). Research on economic driving characteristics of agricultural non-point source pollution in Ningxia. J. Arid. Land Resour. Environ. 35, 58–65. doi:10.13448/j.cnki.jalre.2021.069
Lin, Q., Cheng, Q., Zhong, J., and Lin, W. (2022). Can digital financial inclusion help reduce agricultural non-point source pollution? an empirical analysis from China. Front. Environ. Sci. 10, 1074992. doi:10.3389/fenvs.2022.1074992
Liu, D., Zhu, X., and Wang, Y. (2021). China’s agricultural green total factor productivity based on carbon emission: an analysis of evolution trend and influencing factors. J. Clean. Prod. 278, 123692. doi:10.1016/j.jclepro.2020.123692
Liu, Y., Zhang, Z. X., Zhang, F. X., Liu, B., and Zhou, S. W. (2019). Study on the relationship between. water environment pollution and economic development in Shandong Province in the past 15 years. J. Chin. Inst. Water. Resour. Hydr. Res. 17, 414–422. doi:10.13244/j.cnki.jiwhr.2019.06.003
Lu, Y., Wang, C., Yang, R., Sun, M., Zhang, L., Zhang, Y., et al. (2023). Research on the progress of agricultural non-point source pollution management in China: a review. Sustainability 15 (18), 13308. doi:10.3390/su151813308
Pang, A., and Wang, D. (2023). Evaluation of agricultural and rural pollution under environmental measures in the Yangtze River Economic Belt, China. Sci. Rep. 13 (1), 15495. doi:10.1038/s41598-023-42837-0
Pradhan, R. P., and Bagchi, T. P. (2013). Effect of transportation infrastructure on economic growth in India: the VECM approach. Res. Transp. Econ. 38 (1), 139–148. doi:10.1016/j.retrec.2012.05.008
Rahman, A. K. M. A., Galiano, J. C., Murshed, M., Balsalobre-Lorente, D., Mahmood, H., and Hossain, Md. E. (2023). Reinvigorating the environmental Kuznets curve hypothesis in the context of highly polluted nations: evidence using advanced panel estimation techniques. Environ. Sci. Pollut. Res. 30 (46), 103212–103224. doi:10.1007/s11356-023-29237-7
Rej, S., Nag, B., and Hossain, Md. E. (2022). Can renewable energy and export help in reducing ecological footprint of India? Empirical evidence from augmented ARDL Co-integration and dynamic ARDL simulations. Sustainability 14 (23), 15494. doi:10.3390/su142315494
Shang, J., Shi, R., and Zhang, B. (2019). Evolution and dynamic analysis of the relationship between. agricultural non-point source pollution and agricultural economic growth. Rural. Econ. 09, 132–139. doi:10.3969/j.issn.1009-0568.2022.01.015
Shi, L., and Jing, X. W. (2016). Research on the relationship between agricultural economic growth and surface. source pollution in Qingdao--an empirical analysis based on EKC theory. Shandong Agric. Sci. 48, 166–169. doi:10.14083/j.issn.10014942.2016.02.039
Sun, D. Y., Yang, Q. Y., Zhang, J. X., Pu, X. M., Shen, H. F., and Lin, B. R. (2016). Relationship between agricultural non-point source pollution and agricultural economic development in Guangdong Province. China. Popul. Res. Environ. 26, 102–105.
Tian, S., Xu, Y., Wang, Q., Zhang, Y., Yuan, X., Ma, Q., et al. (2022). Research on peak prediction of urban differentiated carbon emissions—a case study of Shandong Province, China. J. Clean. Prod. 374, 134050. doi:10.1016/j.jclepro.2022.134050
Waheed, R., Chang, D., Sarwar, S., and Chen, W. (2018). Forest, agriculture, renewable energy, and CO2 emission. J. Clean. Prod. 172, 4231–4238. doi:10.1016/j.jclepro.2017.10.287
Wang, H., Liu, C., Xiong, L., and Wang, F. (2023). The spatial spillover effect and impact paths of agricultural industry agglomeration on agricultural non-point source pollution: a case study in Yangtze River Delta, China. J. Clean. Prod. 401, 136600. doi:10.1016/j.jclepro.2023.136600
Xu, B., Niu, Y., Zhang, Y., Chen, Z., and Zhang, L. (2022a). China’s agricultural non-point source pollution and green growth: interaction and spatial spillover. Environ. Sci. Pollut. Res. 29 (40), 60278–60288. doi:10.1007/s11356-022-20128-x
Xu, F., and Gao, Q. S. (2022). Study on the relationship between agricultural surface pollution and agricultural. economic growth in Shandong Province. J. Heilongjiang Bayi Agric. Univ. 34, 110–117.
Xu, P., Li, S., Yang, X., and Li, Y. (2022b). Research on the relationship between urban agricultural nonpoint source pollution and rural residents’ income growth. J. Environ. Public Health 2022, 1–9. doi:10.1155/2022/4133245
Xu, Y., Liu, Z. H., and &Jiang, L. H. (2010). Analysis of the current situation of agricultural surface pollution in. Shandong Province and its prevention and control measures. China Agric. Meteorol. 31 (S1), 61–65.
Yi, X., Lin, D., Li, J., Zeng, J., Wang, D., and Yang, F. (2021). Ecological treatment technology for agricultural non-point source pollution in remote rural areas of China. Environ. Sci. Pollut. Res. 28 (30), 40075–40087. doi:10.1007/s11356-020-08587-6
Yu, J., Pu, S., and Zhou, L. (2016). Empirical analysis of agricultural surface pollution and agricultural growth. in Sichuan Province. Rural. Econ. 09, 56–60.
Zhang, H. Y., and Liu, Y. Z. (2015). Analysis of factors affecting agricultural economic growth in Shandong. Province from 2009 to 2012. J. South. Agric. 46, 717–721. doi:10.3969/j:issn.2095-1191.2015.4.717
Zhao, Z., Liu, K., Yu, B., Liu, G., Wang, Y., and Wu, C. (2023). Modeling of agricultural nonpoint-source pollution quantitative assessment: a case study in the mun river basin, Thailand. Sustainability 15 (13), 10325. doi:10.3390/su151310325
Zou, L., Liu, Y., Wang, Y., and Hu, X. (2020). Assessment and analysis of agricultural non-point source pollution loads in China: 1978–2017. J. Environ. Manag. 263, 110400. doi:10.1016/j.jenvman.2020.110400
Keywords: agricultural non-point source pollution, agricultural economic growth, inverted U-shaped EKC, VECM, dynamic relationship
Citation: Zhang S, Luo Y and Zhang P (2024) Economic driving characteristics of agricultural non-point source pollution and prevention suggestions: a case study from Shandong province in China. Front. Environ. Sci. 12:1352412. doi: 10.3389/fenvs.2024.1352412
Received: 08 December 2023; Accepted: 08 February 2024;
Published: 22 February 2024.
Edited by:
Faik Bilgili, Erciyes University, TürkiyeReviewed by:
Emran Hossain, Bangladesh Agricultural University, BangladeshCopyright © 2024 Zhang, Luo and Zhang. This is an open-access article distributed under the terms of the Creative Commons Attribution License (CC BY). The use, distribution or reproduction in other forums is permitted, provided the original author(s) and the copyright owner(s) are credited and that the original publication in this journal is cited, in accordance with accepted academic practice. No use, distribution or reproduction is permitted which does not comply with these terms.
*Correspondence: Pu Zhang, MTgwNTMxMTMwNTFAMTYzLmNvbQ==
Disclaimer: All claims expressed in this article are solely those of the authors and do not necessarily represent those of their affiliated organizations, or those of the publisher, the editors and the reviewers. Any product that may be evaluated in this article or claim that may be made by its manufacturer is not guaranteed or endorsed by the publisher.
Research integrity at Frontiers
Learn more about the work of our research integrity team to safeguard the quality of each article we publish.