 Jun Yan
 Chang Liu2
 Suzhen Wang
- 1Institute of Traditional Chinese Medicine and Health Development, Jiangxi University of Chinese Medicine, Nanchang, China
- 2Institute of Chinese Medical Sciences, University of Macau, Macao, Macao SAR, China
- 3Department of Big Data Research of TCM, Guangdong Provincial Hospital of Traditional Chinese Medicine, Guangzhou, Guangdong, China
Sustainable economic development is a hot issue in current research, and it is of great significance to analyze the effects of air pollution and population agglomeration on sustainable economic development. This study collects the relevant data released by the Chinese government from 2011–2021, and empirically analyzes the method of constructing an individual one-factor fixed-effects model in order to explore the impacts of SO2 emissions and population agglomeration on sustainable economic development. Through the analysis, it is found that SO2 emissions are negatively correlated with sustainable economic development, and the direction and intensity of its influence are affected by urbanization level, industrial structure, and living standards of residents. The influence of population agglomeration on economic sustainable development is positively correlated. Meanwhile, through the sub-regional study, we further confirmed that the impact of the above influencing factors on the sustainable economic development of different regions is different. Therefore, in order to promote sustainable economic development, it is necessary to further identify the stage of sustainable economic development according to the actual situation of different regions, and to effectively integrate factors including the environment, population, urbanization, industrial structure, etc.
1 Introduction
Since the Chinese government conducted economic reforms and opening up policy, China’s economy has experienced rapid growth, propelling it to the position of the world’s second-largest economy by 2010 (Niu and Jiang, 2021). However, this remarkable economic development has indisputably given rise to a host of environmental challenges. According to a study conducted by the World Bank, China, now the globe’s second-largest economy, stands as the leading emitter of carbon dioxide and sulfur dioxide worldwide (Jing Su, 2023). In recent years, the Chinese government has i put more efforts to address environmental pollution. The China Ecological Environment Status Bulletin for 2022, released by the Ministry of Ecology and Environment, reveals that out of the 339 cities at prefecture level and above in China, 62.8% (213 cities) achieved ambient air quality that met established standards. Conversely, 37.2% (126 cities) experienced ambient air quality surpassing the stipulated standards. Despite considerable improvements in overall air quality, lingering air pollution issues demand urgent attention. Effectively resolving the air pollution predicament stands as a pivotal challenge in promoting sustainable economic development for China. Chinese government should grapple with this issue to ensure a harmonious balance between economic growth and environmental preservation.
From the standpoint of population and economic development, a close correlation exists between rapid economic growth and swift population agglomeration. The process of population agglomeration unfolds in tandem with the progression of urbanization. As per the data provided by China’s National Bureau of Statistics in 2022, the urbanization rate in China is anticipated to reach 65.22%, further accentuating the impact of population agglomeration. On one hand, population agglomeration brings about an influx of labor, thereby fostering economic development. On the other hand, the surge in population gives rise to a myriad of challenges, including issues related to urban construction, traffic congestion, and environmental pollution. These challenges act as impediments to the sustainable development of the economy (Xie et al., 2021). Consequently, the effective coordination of population agglomeration and economic development emerges as a pivotal research concern.
The theory of sustainable development integrates population, economy, resources, and the environment into a unified framework for comprehensive research. Currently, a key research focus lies in investigating the intricate connections among air pollution, population concentration, and sustainable economic development (Ferasso et al., 2021; Ahmed et al., 2022; Rice et al., 2022). This study comprehensively measures the economic sustainability index through five indicators: GDP per capita, dust emissions per unit of GDP, the rate of harmless treatment of domestic garbage, the proportion of the tertiary industry in GDP, and the number of effective invention patents in industrial enterprises above designated size. The fixed effect model is used to comprehensively analyze the impact of sulfur dioxide emissions, population concentration, urbanization, industrial structure and other factors on economic sustainability. For the first time, the geographical differences in the impact of the above factors on the sustainable development of the economy are analyzed by region. It provides a reference for the sustainable economic development of the same type of region.
This study is structured to address this inquiry in the following manner: the second section provides a thorough literature review, the third section conducts a methodological analysis and the variables data used, the fourth section presents the results of the data analysis, the fifth section discusses the results of the analysis, and finally, the sixth section summarizes.
2 Literature review
As a key issue that needs to be addressed urgently, the study of key factors affecting sustainable economic development plays an important role in contributing to sustainable economic development.
The impact of environmental pollution on sustainable economic development is a challenging issue globally (ElMassah and Hassanein, 2023). Several theories confirm the relationship between environmental and economic sustainability (Zhong et al., 2021). A prominent theory is coring macroeconomic theory, which asserts that the incorporation of elements such as green innovation, green energy and the use of renewable resources are critical to achieving economic sustainability. The use of cleaner energy sources, by reducing reliance on traditional and environmentally harmful sources such as coal, crude oil, and fossil fuels, can contribute to improved growth in developing economies (Amir et al., 2023). Drawing on sectoral datasets provided by the World Input-Output Database (WIOD) available for the period 1995–2009, Asici found that through simple input-output accounting, that the economic growth path adopted in the period 2003–2009 generated more environmental pollution than in the period 1995–2002. The deterioration of environmental and labor standards led to a rapid increase in environmental degradation and fatal workplace accidents after 2002 (Asici, 2015). Wagner’s empirical analysis of the European paper industry, based on an index of emissions, found a pre-dominantly negative relationship between environmental and economic performance. The relationship between environmental and economic performance is more positive for companies with a corporate environmental strategy oriented towards pollution prevention (Wagner, 2005). By analyzing the negative impacts of air pollution in Tehran, the capital of Iran, Karimzadegan determines that air pollution imposes a more severe economic burden by affecting human health (Karimzadegan et al., 2008). Sulfur dioxide, carbon dioxide and other environmental pollution problems caused by industrial production have been of great concern (Mohsin et al., 2022; Xiu et al., 2022). Using a computable general equilibrium model, Kiuila shows that future sulfur dioxide emission reductions may have a positive impact on Polish economic indicators (Kiuila, 2003). There is a long-term dynamic relationship between SO2 emissions and economic growth. In the short term, GDP has a positive impact on total SO2 emissions, and in the long term, improvements in energy efficiency can have a significant negative impact on emissions (Hu et al., 2019). Rapid economic development in exchange for high levels of pollution is undesirable and may have adverse consequences, including climate change and a sharp decline in natural resources (Katyal, 2009). Some regions, according to their own characteristics, can obtain the best social development benefits by weighing the balance between economic development and environmental protection (Fang et al., 2017). At the same time, environmental governance can also contribute to economic gains to a certain extent (Carnevale et al., 2018). A survey showed that of the 122 companies belonging to the different sectors of the European Dow Jones Responsibility Index from 2007 to 2009, the companies with the best environmental performance also received the greatest economic and financial benefits (Pérez-Calderon et al., 2011). During China’s transition to the “New Normal Stage” between 2007 and 2017, emission intensity reduced SO2 emissions by 16.560,886 tons, while economy-scale SO2 emissions increased by 473.490 tons. The contribution of emission intensity increased from −823% to −189.2%, while the contribution of economic scale decreased from 131.8% to 54.1%. It shows that the relationship between sulfur dioxide emissions and economic development is not static. The impact of air pollution on sustainable economic development is very significant. However, there are differences in the conclusions drawn from different research perspectives and research samples (Yuan et al., 2020). Therefore, how to effectively deal with environmental problems in the light of the actual situation of the region is of great significance in promoting sustainable economic development.
In addition to the environmental perspective, social analysis is essential for a comprehensive sustainability diagnosis of economic development, of which population is a key factor (González-García et al., 2019). Population concentration and sustainable economic development are closely related. Population size, together with industrial structure, technological innovation, etc., influences economic development (Xin et al., 2023). Population agglomeration brings rapid economic development, but also increased consumption of resources and dependence on external resources (Fang et al., 2017). Growing population demand for natural capital, driven by anthropogenic activities, may lead to excessive demand for ecological resources. i.e., water resources, energy resources and land resources (Germani et al., 2014). On the other hand, the consumption of living resources by population growth may bring about a series of environmental governance problems (Orner et al., 2021). Therefore, thinking about the sustainable path of socio-economic activities from the perspective of population development has become an unavoidable and important issue (Jabeen et al., 2023). As population density increases, the impact on regional industrial structure is significant (Phiri et al., 2020). Under certain circumstances, there may be mediating variables in the impact of population agglomeration on economic sustainability. Ravichandran points out that population agglomeration brings about renovation and upgrading of urban amenities, which to some extent may inhibit eco-nomic sustainability (Ravichandran et al., 2021). Through his research, Glaesr found that the allocation of social resources brought about by an increase in population has a significant impact on the improvement of labor productivity. The level of labor productivity is an important factor affecting sustainable economic development (Glaser and Diele, 2004). Therefore, population agglomeration brings not only abundant labor force, but also more social governance problems (Wojewódzka-Wiewiórska et al., 2020). Population agglomeration generates more consumer demand, such as tourism and shopping, and this part of demand plays an important role in stimulating economic development (Ahmad and Jabeen, 2023). Therefore, the mechanism of population agglomeration’s effect on sustainable economic development is very complex and has high research value.
From the perspective of the urbanization process, the impact of urbanization development on sustainable economic development is complex (Gonzalez-Garcia et al., 2018). Urbanization has driven the demand for fossil fuels, and demand has contributed to rapid economic development. On the other hand, overexploited resources have caused serious damage to environmental pollution and hindered sustainable economic development (Chen et al., 2023b). Over the past 4 decades, China has experienced rapid parallel economic development and urbanization, leading to large-scale migration within its borders from increasingly marginalized rural areas to urban centers where employment opportunities and wealth are now concentrated. This has greatly contributed to economic and social development, but it has also created problems of governance and development in megacities (Huang et al., 2016; Zhao et al., 2022a). International trade and urbanization in Sub-Saharan Africa (SSA) are growing at an unprecedented rate. Iheonu, through his study of the region’s economic development, has found that there is a bi-directional causal relationship between urbanization, environ-mental pollution, and economic development (Iheonu et al., 2021). Yang explores the dynamic relationship between urbanization, environmental sustainability, and economic growth in the presence of industry value added in 30 International Energy Agency (IEA) member countries. Policymakers in IEA countries are encouraged to strengthen policy research for sustainable urbanization and economic development (Yang and Khan, 2022). Research based on urbanization reveals the important role of urbanization in sustainable economic development, and therefore the indicator needs to be focused on in the analysis of sustainable economic development.
From the perspective of the standard of living of the population, Environmental Kuznets Curve (EKC) hypothesis proposes that there is a positive correlation between per capita income and environmental quality when a growing economy reaches a high level of economic development (Tenaw and Beyene, 2021). Henderson explains the important role of wages and salaries in local economic development by analyzing the economic multiplier effects of employment, wages and salaries, and value added in 13 U.S. states (Henderson et al., 2017). Reasonable wage levels and divisions are effective in promoting a sustainable economy. From the point of view of industrial structure. The prerequisites for sustainable economic measurement are economic development, environmental protection, and social performance. It is important to realize maximum output with minimum inputs through the adjustment of industrial structure (Paloviita, 2004). Over-industrialization is creating huge economic disparities, chaotic and unequal societies, and undermining the natural environment and quality of life for most of the planet’s population. Focused consideration is needed for investing in sustainable long-term projects with low economic returns or innovating short-term incremental production (Scheel, 2016). For traditional agricultural producers, technological innovations are needed to improve the quality of crops and increase incomes, thereby realizing sustainable economic development (Pala et al., 2004). For highly polluting industries, internal governance needs to be further strengthened to match economic development (Senkoto, 2019). In terms of the level of foreign investment use. Huang uses panel data analysis techniques to analyze data from 2001 to 2019 from a panel of 19 developed and developing countries that highlight the interplay between economic growth, foreign investment, and environmental policies (Huang et al., 2023). Jalil investigates the impact of energy and economic-related variables on 49 countries of the Belt and Road Initiative from 1995–2018, suggesting that policymakers, experts, and governments must incentivize and applaud portfolio investors to make sustainable green investments that translate economic growth into sustainable and energy-efficient development (Jalil et al., 2021). Nepal reached similar conclusions by examining aspects of India’s foreign economic cooperation (Nepal et al., 2021). Through his study, Bakhsh found that developing countries like Pakistan depend largely on fossil fuels for higher economic growth, but environmental rules and regulations to attract foreign direct investment (FDI) are haphazard, which in turn affects economic development (Bakhsh et al., 2022). Therefore, elements such as the living standard of the population, industrial structure and utilization of foreign capital are important influencing factors for sustainable economic development, but the mechanism of their action may be different depending on the combination of different variables. Therefore, the selection needs to be rationalized according to the research objectives.
Overall, sustainable economic development is a systematic subject. Its development is affected by a variety of factors such as environmental pollution, social development, population agglomeration and urbanization. At the same time, there are differences in the influencing role and mechanism of each influencing factor. Therefore, it is of great significance to analyze the influencing factors and action mechanisms of sustainable eco-nomic development to promote sustainable economic development.
3 Modeling and variable selection
3.1 Model construction
In order to study the relationship between economic sustainability, environmental pollution and population agglomeration, this study establishes a regression model on the basis of related research and draws on the research of Zhao (Zhao et al., 2022b) and other scholars. The details are as follows:
The explanatory variable of this study is Economic Sustainability (ES), combining with the existing research [47], we comprehensively derive the economic sustainability through five indicators: gross domestic product per capita, dust emissions per unit of gross regional product, the rate of harmless treatment of domestic garbage, the ratio of the tertiary industry to the gross regional product, and the number of effective invention patents in industrial enterprises above the large scale Indicator. The weights of each indicator are obtained by principal component analysis. The core explanatory variables are air pollution and Agglomeration of Population (AP). The control variables are Ur-banization Rate (UR), Per Capita Disposable Income (PCDI), Industry Structure (IS) and Total Import and Export of Goods by Foreign-invested Enterprises (TIE). Enterprises (TIEG).
3.2 Variable selection
Population agglomeration. Derived by the population density approach, it measures the distribution of population and population agglomeration trends by calculating the number of people per unit of land area.
Air Pollution. In this study, sulfur dioxide emission is mainly chosen as an indicator of environmental pollution. According to data from the China Statistical Yearbook (2022 edition), industry’s contribution to China’s industry reaches 36.6%, ranking at the top. And sulfur dioxide is a representative indicator of pollution from industrial production (Wang et al., 2020).
Economic Sustainability. The United Nations World Commission on Environment and Development defines sustainable development as “development that meets the needs of the present without jeopardizing the ability of future generations to meet their own needs”. Sustainable economic development involves several dimensions, including population, resources, environment, economy and society, and there is no uniform standard of measurement. Based on existing studies, we have synthesized the indicators of sustainable economic development through five indicators: GDP per capita, dust emissions per unit of GDP, the rate of harmless treatment of domestic garbage, the proportion of tertiary industry to GDP, and the number of effective invention patents in industrial enterprises above designated size.
To reflect the economic sustainable development index objectively, we choose the objective evaluation method entropy value method to calculate the economic sustainable development index. The specific steps are as follows:
Construct the matrix RX:
Where Xij denotes the jth indicator data of the ith object, this paper involves a total of 31 regions in China and 5 indicators of sustainable economic development.
Pre-processing of indicators, the matrix is obtained after normalization and dimensionless processing of raw data:
Standardized indicator value, the share of the jth indicator in the ith region:
Entropy value of the jth indicator:
From the definition of system entropy, it can be known that if the entropy value of a certain indicator is smaller, then it means that this indicator is more effective to be used to discriminate the target. Because of its lower degree of ordering, this indicator exhibits a higher degree of variability in its impact on the target.
Calculate the indicator entropy weight Wj:
Wj is the entropy weight of the indicator, i.e., the weight. It indicates the size of the role played by each indicator in the comprehensive evaluation.
Calculate the composite score si:
Urbanization Rate reflects the stage of development of a region and can effectively reflect the level of sustainable economic development, while Per Capita Disposable Income (PCDI) reflects the living conditions of the residents of a region, which is an effective tool for reflecting the standard of living and has an important impact on the sustainable development of the economy. The secondary industry belongs to high-pollution and high-energy-consumption industries, and the higher its proportion is, the more unfavorable it is to the sustainable development of the economy. It has been pointed out in the literature that there is a general transfer of pollution by multinational corporations, and on the other hand, opening up to the outside world is also conducive to attracting enterprises with high energy-saving and emission reduction to carry out green production, so the mechanism of the role of the use of foreign capital in sustainable economic development is not yet clear, but there is indeed an impact.
3.3 Date sources
The data for this study come from China Statistical Yearbook (2002–2022), China Urban Statistical Yearbook (2002–2022), China Environmental Statistical Yearbook (2002–2022) and other publicly available statistical yearbooks. Some of the data come from the China Economic and Social Big Data Research Platform. To eliminate the heterogeneity of the data, we transform six indicators, including economic sustainability, SO2 emission, population concentration, urbanization level, industrial structure, and the level of foreign investment use.
4 Results
4.1 Descriptive analysis
There are large differences in the level of sustainable economic development, air pollution levels and population concentration among China’s regions. To present a more comprehensive and systematic picture of China’s level of sustainable economic development, we have categorized China’s 31 provinces (excluding Hong Kong, Macao, and Taiwan) into eastern, central, western, and north-eastern regions according to their geographic location.
From the perspective of economic development, the ES level in the eastern region is the highest, with a mean value of 48.513, the ES level in the central region is in the middle, with a mean value of 26.004, and the ES levels in the north-eastern and western regions are at the back, with mean values of 20.066 and 18.435, respectively, which indicates that there are regional imbalances in the level of China’s sustainable economic development and that there are large differences. From the point of view of environmental pollution, the central region has the highest level of SO2 emission with 462163.742. The eastern region has the lowest level of SO2 emission with a mean value of 348602.218. The north-eastern and western regions are close to each other with a mean value of 383309.030 and 370097.576, respectively. From the perspective of population concentration, the eastern region has the highest AP level, with a mean value of 1012.721. The central region has the middle AP level, with a mean value of 356.005, while the north-eastern region and the central region are at the back of the list, with mean values of 168.556 and 123.220, respectively. From the perspective of urban development, the eastern region has the highest UR level, with a mean value of 69.734. The north-eastern region has the middle UR level, with a mean value of 62.872. The north-eastern region has the highest UR level with a mean value of 69.734, the north-eastern region has the middle UR level with a mean value of 62.872, and the central region and the western region have the lowest UR levels with mean values of 53.802 and 50.827 respectively. From the perspective of the standard of living of the residents, the eastern region has the highest PCDI level with a mean value of 3.470, the north-eastern region and the central region have similar levels of PCDI, with mean values of 2.282 and 2.172, and the western region has the lowest PCDI level, with mean values of 168.556 and 123.220 respectively. The western region has the lowest PCDI level, with a mean value of 1.980. From the perspective of industrial structure, the central region has the highest IS level, with a mean value of 46.813, while the eastern region has the lowest, with a mean value of 39.680. The western region and the north-eastern region are in the middle of the list, with mean values of 43.040 and 41.080, respectively. In terms of ES, the eastern region has the highest level of TIGE, with a mean value of 1602.102. The western region has the lowest level of TIGE, with a mean value of 104.518. The north-eastern region and the central region are close to each other, with mean values of 185.692 and 175.977 (see Table 1).
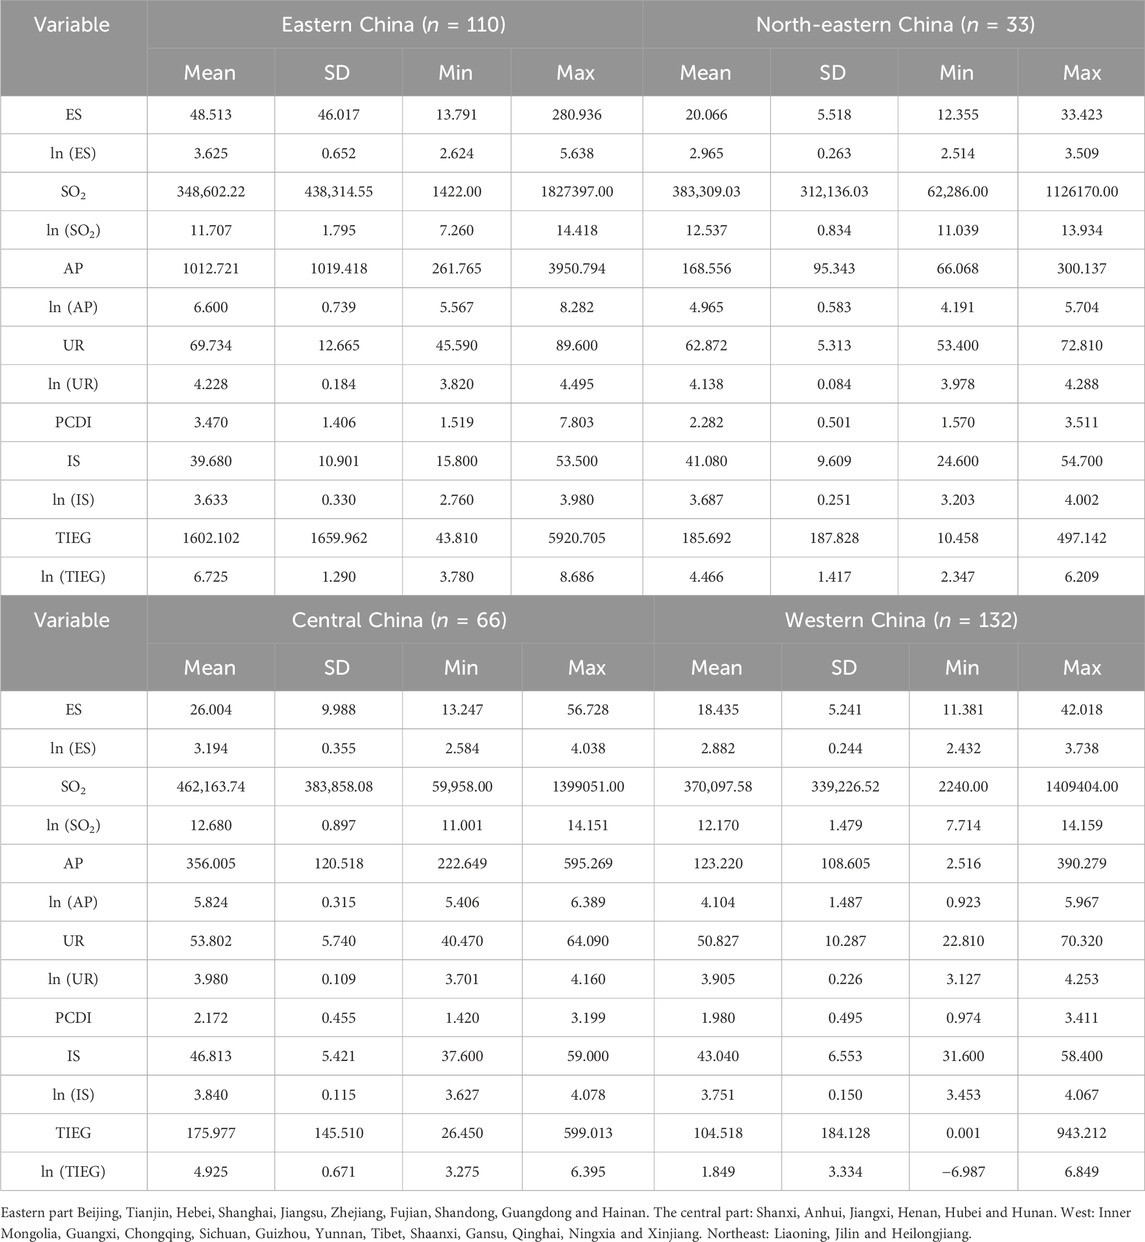
TABLE 1. Descriptive statistical analysis results.
Overall, the eastern region has the highest level of ES and AP, and the lowest level of SO2. The western region had the lowest ES level, but its SO2 level ranked second. The central region has a higher ES level than the north-eastern region, but its SO2 level is higher than that of the north-eastern region. And the UR level in the central region is lower than that in the northeast region. This indicates that ES levels in different regions are not only affected by SO2 levels and AP levels, but also other factors are at play.
4.2 Unit root test
To avoid pseudo-regression during the regression analysis, we applied the ISP test to test the data unit root (see Table 2). As can be seen from Table 2, PDI passed the ISP test at the 5% confidence level, and the other variables passed the ISP test at a confidence level lower than 1%, indicating that the data after the first-order differences are stable and have no unit root.
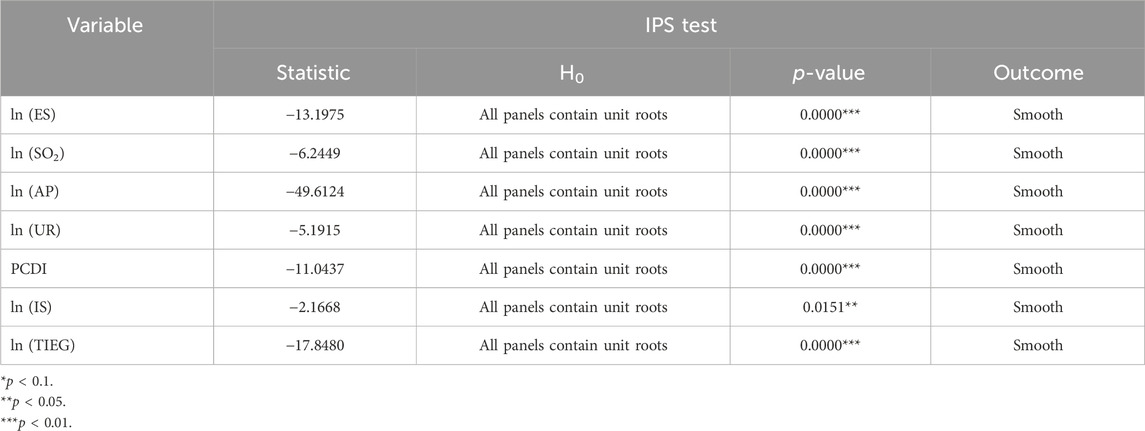
TABLE 2. Unit root test.
4.3 Panel data co-integration test
The cointegration test on the raw log data is mainly used to see if there is a long-term stable equilibrium relationship between the observed variables. As can be seen in Table 3, the research data passed the cointegration test and each explanatory and interpretive variable has a long-term stable equilibrium relationship with little data volatility, avoiding pseudo-regression. Therefore, the next step of the study can be carried out.

TABLE 3. Co-integration test.
4.4 Multicollinearity test
The test for multicollinearity is designed to avoid distortion or difficulty in estimating the model accurately due to the presence of exact correlation or high correlation between the explanatory variables in a linear regression model. The variance inflation factor (VIF) value represents the severity of multicollinearity and is used to test whether the model presents covariance, i.e., the existence of highly correlated relationships between explanatory variables, and the VIF is less than 10 means that there is no multicollinearity between explanatory variables (see Table 4). From Table 4, the VIF values of the variables are less than 10, which means that there is no multicollinearity.
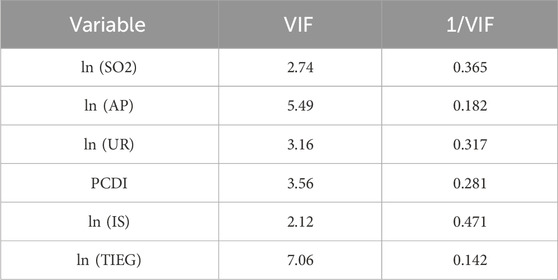
TABLE 4. Multicollinearity test.
4.5 Model setting test
There are usually three types of model estimation methods for panel data, including mixed regression models, fixed effects models, and random effects models. As to which model is appropriate for data on economic sustainability and the two core explanatory variables, a three-step test is required. First, an F-test is conducted. The original hypothesis is the selected mixed regression model, and the alternative hypothesis is the selected fixed effects model. From the results of the test, the f-statistics of the three models were 58.30, 56.35 and 59.38, respectively, and the null hypothesis was rejected at the 1% significance level. Therefore, the fixed effect model was chosen. Second, the Lagrange multiplier test (LM test) was conducted and as can be seen from Table 5, these three models rejected the null hypothesis at the 1% significance level, i.e., they rejected the mixed regression model and chose the random effects model. Thirdly, the Hausman test was conducted to determine whether to choose a random effects model or a fixed effects model. The null hypothesis of the Hausman test is to choose a random effects model while the alternative hypothesis is to choose a single fixed effects model. Based on the test results, all three models rejected the original hypothesis at the 1% significance level that a single fixed effects model should be chosen for the following empirical analysis.
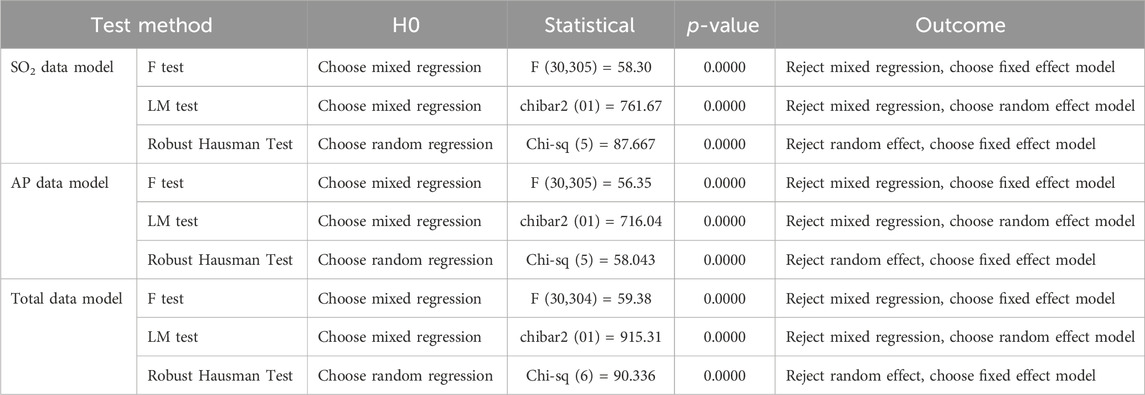
TABLE 5. Model setting test.
4.6 Panel date regression results
As can be seen in Table 6, columns (2), (4) and (6) pass the test at 1% level of sig-nificance and have high R2 of 0.7189, 0.7168 and 0.7303, respectively. Overall, comparing the results of columns (2), (4) and (6), column (6) can be found to be more appropriate. Column (1) also shows that there is a negative correlation between SO2 and economic sustainability. Sulfur dioxide emissions have been tested at 1% level of significance with a regression coefficient of 0.2421. This means that for every 1% increase in sulfur dioxide emissions, the level of economic sustainability decreases by 0.2421%, i.e., environmental pollution negatively affects economic sustainability. Comparing columns (1) and (2), the effect of SO2 on economic sustainability decreases from 0.2421% to 0.0936% with the introduction of other control variables and passes the test of 1% level of significance, proving that the other control variables help to reduce the effect of environmental pollution on economic sustainability. From column (3), population agglomeration level has a positive impact on economic sustainability with an impact coefficient of 3.2824 and passes the test of significance at 1% level. It shows that for every 1% increase in the level of population agglomeration, the level of sustainable economic development increases by 3.2824%. It shows that the level of population agglomeration has a significant positive effect on economic sustainability. From column (4), after introducing other control variables. The coefficient of population agglomeration on sustainable economic development decreases from 3.2824 to 1.1239 and passes the test of significance at 1% level. It shows that the effect of population agglomeration on sustainable economic development decreases after the introduction of other control variables. From column (6), SO2 emission, population ag-glomeration, urbanization development, per capita disposable income, and industrial structure all have an impact on economic sustainable development and pass the significance test at the 1% level. Among them, SO2 emission and industrial structure have negative effects, while population concentration, urbanization development and per capita disposable income have positive effects. The level of foreign investment use has a negative effect on economic sustainability, but it does not pass the significance level test. It indicates that the use of foreign investment has a non-significant negative effect on economic sustainability, and its mechanism needs to be further studied.
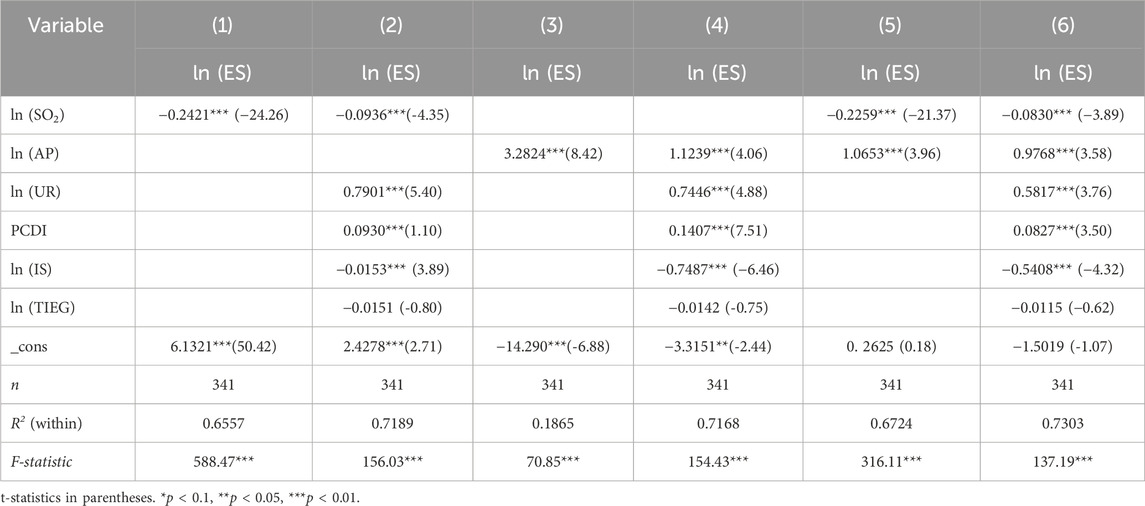
TABLE 6. Results of national empirical analysis (2011–2021).
4.7 Heterogeneity analysis
To further analyze the differences between different regions, we conducted a sub-regional study of the various influencing factors. As can be seen from Table 7, the impact of the relevant influencing factors on sustainable economic development in each region passed the 1% significance test, indicating that the impact of each type of factor is meaningful.
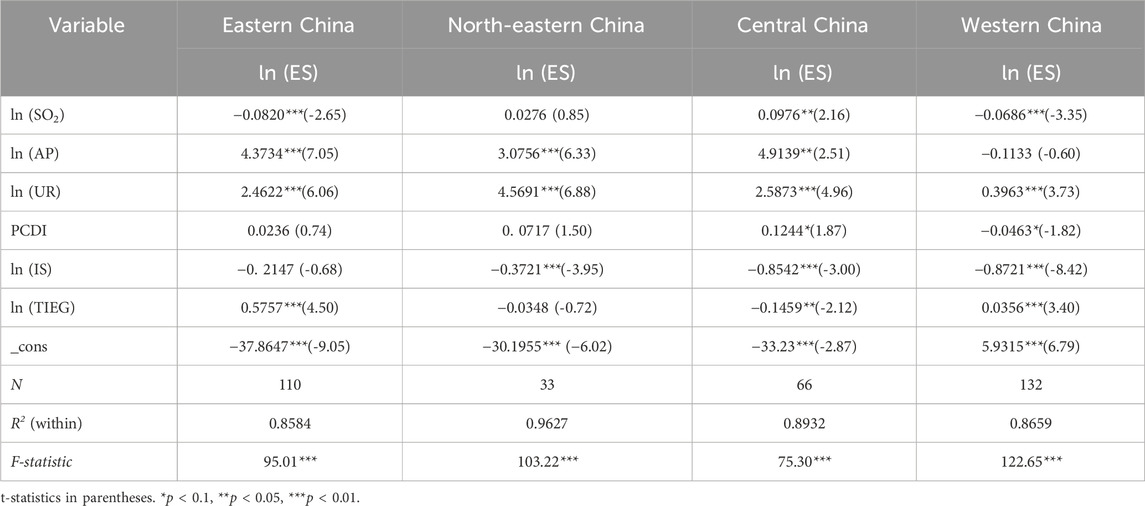
TABLE 7. Heterogeneity analysis results.
Comparing the impacts of the core impact factors on economic sustainable development in the four regions, most of the regions passed the significance test. From the perspective of SO2 emission factors, the eastern, central, and western regions passed the significance level test, with impact coefficients of −0.0820, 0.0976 and −0.0686, respectively. This indicates that the SO2 emission factors in the eastern and western regions have a positive effect on the sustainable economic development, and the opposite is true for the central region. The SO2 emission factor in the northeastern region has a non-significant positive effect on economic sustainable development. From the perspective of population agglomeration factor, the eastern, northeastern, and central regions passed the significance level test, and the impact coefficients were 4.3734, 3.0756 and 4.9139, respectively, indicating that the population agglomeration level of the three regions has a positive effect on sustainable economic development. The population agglomeration factor in the western region has a non-significant negative effect on economic sustainability.
From four regional perspectives. The level of urbanization and the level of use of foreign capital in the eastern region passed the test of significance at the 1% level, with impact coefficients of 2.4622 and 0.5757, respectively, indicating that the two factors have a contributing effect on the sustainable economic development of the eastern region. The factor of urbanization level and the factor of industrial structure of the northeastern region passed the test of significance at the 1% level, with impact coefficients of 4.5691 and −0.3721 respectively, indicating that the urbanization level promotes the sustainable development of the economy of the northeastern region, while the factor of industrial structure has the opposite effect. The factor of urbanization level of the central region, the factor of disposable income per capita of residents, the factor of industrial structure and the factor of the level of use of foreign capital all passed the significance test, with impact coefficients of 2.5873, 0.1244, −0.8542 and −0.1459, respectively, indicating that the factor of urbanization level and the factor of disposable income per capita have a positive effect on the sustainable development of the economy of the central region, and the other two factors have a negative effect. Factors have negative effects. The factor of urbanization level, the factor of disposable income per capita of residents, the factor of industrial structure and the factor of the level of use of foreign capital in the western region passed the significance test, with impact coefficients of 0.3963, −0.0463, −0.8721 and 0.0356, respectively, indicating that the factors of urbanization level and foreign capital usage level have a positive effect on the sustainable development of the western region’s economy, while the other two factors have a negative effect.
4.8 Panel data stability test
As mentioned in the regression section of the literature, there may be a causal relationship between population agglomeration, air pollution and economic sustainability. This relationship can create endogeneity problems that bias the estimation results. For this reason, this paper adopts an instrumental variable approach to mitigate the problem. Referring to the practice of existing studies (Yang Mian, 2022), this paper chooses Ventilation coefficient (VC) and Number of healthcare institutions (10,000) (NHI) as the most instrumental variables and performs two-stage least squares (2SLS) regression to mitigate the endogeneity problem.
Air pollution is closely largely related to air circulation, which drives the flow of polluting gases and promotes air evolution. Therefore, the stronger the air circulation means the lower the level of air pollution, while air circulation, as a natural factor, does not change with sustainable economic development and is not directly related to it. One of the prerequisites for population agglomeration is good health services. Health services, as a supporting construction for urban development and residents’ life, are closely related to each other as good health services can bring more people agglomeration. However, the correlation between health services and sustainable economic development is low (Wang Ruonan, 2023). Therefore, the above two indicators are suitable for validation as instrumental variables.
Table 8 reports the results of the two-stage least squares estimation. In the first stage, the Kleibergen-Paap rk LM was used for under-identification of instrumental variables and the statistical values rejected the original hypothesis that the selected instrumental variables were under-identified at the 1% level; the Kleibergen-Paap Wald rk F was used for the weak instrumental test, and the statistical values were greater than the critical value of the Stock-Yogo test at the 10% level, the hypothesis that the selected instrumental variables are weak instrumental variables is rejected; the Anderson-Rubin Wald test rejects the hypothesis that the sum of endogenous regression coefficients is equal to zero, which further indicates that there is a strong correlation between instrumental variables and endogenous variables. These test results indicate that the instrumental variables selected in this paper are reasonable and effective. The regression results of the second stage show that the ventilation coefficient has an inhibitory effect on sulfur dioxide emissions, and medical services have a significant effect on population agglomeration. The regression results of the instrumental variables method are basically consistent with the previous results, indicating that the empirical results of this paper are robust.
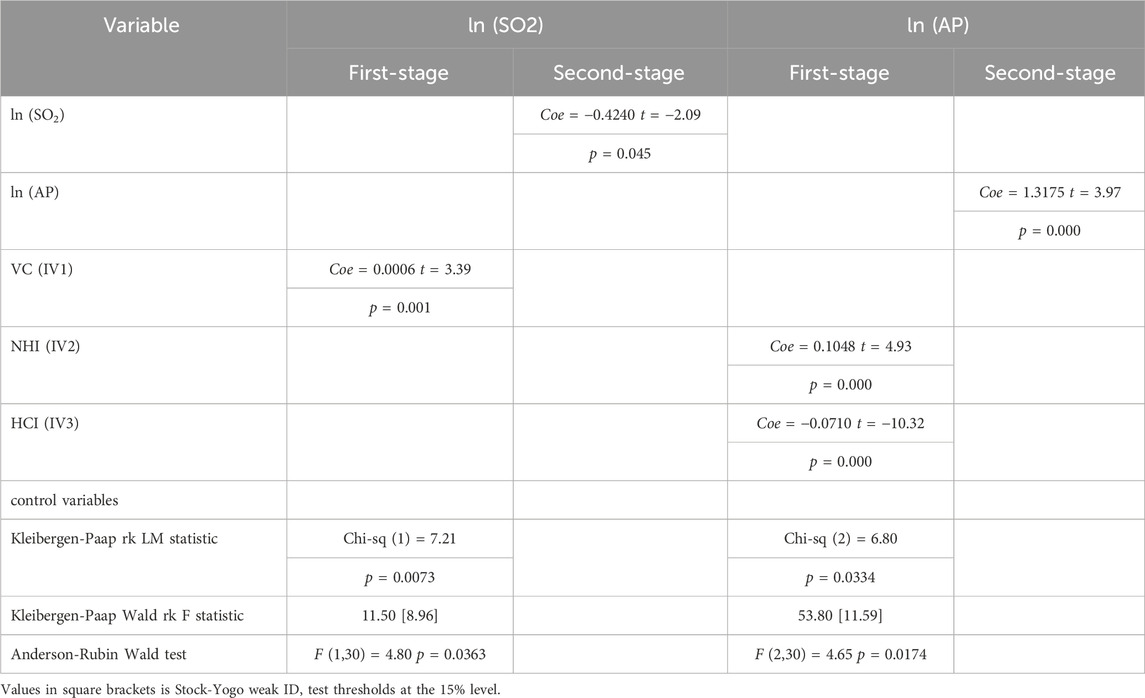
TABLE 8. Endogenous analysis.
To further test the robustness of the study, this paper uses ammonia and nitrogen emissions from wastewater (tons) (ANE) as a proxy for SO2 emissions. This is because ammonia and nitrogen emissions from wastewater is another important indicator of pollution level. Meanwhile, we use number of health personnel (10,000 people) (NHP) as a substitute for population agglomeration because population agglomeration is closely related to the number of health personnel, and places with approximately more health personnel tend to have a higher degree of population agglomeration. Re-regression of the model after transforming the variables showed that the direction and significance of the two core variables were consistent with the estimates of the baseline model. Again, this indicates the robustness of the estimation results of this study (see Table 9).
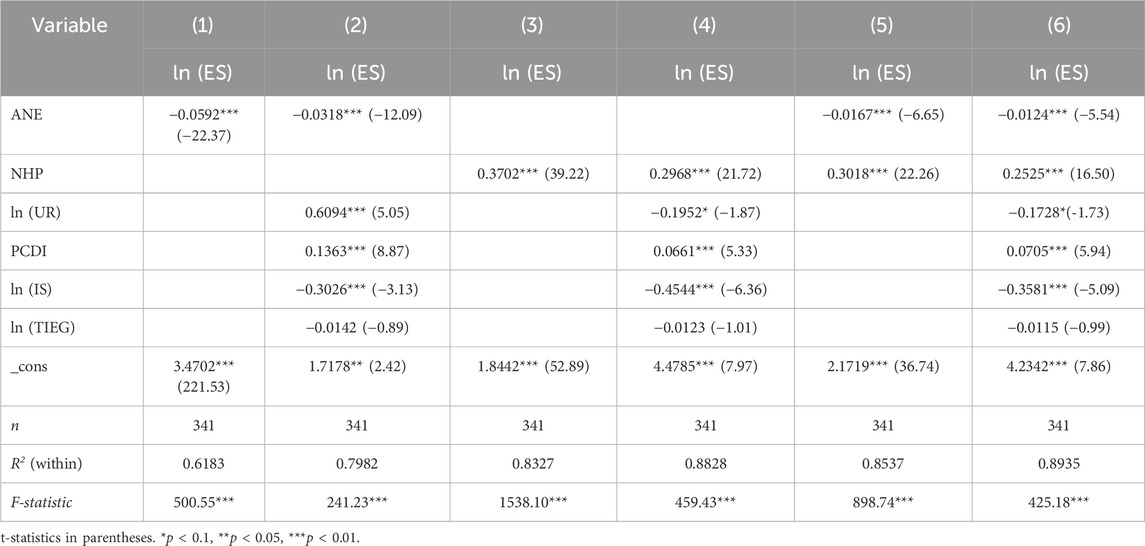
TABLE 9. Analysis of results after replacement of indicators.
5 Discussion
Based on the data of 31 provinces in China from 2011 to 2021 in terms of sustainable economic development, environmental pollution, and population agglomeration, this study analyzes the impact of related factors on sustainable economic development by using a single fixed-effect model. The following conclusions are drawn.
There is a negative correlation between the total amount of sulfur dioxide emissions, the level of industrial structure and the level of sustainable economic development. The smaller the emissions of sulfur dioxide, the higher the level of sustainable economic development. As one of the main air pollutants from fossil fuels, excessive sulfur dioxide emissions have a serious negative impact on the ecological environment and directly affect the level of sustainable economic development (Yuan et al., 2013). In addition to the possible direct impacts, Sulphur dioxide emissions can also have an indirect impact on sustainable economic development by affecting other aspects. On the one hand, increased Sulphur dioxide emissions are likely to cause social health problems and increase government expenditure on medical and health management, thereby increasing the burden of public governance on governments and enterprises. On the other hand, the increase in sulfur dioxide emissions will cause a decline in water and air quality, thereby affecting the health of residents. This leads to a decrease in the level of labor productivity, which affects labor productivity and causes a decrease in the level of economic development (Chen et al., 2013). Excessive sulfur dioxide emissions also have an impact on the pillars of social development, such as agricultural development and tourism development, which may bring about the consequences of reduced production of agricultural products and reduced passenger traffic, hindering the sustainable development of the country’s economy (Alola et al., 2023). Therefore, to promote sustainable economic development, it is necessary to strengthen the regulation of SO2 emissions. SO2 emissions will be included in the government performance evaluation index system, and emission management will be promoted in an integrated subregional manner (Hou et al., 2023). This study also found that the distribution of SO2 emissions is uneven across the country, with the central region having the highest SO2 emissions, which is closely related to the economic development mode of each region. Therefore, to promote sustainable economic development, specific control measures need to be selected according to the different situations and industrial development cycles of each region (Hu et al., 2019) Through international cooperation, it promotes the global layout between industries and realizes common development (Bakhsh et al., 2022).
The higher the proportion of the secondary industry, the greater the possible obstacles to sustainable economic development. The secondary industry mainly refers to the industrial production sector, mainly because of the high dependence of industrial production on resources and energy, which tends to produce a large amount of pollutants and cause damage to the environment and ecology (Bari and Draghicescu, 2009). This consumption of energy and resources is sometimes overexploited and unsustainable. The industrial production process produces exhaust gases, wastewater and solid wastes that are extremely destructive to the environment and jeopardize the safety of the ecosystem (Zhao et al., 2016). Greenhouse gases, sulfides, etc., Emitted by some industrial activities accelerate climate change, thus affecting agriculture and the use of natural resources (Hurlimann et al., 2019). From the perspective of social development, industrial production requires a large aggregation of manpower, which may result in unequal distribution in the labor market and may generate social instability thus affecting the sustainability of the economy (Shi, 2021). Therefore, it is necessary to adjust the industrial structure in time when the economic development reaches a certain stage. As far as possible, we should realize the industrial development mode of low pollution, high output and sustainable, and choose more tertiary industries for development (Wang et al., 2023).
There is a positive correlation between the level of population concentration and sustainable economic development. Higher population concentrations are effective in promoting sustainable economic development, and population concentrations usually bring in more talent, which drives the creation of knowledge-intensive industries and centers of innovation (Kasun, 1982). There is a need to give full play to the advantages of population agglomeration and to promote quality productivity in technological innovation and industrial upgrading, to realize the transformation and up-grading of economic development (Akram et al., 2023). It is necessary to pay attention to the spatial spillover effect of population agglomeration and effectively utilize the radiation-driven effect of the spillover labor force on the economic development of the surrounding cities (Chen et al., 2023a). Economic sustainability is not limited to the development of a part of the region but is a whole that is related to neighboring cities and regions. Therefore, the labor force is used as a connecting link to promote common development through inter-regional cooperation. One issue that needs attention is the literature that suggests that population agglomeration may bring about the problem of aging. There is a need to make good arrangements for the social division of labor among the elderly group and give full play to the functions of this group. At the same time, attention should be paid to the social needs of the elderly and new markets for economic development should be opened (Temsumrit, 2023).
There is a positive correlation between the level of urbanization, the standard of living of the population and sustainable economic development. The level of urbanization is closely related to population concentration and highly correlated with people’s living standards. Urbanization brings with it a larger population size and greater pressure on environmental pollution, thus affecting economic sustainability (Huang et al., 2016; Koyuncu et al., 2021). The impacts of environmental pollution and population concentration on sustainable economic development have been discussed earlier and will not be discussed too much in this section. Another impact of urbanization is the impact of industrial support on urban economic development. To better promote the urbanization process, the secondary industry rep-resented by industry plays an important role. However, the high level of industrial development has brought about more serious environmental pressure, which in turn affects the sustainability of economic development (Bian et al., 2021). High-intensity industrial production can greatly promote economic development, but as economic development reaches a certain stage, the economic impetus brought by high consumption will gradually weaken. There is an urgent need to promote economic development into a new stage by improving energy efficiency (Hu et al., 2019). Therefore, the industrial structure of urban economic development needs to be effectively adjusted according to the stage of economic and social development. The use of new energy sources and the renewal and upgrading of industries should be promoted to realize sustainable economic development (Imasiku et al., 2020). From the perspective of the standard of living of the population, improvement in the living standards of the population can bring about higher impetus for sustainable economic development, including higher production efficiency and stronger consumption levels. Promoting sustainable economic development requires effective handling of the relationship between production and consumption and the realization of a dynamic balance between the two (Bai et al., 2012).
6 Conclusion
Sustainable economic development is a hot issue of social concern. Through the study, we found that the impact of sustainable economic development air pollution, population agglomeration, urbanization level, industrial structure and living standards of residents, and there are differences in the impact of different regions. Overall, SO2 emissions and industrial structure have a negative effect, while population concentration, urbanization development and per capita disposable income have a positive effect. Therefore, to promote sustainable economic development, there is a need to strictly control environmental pollution, especially by formulating specific policies on harmful emissions in a phased manner. Continuously increase the use of clean energy, improve the efficiency of energy use, and achieve both economic and environmental goals. At the same time, it is necessary to rationally deal with the problems of high-quality productivity and pollution of life brought about by population agglomeration, in accordance with the characteristics of population agglomeration. For different regions, it is necessary to conduct reasonable economic development policy studies based on the actual situation of local economic development. Considering the level of urbanization, the level of residents’ living income, the industrial structure and other factors, it is necessary to formulate suitable economic development strategies with selective and focused approaches, so as to realize the sustainable development of the economy. In addition, although the factor of the level of foreign capital use in the article presents a non-significant effect.
Data availability statement
Publicly available datasets were analyzed in this study. This data can be found here: https://data.cnki.net.
Author contributions
JY: Data curation, Formal Analysis, Methodology, Writing–original draft. CL: Data curation, Resources, Writing–original draft. BX: Data curation, Methodology, Writing–original draft. SW: Conceptualization, Supervision, Writing–review and editing.
Funding
The author(s) declare financial support was received for the research, authorship, and/or publication of this article. This study was supported in part by the grants from Humanities and Social Sciences Research Projects of Universities in Jiangxi Province (JD18055), Science and Technology Innovation Team Development Program of Jiangxi University of Chinese Medicine (CXTD22016), State Administration of Traditional Chinese Medicine Commissioned Project - 2023 Economic Management in the Field of Traditional Chinese Medicine.
Conflict of interest
The authors declare that the research was conducted in the absence of any commercial or financial relationships that could be construed as a potential conflict of interest.
Publisher’s note
All claims expressed in this article are solely those of the authors and do not necessarily represent those of their affiliated organizations, or those of the publisher, the editors and the reviewers. Any product that may be evaluated in this article, or claim that may be made by its manufacturer, is not guaranteed or endorsed by the publisher.
References
Ahmad, M., and Jabeen, G. (2023). Do economic development and tourism heterogeneously influence ecological sustainability? Implications for sustainable development. Environ. Sci. Pollut. Res. 27. doi:10.1007/s11356-023-28543-4
Ahmed, Z., Can, M., Sinha, A., Ahmad, M., Alvarado, R., and Rjoub, H. (2022). Investigating the role of economic complexity in sustainable development and environmental sustainability. Int. J. Sustain. Dev. World Ecol. 29, 771–783. doi:10.1080/13504509.2022.2097330
Akram, H., Li, J. C., Anser, M. K., Irfan, M., and Watto, W. A. (2023). Assessing the impact of human capital, renewable energy, population growth, economic growth, and climate change policies on achieving the sustainable development goals. Environ. Sci. Pollut. Res. 12. doi:10.1007/s11356-023-30649-8
Alola, A. A., Udemba, E. N., Iwuagwu, C., and Abdallah, I. (2023). Assessing the human development aspects of CO, PM2.5, PM10, NOX, and SO2 in the United States. Heliyon 9, e18072. doi:10.1016/j.heliyon.2023.e18072
Amir, M., Malik, M. S., and Ali, K. (2023). Unlocking green growth: an ARDL estimation of pollution prevention practices for economic and environmental sustainability. Environ. Dev. Sustain. 18. doi:10.1007/s10668-023-03449-w
Asici, A. A. (2015). On the sustainability of the economic growth path of Turkey: 1995-2009. Renew. Sustain. Energy Rev. 52, 1731–1741. doi:10.1016/j.rser.2015.07.192
Bai, X. M., Chen, J., and Shi, P. J. (2012). Landscape urbanization and economic growth in China: positive feedbacks and sustainability dilemmas. Environ. Sci. Technol. 46, 132–139. doi:10.1021/es202329f
Bakhsh, K., Akmal, T., Ahmad, T., and Abbas, Q. (2022). Investigating the nexus among sulfur dioxide emission, energy consumption, and economic growth: empirical evidence from Pakistan. Environ. Sci. Pollut. Res. 29, 7214–7224. doi:10.1007/s11356-021-15898-9
Bari, I., and Draghicescu, M. (2009). The metallurgical industry and environmental pollution. Metal. Int. 14, 30–33.
Bian, H. Y., Gao, J., Wu, J. G., Sun, X., and Du, Y. (2021). Hierarchical analysis of landscape urbanization and its impacts on regional sustainability: a case study of the Yangtze River Economic Belt of China. J. Clean. Prod. 279, 123267. doi:10.1016/j.jclepro.2020.123267
Carnevale, C., Ferrari, F., Guariso, G., Maffeis, G., Turrini, E., and Volta, M. (2018). Assessing the economic and environmental sustainability of a regional air quality plan. Sustainability 10, 3568. doi:10.3390/su10103568
Chen, R. J., Wang, X., Meng, X., Hua, J., Zhou, Z. J., Chen, B. H., et al. (2013). Communicating air pollution-related health risks to the public: an application of the Air Quality Health Index in Shanghai, China. Environ. Int. 51, 168–173. doi:10.1016/j.envint.2012.11.008
Chen, Z. H., Chen, L., Khoo, K. S., Gupta, V. K., Sharma, M., Show, P. L., et al. (2023b). Exploitation of lignocellulosic-based biomass biorefinery: a critical review of renewable bioresource, sustainability and economic views. Biotechnol. Adv. 69, 108265. doi:10.1016/j.biotechadv.2023.108265
Chen, L., Yu, L. S., Yin, J. B., and XI, M. J. (2023a). Impact of population density on spatial differences in the economic growth of urban agglomerations: the case of guanzhong plain urban agglomeration, China. Sustainability 15, 14601. doi:10.3390/su151914601
Elmassah, S., and Hassanein, E. A. (2023). Economic development and environmental sustainability in the GCC countries: new insights based on the economic complexity. Sustainability 15, 7987. doi:10.3390/su15107987
Fang, W., An, H. Z., Li, H. J., Gao, X. Y., Sun, X. Q., and Zhong, W. Q. (2017). Accessing on the sustainability of urban ecological-economic systems by means of a coupled emergy and system dynamics model: a case study of Beijing. Energy Policy 100, 326–337. doi:10.1016/j.enpol.2016.09.044
Ferasso, M., Bares, L., Ogachi, D., and Blanco, M. (2021). Economic and sustainability inequalities and water consumption of European union countries. Water 13, 2696. doi:10.3390/w13192696
Germani, A., Vitiello, V., Giusti, A. M., Pinto, A., Donini, L. M., and Del Balzo, V. (2014). Environmental and economic sustainability of the mediterranean diet. Int. J. Food Sci. Nutr. 65, 1008–1012. doi:10.3109/09637486.2014.945152
Glaser, M., and Diele, K. (2004). Asymmetric outcomes:: assessing central aspects of the biological, economic and social sustainability of a mangrove crab fishery, Ucides cordatus (Ocypodidae), in North Brazil. Ecol. Econ. 49, 361–373. doi:10.1016/j.ecolecon.2004.01.017
Gonzalez-Garcia, S., Manteiga, R., Moreira, M. T., and Feijoo, G. (2018). Assessing the sustainability of Spanish cities considering environmental and socio-economic indicators. J. Clean. Prod. 178, 599–610. doi:10.1016/j.jclepro.2018.01.056
González-García, S., Rama, M., Cortés, A., García-Guaita, F., Núñez, A., Louro, L. G., et al. (2019). Embedding environmental, economic and social indicators in the evaluation of the sustainability of the municipalities of Galicia (northwest of Spain). J. Clean. Prod. 234, 27–42. doi:10.1016/j.jclepro.2019.06.158
Henderson, J. E., Joshi, O., Parajuli, R., and Hubbard, W. G. (2017). A regional assessment of wood resource sustainability and potential economic impact of the wood pellet market in the US South. Biomass and Bioenergy 105, 421–427. doi:10.1016/j.biombioe.2017.08.003
Hou, X. H., Cheng, B., Xia, Z. L., Zhou, H. J., Shen, Q., Lu, Y. J., et al. (2023). Investigating the relationship between economic growth, institutional environment and sulphur dioxide emissions. Sustainability 15, 4678. doi:10.3390/su15054678
Huang, H. F., Ali, S., and Solangi, Y. A. (2023). Analysis of the impact of economic policy uncertainty on environmental sustainability in developed and developing economies. Sustainability 15, 5860. doi:10.3390/su15075860
Huang, L., Yan, L. J., and Wu, J. G. (2016). Assessing urban sustainability of Chinese megacities: 35 years after the economic reform and open-door policy. Landsc. Urban Plan. 145, 57–70. doi:10.1016/j.landurbplan.2015.09.005
Hu, B., Li, Z. T., and Zhang, L. (2019). Long-run dynamics of sulphur dioxide emissions, economic growth, and energy efficiency in China. J. Clean. Prod. 227, 942–949. doi:10.1016/j.jclepro.2019.04.170
Hurlimann, A. C., Warren-Myers, G., and Browne, G. R. (2019). Is the Australian construction industry prepared for climate change? Build. Environ. 153, 128–137. doi:10.1016/j.buildenv.2019.02.008
Iheonu, C. O., Anyanwu, O. C., Odo, O. K., and Nathaniel, S. P. (2021). Does economic growth, international trade, and urbanization uphold environmental sustainability in sub-Saharan Africa? Insights from quantile and causality procedures. Environ. Sci. Pollut. Res. 28, 28222–28233. doi:10.1007/s11356-021-12539-z
Imasiku, K., Thomas, V. M., and Ntagwirumugara, E. (2020). Unpacking ecological stress from economic activities for sustainability and resource optimization in sub-saharan Africa. Sustainability 12, 3538. doi:10.3390/su12093538
Jabeen, G., Ahmad, M., and Zhang, Q. Y. (2023). Combined role of economic openness, financial deepening, biological capacity, and human capital in achieving ecological sustainability. Ecol. Inf. 73, 101932. doi:10.1016/j.ecoinf.2022.101932
Jalil, A., Rauf, A., Sikander, W., Zhang, Y. H., and Wang, T. B. (2021). Energy consumption, economic growth, and environmental sustainability challenges for Belt and Road countries: a fresh insight from "Chinese Going Global Strategy. Environ. Sci. Pollut. Res. 28, 65987–65999. doi:10.1007/s11356-021-15549-z
Jing Su, X. X. (2023). Agglomeration economy, green technology progress and environmental pollution. Bus. Res. 03, 91–100. doi:10.13902/j.cnki.syyj.2023.03.003
Karimzadegan, H., Rahmatian, M., Farhud, D. D., and Yunesian, M. (2008). Economic valuation of air pollution health impacts in the Tehran area, Iran. Iran. J. Public Health 37, 20–30.
Kasun, J. R. (1982). Population growth and economic growth: any connection? Asian J. Econ. 1, 384–408.
Katyal, A. K. (2009). Climate change: social, economic, and environmental sustainability. Environ. Forensics 10, 177–182. doi:10.1080/15275920903130131
Kiuila, O. (2003). Economic modelling of sulphur regulations in Poland. Int. J. Environ. Pollut. 19, 390–402. doi:10.1504/ijep.2003.004310
Koyuncu, T., Beser, M. K., and Alola, A. A. (2021). Environmental sustainability statement of economic regimes with energy intensity and urbanization in Turkey: a threshold regression approach. Environ. Sci. Pollut. Res. 28, 42533–42546. doi:10.1007/s11356-021-13686-z
Mohsin, M., Naseem, S., Sarfraz, M., Zia-Ur-Rehman, M., and Baig, S. A. (2022). Does energy use and economic growth allow for environmental sustainability? An empirical analysis of Pakistan. Environ. Sci. Pollut. Res. 29, 52873–52884. doi:10.1007/s11356-022-19600-5
Nepal, R., Paija, N., Tyagi, B., and Harvie, C. (2021). Energy security, economic growth and environmental sustainability in India: does FDI and trade openness play a role? J. Environ. Manag. 281, 111886. doi:10.1016/j.jenvman.2020.111886
Niu, F. Q., and Jiang, Y. P. (2021). Economic sustainability of China's growth from the perspective of its resource and environmental supply system: national scale modeling and policy analysis. J. Geogr. Sci. 31, 1171–1186. doi:10.1007/s11442-021-1891-3
Orner, K. D., Cornejo, P. K., Camacho, D. R., Alvarez, M., and Camacho-Céspedes, F. (2021). Improving life cycle economic and environmental sustainability of animal manure management in marginalized farming communities through resource recovery. Environ. Eng. Sci. 38, 310–319. doi:10.1089/ees.2020.0262
Pala, M., Ryan, J., Mazid, A., Abdallah, O., and Nachit, M. (2004). Wheat farming in Syria: an approach to economic transformation and sustainability. Renew. Agric. Food Syst. 19, 30–34. doi:10.1079/rafs200356
Paloviita, A. T. (2004). Matrix sustainability: applying input -output analysis to environmental and economic sustainability indicators. Finland: Case: Finnish forest sector.
Pérez-Calderon, E., Milanés-Montero, P., Meseguer-Santamaría, M. L., and Mondéjar-Jiménez, J. (2011). Eco-efficiency: effects on economic and financial performance. evidences from dow jones sustainability europe index. Environ. Eng. Manag. J. 10, 1801–1808. doi:10.30638/eemj.2011.243
Phiri, J., Malec, K., Majune, S. K., Appiah-Kubi, S. N. K., Gebeltová, Z., Maitah, M., et al. (2020). Agriculture as a determinant of Zambian economic sustainability. Sustainability 12, 4559. doi:10.3390/su12114559
Ravichandran, A., Diaz-Elsayed, N., Thomas, S., and Zhang, Q. (2021). An assessment of the influence of local conditions on the economic and environmental sustainability of drain water heat recovery systems. J. Clean. Prod. 279, 123589. doi:10.1016/j.jclepro.2020.123589
Rice, J. M., Wilson, T., Temple, J. B., and Mcdonald, P. (2022). The impact of demographic and economic change on the Australian generational economy: financial sustainability, intergenerational inequality, and material living standards. Front. Public Health 10, 798298. doi:10.3389/fpubh.2022.798298
Scheel, C. (2016). Beyond sustainability. Transforming industrial zero-valued residues into increasing economic returns. J. Clean. Prod. 131, 376–386. doi:10.1016/j.jclepro.2016.05.018
Senkoto, N. (2019). An analysis of critical risk factors of sustainable supply chain in the South African mining industry.
Shi, L. Y. (2021). Labor industry allocation, industrial structure optimization, and economic growth. Discrete Dyn. Nat. Soc. 2021, 1–8. doi:10.1155/2021/5167422
Temsumrit, N. (2023). Can aging population affect economic growth through the channel of government spending? Heliyon 9, e19521. doi:10.1016/j.heliyon.2023.e19521
Tenaw, D., and Beyene, A. D. (2021). Environmental sustainability and economic development in sub-Saharan Africa: a modified EKC hypothesis. Renew. Sustain. Energy Rev. 143, 110897. doi:10.1016/j.rser.2021.110897
Wagner, M. (2005). How to reconcile environmental and economic performance to improve corporate sustainability: corporate environmental strategies in the European paper industry. J. Environ. Manag. 76, 105–118. doi:10.1016/j.jenvman.2004.11.021
Wang, F., Li, Y. Y., Zhang, W., He, P., Jiang, L., Cai, B. M., et al. (2020). China's trade-off between economic benefits and sulfur dioxide emissions in changing global trade. Earths Future 8, 14. doi:10.1029/2019ef001354
Wang Ruonan, H. Y., Zhang, YILI, Zhang, J., Wang, Y., and Sun, D. (2023). Does urbanization have spatial spillover effect on poverty reduction: empirical evidence from rural China. Med. Soc. 36, 26–31. doi:10.1080/1331677x.2023.2167730
Wang, Y., Yang, Q., Wu, X. A., Wang, R. C., Gao, T. L., and Liu, Y. T. (2023). A study of trends in low-energy development patterns in China: a data-driven approach. Sustainability 15, 10094. doi:10.3390/su151310094
Wojewódzka-Wiewiórska, A., Kloczko-Gajewska, A., and Sulewski, P. (2020). Between the social and economic dimensions of sustainability in rural areas-in search of farmers' quality of life. Sustainability 12, 148. doi:10.3390/su12010148
Xie, J. Y., Suh, D. H., and Joo, S. K. (2021). A dynamic analysis of air pollution: implications of economic growth and renewable energy consumption. Int. J. Environ. Res. Public Health 18, 9906. doi:10.3390/ijerph18189906
Xin, M. Y., Guo, H. X., Li, S. C., and Chen, L. F. (2023). Can China achieve ecological sustainability? An LMDI analysis of ecological footprint and economic development decoupling. Ecol. Indic. 151, 110313. doi:10.1016/j.ecolind.2023.110313
Xiu, J. H., Ameer, W., Abbas, S., and Altuntas, M. (2022). Does carbon emissions, and economic expansion induce health expenditure in China: evidence for sustainability perspective. Front. Environ. Sci. 9, 9. doi:10.3389/fenvs.2021.838734
Yang, X. T., and Khan, I. (2022). Dynamics among economic growth, urbanization, and environmental sustainability in IEA countries: the role of industry value-added. Environ. Sci. Pollut. Res. 29, 4116–4127. doi:10.1007/s11356-021-16000-z
Yang Mian, X. J., and Yang, FUXIA (2022). The impact of environmental regulation on urban green productivity under the perspective of spatial spillovers-an empirical test based on common frontier robust productivity. Stat. Res. 39, 29–45. doi:10.19343/j.cnki.11-1302/c.2022.09.003
Yuan, X. L., Mi, M., Mu, R. M., and Zuo, J. (2013). Strategic route map of sulphur dioxide reduction in China. Energy Policy 60, 844–851. doi:10.1016/j.enpol.2013.05.072
Yuan, X. L., Teng, Y. Q., Yuan, Q., Liu, M. Y., Fan, X. H., Wang, Q. S., et al. (2020). Economic transition and industrial sulfur dioxide emissions in the Chinese economy. Sci. Total Environ. 744, 140826. doi:10.1016/j.scitotenv.2020.140826
Zhao, J. Q., Xiao, Y., Sun, S. Q., Sang, W. G., and Axmacher, J. C. (2022a). Does China's increasing coupling of 'urban population' and 'urban area' growth indicators reflect a growing social and economic sustainability? J. Environ. Manag. 301, 113932. doi:10.1016/j.jenvman.2021.113932
Zhao, X. G., Jiang, G. W., Li, A., and Wang, L. (2016). Economic analysis of waste-to-energy industry in China. Waste Manag. 48, 604–618. doi:10.1016/j.wasman.2015.10.014
Zhao, X., Jiang, M., and Zhang, W. (2022b). The impact of environmental pollution and economic growth on public health: evidence from China. Front. Public Health 10, 861157. doi:10.3389/fpubh.2022.861157
Keywords: air pollution, population agglomeration, sustainable economic development, empirical research, fixed effects modeling
Citation: Yan J, Liu C, Xiao B and Wang S (2024) Environmental dynamics: unraveling the nexus of air pollution, population agglomeration, and sustainable economic development in China: a provincial-level empirical analysis. Front. Environ. Sci. 12:1349419. doi: 10.3389/fenvs.2024.1349419
Received: 04 December 2023; Accepted: 20 February 2024;
Published: 29 February 2024.
Edited by:
Jiexun Li, Western Washington University, United StatesCopyright © 2024 Yan, Liu, Xiao and Wang. This is an open-access article distributed under the terms of the Creative Commons Attribution License (CC BY). The use, distribution or reproduction in other forums is permitted, provided the original author(s) and the copyright owner(s) are credited and that the original publication in this journal is cited, in accordance with accepted academic practice. No use, distribution or reproduction is permitted which does not comply with these terms.
*Correspondence: Suzhen Wang, MjAwMjA2NjBAanh1dGNtLmVkdS5jbg==