 Binsheng Wu1Kunli Dai2Chunqing Liu1*Jingru Chen3
- 1College of Landscape Architecture and Art, Jiangxi Agricultural University, Nanchang, China
- 2Party School of the Jiangxi Provincial Committee of the Communist Party of China, Nanchang, Jiangxi, China
- 3College of Arts and Design, Jimei University, Xiamen, China
Introduction: As the global urbanization process accelerates, the contradiction between economic development demands and ecological protection becomes increasingly prominent.
Methods: In this study, we simulated the evolution of the ecological security pattern (ESP) of Pingtan Island from 2000 to 2020 by extracting the ecological sources using Remote Sensing Ecological Index (RSEI), and identifying the ecological corridors and key nodes by combining with Linkage Mapping (LM) and Circuit Theory. In addition, Geodetector was utilized to identify these major determinants affecting RSEI.
Results: The results showed 1) From 2000 to 2020, the ecological environmental quality (EEQ) of Pingtan Island continued to improve, and the mean value of RSEI gradually increased from 0.47 to 0.51. 2) Univariate analysis showed that elevation and slope were the most significant factors affecting the spatial variability of the RSEI, with the interaction between slope and proportion of built-up area having a significant effect on EEQ. 3) The number and extent of ecological sources were expanded year by year with significant spatial variability. At the same time, the number and range of ecological corridors also underwent phase adjustment. 4) Further exploration of ESP of Pingtan Island in 2020 identified 32 ecological pinch points (EPPs) and 52 ecological barrier points (EBPs), which were mainly located within or near the ecological corridors, indicating key areas for future ecological restoration efforts.
Discussion: These insights help to enhance urban spatial planning and ecosystem restoration on Pingtan Island and provide a blueprint for ESP development in comparable island urban environments.
1 Introduction
The world today faces a range of environmental challenges, including biodiversity loss (Cardinale and Duffy, 2012), land desertification (Bestelmeyer and Okin, 2015), and ecosystem degradation (Fleming and Anderson, 2014), all of which pose challenges and pressures to the ecological security of human settlements. In 2015, the United Nations Sustainable Development Summit (UNDS) released the “2030 Agenda for Sustainable Development,” calling for global progress towards sustainable development goals (Gjorgievski et al., 2021). Currently, governments and organizations worldwide are actively seeking effective responses to these global environmental issues (Lee and Kjaerulf, 2016; Lai and Eladawy, 2022). In response to these challenges, China has initiated a series of ecological protection and restoration projects (He and Shen, 2018), such as the Sanjiangyuan Ecological Protection Project and the “Three-North” Shelter Forest Program (Wang and He et al., 2021a). However, these projects often target specific ecological elements in local areas and lack a holistic consideration, leading to improvements in local ecological environments but not effectively mitigating the overall and stability of regional ecosystems. Ecological Security Patterns (ESP), originating from landscape ecological planning, are methods employed for identifying areas pertinent to ecological restoration and conducive to biological conservation. This approach not only facilitates systematic protection and structural optimization of national spaces but also aids in preserving the integrity of landscape patterns and ecological functions. Moreover, researching the spatial-temporal differentiation and influencing mechanisms of ecological security in urbanized areas is not only a Frontier and high-priority research topic in Earth system science but also an urgent need to provide a systematic scientific basis for the high-quality development of urban agglomerations in response to national strategic requirements.
In previous studies, scholars have employed various methods to study ecological security, including Ecological Footprint Model (Yang and Cai, 2020), Minimum Cumulative Resistance (MCR) Model (Dai and Liu, 2021), DPSIR (Driving Force-Pressure-State-Impact-Response) Model (He and Zhou, 2022), Geodetector and Multiscale Geographically Weighted Regression (MGWR) models (Yang and Xu, 2023; Yang and Yu, 2023), enriching the research on ecological security. In 1996, Yu Kongjian proposed the concept of constructing ESP aimed at biodiversity conservation (Yu, 1996). After several modifications and improvements by scholars, the research framework of “Ecological source extraction - Ecological corridor identification - Strategic point setting” has become a basic paradigm of ESP research in China (Peng and Yang, 2018). Ecological source (Montoya and Pimm, 2006), typically selected as core areas from regions with diverse species communities such as forests, woodlands, nature reserves, or urban green spaces, are often identified by evaluating ecosystem service value and ecological sensitivity (Rebelo and Morris, 2019). However, this approach can be subjective and overlook variations in habitat quality among source sites. In this study, we utilized the Remote Sensing Ecological Index (RSEI) to assess changes in ecological quality within the study area (Xu, 2013; Zhu and Chen, 2021), which enabled the identification of areas with the highest ecological quality as ecological source sites. Contrasting with previous methodologies, this approach incorporates a broader range of factors, employs a more objective weighting system, and effectively captures recent changes in ecological quality, thus identifying areas of high stability and habitat quality.
Regarding ecological corridor extraction, these corridors, typically linear or strip-shaped, connect ecological source areas. While most studies rely on the minimum cumulative resistance (MCR) model to delineate potential ecological corridors, this model fails to account for the random mobility of species and identify key ecological nodes. Our study addresses these limitations by applying circuit theory (McRae and Dickson, 2008) to simulate species’ random migration patterns and by using the Centrality Mapper module to evaluate corridor importance. This approach effectively identifies ecological pinch points and obstacles, thereby providing a scientific basis for future conservation planning on Pingtan Island. This methodology compensates for the deficiencies of the MCR model and has demonstrated practicality and reliability.
Currently, ESP has been widely applied and achieved rich results in areas such as ecological risk assessment and ecological spatial planning (Song and Qin, 2016; Wang and He et al., 2021b; Nie and Shi, 2021; Wang and Wu, 2021). Additionally, China’s coastal areas are regions of extreme ecological importance and sensitivity, making the evolution process and influencing factors of ESP in coastal island cities even more worthy of attention (Cao and Wong, 2007). In face of the complex background of multidimensional coupling of natural, social, and economic elements in urban agglomerations, fully understanding the evolution process of ESP in island cities and its influencing factors is an important prerequisite for scientifically planning ecological spaces and reasonably allocating natural resources. It is also an urgent need to promote regional ecological civilization construction and high-quality development.
In conclusion, current research on ESP primarily focuses on aspects such as land use (Li and Li, 2020)and ecosystem services (Wang and Chen, 2019). These study centers on ecological restoration and control zones based on the current situation, while studies on the evolution of ESP and its influencing factors remain limited. Pingtan Comprehensive Experimental Zone (abbreviated as Pingtan Island) is one of the typical island cities in the southeastern coastal region of China. It has attracted a significant population and economic trade activities. However, the expansion of construction land has led to the fragmentation of habitat patches, complicating the regional ecological pattern. Therefore, this study focuses on Pingtan Island, utilizing the RSEI to characterize ecological quality and extract ecological sources. Additionally, we introduce a Geodetector to analyze the mechanisms by which eight typical indicators, including elevation, population density, land use types, and artificial nighttime light data, affect RSEI. Furthermore, through spatial overlay analysis that considers various factors from nature, society, and economics, we construct an ecological resistance surface. We use circuit theory to extract ecological corridors and prioritize ecological protection areas. Ultimately, we simulate the evolution of Pingtan Island’s ESP for the years 2000, 2010, and 2020. This study aims to provide a scientific basis for the future development and planning of ESP in island city ESP (Figure 1).
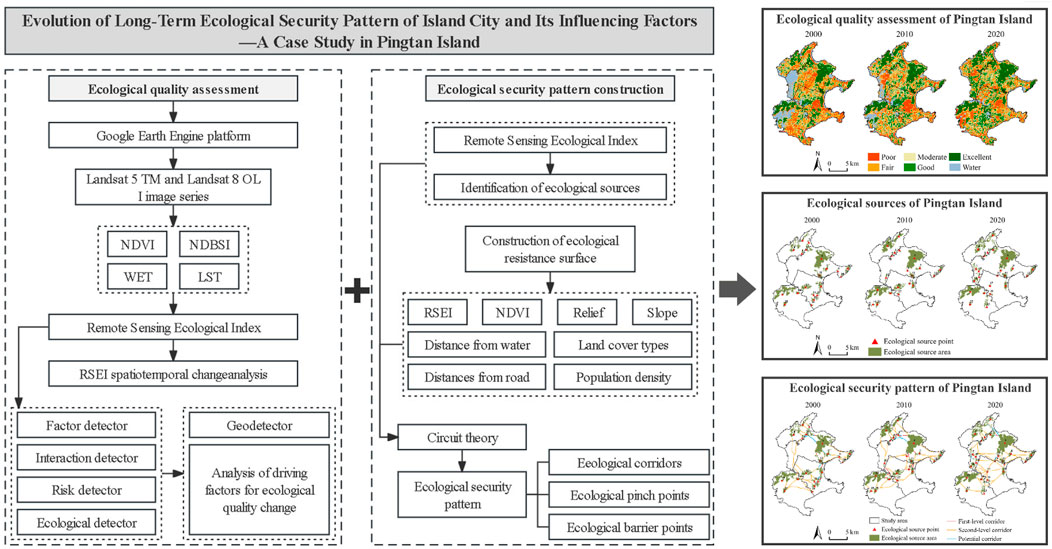
Figure 1. The flow chart.
2 Methods and material
2.1 Study area
Pingtan Island, directly administered by Fujian Province (Figure 2), is located in the eastern part of the province, spanning geographical coordinates from 25°15′N to 25°45′N, and from 119.932E to 120.10′E. Occupying a crucial strategic position in the maritime Silk Road and the comprehensive transportation network of Taiwan Strait, it is not only the largest island in Fujian Province but also the fifth largest in China. This study focuses on the main island of Pingtan, covering a total area of 307.36 km2 and encompassing four administrative regions: Haitan Street, Jingjing Town, Junshan Town, and Suping Town. Furthermore, its abundant natural resources and unique geographical characteristics render it a potential driver for regional economic and social advancement. Consequently, Pingtan Island is an exemplary region for studying the evolution of ESP in island cities.
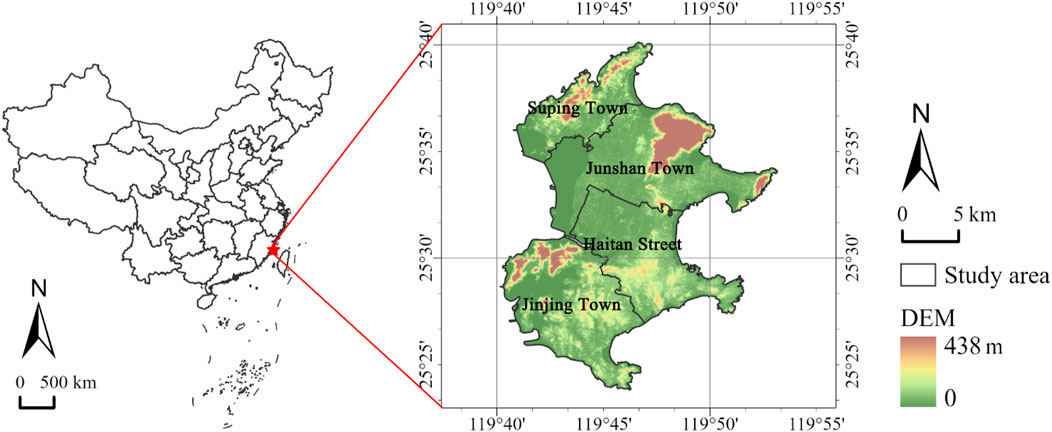
Figure 2. Location of pingtan island
2.2 Data sources and preprocessing
This study utilized the Google Earth Engine (GEE) cloud platform to select Landsat 5 TM and Landsat 8 OLI imagery from the same seasons (April 1st to October 1st) in 2000, 2010, and 2020. A total of 65 satellite images were used to create mosaics of Pingtan Island for these three periods, featuring the least cloud cover and a resolution of 30 m. The Landsat series images, provided by the United States Geological Survey (USGS), underwent radiometric and atmospheric corrections. Given the island’s geography, this study applied the Modified Normalized Difference Water Index (MNDWI) to mask water bodies, ensuring accurate representation of surface moisture conditions. Land use data were sourced from the CLCD dataset (Yang and Huang, 2021), processed in ArcGIS to categorize into five types: cropland, forest, grassland, water bodies, and built-up areas. Digital Elevation Model (DEM) data, obtained from the Geospatial Data Cloud (http://www.gscloud.cn/), were processed in ArcGIS to derive slope and terrain ruggedness for the study area. Additional data included annual average rainfall, temperature, population density, and artificial nighttime-light data, with sources and preprocessing methods detailed in Supplementary Table S1.
2.3 Methods
In order to study the evolution of the ecological quality of Pingtan Island from 2000 to 2020 and the main influencing factors, we firstly analyzed the changes in regional ecological quality and the mechanisms of various driving factors using RSEI and Geodetector. Subsequently, circuit theory was integrated to construct the ESP changes over past 2 decades in Pingtan Island, and to deeply explore future ecological protection planning for the study area.
2.3.1 Extraction of ecological source areas
RSEI is utilized to dynamically assess the ecological environment quality within the region, thereby identifying the areas of highest ecological quality on Pingtan Island as ecological source areas. RSEI comprises four indices: Greenness (NDVI), Wetness (WET), Heat (LST), and Dryness (NDBSI). Due to differing dimensions and value ranges of these indices, normalization is necessary. Ultimately, in this study, RSEI was obtained through principal component analysis (PCA), coupling these four indices, thereby offering greater objectivity compared to InVEST model. RSEI values range between [0, 1], with values closer to 1 indicating better EEQ. Greenness, represented by the Normalized Difference Vegetation Index, reflects the leaf area index, vegetation coverage, and plant growth conditions [19]. Wetness is derived using the Tasseled Cap Transformation [20]. Dryness is calculated from the built-up and bare soil indices [21], while the Heat index represents surface temperature, obtained via the Single-Window Algorithm [22]. Specific formulas for each index are detailed in Supplementary Table S2.
2.3.2 Ecological resistance simulation
Ecological resistance refers to the barriers encountered by species migration or energy flow between ecological sources, primarily influenced by land use types and terrain. Considering Pingtan Island’s numerous water bodies, large transportation routes, and water areas pose significant barriers to terrestrial species, while smaller water bodies are crucial water sources during species migration. Building on prior research (Watson and Doerr, 2017; Fu and Shi, 2020), eight key resistance factors were selected, and these factors were categorized into five levels (1–5) based on their resistance magnitude, with higher levels indicating greater resistance, following criteria in references (Supplementary Table S3). Ultimately, the Analytical Hierarchy Process (AHP) (Al-Harbi, 2001) was employed to determine the weights of these factors (Supplementary Table S4), and a comprehensive resistance surface was constructed in ArcGIS using a raster calculator, integrating these weighted factors (Supplementary Figure S1).
2.3.3 Ecological network construction
The construction of ecological networks involves identifying ecological corridors, pinch points, and breakpoints. This study employed the LM tool to extract ecological corridors and potential ones. The Centrality Mapper module was then used to identify the centrality of ecological corridors, quantifying the importance of different corridors. Subsequently, ecological corridors were classified into first-level and second-level using the natural breakpoint method in ArcGIS. Ecological pinch points (EPPs), areas of highest current density and thus the highest species migration density between sources, are critical nodes for ecological protection. The “All to one” mode of Pinch Point Mapper module was used to identify these points within the corridors. As previous research (Song and Qin, 2016) indicates, corridor width does not affect the distribution of EPPs or overall landscape connectivity, the weighted cost distance of corridors was set at 20,000 m in this study. Ecological barrier points (EBPs), areas in corridors that hinder species and information flow, reduce connectivity between sources. The Barrier Mapper module, with a minimum search radius of 50 m, a maximum detection radius of 250 m, and a step radius of 50 m, was used to obtain improvement coefficients. These coefficients were also classified using natural breakpoint method, designating the highest category as a priority area for future ecological restoration on Pingtan Island. It is noted that the analysis focused exclusively on the EPPs and EBPs of 2020 to align with future ESP construction for Pingtan Island.
2.3.4 Geodetector
The Geodetector is a statistical method used for detecting spatial heterogeneity and identifying driving factors. It comprises four components: factor detector, interaction detector, risk detector, and ecological detector. This method is now widely applied in fields like social and environmental sciences (Zhao and Zhan, 2020; Zeng and Wan, 2022). In this study, RSEI from 2000 to 2020 serves as the dependent variable. The independent variables selected for factor detection analysis include Annual average precipitation (A1), Average annual temperature (A2), Elevation (A3), Slope (A4), Percentage of construction area (A5), Percentage of cropland area (A6), Population density (A7), and GDP (A8). Temperature, precipitation, elevation, and slope are critical environmental conditions for vegetation growth (Peng and Kuang, 2019), while land use type and artificial nighttime-light represent urbanization levels. Population density and economic density indicate the extent and scale of human activities.
Factor Detector: This component assesses the explanatory power of independent variables (X) on the dependent variable (Y), typically represented by a q-value. The formula is shown in Eq. 1.
The range of q is [0, 1], where values closer to 1 indicate a stronger explanatory power of the factor on Y. Here, L represents the number of layers in Y or X; Nh and Nare the sample numbers in layer h and the entire region, respectively; σh2 and σ2 are the variances of Y within layer h and the entire region, respectively; SSW is the sum of within-layer variances; and SST is the total variance across the entire region.
Interaction Detector: This tool assesses the interactions among independent variables Xi, determining whether the combined effect of different factors enhances, weakens, or is independent of their explanatory power on the dependent variable Y. Types of interactions are categorized into five classes (Supplementary Table S5).
Ecological Detector: This detector compares the spatial distributions of different independent variables Xi in relation to the dependent variable Y, represented by F. The formula are shown in Eqs 2, 3.
SSWx1 and SSWx2 represent the sum of within-layer variances formed by the two independent variables X1 and X2, respectively. Nx1 and Nx2 denote the sample sizes of X1 and X2. The null hypothesis H0 posits that SSWx1=SSWx2. A rejection of H0 at the significance level α indicates a significant difference in the impact of X1 and X2 on the spatial distribution of Y, where Y denotes a significant difference and N denotes the absence of a significant difference.
3 Results
3.1 Assessment of EEQ of Pingtan Island
3.1.1 Temporal changes in EEQ
From 2000 to 2020, the PC1 consistently contributed over 70% to RSEI, with NDVI and WET always yielding positive values, while LST and NDBSI were negative indicators (Table 1), which suggested that greenness and wetness positively influence Pingtan Island’s ecological quality, whereas heat and dryness have detrimental effects, aligning with empirical observations. The remaining principal components (PC2—PC4) exhibited variable signs for these indicators, making it challenging to accurately represent ecological phenomena. Therefore, PC1 effectively integrates the characteristic information of each indicator and aligns with reality, making it suitable for further development of the RSEI model for Pingtan Island.

Table 1. Principal component analysis of four indicators on pingtan island, 2000–2020.
According to the classification method proposed by Xu Hanqiu (Xu and Wang, 2018), the RSEI values were divided into five levels: poor [0–0.2], below average [0.2–0.4], moderate [0.4–0.6], good [0.6–0.8], and excellent [0.8–1.0]. The area and proportion of different ecological grades for three periods from 2000 to 2020 were statistically analyzed (Table 2). Overall, the EEQ of Pingtan Island did not change significantly from 2000 to 2020 (Figure 3). The average RSEI showed a trend of initial decline from 0.47 to 0.50, followed by a steady increase to 0.51. During these periods, areas classified as good (0.6–0.8) or higher consistently exceeded 30%, indicating that despite high urbanization, the overall ecological quality has improved. Furthermore, the proportions of areas classified as good and excellent have gradually increased over time. Conversely, the moderate category, representing a moderate proportion in 2000 (24.1%), saw an increase in 2010 (25.76%) but dropped to its lowest in 2020 (22.71%), reflecting Pingtan Island’s contributions in land reclamation and afforestation. From 2000 to 2020, the area classified as excellent significantly increased, from 17.01% in 2000 to 19.93% in 2020, gradually forming a trend of an ecological barrier around the city. However, it was observed that areas of higher ecological quality increasingly concentrated in the central-western and southern parts, disrupting the previously balanced distribution of habitat patches. This has resulted in potential risks such as poor ecological connectivity and obstructed species migration and energy flow in the northwest and southeast regions.
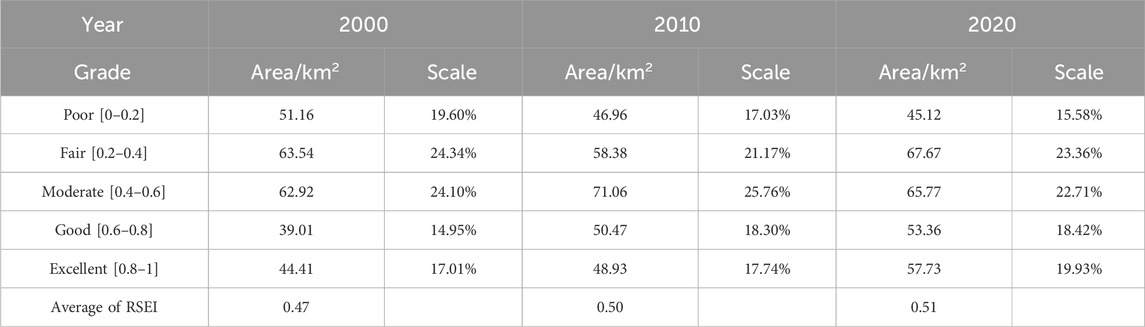
Table 2. Ecological quality grades and areas in pingtan island, 2000–2020.
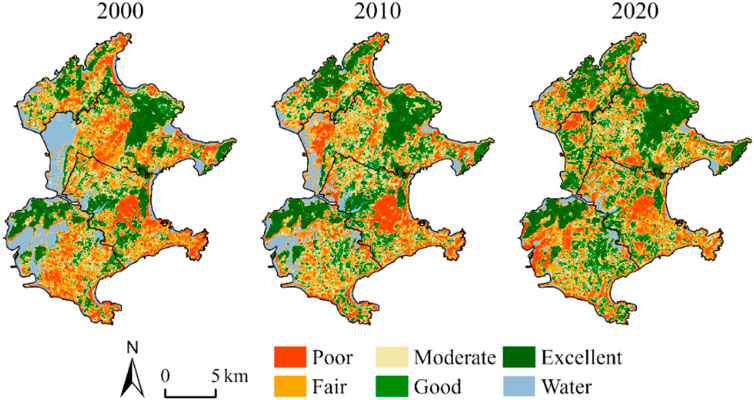
Figure 3. Distribution of RSEI ratings in Pingtan Island from 2000–2020.
3.1.2 Spatial changes in EEQ
Utilizing the previously calculated RSEI, changes in EEQ between successive years were analyzed and categorized into five distinct levels: Significant Deviation, Slight Deviation, No Significant Change, Slight Improvement, and Significant Improvement, as depicted in Figure 4. During 2000–2010, the majority of area under study exhibited a slight improvement in RSEI (47.40%), while a smaller fraction showed significant improvement (2.13%), primarily in the vicinity of junction between Junshan Town and Haitan Street, as well as in southern region of Jingjing Town. Furthermore, regions that experienced ecological deterioration in terms of RSEI between 2000 and 2010 witnessed gradual improvements during 2010–2020, with the aggregate of slight and significant improvements accounting for over 45% of the area, especially in urbanized locales such as Haitan Street and Junshan Town. Over past 2 decades, Pingtan Island’s ecological environment has generally improved, with slight improvements observed in 48.78% of the area and significant improvements in 6.26%. Nonetheless, there were also pockets of slight (25.12%) and significant (2.54%) RSEI degradation, predominantly in the western and southern sections of Haitan Street and western part of Jingjing Town. Conversely, the central and western regions of Junshan Town, central area of Jingjing Town, and the southeastern sector of Haitan Street have shown notable progress in ecological quality restoration in terms of ESP.

Figure 4. The spatial distribution of changes in the ecological environment quality of Pingtan from 2000 to 2020.
3.2 Impact factor analysis of EEQ
3.2.1 Univariate analysis
Using the factor detector component of Geodetector, and the specific steps are as follows: 1) Eight factors were selected as independent variables and categorized into eight groups using the natural breakpoint method; 2) A grid of 300 m × 300 m was generated in ArcGIS Pro and intersected with study area, forming a total of 3,704 points; 3) The RSEI model was used as dependent variable, and univariate analysis was conducted using the Geodetector plugin in Excel 2019. Results (Table 3) indicated that: 1) Across all three time periods, the p-values for all eight factors were 0.000, demonstrating their significant explanatory power for spatial variation in RSEI; 2) Throughout the time frames, factors A1 and A2 had the strongest explanatory power for RSEI spatial variation, with highest q-value reaching 0.378, suggesting that terrain has the most substantial impact on EEQ in the study area; 3) The q-value ranking of factor A7 showed the most significant change, moving from the sixth to fourth position. This shift reflects the growing impact of tourism over the past 2 decades, where the expansion of construction land has significantly affected local EEQ. Therefore, future efforts should focus on enhancing the management of ecological protection areas to prevent further encroachment of construction land into ecological spaces.
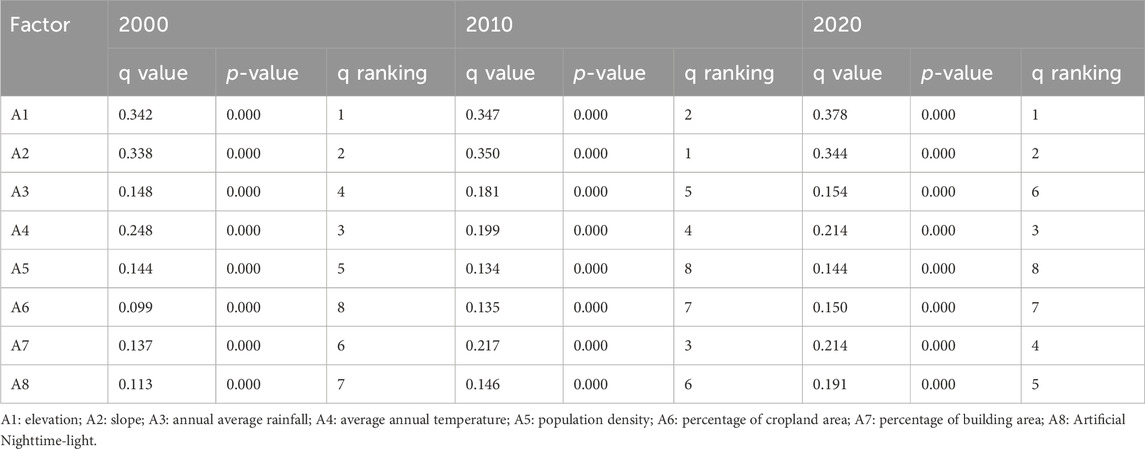
Table 3. The results of single factor detection.
3.2.2 Analysis of factor interactions
This section further employs the interaction and ecological detectors to examine interactions among various factors and their significant differences in spatial distribution of the RSEI. The results (Figure 5) indicated that: 1) The influence of each factor on spatial variation of RSEI in the study area was significantly enhanced after their interaction. Specifically, the bilinear enhancement model appeared 80 times, and the nonlinear enhancement model occurred 4 times; 2) The most substantial explanatory power for the spatial variation of RSEI across different years was A7∩A2, with a peak value reaching 0.521. This suggests that the interaction between slope and the percentage of construction area has a considerable impact on the EEQ. This could be attributed to areas with gentler slopes being more conducive to construction and socio-economic activities, thus experiencing greater human-induced disturbances, leading to a deterioration in ecological quality; 3) A total of 12 factor combinations yielded a ‘Y' result in the ecological detection, indicating these combinations have significant spatial heterogeneity in their impact on the RSEI.
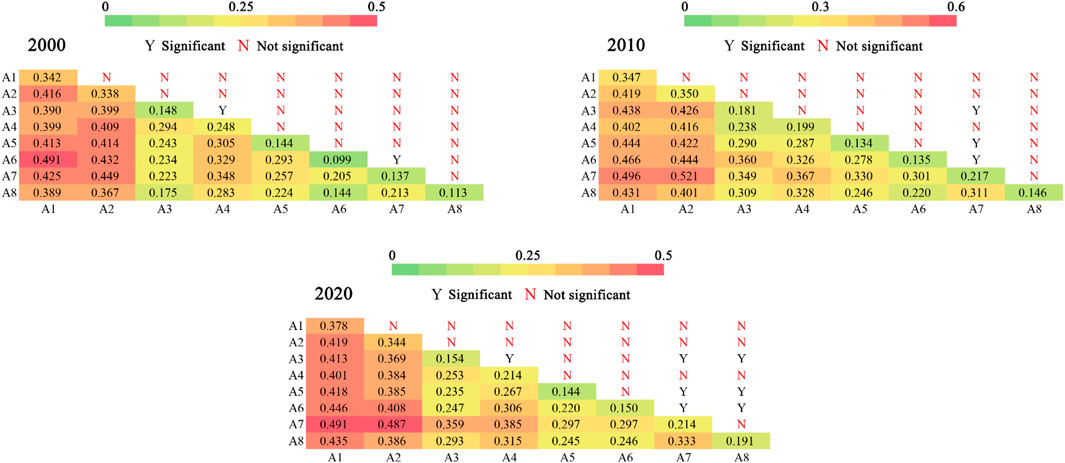
Figure 5. Eco-detection and interactive detection matrix.
3.3 Selection of ecological source areas
This study identified areas with an optimal ecological grade in 2000, 2010, and 2020, selecting regions larger than 0.2 km2 and ranking them by area. From 2000 to 2020 (Figure 6), there was an increasing trend in both the number (from n = 20 to n = 23) and area (from 39.07 km2 to 47.42 km2) of the ecological patches. The spatial distribution of these source areas varied significantly, primarily located in northern, central, and southwestern parts of the study area, with fewer patches in eastern and southern regions. Notably, in 2000, Haitan Street had six ecological source areas (numbers 12, 13, 15, 16, 18, 19) covering 6.67 km2. However, with increasing urbanization, the number of source areas in this region decreased to three (numbers 17, 18, 20) by 2020, totaling an area of 2.64 km2, and the distances between these areas widened, resulting in poor connectivity with other regions in the southeastern part of the study area. Therefore, future efforts should focus on ecological protection in the southeastern and southern parts of the study area, possibly through the creation of additional habitat patches, to enhance the overall ecological connectivity.
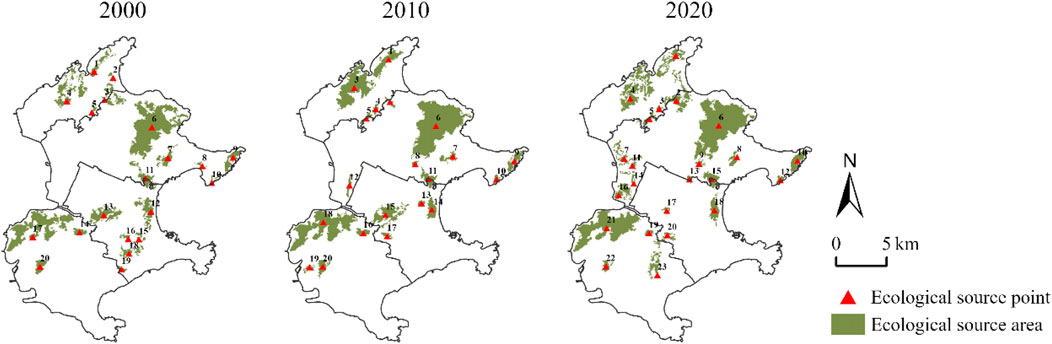
Figure 6. Spatial distribution of ecological source on Pingtan Island from 2000 to 2020.
3.4 Extraction of ecological corridors
Overall, the ecological network pattern underwent significant adjustments during the study period (Figure 7; Table 4). The total number of corridors remained between 50 and 54, with a slight fluctuation in their total length (112.010–114.252 km). In terms of corridor quantity, the number of first-level corridors initially decreased and then increased, while the number of second-level corridors first increased and then decreased. The quantity and length of potential corridors experienced considerable changes within this period, decreasing from 15 corridors totaling 13.183 km in 2000 to 3 corridors totaling 5.285 km in 2010. These changes reflect the dynamic adjustments in ecological network and shifts in management strategies, likely in response to environmental and ecological protection needs, as well as the island’s development strategies.
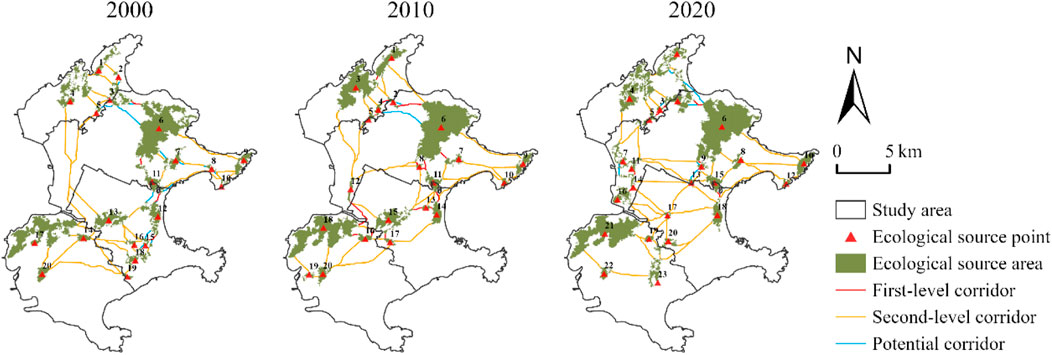
Figure 7. Spatial and temporal evolution of the ecological network on Pingtan Island, 2000–2020.
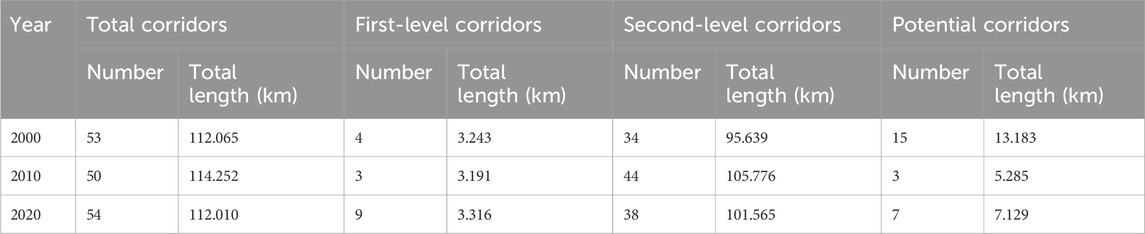
Table 4. Variations in the number and length of different types of ecological corridors on Pingtan Island, 2000–2020.
3.5 Identification of EPPs
The “All to one” mode of the Pinch Point Mapper module was employed to identify the current intensity and EPPs within Pingtan Island’s ecological network in 2020 (Figure 8A). The results showed the maximum current intensity at 0.4386, with identified EPPs predominantly located at either end or in the middle of corridors. The predominant land types at these EPPs were forest, farmland, and built-up areas. Areas with the highest current intensity (Figure 8B), were primarily concentrated at boundaries between Haitan Street, Jingjing Town, and Junshan Town. Additionally, a total of 32 ecological protection areas, covering 1.76 km2, were designated as EPPs, accounting for 0.572% of the total study area. The largest EPPs areas were located near the Wuxing Jinsha Beach Resort in Junshan Town (0.27 km2) and Lu Yang (0.17 km2). In contrast, the smallest EPPs measuring just 0.01 km2, was situated near Liaoyuan Village Committee.
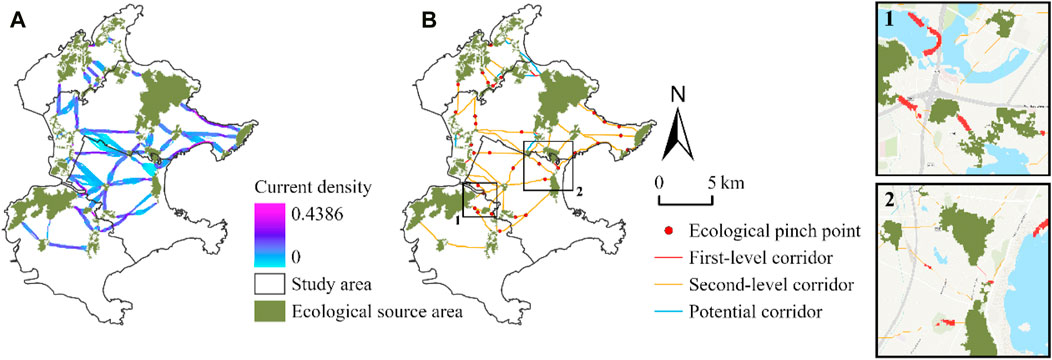
Figure 8. Spatial distribution of ecological pinch points on Pingtan Island in 2020.
3.6 Identification of EBPs
Figure 9A presents the identified EBPs within Pingtan Island’s ecological network for 2020, while Figure 9B highlights the areas designated as EBPs with the highest current restoration values. These areas were also considered priority zones for future ecological restoration on the island. In total, 52 EBPs were identified, covering an area of 3.71 km2, which constitutes 0.012% of the total study area. Generally, the distribution of these EBPs bears similarities to that of the EPPs, with a concentration at the boundaries of Haitan Street, Jingjing Town, and Junshan Town. These areas were significantly affected by human activities, and the current land use was predominantly for construction purposes. The largest EBP covers an area of 0.42 km2, located at Lianhua Mountain Park, while the smallest, measuring just 0.01 km2, is near Ruyi Lake Park.
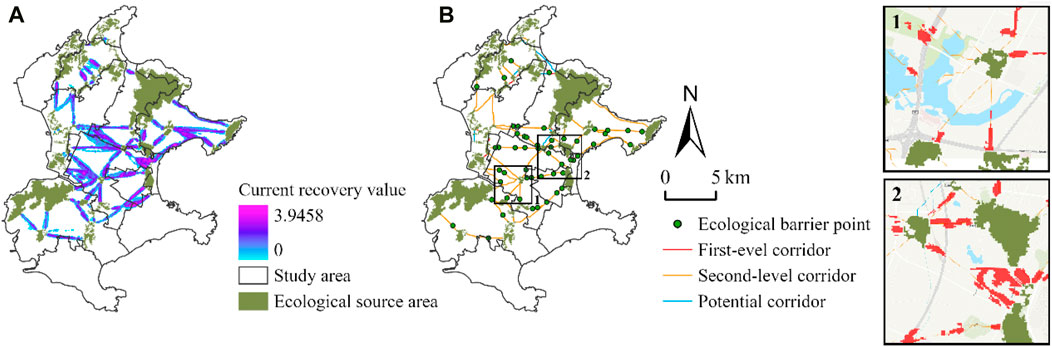
Figure 9. Spatial distribution of ecological barrier points on Pingtan Island in 2020.
4 Discussion
In July 2009, China officially established the Pingtan Comprehensive Experimental Area. However, the rapid pace of economic growth and ecological civilization construction has led to substantial ecological damage on Pingtan Island, adversely affecting the vegetation and causing coastal degradation. “The Overall Plan for the Pingtan Comprehensive Experimental Area (2018–2035)" proposes a “one primary, four secondary” urban cluster model for the main island, which was similar to the ecological network for Pingtan Island developed in this study. However, intensive land use during urban development has led to the shrinkage or disappearance of ecological source areas in the center of the region, especially in the western and southern parts of Haidan Street and the western part of Jinjing Town. From 2000 to 2020, despite an overall improvement in ecological maintenance and environmental quality on Pingtan Island, ecological deterioration occurred in some areas, an inevitable byproduct of urbanization. To enhance the quality of ecological source areas, particularly where RSEI has worsened or severely deteriorated, the implementation of ecological protection policies such as “converting farmland back to forest” and “ecological restoration” is crucial. For example, the Government may consider giving priority to ecological restoration in the central area of Haitan Street by building pocket parks and green spaces to facilitate the migration of wild animals.
On the other hand, Pingtan has been exploring wind energy since 1976, becoming one of China’s earliest wind power experimentation sites, with the majority of its onshore wind power projects concentrated in the northern part of the island (Zhou and Lu, 2017). Wind power, being part of the energy infrastructure, lacks ecological functionality and causes significant anthropogenic disturbances. As a point or linear element, wind power projects fragment habitat patches into isolated units, degrading the quality and landscape structure of ecological source areas, and thus harming the integrity of the ecosystem (Guan, 2023). Research has shown that wind power projects impede ecological processes such as species habitation, migration, and dispersion. These projects spatially disrupt natural habitats and ecological corridors crucial for species energy exchange, posing a serious threat to regional ecological safety and stability (Guo and Zhang, 2020). This explains the fragmentation of ecological source areas and the extensive deterioration or severe worsening of RSEI values in northern part of the study area from 2000 to 2020. To mitigate these effects, strengthening green infrastructure protection, consolidating landscape connectivity, and preserving ecosystem service values are essential. Focusing on protecting areas where the ecological environment has deteriorated will enhance the overall suitability of the study area.
This study utilized the factor detector to analyze the mechanisms through which various factors affect the RSEI. The findings were beneficial for future policy-making regarding the island’s ESP. Throughout the study period, Elevation and Slope were found to have the strongest explanatory power for spatial variations in RSEI, indicating that terrain and slope significantly impact the EEQ of the area. To mitigate these impacts, comprehensive strategies such as adaptive vegetation management (Asaeda and Jayasanka, 2018) or the development of sensitive area protection plans (Steiner and Blair, 2000) should be implemented. These strategies aim to manage human activities effectively to reduce their impact on ecologically sensitive areas. Additionally, considering the influence of terrain and slope on EEQ, adopting more environmentally friendly and sustainable development methods is also crucial. Furthermore, strengthening environmental monitoring and assessment (Wang and Freemark, 1995) through regular ecological and topographical monitoring, as well as environmental quality assessments, ensures the effective implementation and continuous improvement of these measures. Such comprehensive actions can effectively improve and restore the ecological environment affected by terrain and slope. The q-value ranking change for the percentage of building area is significant, indicating the growing tourism industry on Pingtan Island over the past 2 decades. The expansion of construction land due to tourism development had a substantial impact on local EEQ. Therefore, utilizing urban grey spaces such as rooftops, bridge frames, and interiors for greening, like wall greening, vertical green walls, or rooftop gardens, can enhance urban EEQ, providing more ecological space for species migration and dispersion, and preventing further encroachment on ecological spaces.
Combining the MSPA to quantify the ESP can help researchers more intuitively observe, understand, and analyze ecological changes within the study area (Wang and Wu, 2021; Hu and Wang, 2022; Yang and Guo, 2022). Typically, forested areas, woodlands, nature reserves, or park green spaces with rich species communities are selected as core areas within the study region (Zhang and Zhang, 2022). However, this method of source area selection was subjective and does not consider differences in habitat quality between source areas. Compared to previous studies, the RSEI model employed in this study provides a more comprehensive selection of factors than the InVEST model (Tang and Gao, 2020; Xiao and Cui, 2020), with a more objective weighting of each factor. It also directly reflects the recent changes in EEQ in study area, identifying areas with high stability and habitat quality. In terms of corridor simulation, while most studies used the MCR model (Wei and Halike, 2022; Wei and Zhu, 2022; Feng and Zhao, 2023) to extract potential ecological infrastructure corridor paths, the MCR model overlooks the randomness of biological movement and fails to identify potential corridors and key ecological nodes (Nie and Shi, 2021). The ecological corridors constructed through circuit theory in this study are more characteristic of biological features and can be graded according to the results of the Centrality Mapper module. The identified EPPs and EBPs provide a scientific basis for future ecological protection planning on Pingtan Island (Dickson and Albano, 2019; Yang and Suo, 2022), and the method and process have proven to be practical and reliable. Similar to many existing studies, this research has its limitations. Due to the lack of observational data, this study did not analyze the impact of different species (such as birds, mammals, amphibians, etc.), which may affect the specificity of the results. Future research will attempt to construct ecological corridors focusing on a particular species, providing more detailed data for biodiversity conservation on Pingtan Island.
5 Conclusion
Using Pingtan Island, a typical coastal island city in Southeast China, as an example, the study employs RSEI to identify areas with the highest EEQ as ecological source areas. This study utilizes the factor detector to analyze the mechanisms through which various factors affect RSEI. Additionally, it integrates LM tool and circuit theory to identify ecological corridors and key ecological nodes for constructing ESP while proposing corresponding ecological protection strategies. The key conclusions were as follows.
(1) From 2000 to 2020, there was minimal change in EEQ of the study area. The average RSEI exhibited a trend of gradual increase followed by regional stability, indicating an overall improvement in EEQ. Over the past 2 decades, there has been mild (25.12%) and significant (2.54%) improvement, primarily concentrated in the western and southern areas of Haitan Street and western region of Jinjing Town. The factor analysis revealed that Elevation and Slope have the most significant explanatory power for the spatial variation in RSEI, highlighting the substantial impact of terrain on the EEQ of study area. Future efforts should focus on strengthening the development of relevant management regulations for ecological protection areas. Furthermore, the interaction between Slope and the percentage of construction area had a substantial impact on EEQ of Pingtan Island. This may be attributed to areas with lower slopes being more favorable for land development and socioeconomic activities, resulting in higher human disturbance and a decline in EEQ.
(2) Over time, there has been a gradual increase in the number and area of ecological patches. However, there were significant spatial differences in the distribution of ecological source areas, primarily concentrated in the northern, central, and southwestern regions, with fewer in eastern and southern areas. Therefore, future efforts should prioritize ecological protection in these regions, including the creation of additional habitat patches and implementation of deep ecological restoration measures to enhance the overall ecological connectivity. Additionally, the ecological network pattern has undergone adjustments over the course of 20 years, with the total number of corridors remaining between 50 and 54, and slight fluctuations in total length. In terms of corridor quantity, first-level corridors exhibited a decreasing trend followed by an increase, while second-level corridors displayed an initial increase followed by a decrease. These trends reflect the dynamic adjustments of the ecological network and changes in management strategies.
(3) A total of 32 ecological protection areas with an average area of 1.76 km2 have been identified as EPPs. These EPPs were predominantly located at the ends or central regions of corridors and are characterized by land use types such as forests, cultivated land, and construction land. The largest ecological protection area was situated near Wuxing Jinsha Beach Resort in Junshan Town. Furthermore, 52 EBPs have been identified, representing key areas for future ecological restoration efforts on study area. In summary, there were similarities in the distribution of EBPs and EPPs, with concentrations at the borders of Haitan Street, Jinjing Town, and Junshan Town. These areas also hold significance for the optimization and enhancement of Pingtan Island’s ESP in the future.
Data availability statement
The original contributions presented in the study are included in the article/Supplementary Material, further inquiries can be directed to the corresponding author.
Author contributions
BW: Conceptualization, Methodology, Software, Validation, Formal analysis, Data curation, Writing–original draft. KD: Formal analysis, Writing–review and editing. CL: Conceptualization, Data curation, Writing–review and editing, Supervision, Project administration, Funding acquisition. JC: Conceptualization, Writing–review and editing.
Funding
The author(s) declare financial support was received for the research, authorship, and/or publication of this article. This research was funded by the National Natural Science Foundation of China, grant numbers 51968026 and 52268012.
Conflict of interest
The author declares that the research was conducted in the absence of any commercial or financial relationships that could be construed as a potential conflict of interest.
Publisher’s note
All claims expressed in this article are solely those of the authors and do not necessarily represent those of their affiliated organizations, or those of the publisher, the editors and the reviewers. Any product that may be evaluated in this article, or claim that may be made by its manufacturer, is not guaranteed or endorsed by the publisher.
Supplementary material
The Supplementary Material for this article can be found online at: https://www.frontiersin.org/articles/10.3389/fenvs.2024.1349324/full#supplementary-material
Abbreviations
ESP, ecological security pattern; RSEI, remote sensing ecological index; LM, linkage mapping; EEQ, ecological environmental quality; EPPs, ecological pinch points; EBPs, ecological barrier points; MCR, minimum cumulative resistance; DPSIR, driving force-pressure-state-impact-response; MGWR, multiscale geographically weighted regression; GEE, google earth engine; MNDWI, modified normalized difference water index; DEM, digital elevation model; PCA, principal component analysis; AHP, analytical hierarchy process.
References
Al-Harbi, K. M. A. (2001). Application of the AHP in project management. Int. J. Proj. Manag. 19 (1), 19–27. doi:10.1016/s0263-7863(99)00038-1
Asaeda, T., Jayasanka, S. M. D. H., Xia, L. P., and Barnuevo, A. (2018). Application of hydrogen peroxide as an environmental stress indicator for vegetation management. Engineering 4 (5), 610–616. doi:10.1016/j.eng.2018.09.001
Bestelmeyer, B. T., Okin, G. S., Duniway, M. C., Archer, S. R., Sayre, N. F., Williamson, J. C., et al. (2015). Desertification, land use, and the transformation of global drylands. Front. Ecol. Environ. 13 (1), 28–36. doi:10.1890/140162
Cao, W., and Wong, M. H. (2007). Current status of coastal zone issues and management in China: a review. Environ. Int. 33 (7), 985–992. doi:10.1016/j.envint.2007.04.009
Cardinale, B. J., Duffy, J. E., Gonzalez, A., Hooper, D. U., Perrings, C., Venail, P., et al. (2012). Biodiversity loss and its impact on humanity. Nature 486 (7401), 59–67. doi:10.1038/nature11148
Dai, L., Liu, Y., and Luo, X. (2021). Integrating the MCR and DOI models to construct an ecological security network for the urban agglomeration around Poyang Lake, China. Sci. Total Environ. 754, 141868. doi:10.1016/j.scitotenv.2020.141868
Dickson, B. G., Albano, C. M., Anantharaman, R., Beier, P., Fargione, J., Graves, T. A., et al. (2019). Circuit-theory applications to connectivity science and conservation. Conserv. Biol. 33 (2), 239–249. doi:10.1111/cobi.13230
Feng, M., Zhao, W., and Zhang, T. (2023). Construction and optimization strategy of county ecological infrastructure network based on MCR and gravity model—a case study of langzhong county in sichuan province. Sustainability 15 (11), 8478. doi:10.3390/su15118478
Fleming, P. A., Anderson, H., Prendergast, A. S., Bretz, M. R., Valentine, L. E., and Hardy, G. E. S. (2014). Is the loss of A ustralian digging mammals contributing to a deterioration in ecosystem function? Mammal. Rev. 44 (2), 94–108. doi:10.1111/mam.12014
Fu, Y., Shi, X., He, J., Yuan, Y., and Qu, L. (2020). Identification and optimization strategy of county ecological security pattern: a case study in the Loess Plateau, China. Ecol. Indic. 112, 106030. doi:10.1016/j.ecolind.2019.106030
Gjorgievski, V. Z., Markovska, N., Pukšec, T., Duić, N., Foley, A., et al. (2021). Supporting the 2030 agenda for sustainable development: special issue dedicated to the conference on sustainable development of energy, water and environment systems 2019. Renew. Sustain. Energy Rev. 143, 110920. doi:10.1016/j.rser.2021.110920
Guan, J. (2023). The impact of onshore wind farms on ecological corridors in Ningbo, China. Environ. Res. Commun. 5 (1), 015006. doi:10.1088/2515-7620/acb126
Guo, X., Zhang, X., Du, S., Li, C., Siu, Y. L., Rong, Y., et al. (2020). The impact of onshore wind power projects on ecological corridors and landscape connectivity in Shanxi, China. J. Clean. Prod. 254, 120075. doi:10.1016/j.jclepro.2020.120075
He, L., Shen, J., and Zhang, Y. (2018). Ecological vulnerability assessment for ecological conservation and environmental management. J. Environ. Manag. 206, 1115–1125. doi:10.1016/j.jenvman.2017.11.059
He, N., Zhou, Y., Wang, L., Li, Q., Zuo, Q., Liu, J., et al. (2022). Spatiotemporal evaluation and analysis of cultivated land ecological security based on the DPSIR model in Enshi autonomous prefecture, China. Ecol. Indic. 145, 109619. doi:10.1016/j.ecolind.2022.109619
Hu, C., Wang, Z., Wang, Y., Sun, D., and Zhang, J. (2022). Combining MSPA-MCR model to evaluate the ecological network in Wuhan, China. Land 11 (2), 213. doi:10.3390/land11020213
Lai, S., Eladawy, A., Sha, J., Li, X., Wang, J., Kurbanov, E., et al. (2022). Towards an integrated systematic approach for ecological maintenance: case studies from China and Russia. Ecol. Indic. 140, 108982. doi:10.1016/j.ecolind.2022.108982
Lee, B. X., Kjaerulf, F., Turner, S., Cohen, L., Donnelly, P. D., Muggah, R., et al. (2016). Transforming our world: implementing the 2030 agenda through sustainable development goal indicators. J. public health policy 37, 13–31. doi:10.1057/s41271-016-0002-7
Li, Z., Li, M., and Xia, B. C. (2020). Spatio-temporal dynamics of ecological security pattern of the Pearl River Delta urban agglomeration based on LUCC simulation. Ecol. Indic. 114, 106319. doi:10.1016/j.ecolind.2020.106319
McRae, B. H., Dickson, B. G., Keitt, T. H., and Shah, V. B. (2008). Using circuit theory to model connectivity in ecology, evolution, and conservation. Ecology 89 (10), 2712–2724. doi:10.1890/07-1861.1
Montoya, J. M., Pimm, S. L., and Solé, R. V. (2006). Ecological networks and their fragility. Nature 442 (7100), 259–264. doi:10.1038/nature04927
Nie, W., Shi, Y., Siaw, M. J., Yang, F., Wu, R., Wu, X., et al. (2021). Constructing and optimizing ecological network at county and town Scale: the case of Anji County, China. Ecol. Indic. 132, 108294. doi:10.1016/j.ecolind.2021.108294
Peng, J., Yang, Y., Liu, Y., Hu, Y., Du, Y., Meersmans, J., et al. (2018). Linking ecosystem services and circuit theory to identify ecological security patterns. Sci. total Environ. 644, 781–790. doi:10.1016/j.scitotenv.2018.06.292
Peng, W., Kuang, T., and Tao, S. (2019). Quantifying influences of natural factors on vegetation NDVI changes based on geographical detector in Sichuan, western China. J. Clean. Prod. 233, 353–367. doi:10.1016/j.jclepro.2019.05.355
Rebelo, A. J., Morris, C., Meire, P., and Esler, K. J. (2019). Ecosystem services provided by South African palmiet wetlands: a case for investment in strategic water source areas. Ecol. Indic. 101, 71–80. doi:10.1016/j.ecolind.2018.12.043
Song, L. L., and Qin, M. Z. (2016). Identification of ecological corridors and its importance by integrating circuit theory. Ying Yong Sheng tai xue bao= J. Appl. Ecol. 27 (10), 3344–3352. doi:10.13287/j.1001-9332.201610.035
Steiner, F., Blair, J., McSherry, L., Guhathakurta, S., Marruffo, J., and Holm, M. (2000). A watershed at a watershed: the potential for environmentally sensitive area protection in the upper San Pedro Drainage Basin (Mexico and USA). Landsc. urban Plan. 49 (3-4), 129–148. doi:10.1016/s0169-2046(00)00062-1
Tang, Y., Gao, C., and Wu, X. (2020). Urban ecological corridor network construction: an integration of the least cost path model and the InVEST model. ISPRS Int. J. Geo-Information 9 (1), 33. doi:10.3390/ijgi9010033
Wang, D., Chen, J., Zhang, L., Sun, Z., Wang, X., Zhang, X., et al. (2019). Establishing an ecological security pattern for urban agglomeration, taking ecosystem services and human interference factors into consideration. PeerJ 7, e7306. doi:10.7717/peerj.7306
Wang, S., Wu, M., Hu, M., Fan, C., Wang, T., and Xia, B. (2021). Promoting landscape connectivity of highly urbanized area: an ecological network approach. Ecol. Indic. 125, 107487. doi:10.1016/j.ecolind.2021.107487
Wang, W. C., and Freemark, K. (1995). The use of plants for environmental monitoring and assessment. Ecotoxicol. Environ. Saf. 30 (3), 289–301. doi:10.1006/eesa.1995.1033
Wang, X. H., He, J., et al. (2021a). Years of ecological protection and restoration in China: review and prospect. Chin. J. Environ. Manag. 5 (5), 85–92.
Wang, X. H., He, J., et al. (2021b). Years of ecological protection and restoration in China: review and prospect. Chin. J. Environ. Manag. 5 (5), 85–92.
Watson, D. M., Doerr, V. A., Banks, S. C., Driscoll, D. A., van der Ree, R., Doerr, E. D., et al. (2017). Monitoring ecological consequences of efforts to restore landscape-scale connectivity. Biol. Conserv. 206, 201–209. doi:10.1016/j.biocon.2016.12.032
Wei, H., Zhu, H., Chen, J., Jiao, H., Li, P., and Xiong, L. (2022). Construction and optimization of ecological security pattern in the Loess Plateau of China based on the Minimum Cumulative Resistance (MCR) model. Remote Sens. 14 (22), 5906. doi:10.3390/rs14225906
Wei, Q., Halike, A., Yao, K., Chen, L., and Balati, M. (2022). Construction and optimization of ecological security pattern in Ebinur Lake Basin based on MSPA-MCR models. Ecol. Indic. 138, 108857. doi:10.1016/j.ecolind.2022.108857
Xiao, L., Cui, L., Jiang, Q., Wang, M., Xu, L., and Yan, H. (2020). Spatial structure of a potential ecological network in Nanping, China, based on ecosystem service functions. Land 9 (10), 376. doi:10.3390/land9100376
Xu, H., Wang, M., Shi, T., Guan, H., Fang, C., and Lin, Z. (2018). Prediction of ecological effects of potential population and impervious surface increases using a remote sensing based ecological index (RSEI). Ecol. Indic. 93, 730–740. doi:10.1016/j.ecolind.2018.05.055
Xu, H. Q. (2013). A remote sensing urban ecological index and its application. Acta Ecol. Sin. 33 (24), 7853–7862. doi:10.5846/stxb201208301223
Yang, C., Guo, H., Huang, X., Wang, Y., Li, X., and Cui, X. (2022). Ecological network construction of a national park based on MSPA and MCR models: an example of the proposed national parks of “ailaoshan-wuliangshan” in China. Land 11 (11), 1913. doi:10.3390/land11111913
Yang, H., Xu, W., Yu, J., Xie, X., Xie, Z., Lei, X., et al. (2023). Exploring the impact of changing landscape patterns on ecological quality in different cities: a comparative study among three megacities in eastern and western China. Ecol. Inf. 77, 102255. doi:10.1016/j.ecoinf.2023.102255
Yang, H., Yu, J., Xu, W., Wu, Y., Lei, X., Ye, J., et al. (2023). Long-time series ecological environment quality monitoring and cause analysis in the Dianchi Lake Basin, China. Ecol. Indic. 148, 110084. doi:10.1016/j.ecolind.2023.110084
Yang, J., and Huang, X. (2021). The 30 m annual land cover dataset and its dynamics in China from 1990 to 2019. Earth Syst. Sci. Data 13 (8), 3907–3925. doi:10.5194/essd-13-3907-2021
Yang, L., Suo, M., Gao, S., and Jiao, H. (2022). Construction of an ecological network based on an integrated approach and circuit theory: a case study of Panzhou in Guizhou Province. Sustainability 14 (15), 9136. doi:10.3390/su14159136
Yang, Y., and Cai, Z. (2020). Ecological security assessment of the Guanzhong Plain urban agglomeration based on an adapted ecological footprint model. J. Clean. Prod. 260, 120973. doi:10.1016/j.jclepro.2020.120973
Yu, K. (1996). Security patterns and surface model in landscape ecological planning. Landsc. urban Plan. 36 (1), 1–17. doi:10.1016/s0169-2046(96)00331-3
Zeng, W., Wan, X., Lei, M., Gu, G., and Chen, T. (2022). Influencing factors and prediction of arsenic concentration in Pteris vittata: a combination of geodetector and empirical models. Environ. Pollut. 292, 118240. doi:10.1016/j.envpol.2021.118240
Zhang, R., Zhang, Q., Zhang, L., Zhong, Q., Liu, J., and Wang, Z. (2022). Identification and extraction of a current urban ecological network in Minhang District of Shanghai based on an optimization method. Ecol. Indic. 136, 108647. doi:10.1016/j.ecolind.2022.108647
Zhao, R., Zhan, L., Yao, M., and Yang, L. (2020). A geographically weighted regression model augmented by Geodetector analysis and principal component analysis for the spatial distribution of PM2. 5. Sustain. Cities Soc. 56, 102106. doi:10.1016/j.scs.2020.102106
Zhou, H., Lu, Y., Liu, X., Chang, R., and Wang, B. (2017). Harvesting wind energy in low-rise residential buildings: design and optimization of building forms. J. Clean. Prod. 167, 306–316. doi:10.1016/j.jclepro.2017.08.166
Keywords: Geodetector, ecological corridors, circuit theory, island cities, remote sensing ecological indices
Citation: Wu B, Dai K, Liu C and Chen J (2024) Evolution of long-term ecological security pattern of island city and its influencing factors—a case study in Pingtan Island. Front. Environ. Sci. 12:1349324. doi: 10.3389/fenvs.2024.1349324
Received: 04 December 2023; Accepted: 30 January 2024;
Published: 13 June 2024.
Edited by:
Chong Jiang, Guangdong Academy of Science (CAS), ChinaCopyright © 2024 Wu, Dai, Liu and Chen. This is an open-access article distributed under the terms of the Creative Commons Attribution License (CC BY). The use, distribution or reproduction in other forums is permitted, provided the original author(s) and the copyright owner(s) are credited and that the original publication in this journal is cited, in accordance with accepted academic practice. No use, distribution or reproduction is permitted which does not comply with these terms.
*Correspondence: Chunqing Liu, bGl1Y2h1bnFpbmdAanhhdS5lZHUuY24=