 Sibusiso Khoza
 Mduduzi Biyase
- 1School of Economics, University of Johannesburg, Johannesburg, South Africa
- 2Department of Media Management, University of Religions and Denominations, Qom, Iran
Introduction: The literature on the finance–emission nexus offers conflicting conclusions. This study resolves this inconsistency by investigating the symmetric and asymmetric effect of financial development on ecological footprint in South Africa, using the Environmental Kuznets Curve framework as a guide. Given the coexistence of ecological deficits and world-class financial development systems in South Africa, it is essential to explore and evaluate potential solutions to mitigating these deficits. Our empirical analysis contributes to the body of literature on the impact of financial development and ecological footprint by using a comprehensive measure of financial development and disaggregates it into its sub-indices to provide a nuanced analysis.
Method: This study employs the linear auto regressive distribution lag and nonlinear auto regressive distribution lag techniques to explore the complex interactions of financial development and ecological footprint.
Results and Discussion: The findings of this research indicate that financial markets and institutions seem to have varying effects on the ecological footprint. Financial market indices promote environmental quality, while financial institutions exacerbate environmental quality. These results call for policymakers to craft a watertight process that will encourage both financial markets and institutions to allocate capital to projects that are pro-environmental.
1 Introduction
The current challenge faced by the global community is the imperative of ensuring the continuity of sustainable development (SD) for both current and subsequent generations. Addressing environmental degeneration has transitioned from low priority into a pressing necessity for global survival Khan et al., (2021). Efforts to prioritise environmental deterioration suggest that global leaders are beginning to recognise and appreciate the interconnectedness between human activities and the planet and the unintended consequences. Shabhaz et al. (2013) argue that the view of environmental degeneration, being a problem of advanced and not emerging nations, remains invalid with respect to consequences. A momentous global rise in economic activities has led to a high demand for natural resources (land, fossil fuels, forests, fish, etc). The situation is so critical that the global footprint network has projected that 80% of global land has reached ecological deficit. Many developing countries are in a similar situation. For example, South Africa ranks 17th out of 185 countries with the highest EF (Global Footprint Network, 2023). Bowa et al., (2019) observe that South Africa ranks first of 15 economies with the highest environmental emissions within the Southern African Development Community (SADC) region.
Several human-related factors that contribute to environmental degradation have been investigated, with a special focus on variables such as energy-consumption patterns. More recently, Adams and Klobodu (2018), Baloch et al. (2019), Godil et al. (2020), Tsaurai (2019) and Ju et al. (2023) have considered financial development (FD) among the crucial factors that are likely to influence environmental degeneration. As more and more countries better financially develop, they are likely to engage in unsustainable practices like the overutilisation of natural resources and environmental pollution. South Africa has taken the drastic step since the 1990s of reorganising the financial sector through a series of supervisory changes and revamps to elevate its financial infrastructure to a higher calibre (Bank of International Settlements BIS, 2012). Furthermore, Shabhaz et al. (2013) and Ilesanmi and Tewari (2019) posit that the financial systems of South Africa are advanced, with highly respected banking regulations rated among the top-ten nations with such sophisticated systems. South Africa clearly presents an interesting place for research, given the international dialogue concerning environmental issues and financial development.
While recent studies have shed more light on the relationship between FD and environmental quality, the findings remain inconclusive, with some studies demonstrating that FD increases environmental quality, whereas others claim that increased FD worsens environmental degradation. Contributing to the inconclusive findings is the fact that many prevailing studies assume a linear relationship between FD and environmental quality. For example, several studies assessing the financial development and ecological footprint nexus in South Africa assume a linear association (Shabhaz et al., 2013; Bekun et al., 2019; Nathaniel et al., 2019; Adebayo et al., 2021). Second, many of these studies rely on conventional measures of financial development (including domestic credit to GDP) and environmental quality (CO2, which only accounts for air pollution).
The contribution of this study is threefold. First, it uses a multi-facet measure of environmental quality, frequently referred to as “ecological footprint”, which considers numerous environmental indices for environment quality as a CO2 proxy. Second, this study also uses a comprehensive measure of FD which offers a more nuanced analysis of financial development by allowing for factors like depth, access, and efficiency across financial institutions and markets, thereby giving specific insights into the different impacts of financial markets and financial institutions on environmental quality in South Africa. Third, this study examines the intricate dynamics that might exist beyond a simple linear relationship by employing ARDL for the linear effects and NARDL for the non-linear effects of FD to produce robust policy suggestions.
The structure of this research is as follows. Section 2 provides the literature review. Section 3 focuses on the technique, modelling, and data to be used. Empirical results and interpretations are explained in Section 4. Section 5 concludes by drawing the implications of the results, recommendations for the policymakers, and the deficiencies of this research.
2 Literature
2.1 Theoretical literature
The connection between FD and EF is multidimensional, with economists far from reaching a consensus as to whether FD exacerbates or improves EF (Awosusi et al., 2022). The view taken by some economists is that FD can reduce EF (UNEP, 2011; Majeed and Mazhar, 2019; Zaidi et al., 2019; Odhiambo, 2020; United Nations Environment Programme; Zhao and Yang, 2020; Akinsola et al., 2021; Hussain et al., 2022; Acar et al., 2023). This view is derived from many theories in this field, such as the Green Growth Theory, which suggests that FD supports and facilitates the expansion of green industries, thus implying that FD lessens EF in diverse sectors of the economy UNEP (2011). The view is also partly underpinned by the ecological modernisation theory; although it is not directly related to the connection between FD and EF, it does point to a certain degree of complementary harmony between FD and environmental protection. A view held by other economists is that FD intensifies EF due to increased economic activity (Adams and Klobodu, 2018; Nathaniel et al., 2019; Tsaurai, 2019; Khan et al., 2021; Yang et al., 2021; Dada et al., 2022a; Hussain et al., 2023). This view is partly premised on a consumerism theory whereby improvement in economic activities can induce consumer behaviour, which in turn exacerbates EF (Pepper et al., 2009). Another theory that sheds some light on this view is the pollution refuge hypothesis which highlights the close links between FD and EF. According to this theory, economies that lack environmental regulations tend to have a higher EF because local industries do not bother about regulations and the unintended consequences of the production process, thus stimulating higher EF (Cil, 2022). Last but not least, a well-known hypothesis that underpins the finance–emission nexus is the environmental Kuznets curve (EKC). The upward sloping portion of the EKC characteristically points to a positive relationship between economic development and environmental degradation. It is in this upward sloping part of the EKC that the financial sector appears to intensify/worsen environmental degradation by enabling more production in various sectors of the economy. The downward-sloping portion of the EKC is due to the financial sector embracing and using green and modern technologies.
There is an extensive recent literature that has empirically investigated the connection between FD and EF (see Table 1). Nevertheless, the findings have far from converged, which may be characterised by factors such as methodology, sample size, control variables, proxies, and countries. Thus, the empirical studies on this subject are in three distinct categories: 1) exploring the worsening effect of FD; 2) emphasising the mitigating effect; 3) analyzing nonlinear effects. These are explained below.
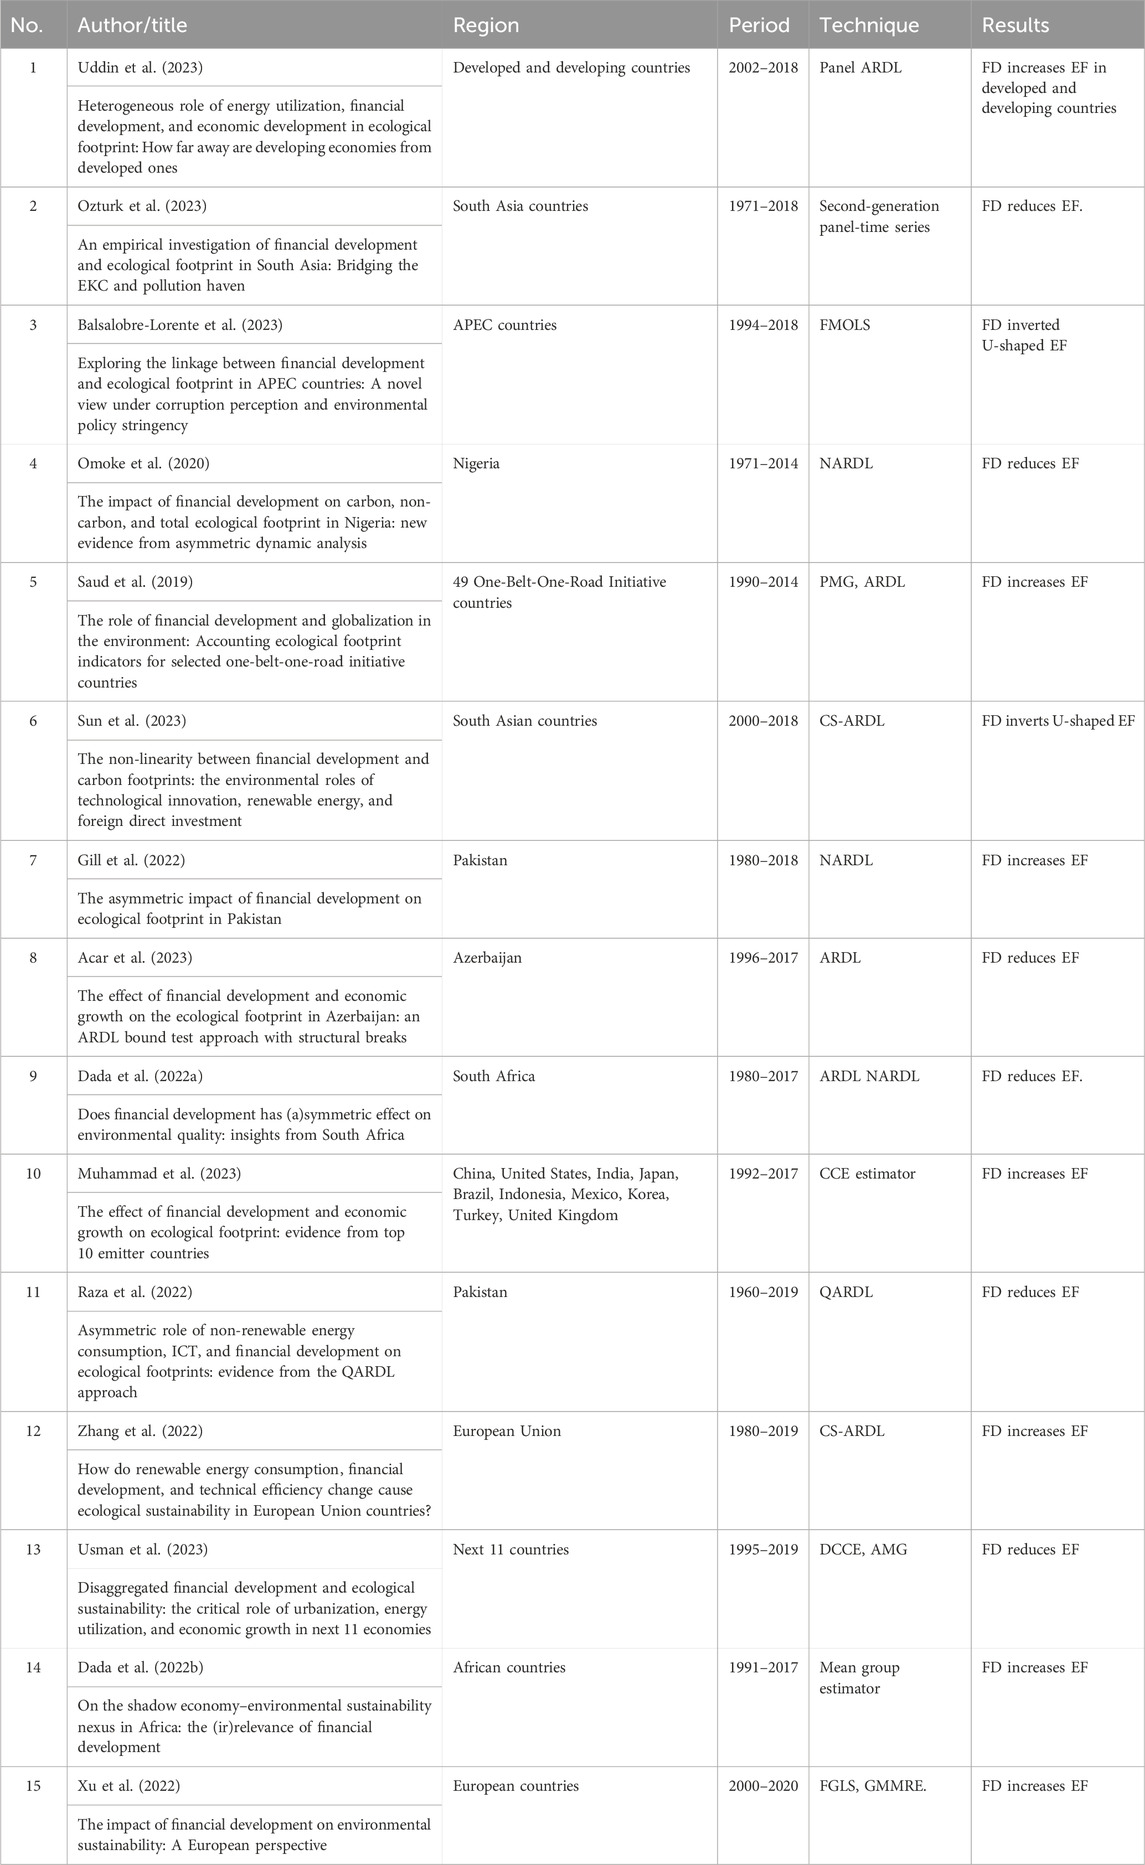
Table 1. Summary of empirical literature.
2.2 FD worsens EF
The first set of studies suggests a positive correlation between FD and EF (Adams and Klobodu, 2018; Baloch et al., 2019; Tsaurai, 2019; Godil et al., 2020; Dada et al., 2022c; Ju et al., 2023). Tsaurai (2019) assessed the influence of FD on CO2 in West African nations employing the panel data method from 2003 to 2014. One of the conclusions centres on the pooled ordinary least squares (OLS) method whereby the local credit supplied by the financial sector led to the rise of CO2. The impact of natural resources, FD, and economic success on the EF of Malaysia from 1980 to 2019 was evaluated by Khan et al., 2021. That study adopted a dynamic simulated auto-regressive distribution lag method to find that FD, economic prosperity, and natural resources are behind the rise in EF. Reaching a similar conclusion, Dada et al. (2022c) examined the link between FD and EF in Malaysia between 1981 and 2017, utilising ARDL, fully modified OLS (FMOLS), dynamic OLS (DOLS), and canonical cointegration regression (CCR). They found that FD leads to a long-term deterioration of EF. Cross-country research by Adams and Klobodu (2018) examined 26 African countries for 1985 to 2011, utilizing the chow test, cross-country regression, and generalized method of moments (GMM) to discover that FD propels environmental degradation.
2.3 FD improves EF
The second collection of studies drew on claims that FD promotes EF (Shahbaz et al., 2013; Majeed and Mazhar, 2019; Zaidi et al., 2019; Odhiambo, 2020; Zhao and Yang, 2020; Adebayo et al., 2021; Akinsola et al., 2021; Kihombo et al., 2021; Hussain et al., 2022; Acar et al., 2023; Wang et al., 2023). Shahbaz et al. (2013) explored the effect of FD, economic prosperity, coal utilization, and trade liberalization on environmental performance in South Africa by employing ADRL bound test time sequence data for 1965–2008. They revealed that an upsurge of economic prosperity led to a rise in energy discharge, while FD lessened it. Habiba and Xinbang (2022) evaluated the stimulus of FD on CO2 for advanced and emerging economies by considering a multivariate measure of FD, FM, and FI indices for 2000–2018. Their study employed two-stage GMM and panel data regression to reveal that FM indices reduce EF for both advanced and emerging economies, whereas FI exacerbates EF. Arogundade, Hassan & Bila (2022) explored the influence of the dispersion proceeds on the EF of 22 African nations using fixed effects, fixed effects instrumental variables, method of moments quantile regression, and the heterogenous Granger causality test. Some of their findings confirmed that FD has a remarkable influence in reducing the environmental deterioration impact of dispersion proceeds.
Majeed and Mazhar (2019) assessed the effect of FD on the environment by utilizing an inclusive measure of EF for 131 nations for 1971–2017. A panel data method was employed, including DK standard errors and GMM. They discovered that FD proxies (local lending toward private sector, local lending to private sector by banks, and local lending supplied by financial sectors) play a critical function in enhancing environmental quality. Furthermore, their analysis revealed that local lending to the private sector is more robust when likened to former proxies of FD. Lastly, Wang et al. (2023) assessed the impact of clean energies, advanced technology industries, and the financial boom on the EFs of developed and emerging economies for 1990–2020. They used the GMM and panel quantile regression; their results suggest that FD improves EF in both types of economy.
2.4 Nonlinear influence of FD on EF
The last group of studies produced mixed results when assessing the connection between FD and EF (Ashraf et al., 2022; Destek and Sarkodie, 2019; Saud et al., 2019. Saud et al. (2019) explored the influence of FD and globalization on the EF of 49 designated BRI nations for 1990–2014 using pooled means group long-term panel estimations. They found that EF increased because FD increased energy utilization, economic prosperity, and commerce in 30 nations. Inversely, FD decreased EF in 14 nations. Destek and Sarkodie (2019) examined the environmental Kuznet curve for EF in 11 newly industrialised economies over 1977–2013 using the heterogeneous panel causality technique and the augmented mean group. The findings confirmed that FD reduced EF only in China, Malaysia, and Singapore.
Although many of the above studies (Shahbaz et al., 2013; Adams and Klobodu, 2018; Baloch et al., 2019; Destek and Sarkodie, 2019; Majeed and Mazhar, 2019; Nathaniel et al., 2019; Saud et al., 2019; Tsaurai, 2019; Zaidi et al., 2019; Odhiambo, 2020; Shahbaz et al., 2020; Zhao and Yang, 2020; Adebayo et al., 2021; Akinsola et al., 2021; Khan et al., 2021; Kihombo et al., 2021; Yang et al., 2021; Dada et al., 2022b; Hussain et al., 2022; Acar et al., 2023; Hussain et al., 2023; Wang et al., 2023) analyzed the linear relationship between FD and the EF, very few studied the asymmetric nexus between these variables (Gill et al., 2022; Godil et al., 2020; Karasoy, 2019; Lahiani, 2019; Ling et al., 2021; Mensah and Abdul-Mumuni, 2022; Omoke et al., 2020; Shahbaz et al., 2016). The NARDL methodology eases the assumption of linearity and advocates for asymmetry among the measured variables (Shin et al., 2011). Other related empirical studies that have employed NARDL include the work of Omoke et al. (2020) in Nigeria, Lahiani, (2019) in China, Karasoy (2019) in Turkey, Gill et al. (2022) in Pakistan, and Mensah and Abdul-Mumuni (2022) in sub-Saharan Africa.
What emerges from the above literature review is that the findings on the finance–emission nexus have not yet converged, posing great difficulties in formulating a consistent environmental management policy for all countries. Part of the reason why these findings have not yet converged is that they assume a linear association between FD and emissions and use different sets of proxies and techniques for environmental quality and FD, thereby validating the need for a more nuanced account of the effect of FD on environmental quality. While this study is not the first to evaluate the asymmetrical influence of FD on environmental quality in emerging economies, the limitation of existing investigations (Lahiani, 2019; Tsaurai, 2019; Habiba and Xinbang, 2022; Hussain et al., 2022; Manigandan et al., 2022; Wu et al., 2022; Hussain et al., 2023; Ofori et al., 2023; Qalati et al., 2023; Raihan, 2023) is that they rely heavily on CO2 emissions, which only account for air pollution but not problems for water, soil, and other aspects of the environment. Moreover, some of these studies also rely on traditional measures of FD, thereby ignoring multifaceted measures of FD which allow for aspects like depth, access, and efficiency across financial institutions and markets.
Considering this gap, this study advances the literature by examining a comprehensive measure of FD and disaggregates it into its sub-indices to provide a nuanced analysis, helping the reader to appreciate how components of FD affect EF. Second, this study used ARDL for the linear effects and NARDL for non-linear effects of FD to produce robust policy suggestions. In bridging these gaps, this empirical work aims to add to the present body of knowledge by raising the following questions: 1) Is the FD-EF nexus asymmetric in South Africa? 2) Does the disaggregated FD (FM and FI) have the same impact on EF?
3 Methodology
This section covers the technique that was employed to establish both the short- and long-term influence of FD on EF in South Africa. It contains data and variables, model specification, and estimation methods.
3.1 Data and variables
This research utilized 38-year time-series dataset for 1980–2018. The rationale for using this timeframe is that 1980 marks the beginning of numerous variables for South Africa while 2018 was chosen as the end of the period due to the unavailability of data for some variables. EF presented as the dependent variable denoting “ecological footprint” (constant per capita) and assessed by means of a consumer-based method and measured in global hectares (gha) per capita (See Table 2). The core explanatory variables were financial market, financial institution development indices, and overall financial development (FM, FI, and FD) established by the International Monetary Fund (2019). The justification for this index is that it accounts for the complex multifaceted nature of financial development which traditional measures do not consider. The other control variables were chosen because they have been commonly used as covariates in preceding studies. We controlled for gross domestic product per capita—GDP divided by population (constant 2010 US$)—and ENUSE—energy use per capita (measured in kg of oil equivalent per capita) —following Adebayo et al. (2021), Arogundade et al. (2022), Nathaniel et al. (2019), Omoke et al. (2020), and Shabhaz et al. (2013). To obtain dependable results, all proxies were converted into natural logarithms in order to reduce variability and make data move closer to normal distribution. The EF variable is obtained from global footprint network (GFN), financial development from the International Monetary Fund (IMF), and gross domestic product per capita and energy use from the World Development Indicators.
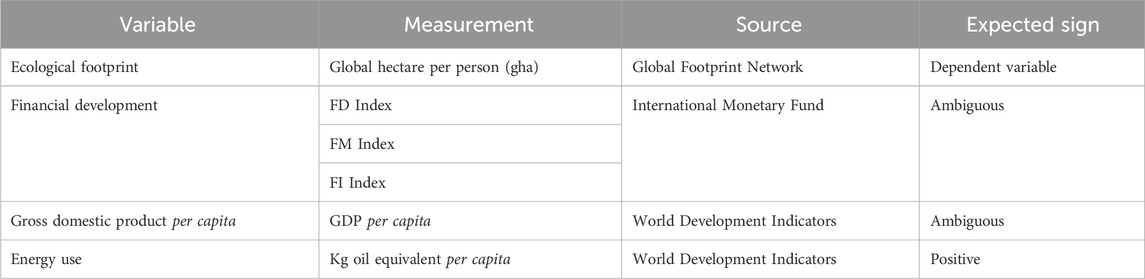
Table 2. Summary of variables.
The main intent of this research was to assess the asymmetric effect of FD on EF in South Africa. Several studies have used FD as the proxy for evaluating its influence on EF (Shabhaz et al., 2013; Nathaniel et al., 2019; Kihombo et al., 2021; Gill et al., 2022; Wu et al., 2022). The relationship between FD, FM, FI, GDP, ENUSE, and EF is presented in the following functional form.
3.2 Model specifications
Equation 1 regresses EF on the aggregated measure of FD, which combines FM and FI. Eqs 1a and 1b regress EF on the unbundled measure of FD (FM and FI).
In this case, EF depicts the ecological footprint in time t, FD represents financial development in that time, GDPPC denotes GDP per capita, and ENEUSE shows energy use.
Equation 2 has the advantage of providing a combination of short- and long-term estimates in the same equation. In addition, ARDL estimates can be utilized even if the integration order is I (1), I (0), or a mix of both. The coefficients along with
Furthermore, the research assessed the non-linear influence of FD on the EF to determine whether positive and negative shocks have the same impact. The study employed the non-linear ARDL econometric structure recommended by Shin et al. (2014). This methodology assesses the asymmetric effect which shows a combination of positive and negative shocks of the respective variable(s). The NARDL methodology has been extensively used in environmental economics (Omoke et al., 2020; Das and McFarlane, 2021; Ling et al., 2021; Dada et al., 2022c; Biyase and Naidoo, 2023). Moreover, a nonlinear auto regressive distributed lag model was chosen over other econometric methods since the former can capture the multifaceted, nonlinear relationships which are regularly detected in time-series data, thereby yielding a true picture of real-world dynamics compared to simple linear models. It can also cope with various econometric problems such as asymmetries and structural breaks, allowing the robust analysis of economic data.
In this study, FD was the core explanatory variable disaggregated into a positive and negative shock. The functional form is as follows:
Eqs 3, 4 demonstrate variables in partial sum, while Eq. 5 considers NARDL. To signify the NARDL equation, two partial variables are replaced in Eq. 2, resulting in Eq. 5 below.
The study conducted diagnostic tests which ascertained the validity of the coefficients used, and furthermore determined whether the models are favourable for interpretation. The Breusch–Godfrey test was used to detect autocorrelation in the regression models. A normality test was conducted using Jarque–Bera. The BDS test was carried out to validate the non-linearity attributes of all variables. Furthermore, CUSUM and CUSUMSQ tests were performed to determine the stability of coefficient stability. Lastly, for robustness, this paper also adopted the fully modified ordinary least squares (FMOLS), dynamic OLS (DOLS), and canonical cointegrating regression (CCR).
4 Empirical analysis
4.1 Data and descriptive statistics
The descriptive statistics given in Table 3 above show that most of the proxies used in this study—EF, FI, and FD index—were relatively stable, which is shown by the values of the standard deviations, which are close to 0. However, GDP demonstrates a higher variability since the standard deviations are distant from 0.
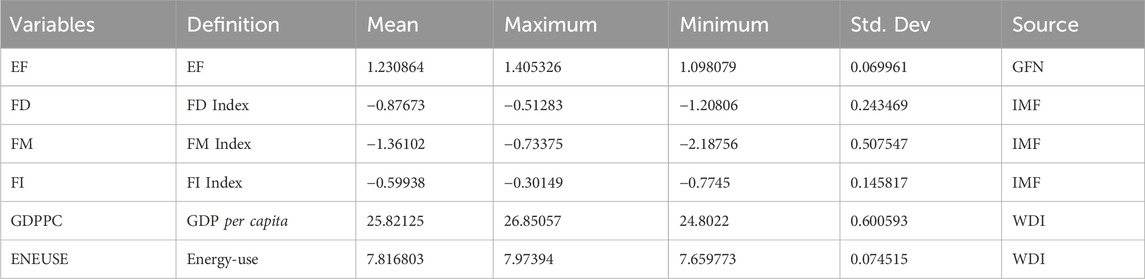
Table 3. Definition of variables and descriptive statistics.
4.2 Unit roots tests
The research performed some pre-estimation tests which were necessary to make the estimations possible and the results dependable. The ADF and Phillips Parron tests were employed to check for stationarity. The null hypothesis for the tests was that there is a unit, meaning that the series is non-stationary against the alternative hypothesis that the variable is stationary. As a rule of thumb, a null hypothesis is rejected when the test statistic is above the critical values at 10%, 5%, and 1%. Table 4 summaries the test results conducted.
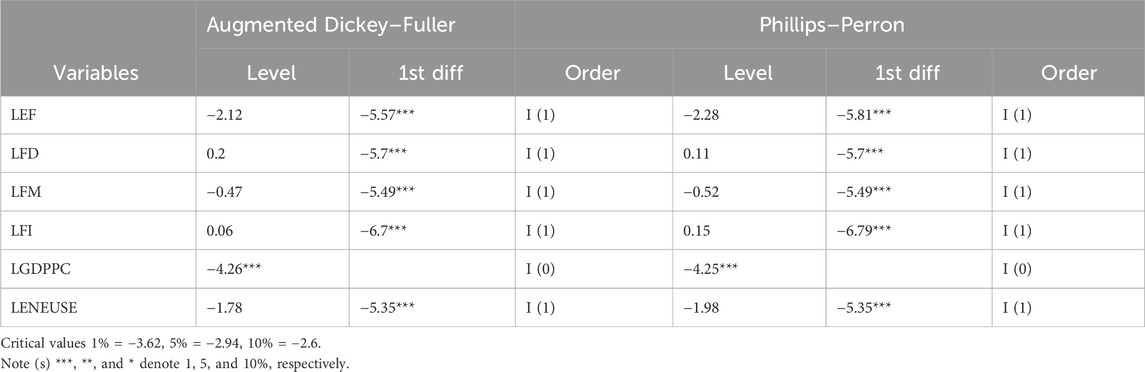
Table 4. Unit root tests.
The outcomes of both tests are in harmony, ascertaining that the series in the study are both I (0) and I (1) variables. Moreover, the null hypothesis of the unit root was not rejected because all variables except GDPCC are stationary at level, and stationary variables become stationary after the first difference. The results of the unit root test validate the adoption of the ARDL model, as no variable is beyond I (1).
4.3 ARDL and NARDL bound test for cointegration
Table 5 depicts the F-statistics and findings of the diagnostic tests of the model specifications for assessing the impact of FD, GDP, and energy use on EF. Three specifications concerning linear ARDL bounds tests were undertaken in this study. The outcomes for all models reveal that the F-statistics for the models are significantly larger than the upper bound. Consequently, these findings point to the rejection of the null hypothesis and acceptance of the alternative, according to which there is a long-term correlation between EF, FD, FM, FI, GDP per capita, and energy use in South Africa.
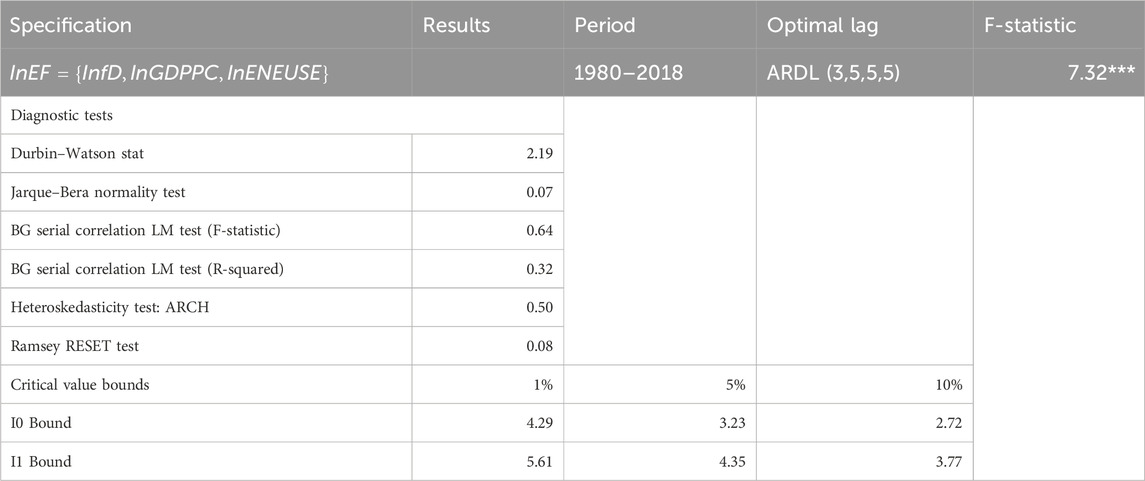
Table 5. FD index–Results of ARDL cointegration test.
Table 5 also exhibits outcomes of the diagnostic tests, demonstrating that the model has successfully passed all the tests: Durbin–Watson stat, Jarque–Bera normality test, BG serial correlation LM test (F-statistic), BG serial correlation LM test (R-squared), heteroskedasticity test: (ARCH), and Ramsey RESET test.
The non-linear ARDL F-statistics (Table 6) were also found to be higher than the upper bounds at all levels (1%, 5%, and 10%), indicating that there is a long-term relationship between EF, FD, FM, FI, and GDP per capita, including energy use in South Africa. To ascertain the linearity of the parameters, the study utilized the BDS test initiated by Broock et al. (1996) to capture non-linearity. The results for the BDS test are shown in Table 7 in the appendix, demonstrating that the variables have nonlinearities. These results allow us to employ non-linear ARDL to examine the relationship between financial development and ecological footprint.
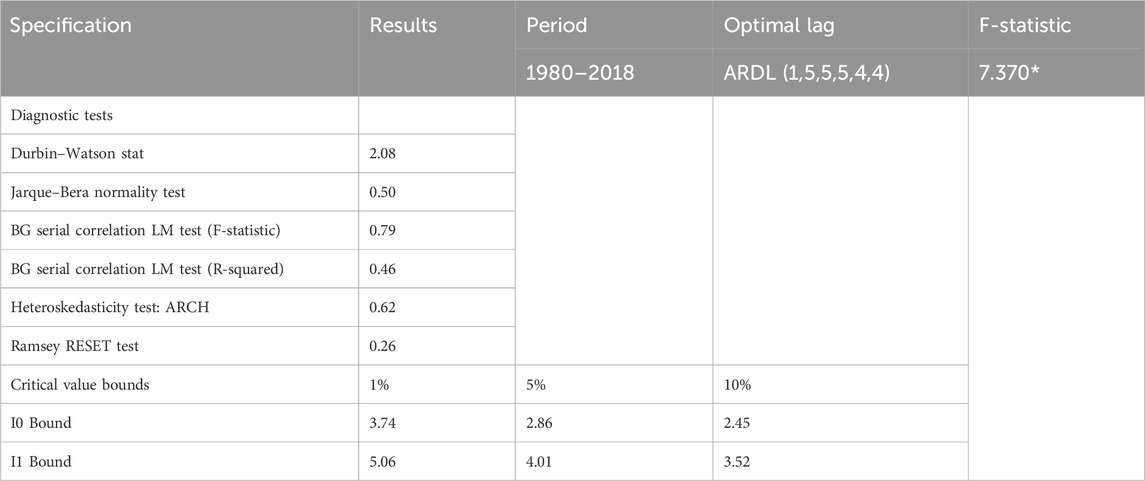
Table 6. FD index–Results of non-linear ARDL cointegration test.
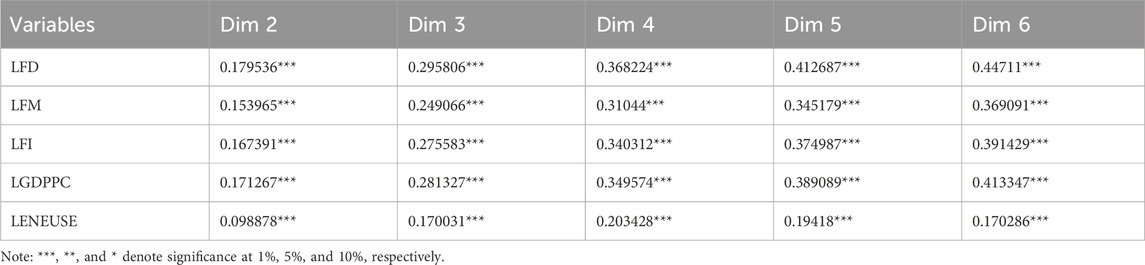
Table 7. BDS statistics test–asymmetry (FD, FM, and FI).
4.4 ADRL and NARDL long and short run results
4.4.1 NARDL long and short run results
The cointegration examination confirmed that the series under study do in fact have a long-term correlation, which then leads to the goal of the analysis: presenting the empirical results on the effect of FD, economic growth, and energy-use on EF. Three estimated ARDL models are shown in Table 8 (Models 1–3). Model 1 shows the estimates of the influence of the FD index on EF, accounting for control variables. Model 2 is the regression of EF on the FM index and the other control variables, while Model 3 expresses EF as the dependent variable, and the FI index as the independent variable of interest and the other variables—gross domestic product per capita and energy-use as regressors.
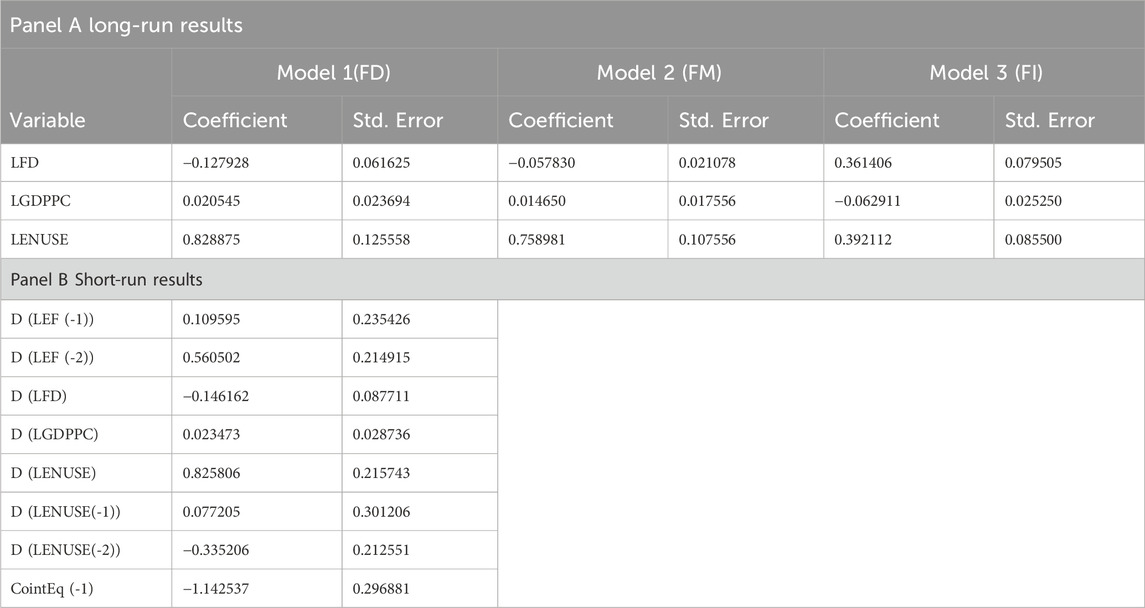
Table 8. ADRL long- and short-run results.
Model 1 of Table 8 shows that the slope coefficient of the FD index is negative (LFD = −0.12) and statistically significant at 5% level; thus, holding other variables constant, FD will promote environmental quality. This result supports the ecological modernization theory, which suggests that the transition to a contemporary way of life results in an awareness of environmental protection and the adoption of efficient and clean energy use. As FD advances in different forms, one of which lends incentive for projects that are environmentally friendly, EF will improve. This outcome is also backed by the empirical literature of Majeed and Mazhar (2019) and Hussain et al. (2022), who discovered that FD helps improve environmental quality by reducing EF. Furthermore, their findings affirm the role of green finance in managing environmental pollution. When controlling for the GDP per capita coefficient, the study found it to be positive and statistically insignificant in the long run, which is coherent with Baz et al. (2020) who found a neutral effect for GDP on environmental quality. The energy-use coefficient was found to be positive and statistically at 1% level, which was expected. This result implies that a unit rise in energy use is associated with degrading environmental quality by 0.82%. This outcome confirms Boutabba (2014), who discovered that energy use has a positive long-term connection with CO2 in India. However, this does not support Nathaniel et al. (2019), who found that energy use has a negative relationship with FD in South Africa. The findings in Panel B indicate that ECT of 1.14 is negative and significant, showing that 114% of the long-term disequilibrium is recovered in a year.
Model 2 of Table 8 shows that the slope coefficient of FM is negative (LFM = −0.05) and statistically significant at 5% level. This suggests that, by holding other variables constant, FM will promote environmental quality. GDP again yields an insignificant positive impact on EF. Like Model 1 of Table 8, the energy-use coefficient depicts a positive sign and is statistically significant at 1% level, suggesting that a unit increase in energy use is linked with deteriorating environmental quality by 0.75%, aligning with many other studies in this field (Majeed and Mazhar, 2019; Rjoub et al., 2021) that established that energy use has a positive relationship with EF. Model 3 of Table 8 depicts that the slope coefficient of FI is positive (LFI = −0.36) and statistically supported at a 5% level. This suggests that, by holding other variables constant, FM will deteriorate environmental quality. At a 1% level, GDP has a negative considerable influence on EF. These findings confirmed the conclusions of other studies, such as Destek and Sarkodie, (2019), that found evidence to suggest that real GDP contributes to reducing the EF in Turkey, South Korea, India, Thailand, and China, thus improving environmental quality. Lastly, the energy-use coefficient is positive at 0.40% and statistically significant in the long-term, backing up Omoke et al. (2020).
4.4.2 NARDL long- and short-term results
We now proceed to consider whether financial development has a nonlinear effect on ecological footprint, employing the non-linear ARDL model. Table 9 demonstrates NARDL and long- and short-term estimates of the effect of FD on EF. Like the ARDL estimates, we present three estimated NARDL models in Table 9 (Models 1–3). Model 1 shows the estimates of the influence of the FD index on EF, accounting for control variables. Model 2 is the regression of EF on the FM index and the other control variables, while Model 3 expresses EF as the dependent variable, and the FI index as the independent variable of interest and the other variables—gross domestic product per capita, and energy-use—as regressors. Model 1 shows that the long-term asymmetric impact of FD rising LFD_POS on EF is −0.802,825 and significant at 10% level, consistent with Odugbesan and Adebayo (2020) and Mensah and Abdul-Mumuni (2022) for Ghana. The potential explanation for this is that FD facilitates the availability of credit and encourages the consumption of environmentally friendly goods, thus creating more sustainability for current and future generations. It was also found that the decreasing LFD_NEG on EF is −5.473893, entering the model significantly at a 10% level. This discovery is also compatible with Mensah and Abdul-Mumuni (2022) for Ghana. The explanation is that a reduction in FD can lead to a reduction in production scale, ultimately resulting in decreased carbon emissions (Mensah and Abdul-Mumuni, 2022). These results support previous similar findings for nearby nations such as Nigeria, signifying a rather wider applicability of the association between FD and EF in the Southern African Development Community. More importantly, they point to the significance of endorsing environmentally friendly business practices and regulating undertakings that are not environment friendly. The potential limitation in the analysis is that the study overlooked other related aspects that affect the association between FD and EF, including institutional variables, government policies, and technological innovation.
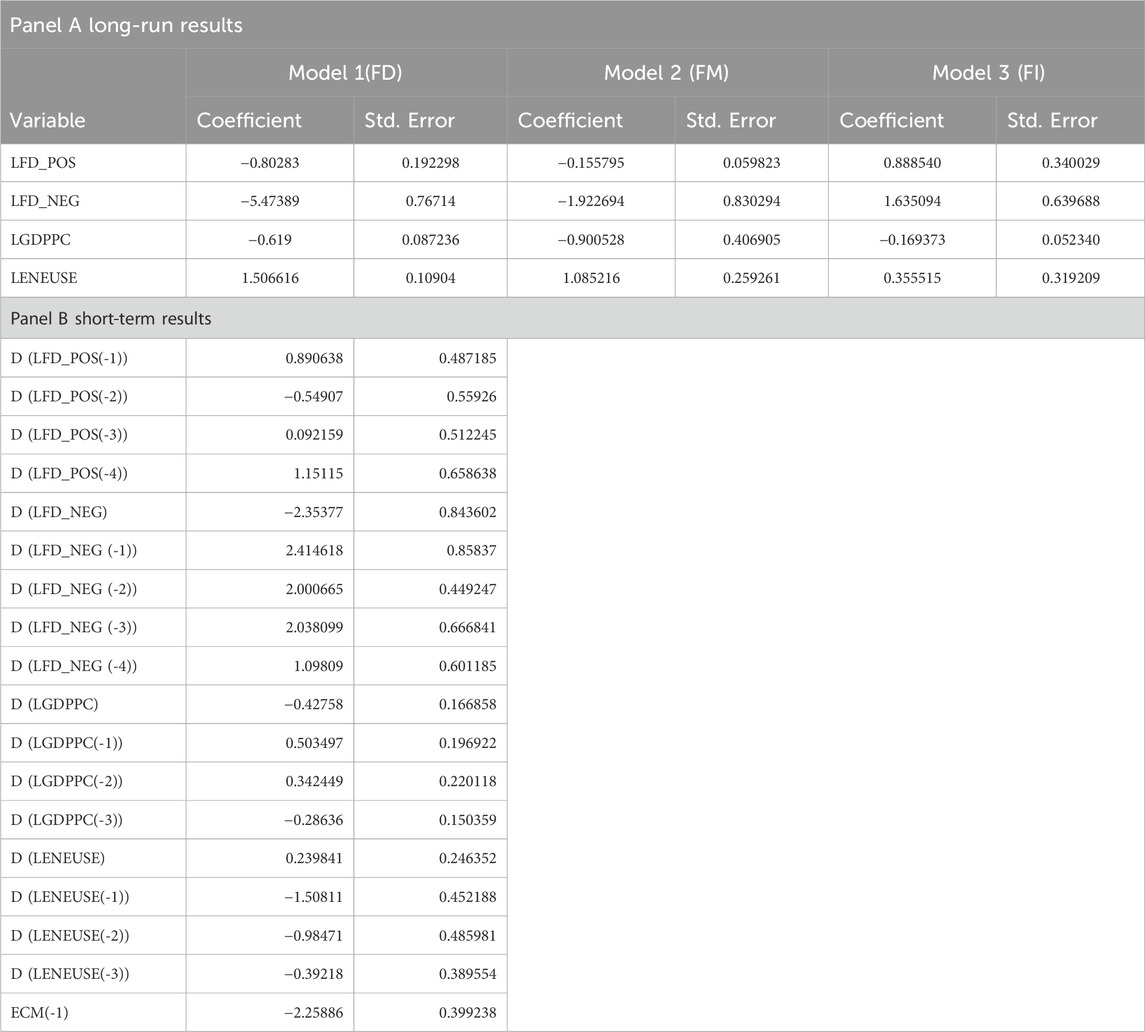
Table 9. NARDL long- and short-run results (FD index).
As for the control variables, it was found that the GDP per capita coefficient is negative and statistically significant at a 1% level. The energy-use coefficient was positive and statistically significant at 1%, suggesting that a unit rise in energy use is linked with degrading environmental quality by 1.5%. This is consistent with Sheraz et al., (2021) and Saqib et al. (2023), who revealed that energy use discourages environmental quality. Panel B reflects that the ECM coefficient is −2.26 and statistically supported at 5%, suggesting that the system modifies to balance at a speed of 226%.
Model 2 of Table 9 presents the influence of FM on EF and shows that the coefficients of a positive and negative shock of FM are negative and statistically supported at a 5% level of significance. There is difference in the magnitude of influence: a negative shock possesses a greater negative impact of a −1.92% coefficient compared to a positive shock of −0.15%. A one-unit rise in GDP per capita will promote environmental quality by −0.90%, suggesting that GDP per capita has a negative relationship with environmental quality, agreeing with Arogundade et al. (2022). In addition, the energy-use coefficient depicts a positive and statistically supported outcome at a 1% level, which recommends that a unit rise in energy use is associated with degrading environmental quality by 1.08%; the finding is compatible with Baloch et al. (2019) and Odugbesan and Adebayo (2020).
Model 3 of Table 9 reports the impact of FI on EF and demonstrates that the findings of both the positive and negative shock of FI are statistically significant and positive at a 5% level. Both shocks hold an identical positive influence on environmental quality; this suggests that both shocks will dampen environmental quality in the long run. This finding is coherent with Habiba and Xinbang (2022), who examined the influence of comprehensive FD, FI, and FM, including their indices on CO2 emissions for advanced and emerging nations. FI was found to have a positive relationship with CO2 emissions in emerging nations. This could be explained by the fact that financial institutions tend to make more capital available for production activities instead of technical advances in developing economies (Chang 2015; Acheampong 2019). In contrast to Uche and Effiom’s (2021), a one-unit rise in GDP per capita has a negative coefficient of 0.16%. Lastly, the energy use coefficient is positive and statistically insignificant.
4.4.3 Robustness checks
As a robustness check of the ARDL estimates, the dynamic DOLS, FMOLS, and CCR were adopted (Table 10). Reassuringly, the results for all three models and the coefficient signs are similar for all estimated variables—FD index, FM, and FI—except for the control variable of GDP per capita, where the coefficient is positive and statistically significant for FD and FM across all tests. This implies that GDP per capita exacerbates environmental quality in South Africa. Lastly, the energy-use results are consistent across all models; in the same way, the coefficient slope is negatively and positively statistically significant, suggesting that energy-use has a detrimental effect on environmental quality.
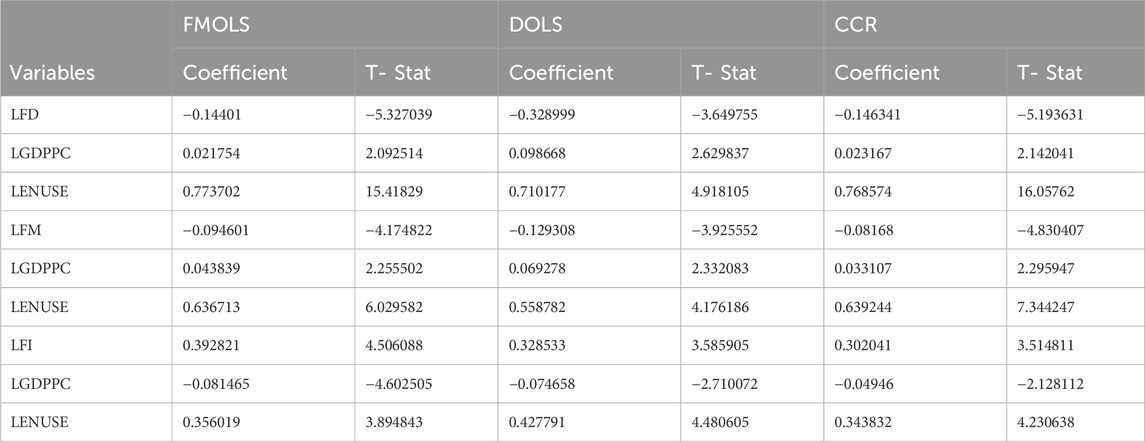
Table 10. FMOLS, DOLS, and CCR.
The cumulative sums (CUSUM) of recursive and cumulative squares plots of the ARDL and NARDL regression show that the models are stable since they are all within the 95% confidence interval in Figures 1, 2.
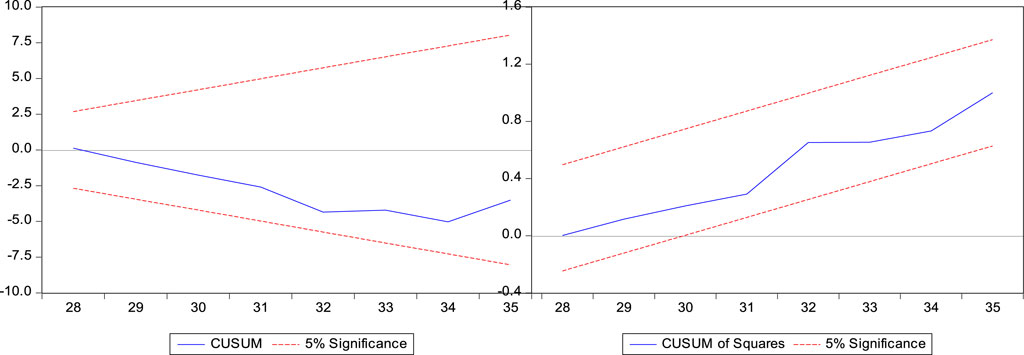
Figure 1. ARDL Cusum tests.
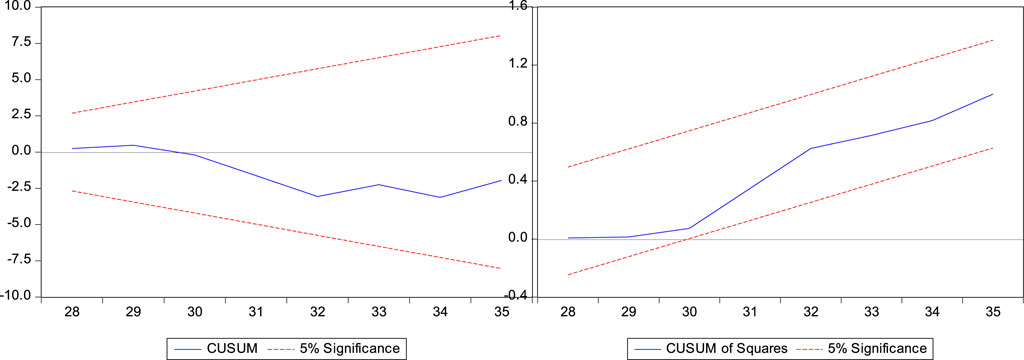
Figure 2. NARDL Cusum tests.
4.4.4 Dynamic multiplier graph
The dynamic multiplier indicates that asymmetry is trending around the mean of all three models in Figure 3. The variation of FD is more stable, suggesting that the negative shock responds more to environmental degradation than the positive shock. This trend is consistent with the results for both long-term positive and negative shocks, in which the negative shock coefficient is higher than the positive.
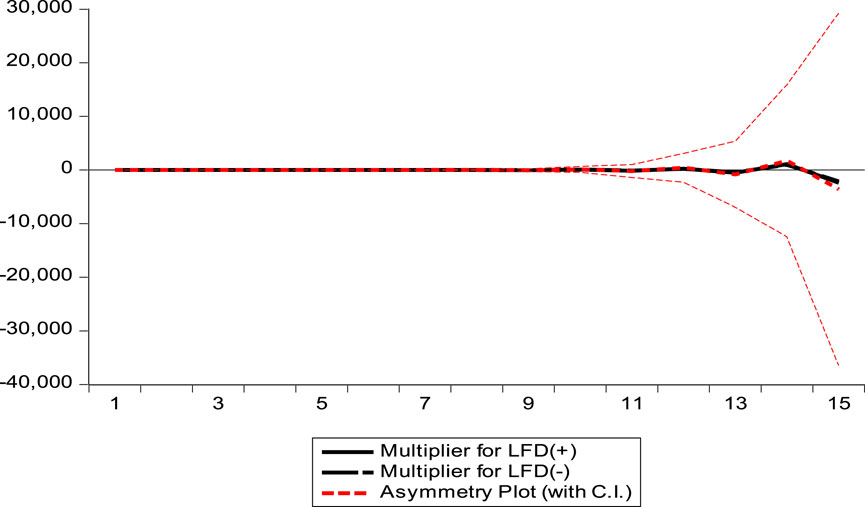
Figure 3. Multiplier graph.
5 Conclusion and policy implications
This study was envisioned to evaluate the symmetric and asymmetric impact of FD on EF. The latest measure of FD and its sub-indices (FM and FI) was adopted, which differentiates this study from previous studies that relied on the overall or traditional measures of FD. Environmental quality is measured using the comprehensive EF, in contrast to most earlier literature which only employed one ecological indicator, such as CO2. Lastly, this study controlled annually for GDP and energy use over 1980–2018. In the methodology, ARDL and the NARDL were utilized to discover whether a symmetric and asymmetric association exists between these two variables.
According to the study findings, the long-run symmetric model’s practical findings show that FD and FM generally enhance environmental quality. In contrast, FI degrades environmental quality. The possible justification for this is that FD facilitates the availability of credit and encourages the consumption and production of environmentally friendly goods, thus creating a more sustainable future for current and future generations.
The asymmetric results suggest that both positive and negative shocks reduce EF. This may be due to a reduction of FD instigating a reduction in the production and consumption scale, ultimately resulting in decreased carbon emissions (Mensah and Abdul-Mumuni, 2022). As for the control variables, the GDP per capita coefficient was negative and statistically significant at a 1% level of significance. Finally, the energy-use coefficient was positive and statistically significant at 1%, suggesting that a unit rise in energy use is linked with degrading environmental quality. FM on the EF showed that the coefficients of positive and negative shocks are negative and statistically supported. This outcome proposes that FM supports environmental quality. A one-unit rise in GDP per capita will promote environmental quality by −0.90%. In addition, the energy-use coefficient outcome suggests that a unit rise in energy use is associated with degrading environmental quality. FI on the EF indicated that the positive and negative shock outcome is statistically supported and positive at a 5% level. This implies that both shocks will have a long-term negative impact on environmental quality. A unit rise in GDP per capita will promote environmental quality.
These findings possess significant policy implications, as FM and FI project contrasting relationships with EF, which measures environmental quality. FI positive and negative shocks deteriorate environmental quality, whereas FM positive and negative shocks favor environmental quality. This could be due to the corporate social investment (CSI) reports of firms or companies, environment standards, and information of business day-to-day operations being available to FI (banks and insurance companies) but are not required for FM (investors and portfolio managers). This demonstrates an information imbalance between FI and FM. A consistent process of disseminating information about firms’ or companies’ environmental impact prior to deciding on an investment may alert FM to a deleterious effect on environmental quality. Another discovery from the results is that FI have been allocating more funding to projects that do not promote environmental quality, although they have environmental impact reports of firms or companies. This could be attributed to relaxed or no punitive measures for violating environmental quality.
The study makes theoretical contributions by advancing our understanding of the relationship between financial development and environmental sustainability, exploring asymmetric effects and suggesting avenues for future research and policy interventions. Practical policy implications emanating from the results are the following. 1) FD is an important variable for reducing ecological damage in South Africa. 2) A uniform approach should be adopted by FI and FM for vetting the environmental impact of firms prior to investing or allocating capital. 3) Government should introduce regulations for FD to allocate a percentage of yield toward the research and development of clean energy solutions. This research contains some shortcomings that may be addressed in forthcoming studies. A potential limitation in the analysis is that the study overlooked other related aspects that affect the association between FD and EF, including institutional variables, government policies, and technological innovation. Thus, future research may consider incorporating the interactive term(s) such as institutional and social variables in analyzing the association between FD and the EF.
Data availability statement
The data used for this article will be made available by the authors, without undue reservation.
Author contributions
MB: conceptualization, supervision, validation, writing–review and editing, data curation, formal analysis, methodology, software, and visualization. SK: writing–original draft, conceptualization, formal analysis, methodology, project administration, resources, and software.
Funding
The author(s) declare that no financial support was received for the research, authorship, and/or publication of this article.
Conflict of interest
The authors declare that the research was conducted in the absence of any commercial or financial relationships that could be construed as a potential conflict of interest.
Publisher’s note
All claims expressed in this article are solely those of the authors and do not necessarily represent those of their affiliated organizations, or those of the publisher, the editors, and the reviewers. Any product that may be evaluated in this article, or claim that may be made by its manufacturer, is not guaranteed or endorsed by the publisher.
References
Acar, S., Altıntaş, N., and Haziyev, V. (2023). The effect of financial development and economic growth on ecological footprint in Azerbaijan: an ARDL bound test approach with structural breaks. Environ. Ecol. Statistics 30, 41–59. doi:10.1007/s10651-022-00551-6
Adams, S., and Klobodu, E. K. M. (2018). Financial development and environmental degradation: does political regime matter? J. Clean. Prod. 197, 1472–1479. doi:10.1016/j.jclepro.2018.06.252
Adebayo, T. S., Aga, S., and Kartal, M. T. (2023). Analyzing the co-movement between CO2 emissions and disaggregated nonrenewable and renewable energy consumption in BRICS: evidence through the lens of wavelet coherence. Environ. Sci. Pollut. Res. 30 (13), 38921–38938. doi:10.1007/s11356-022-24707-w
Adebayo, T. S., Kirikkaleli, D., Adeshola, I., Oluwajana, D., Akinsola, G. D., and Osemeahon, O. S. (2021). Coal consumption and environmental sustainability in South Africa: the role of financial development and globalization. Int. J. Renew. Energy Dev. 10 (3), 527–536. doi:10.14710/ijred.2021.34982
Afshan, S., and Yaqoob, T. (2022). The potency of eco-innovation, natural resource and financial development on ecological footprint: a quantile-ARDL-based evidence from China. Environ. Sci. Pollut. Res. 29, 50675–50685. doi:10.1007/s11356-022-19471-w
Ahmad, M., Ahmed, Z., Yang, X., Hussain, N., and Sinha, A. (2021). FD and environmental degradation: do human capital and institutional quality make a difference? Gondwana Res. 105, 299–310. doi:10.1016/j.gr.2021.09.012
Akinsola, G. D., Awosusi, A. A., Kirikkaleli, D., Umarbeyli, S., Adeshola, I., and Adebayo, T. S. (2021). Ecological footprint, public-private partnership investment in energy, and financial development in Brazil: a gradual shift causality approach. Environ. Sci. Pollut. Res. 29 (7), 10077–10090. doi:10.1007/s11356-021-15791-5
Ali, H. S., Law, S. H., Lin, W. L., Yusop, Z., Chin, L., and Bare, U. A. A. (2018). Financial development and carbon dioxide emissions in Nigeria: evidence from the ARDL bounds approach. GeoJournal 84 (3), 641–655. doi:10.1007/s10708-018-9880-5
Arogundade, S., Hassan, A. S., and Bila, S. (2022). Diaspora income, financial development and EF in Africa. Int. J. Sustain. Dev. World Ecol., 1–15. doi:10.1080/13504509.2022.2036855
Ashraf, A., Nguyen, C. P., and Doytch, N. (2022). The impact of financial development on ecological footprints of nations. J. Environ. Manag. 322, 116062. doi:10.1016/j.jenvman.2022.116062
Awosusi, A. A., Xulu, N. G., Ahmadi, M., Rjoub, H., Altuntaş, M., Uhunamure, S. E., et al. (2022). The sustainable environment in Uruguay: the roles of financial development, natural resources, and trade globalization. Front. Environ. Sci. 10. doi:10.3389/fenvs.2022.875577
Baloch, M. A., Zhang, J., Iqbal, K., and Iqbal, Z. (2019). The effect of financial development on ecological footprint in BRI countries: evidence from panel data estimation. Environ. Sci. Pollut. Res. 26 (6), 6199–6208. doi:10.1007/s11356-018-3992-9
Balsalobre-Lorente, D., Emre, E. T., Nur, T., and Evcimen, C. (2023). Exploring the linkage between financial development and ecological footprint in APEC countries: a novel view under corruption perception and environmental policy stringency. J. Clean. Prod. 414, 137686. doi:10.1016/j.jclepro.2023.137686
Bank of International Settlements (BIS) (2012). Address by the governor of the South Africa reserve bank 1997 on financial sector reforms and their implication for the banking industry in South Africa. Available from http://www.bis.org/ (Accessed May 29, 2023).
Baz, K., Xu, D., Ali, H., Ali, I., Khan, I., Khan, M. M., et al. (2020). Asymmetric impact of energy consumption and economic growth on ecological footprint: using asymmetric and nonlinear approach. Sci. Total Environ. 718, 137364. doi:10.1016/j.scitotenv.2020.137364
Bekun, F. V. (2023). Race to carbon neutrality in South Africa: what role does environmental technological innovation play? Appl. Energy 354, 122212. doi:10.1016/j.apenergy.2023.122212
Bekun, F. V., Emir, F., and Sarkodie, S. A. (2019). Another look at the relationship between energy consumption, carbon dioxide emissions, and economic growth in South Africa. Sci. Total Environ. 655, 759–765. doi:10.1016/j.scitotenv.2018.11.271
Biyase, M., and Naidoo, Y. (2023). The symmetric and asymmetric effect of remittances on financial development: evidence from South Africa. Int. J. Financial Stud. 11 (1), 26. doi:10.3390/ijfs11010026
Boutabba, M. A. (2014). The impact of financial development, income, energy and trade on carbon emissions: evidence from the Indian economy. Econ. Model. 40, 33–41. doi:10.1016/j.econmod.2014.03.005
Bowa, K. C., Mwanza, M., Sumbwanyambe, M., Ulgen, K., and Pretorius, J. H. (2019). “Comparative sustainability assessment of electricity industries in SADC region: the role of renewable energy in regional and national energy diversification,” in 2019 IEEE 2nd International Conference on Renewable Energy and Power Engineering (REPE), Toronto, ON, Canada, November, 2019. doi:10.1109/repe48501.2019.9025134
Cil, N. (2022). Re-examination of pollution haven hypothesis for Turkey with Fourier approach. Environ. Sci. Pollut. Res. 30, 10024–10036. doi:10.1007/s11356-022-22800-8
Dada, J. T., Adeiza, A., Ismail, N. A., and Arnaut, M. (2022a). Financial development–ecological footprint nexus in Malaysia: the role of institutions. Manag. Environ. Qual. Int. J. 33, 913–937. doi:10.1108/meq-10-2021-0251
Dada, J. T., Ajide, F. M., Arnaut, M., and Adeiza, A. (2022b). On the shadow economy-environmental sustainability nexus in Africa: the (ir)relevance of financial development. Int. J. Sustain. Dev. World Ecol. 30 (1), 6–20. doi:10.1080/13504509.2022.2115576
Dada, J. T., Ojeyinka, T. A., and Al-Faryan, M. A. S. (2022c). Does financial development has (a)symmetric effect on environmental quality: insights from South Africa. J. Econ. Stud. 50, 1130–1157. doi:10.1108/jes-06-2022-0352
Das, A., and McFarlane, A. (2021). Non-linear relationship between remittances and financial development in Jamaica. Int. Migr. 60, 242–260. doi:10.1111/imig.12911
Destek, M. A., and Sarkodie, S. A. (2019). Investigation of environmental Kuznets curve for ecological footprint: the role of energy and financial development. Sci. Total Environ. 650, 2483–2489. doi:10.1016/j.scitotenv.2018.10.017
Gill, A. R., Riaz, R., and Ali, M. (2022). The asymmetric impact of financial development on ecological footprint in Pakistan. Environ. Sci. Pollut. Res. 30, 30755–30765. doi:10.1007/s11356-022-24384-9
Global Footprint Network (2018). National footprint accounts. Accessed https://data.footprintnetwork.org/#.
Global Footprint Network (2022). National footprint accounts. Accessed https://data.footprintnetwork.org/#.
Godil, D. I., Sharif, A., Rafique, S., and Jermsittiparsert, K. (2020). The asymmetric effect of tourism, financial development, and globalization on ecological footprint in Turkey. Environ. Sci. Pollut. Res. 27 (32), 40109–40120. doi:10.1007/s11356-020-09937-0
Habiba, U., and Xinbang, C. (2022). The impact of financial development on CO2 emissions: new evidence from developed and emerging countries. Environ. Sci. Pollut. Res. 29, 31453–31466. doi:10.1007/s11356-022-18533-3
Healy, P. M., and Palepu, K. (2001). Information asymmetry, corporate disclosure and the capital markets: a review of the empirical disclosure literature. SSRN Electron. J., doi:10.2139/ssrn.258514
Hussain, M., Wang, W., and Wang, Y. (2022). Natural resources, consumer prices and financial development in China: measures to control carbon emissions and ecological footprints. Resour. Policy 78, 102880. doi:10.1016/j.resourpol.2022.102880
Hussain, S., Gul, R., Ullah, S., Waheed, A., and Naeem, M. (2023). Empirical nexus between financial inclusion and carbon emissions: evidence from heterogeneous financial economies and regions. Heliyon 9 (3), e13164. doi:10.1016/j.heliyon.2023.e13164
Ilesanmi, K. D., and Tewari, D. D. (2019). Management of shadow banks for economic and financial stability in South Africa. Cogent Econ. Finance 7 (1), 1568849. doi:10.1080/23322039.2019.1568849
International Monetary Fund (2019). FD index database. Washington (DC, USA): IMF. Accessed https://www.imf.org/en/Publications/WP/Issues/2016/12/31/Introducing-a-New.
Ju, S., Andriamahery, A., Qamruzzaman, Md., and Kor, S. (2023). Effects of financial development, FDI and good governance on environmental degradation in the Arab nation: dose technological innovation matters? Front. Environ. Sci. 11. doi:10.3389/fenvs.2023.1094976
Karasoy, A. (2019). Drivers of carbon emissions in Turkey: considering asymmetric impacts. Environ. Sci. Pollut. Res. 26 (9), 9219–9231. doi:10.1007/s11356-019-04354-4
Khan, M. K., Abbas, F., Godil, D. I., Sharif, A., Ahmed, Z., and Anser, M. K. (2021). Moving towards sustainability: how do natural resources, financial development, and economic growth interact with the EF in Malaysia? A dynamic ARDL approach. Environ. Sci. Pollut. Res. 28 (39), 55579–55591. doi:10.1007/s11356-021-14686-9
Kihombo, S., Vaseer, A. I., Ahmed, Z., Chen, S., Kirikkaleli, D., and Adebayo, T. S. (2021). Is there a tradeoff between financial globalization, economic growth, and environmental sustainability? An advanced panel analysis. Environ. Sci. Pollut. Res. 29 (3), 3983–3993. doi:10.1007/s11356-021-15878-z
Lahiani, A. (2019). Is FD good for the environment? An asymmetric analysis with CO2 emissions in China. Environ. Sci. Pollut. Res. 27 (8), 7901–7909. doi:10.1007/s11356-019-07467-y
Li, R., Wang, X., and Wang, Q. (2022). Does renewable energy reduce EF at the expense of economic growth? An empirical analysis of 120 countries. J. Clean. Prod. 346, 131207. doi:10.1016/j.jclepro.2022.131207
Ling, G., Razzaq, A., Guo, Y., Fatima, T., and Shahzad, F. (2021). Asymmetric and time-varying linkages between carbon emissions, globalization, natural resources and financial development in China. Environ. Dev. Sustain. 24, 6702–6730. doi:10.1007/s10668-021-01724-2
Majeed, M. T., and Mazhar, M. (2019). Financial development and EF: a global panel data analysis. Pak. J. Commer. Soc. Sci. (PJCSS) 13 (2), 487–514. Available at: http://hdl.handle.net/10419/201002 (Accessed July 12, 2023).
Manigandan, P., Alam, M. S., Alagirisamy, K., Pachiyappan, D., Murshed, M., and Mahmood, H. (2022). Realizing the Sustainable Development Goals through technological innovation: juxtaposing the economic and environmental effects of financial development and energy use. Environ. Sci. Pollut. Res. 30, 8239–8256. doi:10.1007/s11356-022-22692-8
Mensah, B. D., and Abdul-Mumuni, A. (2022). Asymmetric effect of remittances and financial development on carbon emissions in sub-Saharan Africa: an application of panel NARDL approach. Int. J. Energy Sect. Manag. 17, 865–886. doi:10.1108/ijesm-03-2022-0016
Muhammad, S., Doğan, M., Akkuş, H. T., and Gürsoy, S. (2023). The effect of financial development and economic growth on ecological footprint: evidence from top 10 emitter countries. Environ. Sci. Pollut. Res. 30 (29), 73518–73533. doi:10.1007/s11356-023-27573-2
Nathaniel, S., Nwodo, O., Adediran, A., Sharma, G., Shah, M., and Adeleye, N. (2019). Ecological footprint, urbanization, and energy consumption in South Africa: including the excluded. Environ. Sci. Pollut. Res. 26 (26), 27168–27179. doi:10.1007/s11356-019-05924-2
Odhiambo, N. M. (2020). Financial development, income inequality and carbon emissions in sub-Saharan African countries: a panel data analysis. Energy Explor. Exploitation 38 (5), 1914–1931. doi:10.1177/0144598720941999
Odugbesan, J. A., and Adebayo, T. S. (2020). The symmetrical and asymmetrical effects of foreign direct investment and financial development on carbon emission: evidence from Nigeria. SN Appl. Sci. 2 (12), 1982. doi:10.1007/s42452-020-03817-5
Ofori, E. K., Onifade, S. T., Ali, E. B., Alola, A. A., and Zhang, J. (2023). Achieving carbon neutrality in post COP26 in BRICS, MINT, and G7 economies: the role of financial development and governance indicators. J. Clean. Prod. 387, 135853. doi:10.1016/j.jclepro.2023.135853
Omoke, P. C., Nwani, C., Effiong, E. L., Evbuomwan, O. O., and Emenekwe, C. C. (2020). The impact of financial development on carbon, non-carbon, and total ecological footprint in Nigeria: new evidence from asymmetric dynamic analysis. Environ. Sci. Pollut. Res. 27 (17), 21628–21646. doi:10.1007/s11356-020-08382-3
Ozturk, I., Farooq, S., Majeed, M. T., and Skare, M. (2023). An empirical investigation of financial development and ecological footprint in South Asia: bridging the EKC and pollution haven hypotheses. Geosci. Front., 101588. doi:10.1016/j.gsf.2023.101588
Pepper, M., Jackson, T., and Uzzell, D. (2009). An examination of the values that motivate socially conscious and frugal consumer behaviours. Int. J. Consumer Stud. 33 (2), 126–136. doi:10.1111/j.1470-6431.2009.00753.x
Pesaran, M., Shin, Y., and Smith, R. J. (2001). Bounds testing approaches to the analysis of level relationships. J. Appl. Econ. 16, 289–326. doi:10.1002/jae.616
Qalati, S. A., Kumari, S., Tajeddini, K., Bajaj, N. K., and Ali, R. (2023). Innocent devils: the varying impacts of trade, renewable energy and financial development on environmental damage: nonlinearly exploring the disparity between developed and developing nations. J. Clean. Prod. 386, 135729. doi:10.1016/j.jclepro.2022.135729
Raihan, A. (2023). Nexus between economic growth, natural resources rents, trade globalization, financial development, and carbon emissions toward environmental sustainability in Uruguay. Electron. J. Educ. Soc. Econ. Technol. 4 (2), 55–65. doi:10.33122/ejeset.v4i2.102
Raza, S. A., Qamar, S., and Ahmed, M. (2022). Asymmetric role of non-renewable energy consumption, ICT, and financial development on ecological footprints: evidence from QARDL approach. Environ. Sci. Pollut. Res. 30, 20746–20764. doi:10.1007/s11356-022-23549-w
Rjoub, H., Odugbesan, J. A., Adebayo, T. S., and Wong, W. K. (2021). Sustainability of the moderating role of financial development in the determinants of environmental degradation: evidence from Turkey. Sustainability 13 (4), 1844. doi:10.3390/su13041844
Saqib, N., Ozturk, I., Usman, M., Sharif, A., and Razzaq, A. (2023). Pollution haven or halo? How European countries leverage FDI, energy, and human capital to alleviate their EF. Gondwana Res. 116, 136–148. doi:10.1016/j.gr.2022.12.018
Saud, S., Chen, S., Haseeb, A., and Sumayya, (2019). The role of financial development and globalization in the environment: accounting ecological footprint indicators for selected one-belt-one-road initiative countries. J. Clean. Prod. 250, 119518. doi:10.1016/j.jclepro.2019.119518
Sethi, P., Chakrabarti, D., and Bhattacharjee, S. (2020). Globalization, financial development and economic growth: perils on the environmental sustainability of an emerging economy. J. Policy Model. 42 (3), 520–535. doi:10.1016/j.jpolmod.2020.01.007
Sgqolana, T. (2021). The burning season: wildfires sweeping across South Africa and Namibia have left devastation in their wake. Dly. Maverick. Available at: https://www.dailymaverick.co.za/article/2021-10-04-the-burning-season-wildfires-sweeping-across-south-africa-and-namibia-have-left-devastation-in-their-wake (Accessed August 13, 2022).
Shabhaz, M., Kumar Tiwari, A., and Nasir, M. (2013). The effects of financial development, economic growth, coal consumption and trade openness on CO2 emissions in South Africa. Energy Policy 61, 1452–1459. doi:10.1016/j.enpol.2013.07.006
Shahbaz, M., Haouas, I., Sohag, K., and Ozturk, I. (2020). The financial development-environmental degradation nexus in the United Arab Emirates: the importance of growth, globalization and structural breaks. Environ. Sci. Pollut. Res. 27 (10), 10685–10699. doi:10.1007/s11356-019-07085-8
Shahbaz, M., Shahzad, S. J. H., Ahmad, N., and Alam, S. (2016). Financial development and environmental quality: the way forward. Energy Policy 98, 353–364. doi:10.1016/j.enpol.2016.09.002
Shahzad, S. J. H., Kumar, R. R., Zakaria, M., and Hurr, M. (2017). Carbon emission, energy consumption, trade openness and financial development in Pakistan: a revisit. Renew. Sustain. Energy Rev. 70, 185–192. doi:10.1016/j.rser.2016.11.042
Sheraz, M., Deyi, X., Ahmed, J., Ullah, S., and Ullah, A. (2021). Moderating the effect of globalization on financial development, energy consumption, human capital, and carbon emissions: evidence from G20 countries. Environ. Sci. Pollut. Res. 28 (26), 35126–35144. doi:10.1007/s11356-021-13116-0
Shin, Y., Yu, B., and Greenwood-Nimmo, M. (2011). Modelling asymmetric cointegration and dynamic multipliers in a nonlinear ARDL framework. SSRN Electron. J., doi:10.2139/ssrn.1807745
Shin, Y., Yu, B., and Greenwood-Nimmo, M. (2014). “Modelling asymmetric cointegration and dynamic multipliers in a nonlinear ARDL framework,” in Festschrift in honor of peter schmidt (New York, NY: Springer), 281–314.
Statistics South Africa (Stats SAa) (2018). Economy edges up by 0.80% 2018. Pretoria: Statistics South Africa.
Statistics South Africa (Stats SAb) (2018). Mid-year population estimates 2018. Pretoria: Statistics South Africa.
Sun, Y., Al-Tal, R. M., Siddik, A. B., Khan, S., Murshed, M., and Alvarado, R. (2023). The non-linearity between financial development and carbon footprints: the environmental roles of technological innovation, renewable energy, and foreign direct investment. Econ. Research-Ekonomska Istraživanja 36 (2). doi:10.1080/1331677x.2023.2174153
Tsaurai, K. (2019). The impact of financial development on carbon emissions in Africa. Int. J. Energy Econ. Policy 9 (3), 144–153. doi:10.32479/ijeep.7073
Uche, E., and Effiom, L. (2021). Financial development and environmental sustainability in Nigeria: fresh insights from multiple threshold nonlinear ARDL model. Environ. Sci. Pollut. Res. 28, 39524–39539. doi:10.1007/s11356-021-12843-8
Uddin, I., Ullah, A., Saqib, N., Rakhshanda, K., and Usman, M. (2023). Heterogeneous role of energy utilization, financial development, and economic development in ecological footprint: how far away are developing economies from developed ones. Environ. Sci. Pollut. Res. 30 (20), 58378–58398. doi:10.1007/s11356-023-26584-3
UNFCCC, 2022, UNFCCC sharm el-sheikh climate change conference - november 2022 .https://unfccc.int/cop27#:∼:text=UNFCCC%20Nav&text=At%20the%20Sharm%20el%2DSheikh,Sharm%20el%2DSheikh%2C%20Egypt. (Accessed 8 January 2023)
United Nations Environment Programme (UNEP) (2011). Towards a green economy: pathways to sustainable development and poverty eradication—a synthesis for policy makers. St-Martin-Bellevue. U. N. Environ. Programme.
Usman, M., Chughtai, S., Rashid, A., and Khan, N. A. (2023). Disaggregated financial development and ecological sustainability: the critical role of urbanization, energy utilization, and economic growth in next 11 economies. Environ. Dev. Sustain., doi:10.1007/s10668-023-03368-w
Wang, Z., Chen, H., and Teng, Y. P. (2023). Role of greener energies, high tech-industries and financial expansion for ecological footprints: implications from sustainable development perspective. Renew. Energy 202, 1424–1435. doi:10.1016/j.renene.2022.12.039
World Bank (2022). World development indicators. Washington DC: World Bank. Accessed https://data.worldbank.org/indicator/SP.POP.TOTL?locations=ZA.
Wu, L., Adebayo, T. S., Yue, X.-G., and Umut, A. (2022). The role of renewable energy consumption and financial development in environmental sustainability: implications for the Nordic Countries. Int. J. Sustain. Dev. World Ecol. 30 (1), 21–36. doi:10.1080/13504509.2022.2115577
Xu, B., Li, S., Afzal, A., Mirza, N., and Zhang, M. (2022). The impact of financial development on environmental sustainability: a European perspective. Resour. Policy 78, 102814. doi:10.1016/j.resourpol.2022.102814
Yang, B., Jahanger, A., and Ali, M. (2021). Remittance inflows affect the EF in BICS countries: do technological innovation and financial development matter? Environ. Sci. Pollut. Res. 28, 23482–23500. doi:10.1007/s11356-021-12400-3
Zaidi, S. A. H., Zafar, M. W., Shahbaz, M., and Hou, F. (2019). Dynamic linkages between globalization, financial development and carbon emissions: evidence from Asia Pacific Economic Cooperation countries. J. Clean. Prod. 228, 533–543. doi:10.1016/j.jclepro.2019.04.210
Zhang, Z., Ullah, S., Zhan, S., and Irfan, M. (2022). How do renewable energy consumption, financial development, and technical efficiency change cause ecological sustainability in European Union countries? Energy & Environ. 34, 2478–2496. 0958305X2211099–0958305X2211099. doi:10.1177/0958305x221109949
Keywords: financial development, ecological footprint, asymmetric, financial markets, NARDL
Citation: Khoza S and Biyase M (2024) The symmetric and asymmetric effect of financial development on ecological footprint in South Africa: ARDL and NARDL approach. Front. Environ. Sci. 12:1347977. doi: 10.3389/fenvs.2024.1347977
Received: 01 December 2023; Accepted: 15 March 2024;
Published: 24 April 2024.
Edited by:
Zhen Liu, Nanjing Normal University, ChinaReviewed by:
Cüneyt Dumrul, Erciyes University, TürkiyeAbdul Majeed, Huanggang Normal University, China
Copyright © 2024 Khoza and Biyase. This is an open-access article distributed under the terms of the Creative Commons Attribution License (CC BY). The use, distribution or reproduction in other forums is permitted, provided the original author(s) and the copyright owner(s) are credited and that the original publication in this journal is cited, in accordance with accepted academic practice. No use, distribution or reproduction is permitted which does not comply with these terms.
*Correspondence: Mduduzi Biyase, bWJpeWFzZUB1ai5hYy56YQ==