 Xia Li
 Yongjie Pan
 Cailing Zhao2
- 1Key Laboratory of Land Surface Process and Climate Change in Cold and Arid Regions, Northwest Institute of Eco-Environment and Resources, Chinese Academy of Sciences, Lanzhou, China
- 2Institute of Arid Meteorology, China Meteorological Administration, Lanzhou, China
Introduction: Terrestrial evapotranspiration (ET) over the Tibetan Plateau (TP) has important implications for the global water cycle, climate change, and ecosystem, and its changes and driving factors have drawn increasing attention. Previous research studies have minimally quantified the effects and identified the pathways of the influencing factors on ET over different land surface types.
Methods: In this study, we analyze the spatiotemporal distribution and variation of ET over the TP in 1982–2014 based on multiple datasets. Furthermore, the effects of each influencing factor on ET are quantified over different land surface types, and the major influencing factors and their affecting pathways are identified using structure equation modeling (SEM), which is a statistical method used to analyze relationships among multiple variables.
Results: The results show that the climatology of ET decreases gradually from southeastern to northwestern TP, with the maximum spatial averaged value of 379.979 ± 0.417 mm a−1 for the fifth generation of European Reanalysis (ERA5) and the minimum of 249.899 ± 0.469 mm a−1 for the Global Land Data Assimilation System (GLDAS). The most significant differences among the ET datasets mainly occur in the summer. The annual ET averaged over the TP presents an increased trend from 1982 to 2014, as shown by all of the ET datasets. However, there are larger discrepancies in the spatial distribution of the increased trend for these datasets. The assessment result shows that the 0.05° land evapotranspiration dataset for the Qinghai–Tibet Plateau (LEDQTP) has the highest temporal correlation coefficient (0.80) and the smallest root-mean-square error (23.50 mm) compared to the observations. Based on LEDQTP, we find that precipitation is the main influencing factor of ET, which primarily affects ET through direct pathways in bare soil and grassland regions, with standardized estimates of 0.521 and 0.606, respectively. However, in meadow and shrub and forest regions, the primary factor influencing ET is air temperature, which is primarily affected by an indirect pathway through a vapor pressure deficit. Air temperature is also the controlling factor in sparse vegetation regions, but it affects ET through a direct pathway.
Discussion: This study may provide some new useful information on the effects of climate change on ET in different land cover types over the TP.
1 Introduction
Evapotranspiration (ET) refers to the turbulent flux of water vapor from the land surface into the atmosphere, involving soil evaporation, interception from the canopy, and transpiration through plant stomata (Chen et al., 2021). It is a key linkage between the water and energy cycle processes of the land surface (Zhang et al., 2016; Lian et al., 2018; Wang et al., 2021). More than 60% of precipitation (Pre) falling on the land surface is consumed by ET per year (Pan et al., 2020). Additionally, ET plays a vital role in modulating regional and global weather and climate (Han et al., 2021). Therefore, it is of great significance to investigate the spatiotemporal characteristics of ET and its response to environmental changes, especially in regions that are most sensitive and vulnerable to climate changes, including the Tibetan Plateau (TP).
The TP is the birthplace of Asia’s major rivers, famous as the “Water Tower of Asia,” which plays a crucial role in the energy and water cycles of Asia (Immerzeel et al., 2010; Yao et al., 2012). Over the past decades, the TP has undergone significant warming (Yao et al., 2019), wind stilling (Li et al., 2018; Zhang and Wang, 2020), wetting (Sun et al., 2020), and vegetation greening (Li et al., 2018). Under these climatic and environmental changes, ET has also changed significantly (Lal et al., 2023). The difference between Pre and ET over the TP determines the availability of freshwater for over two billion people downstream (Ma and Zhang, 2022). Therefore, it is crucial to clarify the changes and mechanisms of ET over the TP to not only understand the impact of the TP on weather and climate (He et al., 2019; Wang et al., 2020) but also to map sustainable water resource strategies and establish appropriate ecoregions for Asia (Ndehedehe et al., 2018; Wang et al., 2021).
The ET characteristics of the TP have gained increasing attention worldwide in recent years. Studies have indicated that the annual ET in the southeastern region of the TP was larger than that in the northwestern region, with a variable spatial average ranging from 294.21 mm a−1 to 377 mm a−1 (Zhang et al., 2017; Wang et al., 2020; Ma and Zhang, 2022; Zhang et al., 2022). As for the ET trend, some studies reported that the average ET over the TP showed an increasing trend in recent decades (Zhang et al., 2018; Cui et al., 2019). However, there were significant regional differences in the spatial distribution of the ET trend among different studies. Cui et al. (2019) presented that the increased ET trend mainly occurred in the Ali, Lhasa Valley, and Haibei areas, while the decreased ET trend mainly occurred in the southern TP Valley. According to other studies, the most substantially increased ET trend occurred in the southeastern TP, particularly in the forest and alpine meadow regions (Lin et al., 2021; Zhang et al., 2022). However, some other studies even reported that the domain-averaged ET decreased slightly over the TP (Han et al., 2021). These discrepancies may be due to differences in the datasets or study periods used. Therefore, the selection of the appropriate dataset based on observations is crucial for studying the characteristics of ET over the TP.
Identifying the primary drivers of ET and the mechanisms that influence it will aid in comprehending its response to climate change. Several studies have investigated the factors that impact ET on the TP. It has been found that air temperature (Ta) and surface net radiation (Rn) were important factors influencing the temporal variations in ET over the TP (Wang et al., 2020). Ma and Zhang (2022) showed that precipitation was the main driver regulating ET trends across most of the TP. Additionally, they found significant spatial differences in the main influencing factors affecting ET. Zou et al. (2018) demonstrated a significant correlation between ET and Rn and Ta in the Nagqu River basin in the TP. According to Lin et al. (2021), the controlling factor of ET in the humid areas of the TP was available energy, while in arid areas, energy and water factors together dominated the ET changes. Song et al. (2017) noted the importance of the leaf-area index in ET changes in moist regions. The TP exhibits a unique geography, with a distinct climate gradient from the northwest to the southeast. Additionally, its surface is heterogeneous. Therefore, it was understandable that the characteristics of ET and its main influencing factors varied in different regions across the TP, as reported by previous studies. It is important to note that the land cover types on the TP are also diverse, including bare soil, grassland, meadows, and forests, from the northwestern to the southeastern regions (Figure 1). To formulate appropriate ecological and environmental protection policies for each land cover type and rationalize water resource usage, it is crucial to understand the variation of ET and the primary influencing factors and mechanisms in each land cover type. Previous studies have extensively examined the spatiotemporal characteristics of ET and its main influencing factors. However, limited research has been conducted on the primary influencing pathway and quantifying the impacts of the influencing factors on ET in different land cover types over the TP.
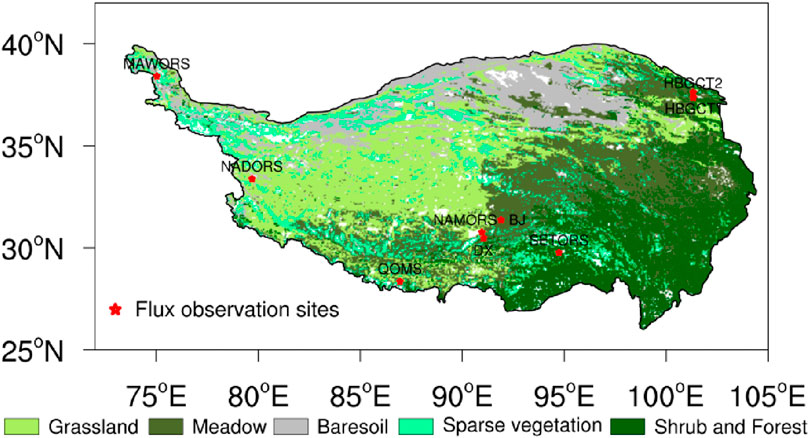
Figure 1. Distribution of the major land cover types over the TP and locations of the nine eddy-covariance observation sites, including the Muztagh Ata Westerly Observation and Research Station, Chinese Academy of Sciences (MAWORS, CAS); the Ngari Desert Observation and Research Station, CAS (NADORS); the BJ site of Nagqu Station of Plateau Climate and Environment, CAS (BJ); the Nam Co Monitoring and Research Station for Multisphere Interactions, CAS (NAMORS); the Qomolangma Atmospheric and Environmental Observation and Research Station, CAS (QOMS); and the Southeast Tibet Observation and Research Station for the Alpine Environment, CAS (SETORS); Dangxiong (DX); Haibei (HBGCT1 and HBGCT2 with different land cover types) stations.
In this study, we analyzed the spatiotemporal characteristics of ET in different land surface types over the TP from 1982 to 2014 based on multiple datasets. Meanwhile, the accuracy of these datasets was evaluated based on observations from nine sites to select one for further analysis. Finally, based on the ET dataset selected from the evaluation, the contribution of each influencing factor to ET was quantified, and the main influencing factors and their impact pathways were identified using structure equation modeling (SEM), which is a statistical method used to study the relationships of multiple variables.
2 Materials and methods
2.1 Materials
2.1.1 ET datasets
The spatial resolutions, temporal resolutions, time periods, and sources of the ET datasets used in this study are summarized in Table 1. The Global Land Evaporation Amsterdam Model (GLEAM) was a set of algorithms that were based on satellite observations and estimated the different parts of ET separately, including transpiration, interception loss, bare soil evaporation, snow sublimation, and open-water evaporation (Miralles et al., 2011; Martens et al., 2017). The basic principle of GLEAM was to retain the effective information from satellite observation to the maximum extent in order to keep the ET data as observation-based as possible (Liu et al., 2021b). Micro-derived soil moisture (SM) was used, and vegetation interception was fully considered, which were the advantages of GLEAM (Pan et al., 2020). Many previous studies have intensively evaluated the GLEAM data and proved their high quality (López et al., 2017; Bai and Liu, 2018).
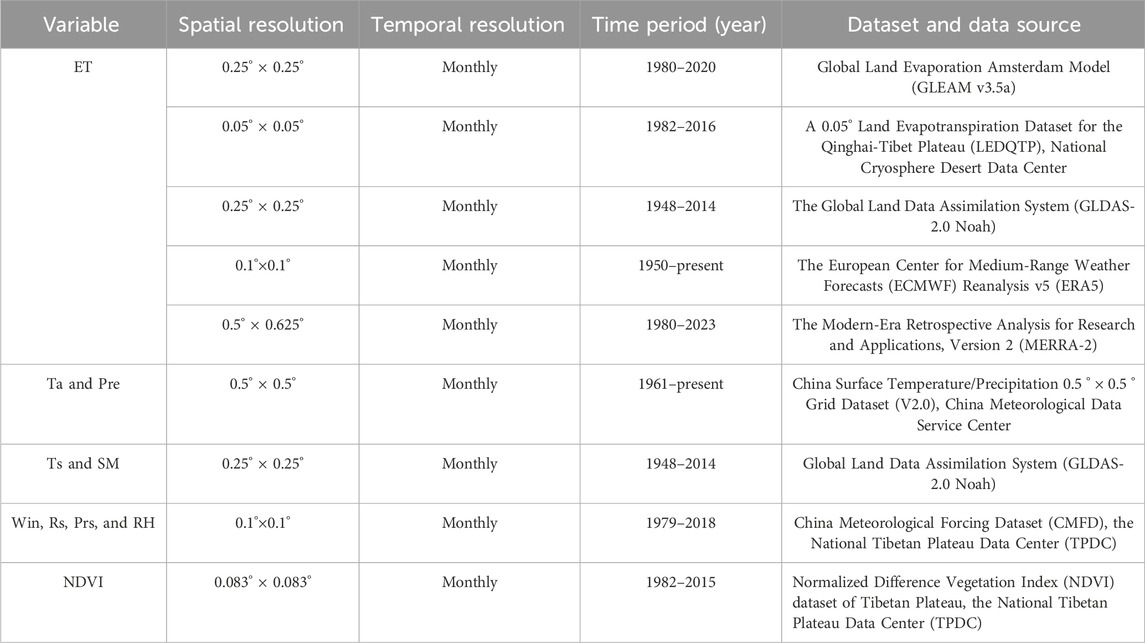
Table 1. Information of the datasets used in the study.
A 0.05° land evapotranspiration dataset for the Qinghai–Tibet Plateau (LEDQTP) was generated using the remote sensing-based water-carbon coupled model PML_V2, which was calibrated and validated by the observed ET and carbon fluxes data from 14 EC stations across the TP. The model forcing data included meteorological variables, leaf-area index from remote sensing, albedo, and emissivity. More detailed information of the dataset was described by Ma and Zhang (2022). The dataset was provided by the National Cryosphere Desert Data Center (http://www.ncdc.ac.cn).
The scientists at the National Oceanic and Atmospheric Administration (NOAA), National Centers for Environmental Prediction (NCEP), and the National Aeronautics and Space Administration (NASA) Goodard Space Flight Center (GSFC) have jointly established the Global Land Data Assimilation System (GLDAS), which provides high-resolution global data through integrating ground-based and satellite-based observations using data assimilation techniques and land surface models (Rodell et al., 2004). Different land surface models, including Mosaic, Noah, CLM, and VIC, were used in GLDAS, with only Noah continuing to be updated until now.
The fifth generation of European Reanalysis (ERA5) was also a widely used dataset globally. Compared to the previous ERA-Interim, ERA5 has upgraded some of its key climatic information and applied the latest version of the Earth system model and data assimilation techniques used at ECMWF. These updates included more sophisticated parameterization of geophysical processes (Hersbach et al., 2020; Lu et al., 2021). Additionally, ERA5 had improvements in both temporal and spatial resolutions and a better balance of global Pre and evaporation (Albergel et al., 2018). The evaluation findings indicated that ERA5 exhibited lower absolute biases in surface latent heat flux compared to ERA-Interim (Martens et al., 2020).
The Modern-Era Retrospective Analysis for Research and Applications, version 2 (MERRA-2), was an improved atmospheric reanalysis dataset and the second version of MERRA. It incorporated a larger volume of satellite data and included new observation types, such as hyperspectral radiation, microwaves, and aerosols. In addition, it integrated satellite and conventional weather observations with simulated atmospheric behavior to achieve the most optimal possible estimation of the Earth’s system state (Gelaro et al., 2017; Lu et al., 2021). Previous research has demonstrated that the mean absolute error of latent heat for MERRA-2 was lower than MERRA (Bosilovich et al., 2015).
2.1.2 Hydrometeorological parameters
The variables that might affect ET are also listed in Table 1. The gridded Ta and Pre datasets were provided by the China Meteorological Data Service Center (http://data.cma.cn/), which were generated through the thin-plate smoothing spline method based on Ta observations from 2,472 stations and Pre observations from 2,416 stations in China. The gridded wind speed (Win), downward shortwave radiation (Rs), relative humidity (RH), and surface pressure (Prs) used to calculate the vapor pressure deficit (VPD) were from the China Meteorological Forcing Dataset (CMFD), which was developed by He et al. (2020) and could be downloaded from the National Tibetan Plateau/Third Pole Environment Data Center (https://www.tpdc.ac.cn/en/). The dataset was created through the fusion of remote sensing products, reanalysis datasets, and in situ observation data at weather stations. A wide range of studies suggested that CMFD presented reasonable consistency with ground-measured meteorological data and was, therefore, a reliable gridded dataset in China (Chen et al., 2011; Sun et al., 2017; Yang et al., 2017; Ma et al., 2019). The land surface temperature (Ts) and SM were from GLDAS-2.0 Noah. The normalized difference vegetation index (NDVI) dataset utilized in this study was accessible at http://data.tpdc.ac.cn and was generated from the NDVI 3 g product based on the GIMMS AVHRR sensor. This product was computed from the reflectance of the infrared and near-infrared channels (Pinzon and Tucker, 2014) and has been proven to have good suitability and reliable accuracy for detecting vegetation changes in the plateau region (Zhao et al., 2021).
2.1.3 Eddy-covariance observed data
The eddy-covariance-observed latent heat flux was widely used by researchers to evaluate ET datasets and validate ET models. Therefore, we also used the observations from nine EC stations to evaluate the ET datasets. The detailed information and geographical location of these sites are shown in Table 2 and Figure 1, respectively. The observations of the BJ site of Nagqu station of the Plateau Climate and Environment (BJ), the Southeast Tibet Observation and Research Station for the Alpine Environment (SETORS), the Nam Co Monitoring and Research Station for Multisphere Interactions (NAMORS), the Qomolangma Atmospheric and Environmental Observation and Research Station (QOMS), the Ngari Desert Observation and Research Station (NADORS), and the Muztagh Ata Westerly Observation and Research Station (MAWORS) sites were downloaded at https://www.scidb.cn/en/. The temporal resolutions of the original data from these six sites were hourly. Therefore, we first processed the hourly data into daily data and then further processed the daily data into monthly data. There were missing values in the downloaded raw data, so we assigned the data of a day as a missing value if the missing values of that day were more than 80% in the generation process of daily data; otherwise, the missing values were ignored. Similarly, during the generation of monthly data, if 80% of the days in a month had missing values, the value for that month was assigned as missing values; otherwise, the missing values were ignored. The more detailed information about the six stations was shown in Ma et al. (2020). In addition, the observations of the Dangxiong (DX) and Haibei (HBGCT1 and HBGCT2) sites were downloaded from the National Ecosystem Science Data Center (http://www.nesdc.org.cn/). The details of the observations were described by Yu et al. (2006). The data from these three sites has already been processed into monthly values provided by the data provider, so we just downloaded and used them directly.
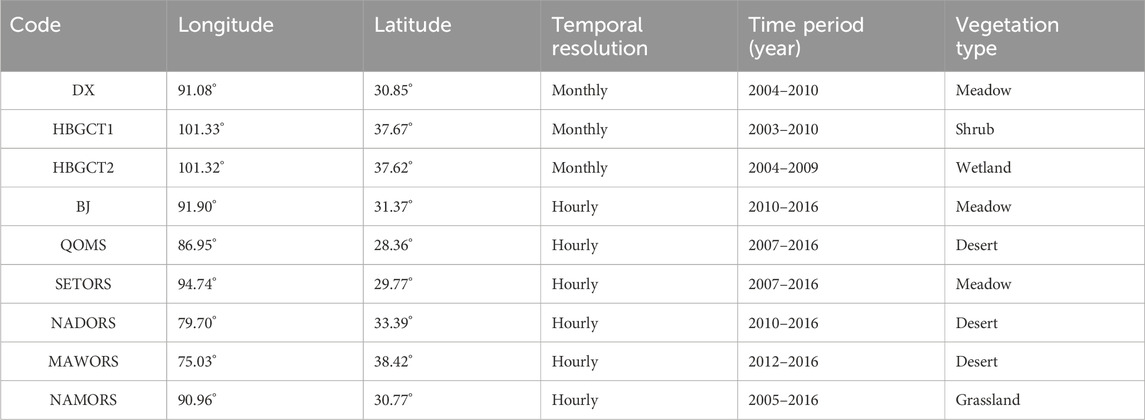
Table 2. Information of the eddy-covariance observation sites.
The nine observation sites are located in the meadow (DX, BJ, and SETORS), grassland (NAMORS), wetland (HBGCT2), desert (QOMS, NADORS, and MAWORS), and shrub (HBGCT1) regions (Table 2) so they can represent the land surface types over the TP.
2.2 Methods
For compatibility in all of the datasets, a common period of 1982–2014 was used for analysis in the study. In addition, the bilinear interpolation method, a commonly used interpolation approach, was used to unify the spatial resolution of different datasets into 0.05° × 0.05°. The temporal correlation coefficients (TCCs) and root-mean-square error (RMSE) were used to evaluate the ET datasets. The TCC was calculated as follows:
where TCC was the Pearson’s correlation coefficient, x and y represented the observations and variables to be assessed, respectively, and n was the number of months in this paper. The RMSE was calculated as follows:
where n, x, and y had the same meaning as previously defined. The two statistics were calculated using NCAR Command Language (NCL) version 6.6.2. Then, the t-test was used to examine the significance of the correlation coefficients. In addition, the linear trend of ET was also calculated using NCL. SEM, a statistical technique widely used to test and assess causal relationships among climate system variables (Pan et al., 2022), was utilized to analyze the pathways of the influencing factors on ET. The direct and indirect impact factors were distinguished in the SEM analysis. The SEM analysis was carried out using R version 4.2.3 with the “lavaan” package. The Rn was calculated using the radiation calculation formulas (Allen et al., 1998) based on the Rs in the CMFD.
3 Results
3.1 Spatiotemporal characteristics of ET over the TP
The spatial distributions of annual ET for the five datasets in 1982–2014 are presented in Figure 2. All datasets exhibit a gradual decrease in ET from the southeastern to the northwestern region of the TP, with the lowest values concentrated primarily in the Qaidam basin. A similar ET distribution pattern in the TP was also identified by Ma and Zhang (2022). It is noteworthy that the spatial distribution characteristic for ERA5 (Figure 2D) differs from that of the other datasets due to the larger ET values in the northwestern regions. Additionally, ET in the northwestern TP for GLDAS (Figure 2C) and MERRA-2 (Figure 2E) is significantly smaller than that for GLEAM (Figure 2A) and LEDQTP (Figure 2B). From Figure 2F, it can be seen that ET values for LEDQTP, ERA5, and MERRA-2 are higher at most grid points compared to the other datasets. However, the mean ET from ERA5 averaged over the TP is the largest at 379.979 ± 0.417 mm a−1 due to the larger discreteness of ET observed in LEDQTP and MERRA-2, particularly for MERRA-2. GLDAS presents the smallest mean ET value of 249.90 ± 0.469 mm a−1, averaged over the TP (Table 3).
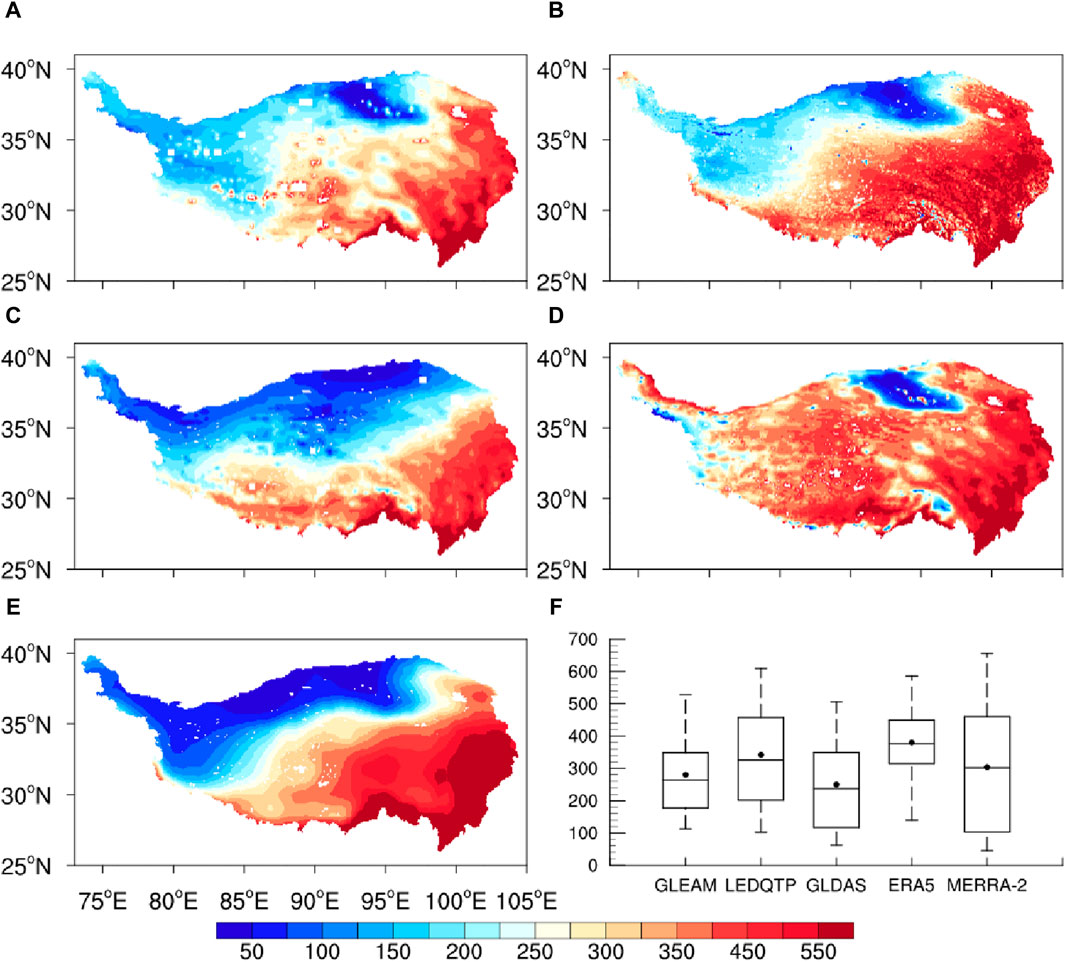
Figure 2. Spatial distributions of the annual ET (unit: mm a−1) for (A) GLEAM, (B) LEDQTP, (C) GLDAS, (D) ERA5, and (E) MERRA-2 and (F) the boxplot of annual ET (unit: mm) for the five datasets during 1982–2014.

Table 3. Annual mean ET averaged over the TP during 1982–2014 for the five datasets (unit: mm a−1).
In addition, ET over the TP presents a clear seasonal cycle, gradually increasing from January and reaching its maximum in July before decreasing, as shown by all the datasets (Figure 3). Furthermore, as ET increases, the differences among the datasets become more pronounced. In June, July, and August, ERA5 shows significantly higher ET compared to the other datasets, followed by LEDQTP, while GLDAS has the lowest value. Therefore, the discrepancies in annual ET among the five datasets are primarily caused by the differences in summer. Nevertheless, all of the datasets can consistently demonstrate the spatial and seasonal distribution characteristics of ET over the TP in 1982–2014.
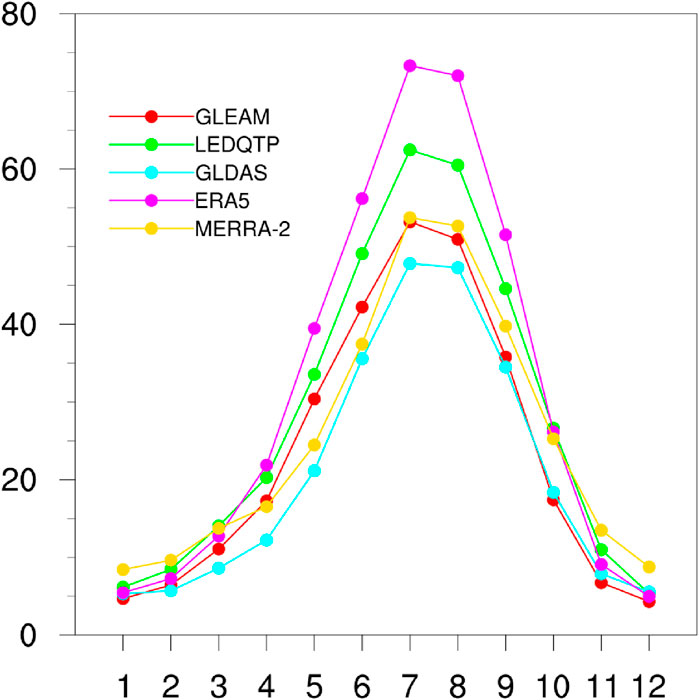
Figure 3. Monthly ET (unit: mm) averaged over the TP for the five datasets during 1982–2014.
Figure 4 shows the inter-annual variations as well as the spatial distribution of the linear trends of ET for the five datasets from 1982 to 2014. Each dataset exhibits an increasing ET trend, with GLEAM showing the most significant increase at a rate of 10.8 mm (10a)−1, followed by LEDQTP. The ET trends for GLEAM, LEDQTP, and MERRA-2 are statistically significant at a p-value of less than 0.05. GLDAS, however, shows the minimum variation with a change rate of 3 mm (10a)−1, which does not pass the significance test (Figure 4F). Lin et al. (2021) and Yin et al. (2013) have also reported an increase in ET over the TP during the periods of 1961–2014 and 1981–2010, respectively. Conversely, Han et al. (2021) and Song et al. (2017) have shown that the annual ET averaged over the TP decreased in 2001–2018 and 2000–2010. The inconsistency in the study time period may be the primary reason for the opposing ET trends.
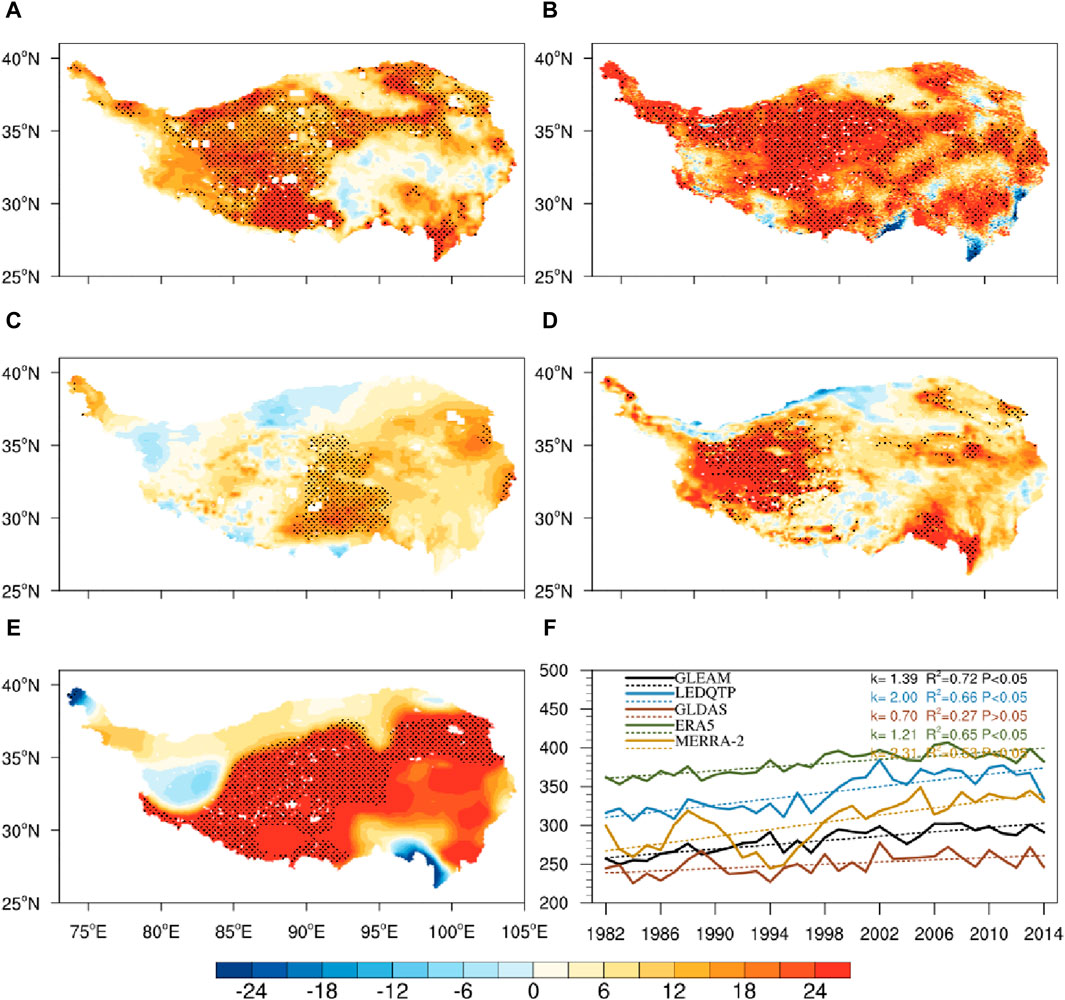
Figure 4. Spatial distribution of linear trends (mm (10a)−1) of annual ET for (A) GLEAM, (B) LEDQTP, (C) GLDAS, (D) ERA5, and (E) MERRA-2 and (F) the inter-annual variations of ET averaged over the TP for the five datasets during 1982–2014. The areas with black dots in (A–E) represent the linear trends that pass the significance test at p < 0.001.
Spatially, ET for all five datasets presents an increasing trend in most areas of the TP in 1982–2014 (Figure 4A–e). However, there are some disparities in the spatial distribution patterns of the ET trends among the five datasets. The increasing ET trends for GELAM are mainly distributed in the western and northern regions of the TP, which pass the significance test at p < 0.001 in some areas, while the decreasing ET trends are mainly distributed in the southeastern regions, Qaidam basin, and Karakoram Mountain range (Figure 4A). The spatial distribution pattern of the ET trend for LEDQTP shows a more substantial increase compared to that for GLEAM (Figure 4B). The decreasing trend is sporadically distributed in the northeastern regions, southern fringes, and southeastern regions of the TP. Yang et al. (2022) pointed out that the enhanced Indian monsoon significantly increased the temperature, which induced the depletion of SM and, thus, reduced ET in the southeastern region of the TP. As for GLDAS, regions with a decreasing ET trend are mainly located in the northern and southern edge regions of the TP (Figure 4C). The decreasing ET trends for ERA5 are mainly in the Qaidam basin, Nyingchi Tanggula, and Yarlung Tsangpo River regions and Daxue Mountain and Qionglai Mountain regions (Figure 4D). The increasing trend of ET for MERRA-2 is more significant, and the range distribution with an increasing trend is wider compared to the other datasets (Figure 4E).
3.2 Evaluation of the ET datasets based on observations
Although all five datasets exhibit an increasing trend in ET over the TP from 1982 to 2014, there are discrepancies in the spatial distribution patterns of ET trends in these datasets. Therefore, it is essential to assess these datasets and select the one that is most closely aligned with the observation before proceeding with further analyses.
Figure 5 displays the variation of monthly ET for the five datasets and the observed latent heat flux at the nine observation sites during the corresponding years. All datasets are able to capture the oscillatory characteristics of the observations over time at most sites, except for certain periods at specific sites, such as at the MAWORS site in 2014 (Figure 5G), which may have resulted from the high number of missing values for observations during the period at the site. Table 4 shows the TCC between ET for the five datasets and observations at each site. It can be seen that almost all the TCC for these datasets pass the significance test at p < 0.001, with the exception of GLDAS at MAWORS. Specifically, the correlations between GLEAM and the observation at the HBGCT1 and NADORS sites are larger compared to the other datasets, with a TCC of 0.798 and 0.808, respectively. It is worth noting that the TCC between LEDQTP and the observation is larger than the other datasets at four sites, namely, DX, HBGCT2, QOM, and MAWORS, with values of 0.909, 0.944, 0.847, and 0.726, respectively. The highest TCC between GLDAS, ERA5, and MERRA-2 and the observations only appear at the SETORS, BJ, and NAMORS sites, respectively. In terms of the average across all the sites, the highest correlation relationship is found between LEDQTP and the observation, with a correlation coefficient of 0.8, followed by GLEAM.
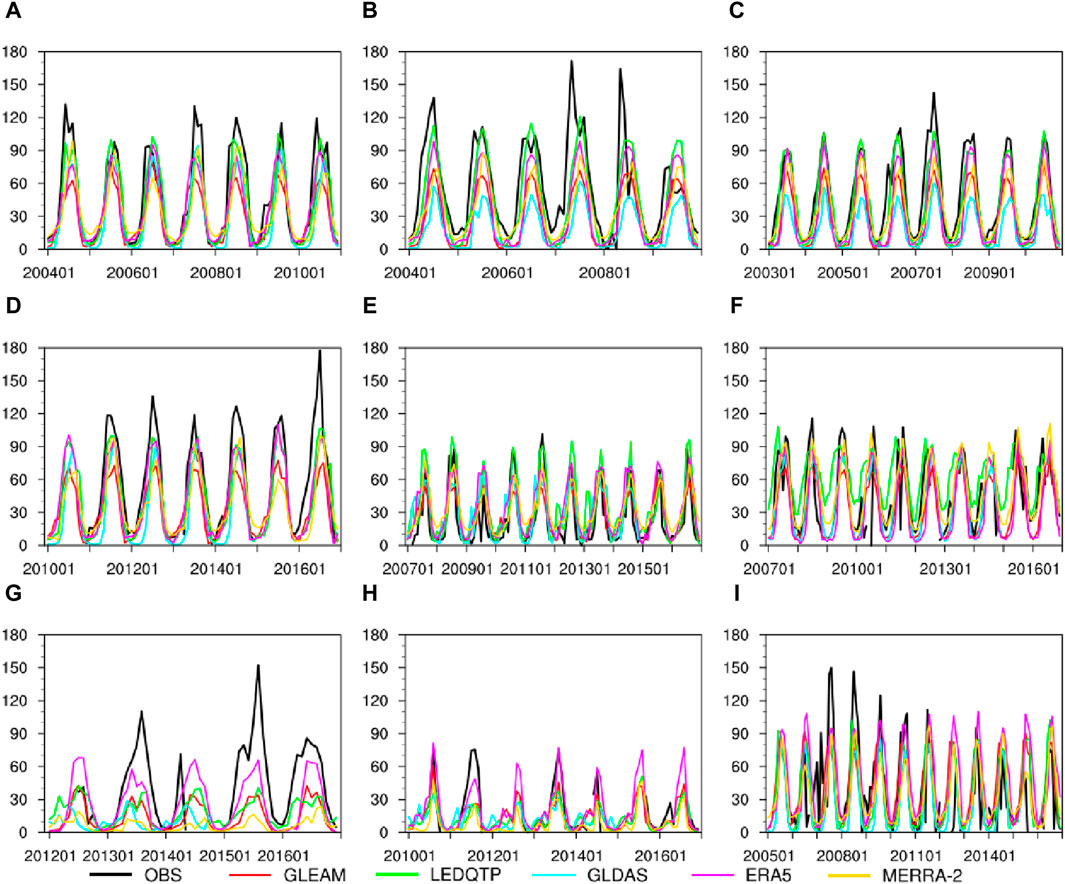
Figure 5. Monthly ET (unit: mm) for GLEAM, LEDQTP, GLDAS, ERA5, and MERRA-2 corresponding to the observed latent heat flux at each observation site. (A) DX, (B) HBGCT1, (C) HBGCT2, (D) BJ, (E) QOMS, (F) SETORS, (G) MAWORS, (H) NADORS, (I) NAMORS.
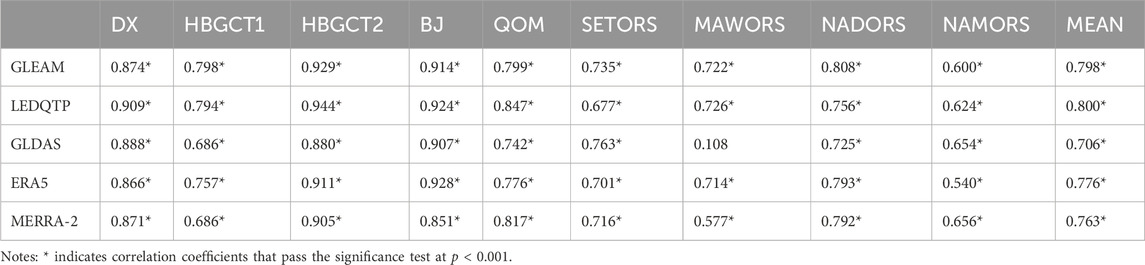
Table 4. TCC between ET and observed latent heat flux at each observation site.
Despite the strong temporal correlation between these datasets and observations, there are still some errors between them, as shown in Figure 5. All five datasets underestimate ET in certain periods, particularly in the summer, compared to the observations at the DX site (Figure 5A). Similar deviations also occur at other sites, especially at HBGCT1 (Figure 5B), BJ (Figure 5D), and MAWORS (Figure 5G). The RMSE between the five datasets and observations is shown in Table 5. The RMSE between LEDQTP and the observations is lowest at the DX, HBGCT1, HBGCT2, and BJ sites, with values of 17.618, 27.705, 13.037, and 22.448 mm, respectively, compared to the other datasets. At the QOM, SETORS, and NAMORS sites, the lowest RMSE occurs between the observations and GLEAM, GLDAS, and MERRA-2, respectively. The two sites (MAWORS and NADORS) have the lowest RMSE between ERA5 and observations. The LEDQTP has the lowest error between observations, with an RMSE of 23.501 mm when considering the mean results averaged over all the sites.
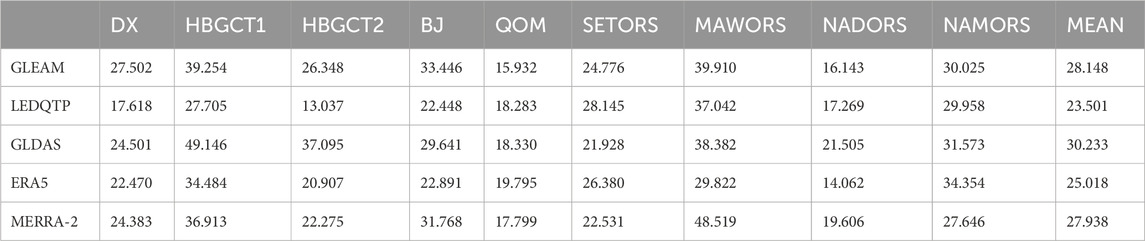
Table 5. RSME between ET and observed latent heat flux at each observation site (unit: mm).
In summary, since the temporal correlation between ET for LEDQTP and the observations is the highest and, at the same time, that for RMSE is the lowest, we chose the LEDQTP dataset to study the main influencing factors on the variation of ET over the TP in the following section.
3.3 Analysis of the influencing factors of the ET changes
ET can be affected by various factors, such as climatic variables and vegetation. Moreover, the main factors that cause changes in ET may be different for different land cover types. Therefore, we conducted SEM analyses using annual ET and its relevant variables. Table 6 presents the total contribution of surface Ta, Pre, Win, Rn, and VPD to ET for LEDQTP using the SEM statistical method across the entire TP and various land cover types. On the whole TP, Ta has the strongest effect on ET with a standardized estimate of 0.666, which is statistically significant at p < 0.005 (Table 6). The response mechanisms of ET to the influencing factors resulting from the SEM are shown in Figure 6. It is evident that Ta has a direct impact on ET as well as an indirect influence through Ts leading to ET and Ts leading to NDVI, which ultimately affects ET (Figure 6A). In other words, an increase in Ta causes an increase in Ts, resulting in an increase in ET. Additionally, the increase in Ts leads to an increase in NDVI, which contributes to the overall increase in ET. Teng et al. (2021) also found that the increased ET on the TP was closely related to vegetation greening in the past 30 years. Although the standardized estimate for Pre, which is 0.403 and passes the significance test at p < 0.05, is lower than that of Ta, it still has a direct impact on ET, as illustrated in Table 6 and Figure 6A.
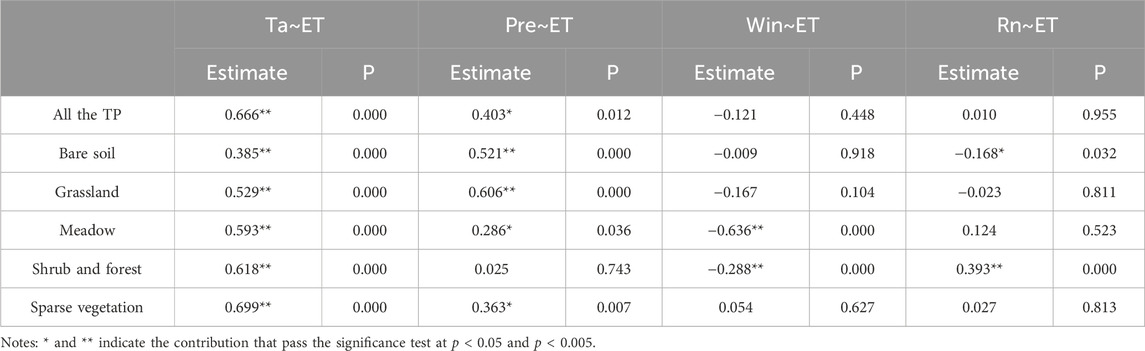
Table 6. Total contribution of Ta, Pre, Win, and Rn to ET estimated by SEM.
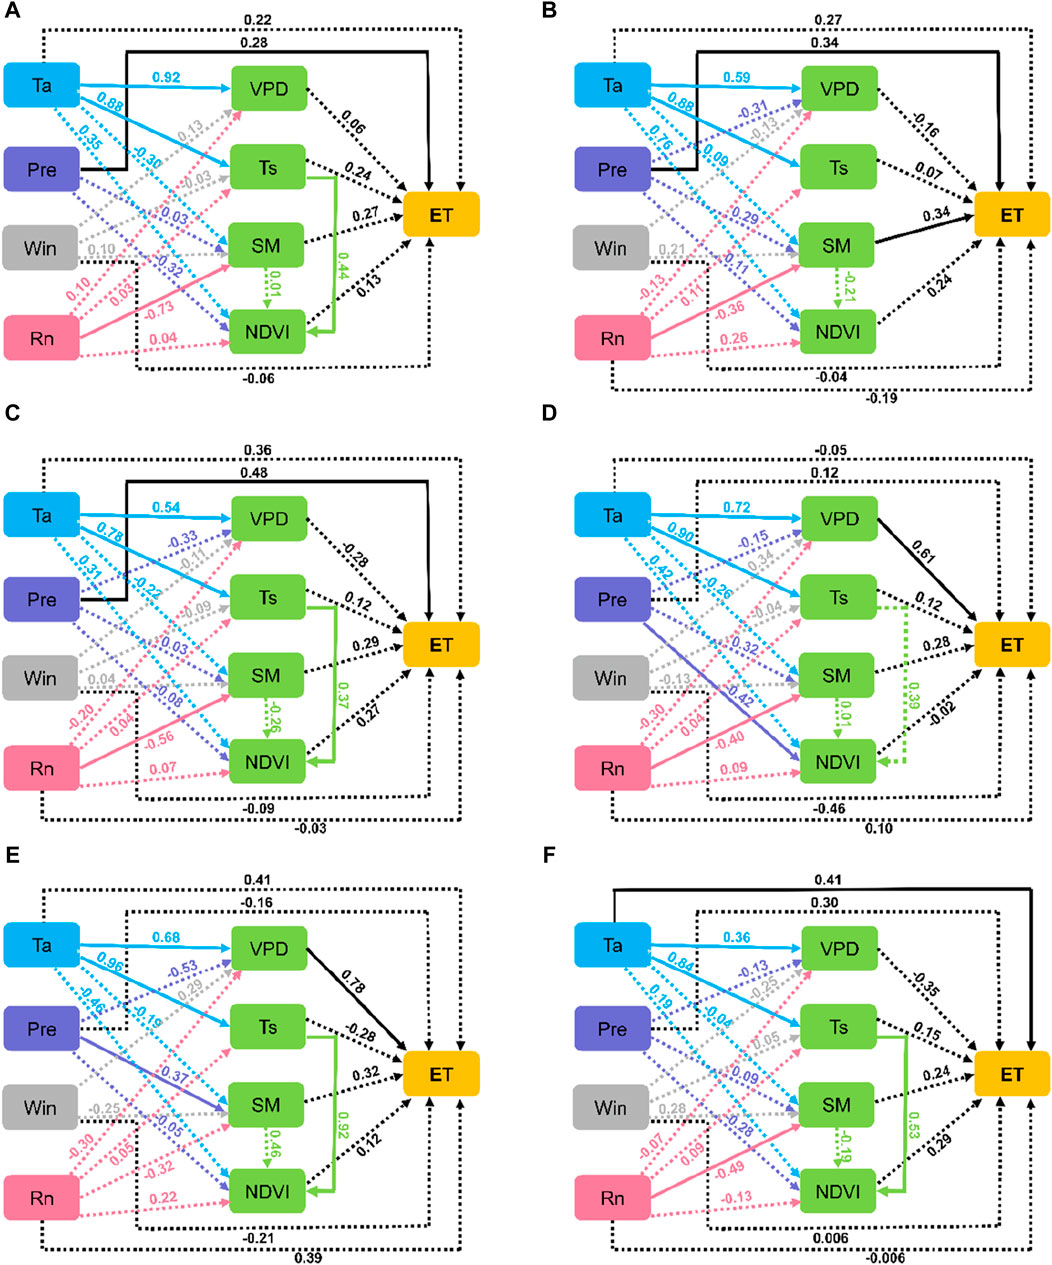
Figure 6. Results of the structural equation model for ET and its influencing factors over the whole TP (A) and different land cover types (B–F): (B) bare soil, (C) grassland, (D) meadow, (E) shrub and forest, and (F) sparse vegetation. The numbers in the plots represent the fraction of variation explained for dependent variables in the model.
In the bare soil and grassland areas, the standardized estimates of Ta and Pre both pass the significance test at p < 0.005, and Pre has the higher values of 0.521 and 0.606, respectively (Table 6). This indicates that both Ta and Pre have a significant effect on ET in the two land cover type regions, and Pre has a stronger effect. Ma and Zhang (2022) and He et al. (2019) also pointed out that the increased ET on the TP was primarily driven by the increased Pre, which was associated with weakened westerlies that significantly correlated with the Atlantic Multi-decadal Oscillation (AMO) on inter-decadal time scales (Sun et al., 2020). As shown in Figures 6B and C, Pre affects ET primarily through a direct pathway. The increase in Pre (Figure 7C) directly contributes to the increase in ET (Figure 7A). However, Ta indirectly affects ET. In bare soil areas, Ta affects ET through Ts (Figure 6B). The increased Ta (Figure 7B) leads to an increase in Ts (Figure 7H), which finally promotes an increase in ET. In grassland areas, Ta (Figure 7B) affects ET through Ts, which in turn affects NDVI and, ultimately, ET. In addition, the decrease in Rn (Figure 7E) contributes to the increase in SM (Figure 7F), which finally contributes to the increase in ET. Therefore, the total effect of Rn was insignificantly negative in the two regions.
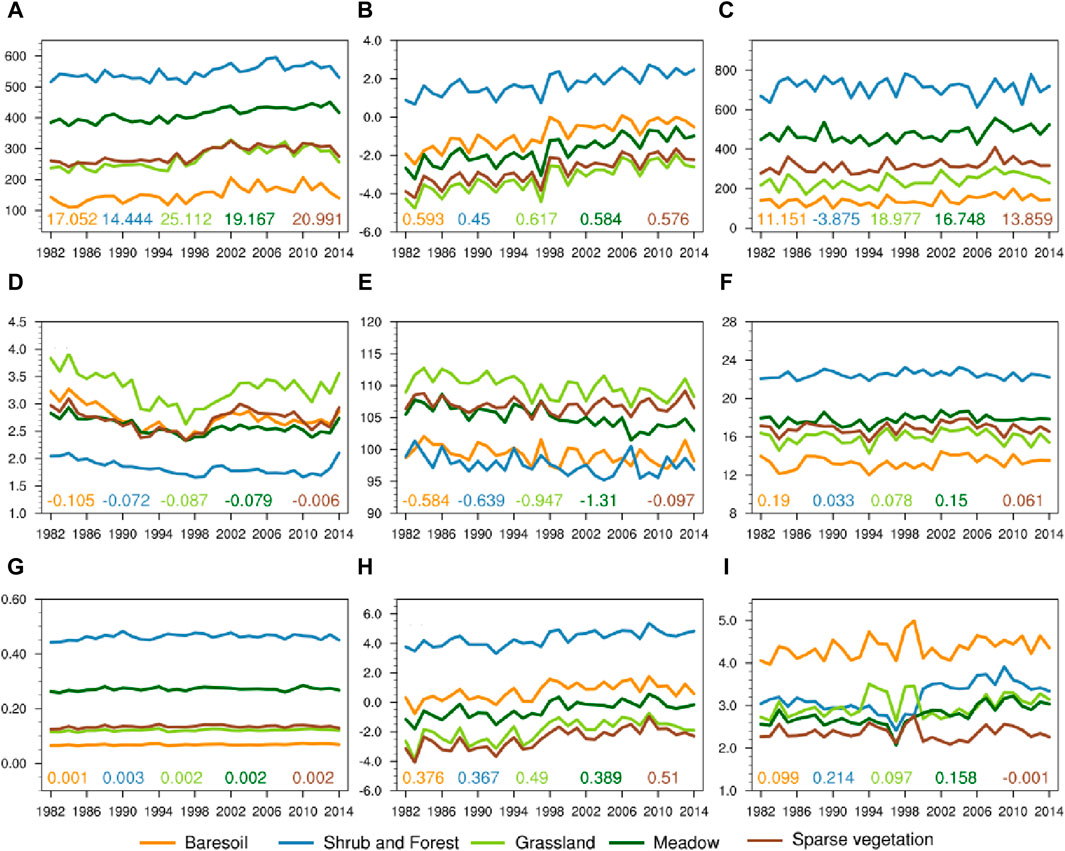
Figure 7. Inter-annual variations of (A) ET (mm), (B) Ta (°C), (C) Pre (mm), (D) Win (m s−1), (E) Rn (W m−2), (F) SM (mm), (G) NDVI, (H) Ts (°C), and (I) VPD (hPa) averaged over different land cover types during 1982–2014.
Different from the previous two regions, in the meadow and shrub and forest regions, the total contributions of Ta to ET are the largest, with standardized estimates of 0.593 and 0.618, respectively, both passing the significance test at p < 0.005 (Table 6). Ta primarily affects ET by an indirect pathway, mainly through VPD and Ts (Figures 6D and E). It is worth noting that the standardized estimates of Win are also significant at p < 0.05 in both regions (Table 6). However, because Win presents a downward trend (Figure 7D), it inhibits the increase of ET by reducing the evaporation rate, with estimated values of −0.46 (Figure 6D) and −0.21 (Figure 6E). The effect of Win is ultimately outweighed by the positive contribution of Ta, so the ET still presents an increasing trend (Figure 7A). In addition, it can be seen that Pre has a larger negative effect on NDVI in meadow regions (Figure 6D). Figure 7F shows that SM is already higher in the meadow area, second only to the shrub and forest areas. Therefore, the soil may be too wet due to higher Pre, causing plant roots to receive excessive soaking, which can limit plant growth and photosynthesis, ultimately reducing the NDVI. Previous studies have also shown a negative relationship between Pre and vegetation in other cold areas (Xu jie et al., 2019; Ma et al., 2023). Furthermore, Pre over the TP falls in the form of snowfall most of the time due to the special topography, and the snow cover can hinder the identification of vegetation by satellite remote sensing, which ultimately influences the NDVI. In the shrub and forest regions, Pre has a negative direct contribution to ET (Figure 6E). This is mainly because Pre in the shrub and forest areas presents a decreasing trend (Figure 7C). In addition, Pre indirectly affects ET through SM. Generally, a decrease in Pre would inhibit the increase in SM, but due to the more developed root systems and the high water-holding capacity of the soil in forest and shrub regions, the vegetation can still maintain SM even with a decrease in Pre, which may be the reason why SM still increases in these regions, but the trend is not as significant as in the other areas (Figure 7F).
Since sparse vegetation is scattered across the TP (Figure 1), the total contribution of each influencing factor to ET is similar to that of the whole TP, i.e., the contributions both of Pre and Ta to ET pass the significance test at p < 0.05 and p < 0.005, respectively, but the effect of Ta is relatively more significant with a standardized estimate of 0.699 (Table 6). Ta primarily affects ET through a direct pathway and secondarily by affecting Ts and then NDVI indirectly. Similarly, Rn also affects ET to some extent through SM (Figure 6F).
Summarily, ET shows an increasing trend averaged across the TP and in all the land cover types. Both Ta and Pre have a significant effect on the increased ET in the whole TP, bare soil, grassland, and sparse vegetation regions. On the whole TP and sparse vegetation region, the total contribution of Ta is more significant, while in the bare soil and grassland regions, the contribution of Pre is more significant. In the meadow as well as shrub and forest regions, Ta plays a dominant role in the increase in ET.
4 Discussion
This study evaluated five ET datasets using the observed latent heat flux in order to investigate the main driving factors and influencing mechanisms of ET over the TP in 1982–2014. However, the observations used in this paper are limited to only nine sites, which are sparsely located in the southern part of the TP (Figure 1). Furthermore, the time series of observations from these sites is too short, and the time duration is inconsistent for each station (Table 2). It may not be adequate to evaluate the gridded data solely based on these observations. Therefore, high-density and long-time series of flux observations are urgently needed to evaluate the available gridded datasets in order to obtain more accurate ET data in future research.
The datasets related to this study have been carefully selected according to evaluations in previous studies so that they can more accurately describe the climate changes over the TP. Nevertheless, there are still some biases in these datasets compared to observations, which could impact the results of this paper. For example, GLDAS performed better in capturing the variations of in situ SM and Ts, but it overestimated SM and showed lower Ts when compared to the in situ measurements (Bi and Ma, 2015; Xu W. et al., 2019; Ma et al., 2021; Xing et al., 2021). Win in the CMFD had the least bias with observations and could represent the variation of observations well, but its correlation with the observations needed improvement (Xie et al., 2017; He et al., 2020; Lin et al., 2023). For Ta, although it was interpolated from observations and had high accuracy, the gridded Ta was lower than the observation due to the low altitude of the observing stations (Gao et al., 2015).
Due to the complexity of land–atmosphere interactions, ET is influenced by various aspects. In this paper, we have only discussed the influencing factors of ET from the perspective of climate change. The study found that Pre was the main influencing factor in dry, bare soil and grassland areas, while Ta was the dominant factor in the wet meadow and forest regions. This finding was in line with previous studies that have indicated that ET was constrained by moisture in arid regions and that the surface energy fluxes were dominated by sensible heat fluxes. In contrast, in the humid subsurface, ET was mainly limited by energy supply, with smaller sensible heat fluxes, and the surface energy fluxes were dominated by latent heat transfer (Taheri et al., 2022). The elevated CO2 concentration (Liu et al., 2021a), land use/land cover change (LULCC) (Sterling et al., 2013; Li et al., 2017), and reservoir storage (Scanlon et al., 2018) may also have larger impacts on ET by changing the local water and energy balance. According to the IPCC, global atmospheric CO2 concentrations have increased (IPCC, 2013). An increase in CO2 concentration reduces vegetation stomatal openness, thereby increasing stomatal resistance and reducing ET (Ainsworth and Long, 2005). Piao et al. (2012) reported that the rising atmospheric CO2 concentration was the main cause of vegetation increases in eastern regions of the TP, and increased vegetation would lead to increased ET. Therefore, the elevated CO2 concentration had comprehensive impacts on ET, which needs to be further discussed in the future. Li et al. (2017) pointed out that the conversion of forest and wetland to other land uses caused a decrease in ET, and the conversion of grassland to cropland resulted in an increase in ET. Additionally, the LULCC would also affect precipitation (Zhang and Zhou, 2021) and air temperature (Li et al., 2023), which in turn affected ET. The TP was covered by a large amount of snow, glaciers, and permafrost because of its unique terrain and climate features. Changes in the cryosphere, such as snow reduction, glacial melting, and permafrost degradation, may also have a significant impact on the increase in ET.
In addition to these local factors, larger-scale circulation patterns may also play an important role in altering ET. Miralles et al. (2014) reported that the dynamics of the El Niño/Southern Oscillation (ENSO) have dominated the multi-decadal variability of ET at the global scale. All these issues need to be further discussed in detail in the future.
5 Summary and conclusion
In this study, we analyzed the spatiotemporal characteristics of ET over the TP in 1982–2014 based on multiple datasets and then evaluated these datasets by comparing them with observations from nine flux observation sites to select one that was closest to the observation. Finally, based on the selected ET dataset, we quantified the effect of each driving factor of ET and identified the main influencing factors and their affecting pathways over the different land surface types over the TP. The main conclusions are as follows:
1) ET over the TP decreases from the southeastern to the northwestern regions. The maximum mean ET averaged over the TP is 379.979 ± 0.417 mm a−1 for ERA5, and the minimum is 249.899 ± 0.469 mm a−1 for GLDAS. In addition, ET presents a clear seasonal cycle, with larger values mainly in the summer. The differences among the datasets are more pronounced in the summer. Although all five datasets show an increasing trend in ET from 1982 to 2014, there are large differences in the spatial distribution of the trend.
2) The correlations between the five datasets and observations are high, and the TCC between them passes the significance test at p < 0.001 at almost all observation sites. LEDQTP possesses the highest mean TCC of 0.800, while GLDAS has the lowest value of 0.706. Additionally, LEDQTP has the minimum mean RMSE of 23.501 mm, while GLDAS has the maximum RMSE of 30.233 mm.
3) Across the TP, Ta is the main influencing factor for ET. However, the main influencing factors of ET are different in different land cover-type regions. In the wet meadow and shrub and forest regions, Ta is the main and indirect influencing factor, mainly through affecting VPD, with standardized estimates of 0.593 and 0.618, respectively. Ta is also the controlling factor in sparse vegetation regions, but it affects ET through a direct pathway. However, in the dry, bare soil and grassland regions, Pre is the main and direct influencing factor, with standardized estimates of 0.521 and 0.606, respectively.
Data availability statement
Publicly available datasets were analyzed in this study. These data can be found here: the GLEAM dataset was downloaded at https://www.gleam.eu/; the GLDAS dataset was downloaded at https://disc.gsfc.nasa.gov/datasets?keywords= the ERA5 dataset was downloaded at https://www.ecmwf.int/en/forecasts/datasets; the MERRA-2 dataset was downloaded at https://gmao.gsfc.nasa.gov/reanalysis/MERRA-2/; the China Surface Temperature/Precipitation 0.5° × 0.5° Grid Dataset (V2.0) was downloaded at http://data.cma.cn/; the LEDQTP, CMFD, and NDVI datasets were downloaded at http://data.tpdc.ac.cn; and the observed latent heat flux datasets were downloaded at https://www.scidb.cn/en/and http://www.nesdc.org.cn/.
Author contributions
XL: conceptualization, data curation, formal analysis, funding acquisition, methodology, software, writing–original draft, and writing–review and editing. YP: investigation, supervision, validation, and writing–review and editing. CZ: validation and writing–review and editing.
Funding
The author(s) declare that financial support was received for the research, authorship, and/or publication of this article. This work was jointly supported by the Drought Meteorological Science Research Foundation (IAM202216), the National Natural Science Foundation of China (U20A2098, 42275092), and the open project of Key Laboratory of Meteorological Disaster, Ministry of on Forecast and Evaluation of Meteorological Disasters, Nanjing University of Information Science and Technology (KLME202213).
Acknowledgments
The authors are grateful to the editor and the reviewers of this paper.
Conflict of interest
The authors declare that the research was conducted in the absence of any commercial or financial relationships that could be construed as a potential conflict of interest.
Publisher’s note
All claims expressed in this article are solely those of the authors and do not necessarily represent those of their affiliated organizations, or those of the publisher, the editors, and the reviewers. Any product that may be evaluated in this article, or claim that may be made by its manufacturer, is not guaranteed or endorsed by the publisher.
References
Ainsworth, E. A., and Long, S. P. (2005). What have we learned from 15 years of free-air CO2 enrichment (FACE)? A meta-analytic review of the responses of photosynthesis, canopy properties and plant production to rising CO2. New Phytol. 165, 351–372. doi:10.1111/j.1469-8137.2004.01224.x
Albergel, C., Dutra, E., Munier, S., Calvet, J.-C., Munoz-Sabater, J., Rosnay, P. de, et al. (2018). ERA-5 and ERA-Interim driven ISBA land surface model simulations: which one performs better? Hydrol. Earth Syst. Sci. Discuss. 22, 3515–3532. doi:10.5194/hess-22-3515-2018
Allen, R. G., Pereira, L. S., Raes, D., and Smith, M. (1998). Crop evapotranspiration - guidelines for computing crop water requirements - FAO Irrigation and drainage paper 56. Irrig. Drain., 1–15. doi:10.1016/j.eja.2010.12.001
Bai, P., and Liu, X. (2018). Intercomparison and evaluation of three global high-resolution evapotranspiration products across China. J. Hydrol. 566, 743–755. doi:10.1016/j.jhydrol.2018.09.065
Bi, H., and Ma, J. (2015). Evaluation of simulated soil moisture in GLDAS using in-situ measurements over the Tibetan Plateau. IEEE Int. Symp. Geosci. Remote Sens., 4825–4828. doi:10.1109/IGARSS.2015.7326910
Bosilovich, M., Akella, S., Coy, L., Cullather, R., Draper, C., Gelaro, R., et al. (2015). MERRA-2: initial evaluation of the climate. NASA Tech. Rep. Ser. Glob. Model. Data Assim. 43, 139.
Chen, X., Su, Z., Ma, Y., Trigo, I., and Gentine, P. (2021). Remote sensing of global daily evapotranspiration based on a surface energy balance method and reanalysis data. J. Geophys. Res. Atmos. 126, 1–22. doi:10.1029/2020JD032873
Chen, Y., Yang, K., He, J., Qin, J., Shi, J., Du, J., et al. (2011). Improving land surface temperature modeling for dry land of China. J. Geophys. Res. Atmos. 116, D20104–D20115. doi:10.1029/2011JD015921
Cui, M., Wang, J., Wang, S., Yan, H., and Li, Y. (2019). Temporal and spatial distribution of evapotranspiration and its influencing factors on Qinghai-Tibet Plateau from 1982 to 2014. J. Resour. Ecol. 10, 213–224. doi:10.5814/j.issn.1674-764X.2019.02.012
Gao, Y., Li, X., Ruby Leung, L., Chen, D., and Xu, J. (2015). Aridity changes in the Tibetan Plateau in a warming climate. Environ. Res. Lett. 10, 034013. doi:10.1088/1748-9326/10/3/034013
Gelaro, R., McCarty, W., Suárez, M. J., Todling, R., Molod, A., Takacs, L., et al. (2017). The modern-era retrospective analysis for research and applications, version 2 (MERRA-2). J. Clim. 30, 5419–5454. doi:10.1175/JCLI-D-16-0758.1
Han, C., Ma, Y., Wang, B., Zhong, L., Ma, W., Chen, X., et al. (2021). Long-term variations in actual evapotranspiration over the Tibetan Plateau. Earth Syst. Sci. Data 13, 3513–3524. doi:10.5194/essd-13-3513-2021
He, C., Wang, Z., Zhou, T., and Li, T. (2019). Enhanced latent heating over the Tibetan Plateau as a key to the enhanced East asian summer monsoon circulation under a warming climate. J. Clim. 32, 3373–3388. doi:10.1175/JCLI-D-18-0427.1
He, J., Yang, K., Tang, W., Lu, H., Qin, J., Chen, Y., et al. (2020). The first high-resolution meteorological forcing dataset for land process studies over China. Sci. Data 7, 25–11. doi:10.1038/s41597-020-0369-y
Hersbach, H., Bell, B., Berrisford, P., Hirahara, S., Horányi, A., Muñoz-Sabater, J., et al. (2020). The ERA5 global reanalysis. Q. J. R. Meteorol. Soc. 146, 1999–2049. doi:10.1002/qj.3803
Immerzeel, W. W., Beek, L. P. H. van, and Bierkens, M. F. P. (2010). Climate change will affect the asian water towers. Sci. 328, 5984. doi:10.1126/science.1183188
IPCC (2013). “Climate change 2013-the physical science basis,” in Working group I contribution to the fifth assessment report of the intergovernmental panel on climate change (Cambridge: Cambridge University Press). doi:10.1017/%0ACBO9781107415324
Lal, P., Shekhar, A., Gharun, M., and Das, N. N. (2023). Spatiotemporal evolution of global long-term patterns of soil moisture. Sci. Total Environ. 867, 161470. doi:10.1016/j.scitotenv.2023.161470
Li, G., Zhang, F., Jing, Y., Liu, Y., and Sun, G. (2017). Response of evapotranspiration to changes in land use and land cover and climate in China during 2001–2013. Sci. Total Environ. 596–597, 256–265. doi:10.1016/j.scitotenv.2017.04.080
Li, R., Gao, Y., Chen, D., Zhang, Y., and Li, S. (2018a). Contrasting vegetation changes in dry and humid regions of the Tibetan Plateau over recent decades. Sci. Cold Arid. Reg. 10, 482–492. doi:10.3724/SP.J.1226.2018.00482
Li, X., Chen, H., Hua, W., Ma, H., Li, X., Sun, S., et al. (2023). Modeling the effects of realistic land cover changes on land surface temperatures over China. Clim. Dyn. 61, 1451–1474. doi:10.1007/s00382-022-06635-0
Li, X., Gao, Y., Pan, Y., and Xu, Y. (2018b). Evaluation of near-surface wind speed simulations over the Tibetan Plateau from three dynamical downscalings based on WRF model. Theor. Appl. Climatol. 134, 1399–1411. doi:10.1007/s00704-017-2353-9
Lian, X., Piao, S., Huntingford, C., Li, Y., Zeng, Z., Wang, X., et al. (2018). Partitioning global land evapotranspiration using CMIP5 models constrained by observations. Nat. Clim. Chang. 8, 640–646. doi:10.1038/s41558-018-0207-9
Lin, H., Yang, Y., Wang, S., Wang, S., Tang, J., and Dong, G. (2023). Evaluation of MSWX bias-corrected meteorological forcing datasets in China. Sustain 15, 9283. doi:10.3390/su15129283
Lin, S., Wang, G., Hu, Z., Huang, K., Sun, X., Sun, J., et al. (2021). Dynamics of evapotranspiration and variations in different land-cover regions over the Tibetan plateau during 1961–2014. J. Hydrometeorol. 22, 955–969. doi:10.1175/jhm-d-20-0074.1
Liu, J., You, Y., Li, J., Sitch, S., Gu, X., Nabel, J. E. M. S., et al. (2021a). Response of global land evapotranspiration to climate change, elevated CO2, and land use change. Agric. For. Meteorol. 311, 108663. doi:10.1016/j.agrformet.2021.108663
Liu, J., Zhang, J., Kong, D., Feng, X., Feng, S., and Xiao, M. (2021b). Contributions of anthropogenic forcings to evapotranspiration changes over 1980–2020 using GLEAM and CMIP6 simulations. J. Geophys. Res. Atmos. 126, 1–14. doi:10.1029/2021JD035367
López, O., Houborg, R., and McCabe, M. F. (2017). Evaluating the hydrological consistency of evaporation products using satellite-based gravity and rainfall data. Hydrol. Earth Syst. Sci. 21, 323–343. doi:10.5194/hess-21-323-2017
Lu, J., Wang, G., Chen, T., Li, S., Hagan, D. F. T., Kattel, G., et al. (2021). A harmonized global land evaporation dataset from model-based products covering 1980-2017. Earth Syst. Sci. Data 13, 5879–5898. doi:10.5194/essd-13-5879-2021
Ma, D., Wu, X., Yin, G., Li, Z., Wang, J., Tang, R., et al. (2023). Detection, mapping, and interpretation of the main drivers of the Arctic GPP change from 2001 to 2019. Clim. Dyn. 62, 723–738. doi:10.1007/s00382-023-06935-z
Ma, H., Zeng, J., Zhang, X., Fu, P., Zheng, D., Wigneron, J. P., et al. (2021). Evaluation of six satellite- and model-based surface soil temperature datasets using global ground-based observations. Remote Sens. Environ. 264, 112605. doi:10.1016/j.rse.2021.112605
Ma, N., Szilagyi, J., Zhang, Y., and Liu, W. (2019). Complementary-relationship-based modeling of terrestrial evapotranspiration across China during 1982–2012: validations and spatiotemporal analyses. J. Geophys. Res. Atmos. 124, 4326–4351. doi:10.1029/2018JD029850
Ma, N., and Zhang, Y. (2022). Increasing Tibetan Plateau terrestrial evapotranspiration primarily driven by precipitation. Agric. For. Meteorol. 317, 108887. doi:10.1016/j.agrformet.2022.108887
Ma, Y., Hu, Z., Xie, Z., Ma, W., Wang, B., Chen, X., et al. (2020). A long-term (2005–2016) dataset of hourly integrated land–atmosphere interaction observations on the Tibetan Plateau. Earth Syst. Sci. Data 12, 2937–2957. doi:10.5194/essd-12-2937-2020
Martens, B., Miralles, D. G., Lievens, H., Van Der Schalie, R., De Jeu, R. A. M., Fernández-Prieto, D., et al. (2017). GLEAM v3: satellite-based land evaporation and root-zone soil moisture. Geosci. Model Dev. 10, 1903–1925. doi:10.5194/gmd-10-1903-2017
Martens, B., Schumacher, D. L., Wouters, H., Muñoz-Sabater, J., Verhoest, N. E. C., and Miralles, D. G. (2020). Evaluating the land-surface energy partitioning in ERA5. Geosci. Model Dev. 13, 4159–4181. doi:10.5194/gmd-13-4159-2020
Miralles, D. G., Holmes, T. R. H., De Jeu, R. A. M., Gash, J. H., Meesters, A. G. C. A., and Dolman, A. J. (2011). Global land-surface evaporation estimated from satellite-based observations. Hydrol. Earth Syst. Sci. 15, 453–469. doi:10.5194/hess-15-453-2011
Miralles, D. G., Van Den Berg, M. J., Gash, J. H., Parinussa, R. M., De Jeu, R. A. M., Beck, H. E., et al. (2014). El Niño-La Niña cycle and recent trends in continental evaporation. Nat. Clim. Chang. 4, 122–126. doi:10.1038/nclimate2068
Ndehedehe, C. E., Okwuashi, O., Ferreira, V. G., and Agutu, N. O. (2018). Exploring evapotranspiration dynamics over sub-sahara africa (2000–2014). Environ. Monit. Assess. 190, 400. doi:10.1007/s10661-018-6780-6
Pan, S., Pan, N., Tian, H., Friedlingstein, P., Sitch, S., Shi, H., et al. (2020). Evaluation of global terrestrial evapotranspiration using state-of-the-art approaches in remote sensing, machine learning and land surface modeling. Hydrol. Earth Syst. Sci. 24, 1485–1509. doi:10.5194/hess-24-1485-2020
Pan, Y., Li, X., Li, S., and Li, Z. (2022). Different responses of soil respiration to climate change in permafrost and non-permafrost regions of the Tibetan plateau from 1979 to 2018. Int. J. Climatol. 42, 7198–7212. doi:10.1002/joc.7639
Piao, S., Tan, K., Nan, H., Ciais, P., Fang, J., Wang, T., et al. (2012). Impacts of climate and CO 2 changes on the vegetation growth and carbon balance of Qinghai-Tibetan grasslands over the past five decades. Glob. Planet. 99, 73–80. doi:10.1016/j.gloplacha.2012.08.009
Pinzon, J. E., and Tucker, C. J. (2014). A non-stationary 1981-2012 AVHRR NDVI3g time series. Remote Sens. 6, 6929–6960. doi:10.3390/rs6086929
Rodell, M., Houser, P. R., Jambor, U., Gottschalck, J., Mitchell, K., Meng, C. J., et al. (2004). The global land data assimilation system. Bull. Am. Meteorol. Soc. 85, 381–394. doi:10.1175/BAMS-85-3-381
Scanlon, B. R., Zhang, Z., Save, H., Sun, A. Y., Schmied, H. M., Van Beek, L. P. H., et al. (2018). Global models underestimate large decadal declining and rising water storage trends relative to GRACE satellite data. Proc. Natl. Acad. Sci. U. S. A. 115, E1080–E1089. doi:10.1073/pnas.1704665115
Song, L., Zhuang, Q., Yin, Y., Zhu, X., and Wu, S. (2017). Spatio-temporal dynamics of evapotranspiration on the Tibetan Plateau from 2000 to 2010. Environ. Res. Lett. 12, 014011. doi:10.1088/1748-9326/aa527d
Sterling, S. M., Ducharne, A., and Polcher, J. (2013). The impact of global land-cover change on the terrestrial water cycle. Nat. Clim. Chang. 3, 385–390. doi:10.1038/nclimate1690
Sun, J., Yang, K., Guo, W., Wang, Y., He, J., and Lu, H. (2020). Why has the inner Tibetan plateau become wetter since the Mid-1990s? J. Clim. 33, 8507–8522. doi:10.1175/JCLI-D-19-0471.1
Sun, S., Chen, B., Shao, Q., Chen, J., Liu, J., Zhang, X. jun, et al. (2017). Modeling evapotranspiration over China’s landmass from 1979 to 2012 using multiple land surface models: evaluations and analyses. J. Hydrometeorol. 18, 1185–1203. doi:10.1175/JHM-D-16-0212.1
Taheri, M., Mohammadian, A., Ganji, F., Bigdeli, M., and Nasseri, M. (2022). Energy-based approaches in estimating actual evapotranspiration focusing on land surface temperature: a review of methods, concepts, and challenges. Energies 15, 1264. doi:10.3390/en15041264
Teng, H., Luo, Z., Chang, J., Shi, Z., Chen, S., Zhou, Y., et al. (2021). Climate change-induced greening on the Tibetan Plateau modulated by mountainous characteristics. Environ. Res. Lett. 16, 064064. doi:10.1088/1748-9326/abfeeb
Wang, G., Lin, S., Hu, Z., Lu, Y., Sun, X., and Huang, K. (2020a). Improving actual evapotranspiration estimation integrating energy consumption for ice phase change across the Tibetan plateau. J. Geophys. Res. Atmos. 125, 1–13. doi:10.1029/2019JD031799
Wang, K., Zhang, Y., Ma, N., Guo, Y., and Qiang, Y. (2020b). Cryosphere evapotranspiration in the Tibetan Plateau: a review. Sci. Cold Arid. Reg. 12, 355–370. doi:10.3724/SP.J.1226.2020.00355
Wang, T., Zhao, Y., Xu, C., Ciais, P., Liu, D., Yang, H., et al. (2021a). Atmospheric dynamic constraints on Tibetan Plateau freshwater under Paris climate targets. Nat. Clim. Chang. 11, 219–225. doi:10.1038/s41558-020-00974-8
Wang, Z., Zhan, C., Ning, L., and Guo, H. (2021b). Evaluation of global terrestrial evapotranspiration in CMIP6 models. Theor. Appl. Climatol. 143, 521–531. doi:10.1007/s00704-020-03437-4
Xie, Z., Hu, Z., Gu, L., Sun, G., Du, Y., and Yan, X. (2017). Meteorological forcing datasets for blowing snow modeling on the Tibetan Plateau: evaluation and intercomparison. J. Hydrometeorol. 18, 2761–2780. doi:10.1175/JHM-D-17-0075.1
Xing, Z., Fan, L., Zhao, L., De Lannoy, G., Frappart, F., Peng, J., et al. (2021). A first assessment of satellite and reanalysis estimates of surface and root-zone soil moisture over the permafrost region of Qinghai-Tibet Plateau. Remote Sens. Environ. 265, 112666. doi:10.1016/j.rse.2021.112666
Xu, H. jie, Zhao, C. yan, and Wang, X. ping (2019a). Spatiotemporal differentiation of the terrestrial gross primary production response to climate constraints in a dryland mountain ecosystem of northwestern China. Agric. For. Meteorol. 276–277, 107628. doi:10.1016/j.agrformet.2019.107628
Xu, W., Sun, C., Zuo, J., Ma, Z., Li, W., and Yang, S. (2019b). Homogenization of monthly ground surface temperature in China during 1961-2016 and performances of GLDAS reanalysis products. J. Clim. 32, 1121–1135. doi:10.1175/JCLI-D-18-0275.1
Yang, F., Lu, H., Yang, K., He, J., Wang, W., Wright, J. S., et al. (2017). Evaluation of multiple forcing data sets for precipitation and shortwave radiation over major land areas of China. Hydrol. Earth Syst. Sci. 21, 5805–5821. doi:10.5194/hess-21-5805-2017
Yang, Z., Yue, P., Zhang, Y., Zhang, Q., Zhang, L., Zeng, J., et al. (2022). Temporal variability of evapotranspiration and its response to westerly and monsoon circulation over the Tibetan Plateau. Theor. Appl. Climatol. 150, 1111–1129. doi:10.1007/s00704-022-04202-5
Yao, T., Thompson, L., Yang, W., Yu, W., Gao, Y., Guo, X., et al. (2012). Different glacier status with atmospheric circulations in Tibetan Plateau and surroundings. Nat. Clim. Chang. 2, 663–667. doi:10.1038/nclimate1580
Yao, T., Xue, Y., Chen, D., Chen, F., Thompson, L., Cui, P., et al. (2019). Recent third pole’s rapid warming accompanies cryospheric melt and water cycle intensification and interactions between monsoon and environment: multidisciplinary approach with observations, modeling, and analysis. Bull. Am. Meteorol. Soc. 100, 423–444. doi:10.1175/BAMS-D-17-0057.1
Yin, Y., Wu, S., Zhao, D., Zheng, D., and Pan, T. (2013). Modeled effects of climate change on actual evapotranspiration in different eco-geographical regions in the Tibetan Plateau. J. Geogr. Sci. 23, 195–207. doi:10.1007/s11442-013-1003-0
Yu, G. R., Wen, X. F., Sun, X. M., Tanner, B. D., Lee, X., and Chen, J. Y. (2006). Overview of ChinaFLUX and evaluation of its eddy covariance measurement. Agric. For. Meteorol. 137, 125–137. doi:10.1016/j.agrformet.2006.02.011
Zhang, B., and Zhou, W. (2021). Spatial–temporal characteristics of precipitation and its relationship with land use/cover change on the qinghai-tibet plateau, China. Land 10, 269. doi:10.3390/land10030269
Zhang, H., Sun, J., and Xiong, J. (2017). Spatial-temporal patterns and controls of evapotranspiration across the Tibetan plateau (2000-2012). Adv. Meteorol. 2017, 1–12. doi:10.1155/2017/7082606
Zhang, H., Wang, S., Ye, C., and Wang, Y. (2022). Trends and attribution analysis of modelled evapotranspiration on the Tibetan Plateau. Hydrol. Process. 36. doi:10.1002/hyp.14527
Zhang, T., Gebremichael, M., Meng, X., Wen, J., Iqbal, M., Jia, D., et al. (2018). Climate-related trends of actual evapotranspiration over the Tibetan Plateau (1961–2010). Int. J. Climatol. 38. doi:10.1002/joc.5350
Zhang, Y., Peña-Arancibia, J. L., McVicar, T. R., Chiew, F. H. S., Vaze, J., Liu, C., et al. (2016). Multi-decadal trends in global terrestrial evapotranspiration and its components. Sci. Rep. 6, 19124–19212. doi:10.1038/srep19124
Zhang, Z., and Wang, K. (2020). Stilling and recovery of the surface wind speed based on observation, reanalysis, and geostrophic wind theory over China from 1960 to 2017. J. Clim. 33, 3989–4008. doi:10.1175/JCLI-D-19-0281.1
Zhao, J., Ding, Y., and Yang, J. (2021). Suitability analysis and evaluation of GIMMS NDVI3gProduct in plateau region. IOP Conf. Ser. Earth Environ. Sci. 734, 012007–7. doi:10.1088/1755-1315/734/1/012007
Keywords: terrestrial evapotranspiration, impact pathways, land cover types, SEM, Tibetan Plateau
Citation: Li X, Pan Y and Zhao C (2024) Main influencing factors of terrestrial evapotranspiration for different land cover types over the Tibetan Plateau in 1982–2014. Front. Environ. Sci. 12:1346469. doi: 10.3389/fenvs.2024.1346469
Received: 29 November 2023; Accepted: 14 March 2024;
Published: 02 April 2024.
Edited by:
Devaraju Narayanappa, CSC—IT Center for Science, FinlandReviewed by:
Wanqiu Xing, Hohai University, ChinaPreet Lal, Michigan State University, United States
Copyright © 2024 Li, Pan and Zhao. This is an open-access article distributed under the terms of the Creative Commons Attribution License (CC BY). The use, distribution or reproduction in other forums is permitted, provided the original author(s) and the copyright owner(s) are credited and that the original publication in this journal is cited, in accordance with accepted academic practice. No use, distribution or reproduction is permitted which does not comply with these terms.
*Correspondence: Yongjie Pan, cGFueW9uZ2ppZUBsemIuYWMuY24=