 Kaijia Xue1
 Yingjian Yang
- 1Law School, Fuzhou University, Fuzhou, Fujian, China
- 2Department of Radiological Research and Development, Shenzhen Lanmage Medical Technology Co., Ltd, Shenzhen, Guangdong, China
- 3School of Architecture and Urban-Rural Planning, Fuzhou University, Fujian, China
Watershed ecological compensation (WEC), as a public policy for sustainability, aims at balancing the ecological environment and economic development within specific watersheds to achieve the harmonious coexistence between humans and nature. This study takes an innovative approach by constructing an effective WEC policy evaluation model for the Huai River Basin based on a comprehensive evaluation system and empirical research. By systematically integrating the fuzzy comprehensive evaluation of the analytic hierarchy process and descriptive statistical methods, the model provides a comprehensive evaluation of the WEC policy’s influence on the basin’s overall environment. The results indicate that each area related to the Huai River Basin presents a positive promotion of the ecological environment and economic development based on its comprehensive score calculated by the model. Besides, the results also reveal a noticeable reduction in major pollution elements in the Huai River Basin based on empirical research of the model, accompanied by effective improvements in water and air quality. However, the impact of WEC’s policy implementation on regional economic development is relatively limited. It is found that although the WEC’s policy implementation is in a favorable state, downstream cities of the Huai River Basin still exhibit a phenomenon of “free-riding”. Meanwhile, the WEC’s policy overlooks the focus on economic concerns and lacks robust legal safeguards. Therefore, this study further proposes constructive recommendations, including promoting collaborative governance between upstream and downstream areas, balancing environmental protection and economic development, and improving the legal system for the WEC.
1 Introduction
As the processes of industrialization and urbanization continue to accelerate, the degree of environmental pollution and ecological damage in various countries has intensified. Water resources, being crucial for both life and production, have been excessively exploited and utilized, resulting in the gradual deterioration of the ecological environment in water-dominated watersheds. This degradation has severely hindered the sustainable development of economies and societies worldwide. Numerous domestic and international scholars have conducted extensive research in response to environmental degradation in watersheds. For instance, Kang et al. investigated the cost profile of a collective action watershed investment plan in nature-based solutions (NBS) (Kang et al., 2023). Similarly, Jones employed a qualitative assessment to examine the impact of watershed air quality, biodiversity, population, and the surrounding environment on NBS (Jones et al., 2022). Law and other scholars conducted a comparative analysis of water quality changes in the Mississippi River and Atchafalaya River by integrating optimal management practices (Yeow Law et al., 2022). Geospatial methods were utilized by Patode et al., Suly et al., and Maryati et al. to develop and manage relevant watersheds (Patode et al., 2017; Maryati, 2018; Maryati et al., 2018).
WEC, as a modern and emerging method for ecological protection, has gained significant attention in this study. WEC started in the Catskill and Delaware River basins in the United States (Gouyon, 2003), and aims to balance ecological environment and economic development, promote collaborative governance between upstream and downstream regions, and become a key policy measure for protecting watersheds in many countries (Murray and Abt, 2001). However, challenges persist during the implementation of WEC policies for sustainability, including the lack of clear compensation standards between upstream and downstream regions and the absence of effective impact evaluation. To address these issues, both domestic and international scholars have been actively exploring and conducting research. Initially, the focus of research was primarily on establishing standards for ecological compensation. However, as the research progressed, scholars began to delve into evaluating the effectiveness of policy implementation regarding ecological compensation in watersheds. When it comes to researching ecological compensation standards in watersheds, quantitative methods have predominantly been utilized to determine the appropriate amount of compensation for each region within the watershed. For instance, Guan et al. used the information entropy method to create a complete pollutant distribution model and ecological compensation guidelines for watershed contamination through total pollutant control (Guan et al., 2016). The ecological compensation criterion for watersheds and municipal compensation funds was calculated using the ecosystem service value approach by Gao, Zhou, and Zhao (Gao et al., 2019; Zhao et al., 2021; Zhou et al., 2022). Yang et al. examined regional ecological footprints and estimated per-capita ecological footprints to develop the ecological compensation criterion (Yang et al., 2020). Secondly, when evaluating the effects of WEC policies, researchers commonly use qualitative and quantitative methods in watersheds. Riedl et al. (Riedl et al., 2009), Jost and Gentes et al. (Jost and Gentes, 2014), and Huang et al. (Huang, 2023) employed comparative analysis and field surveys to assess the effectiveness of WEC qualitatively. On the other hand, many scholars have utilized methods such as the fuzzy comprehensive evaluation of the analytic hierarchy process (AHP) and double in difference (DID) to evaluate the ecological compensation effects in different watersheds quantitatively. For example, Mcdermott et al. (Mcdermott et al., 2013) developed an evaluation system to assess the impact of ecological compensation on watershed stakeholders, considering distribution fairness, procedural fairness, and situational fairness. Zheng (Zheng et al., 2021a) and Wang (Wang et al., 2020) assessed ecological compensation in the Xin’an River Basin using the DID model and fuzzy comprehensive evaluation of AHP. Meng et al. (Meng et al., 2019) and Liu et al. (Liu et al., 2023) also created evaluation index systems and PMC index models to quantitatively evaluate WEC policy, including economic and social development, pollution emission monitoring, and governance.
This article selects the Huai River Basin in China as the research object based on the above research. Figure 1 shows that the Huai River Basin is located in eastern China, between the Yangtze River and the Yellow River, with a total drainage area of 27 km2. It flows through the four provinces of Henan, Anhui, Jiangsu, and Shandong (Hubei Province has a smaller area in the Huai River Basin and will not be considered for the time being). The mainstream originates from Tongbai Mountain in Henan Province, mainly flowing through Henan, Anhui, and Jiangsu provinces. The tributaries of the Yishusi River flow through Shandong and Jiangsu provinces.
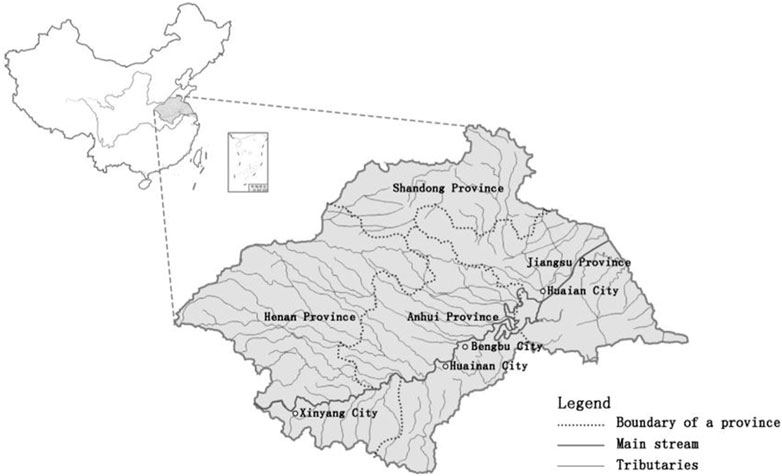
Figure 1. Geographic location map of the huai river basin.
The Huai River Basin has a favorable geographical location and rich natural resources. It is China’s main grain production area and has long been known as ‘the Yangtze River and Huai River are mature, and the world is sufficient’. Its importance to China’s ecological environment and economic development is self-evident. However, according to the Huai River Basin Water Conservancy Commission’s analysis of water quality monitoring results from 2009 to 2018 at 51 provincial boundary sections among the 47 inter-provincial rivers in the entire basin, the 10-year average showed no Class I water throughout the year, Class II water accounted for 6.6%, Class III water accounted for 26.8%, Class IV water accounted for 30.1%, Class V water accounted for 15.3%, and water inferior to Class V accounted for 21.1%. These results indicate the urgent need to improve the water quality of inter-provincial rivers in the Huai River Basin (Ahjj Aufe, 2020).
In summary, the existing research results on WEC are mostly limited to evaluation methods from a single perspective (Riedl et al., 2009; Mcdermott et al., 2013; Jost and Gentes, 2014; Wang et al., 2020; Zheng et al., 2021a; Huang, 2023). This article comprehensively analyses the policy’s impact from multiple perspectives, including subjective and objective. By cross-referencing the research results, the study ensures scientific rigor and objectivity. This study also examines the ecological compensation policy in the Huai River Basin to identify commonalities and characteristics of such policies across various river basins. The aim is to enhance the ecological compensation policy within the basin and increase its relevance and applicability in other regions. Based on the above, this study fills the gap in existing research. The contributions of this study are summarized below:
(1) To compensate for the inadequacy of previous researches that mainly focused on qualitative assessments of water quality, this study also examines the improvement in air quality within the basin to reveal the effects of the WEC policy.
(2) Compared with previous research, this study employs the fuzzy comprehensive evaluation of AHP to evaluate the policy’s implementation effectiveness subjectively and utilizes empirical research to objectively analyze the impact of the basin’s WEC on the ecological environment and economic development.
(3) This study evaluates China’s 2018 ecological compensation policy in the Huai River Basin to determine its positive effects on the watershed’s ecological environment and implementation issues for overcoming the current limitations of evaluation methods from a single perspective. The evaluation results will contribute to further improvements and broader adoption of WEC policies, ultimately significantly protecting the watershed ecological environment for sustainability (Li et al., 2022).
(4) This study analyzes the problems of WEC policy implementation and puts forward improvement suggestions to assist policymakers in optimizing and adjusting policies, improving implementation effects, and achieving ecological and environmental protection goals to the greatest extent.
2 Materials and methods
This section details the study’s materials and methods. The materials encompass the ecological environment and economic development. The research methods involve constructing a WEC policy effect evaluation model, which enables a comprehensive evaluation of the policy’s implementation.
2.1 Materials
In 2018, a cross-provincial ecological compensation mechanism was officially established in the Huai River Basin in China. To evaluate the effectiveness of the WEC policy’s implementation, this study compiled relevant data from 2016 to 2022 in the Huai River Basin to determine its impact on the ecological environment and economic development of the basin.
Firstly, to study the water quality in the Huai River Basin, Table 1 reports the data from surface water cross-section monitoring points controlled were collected by the national government for the years 2016–2022, and Table 2 reports the data on the proportion of water quality categories. The original data and its statistical charts are available in Supplementary Tables S1-S3; Supplementary Figures S1-S3). The pollution elements mainly include ammonia nitrogen (NH3-N), total phosphorus (TP), chemical oxygen demand (COD), and permanganate index (CODMn). These data were obtained from the China National Environmental Monitoring Center (website: http://www.cnemc.cn/, accessed on 9 August 2023). It should be noted that the data for national surface water quality in 2017 were not available in the China National Environmental Monitoring Center database, so the related data for water quality in the Huai River Basin in 2017 cannot be presented in this study.
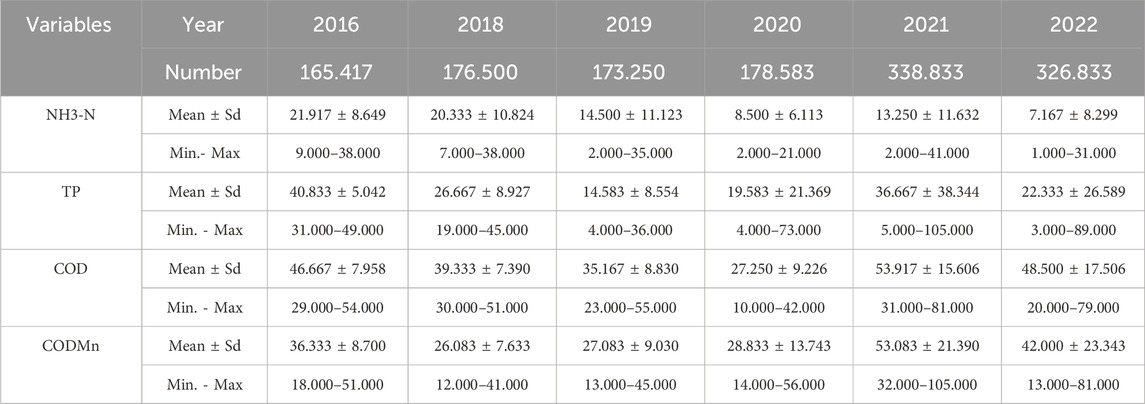
Table 1. Statistical data on exceedances of pollutant thresholds in monitoring sections.
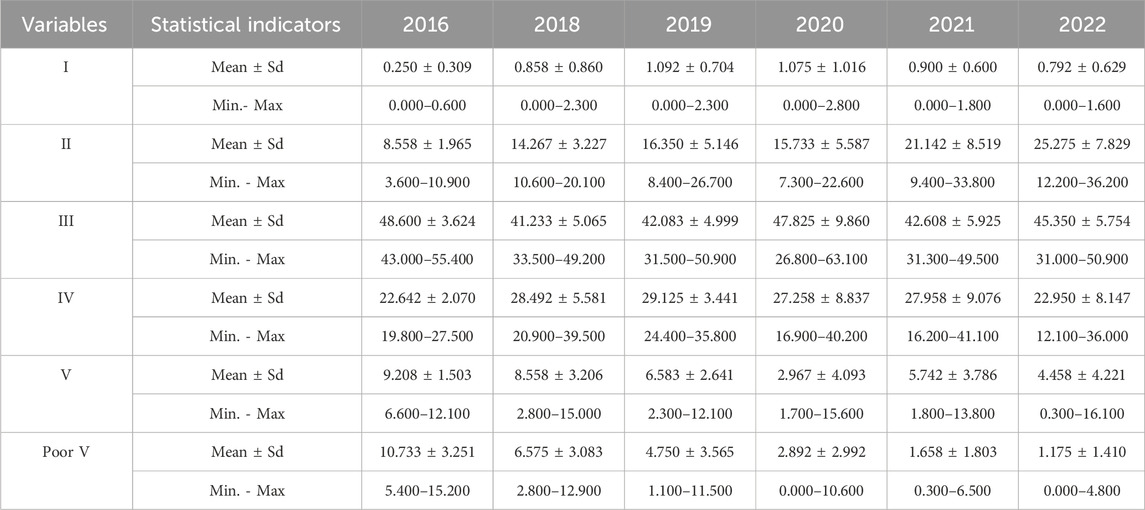
Table 2. Statistical data on water quality categories (from I to poor V) proportions.
Furthermore, implementing the WEC policy improves water quality and enhances the overall ecological environment, including the air quality in the Huai River Basin (Meng et al., 2019). For this reason, this study also examines the changes in the Air Quality Composite Index (AQCI) of key cities along the main stem of the Huai River from 2016 to 2022, providing an indirect reflection of the implementation effectiveness of the WEC policy. Table 3 reports the statistical data on AQCI from 2016 to 2022. The original data and statistical charts of Table 3 are available in the Supplementary Material. These data are sourced from the Ministry of Ecology and Environment of China, the China Environmental Monitoring Station, the Department of Ecology and Environment of Henan Province, and the Department of Ecology and Environment of Anhui Province (website: https://www.mee.gov.cn/, http://www.cnemc.cn/, https://sthjt.henan.gov.cn/, https://sthjt.ah.gov.cn/, accessed on 9 August 2023).
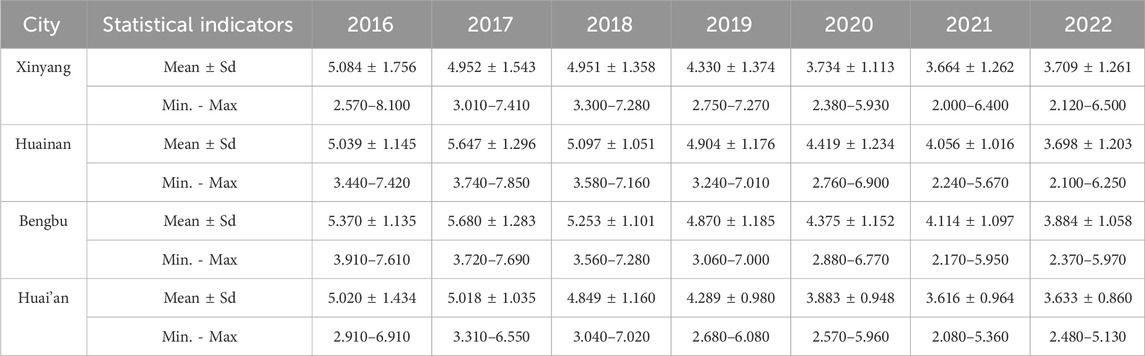
Table 3. Statistical data on AQCI.
Lastly, to investigate the impact of the WEC policy on the region, this study also selected relevant economic development data from specific areas within the Huai River Basin, including Xinyang City in Henan Province (located in the upstream region of the Huai River), Huainan City and Bengbu City in Anhui Province (located in the middle reaches of the Huai River), and Huai’an City in Jiangsu Province (located in the downstream region of the Huai River). Table 4 reports these cities’ economic development index statistics from 2016 to 2022. These data were sourced from the Statistical Yearbooks of Henan Province, Anhui Province, and Jiangsu Province (website: https://tjj.henan.gov.cn/, http://tjj.ah.gov.cn/, http://tjj.jiangsu.gov.cn/, accessed on 9 August 2023).
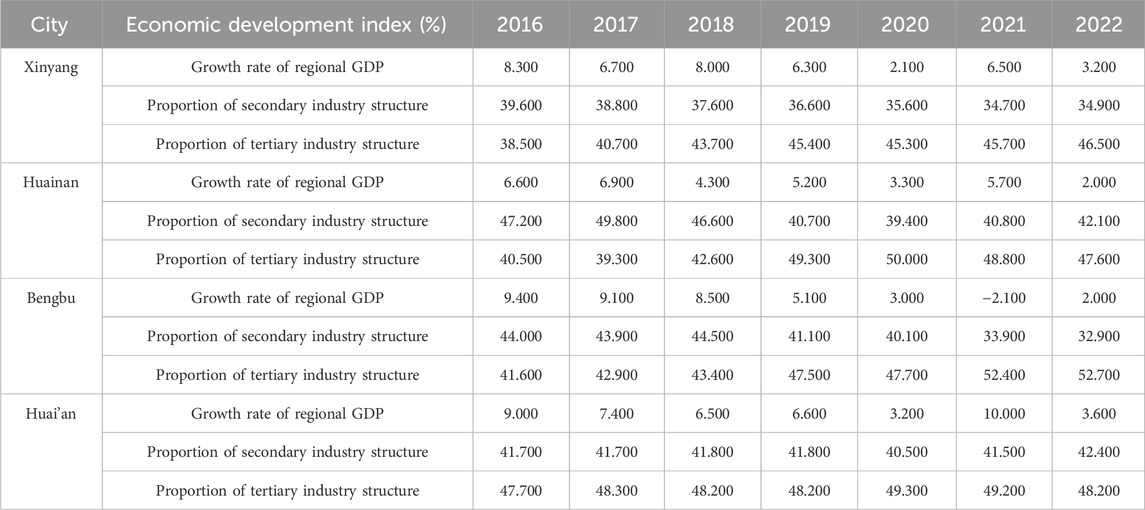
Table 4. Economic Development Statistics Index of each City.
2.2 Methods
Scholars have employed various analytical methods to evaluate the impact of WEC. However, On the one hand, the traditional DID model (Zheng et al., 2021a) may be too general, lacking the ability to examine specific indicators and uncover regional differences thoroughly. On the other hand, the AHP is primarily used to assign weights (Wang et al., 2020), but its subjectivity is strong, compromising its objectivity and scientific validity. Moreover, other methods, such as the fuzzy comprehensive evaluation of AHP (Zhu, 2020), the descriptive statistics (Zhang Z. et al., 2022), and the combination of AHP and the descriptive statistics (AHP + descriptive statistics) (Jiangyi and Shiquan, 2022a), also possess certain limitations. Hence, this article aims to adopt a more comprehensive approach by conducting subjective and objective analysis of specific indicators and elements for formulating corresponding policy initiatives that align with the unique characteristics of different regions.
Ma (Zheng et al., 2021a), Wang (Wang et al., 2020), Meng (Meng et al., 2019), and other researchers have constructed a comprehensive evaluation system that covers ecological, economic, social, policy, scientific, and other aspects. This article focuses on the two indicators, including the ecological environment and economic development, which are most closely related to the water environment of the watershed. Based on the above, an evaluation model is constructed for the effect of the WEC from a subjective and objective view.
Figure 2 shows the evaluation model structure of the WEC policy. Specifically, the evaluation model includes the comprehensive evaluation system and the empirical research analysis of WEC. The comprehensive evaluation system of WEC uses the fuzzy comprehensive evaluation of AHP to subjectively measure the comprehensive evaluation score of implementing ecological compensation policies in the Huai River Basin (Vargas, 1990). By subdividing the ecological environment and economic development indicators, a more accurate evaluation of the implementation effect of the ecological compensation policy in the Huai River Basin can be achieved. On the other hand, the empirical research analysis of WEC is conducted using descriptive statistical methods and these relevant indicators and elements. It aims to objectively analyze the water quality status and air quality in the ecological environment dimension of the Huai River Basin. Additionally, it examines the regional gross domestic product and the proportion of each industrial structure in the economic development dimension. Finally, the scores of the WEC comprehensive evaluation system are cross-validated with the objective findings of empirical research on WEC. This allows for a comprehensive evaluation of the effectiveness of the WEC policy.
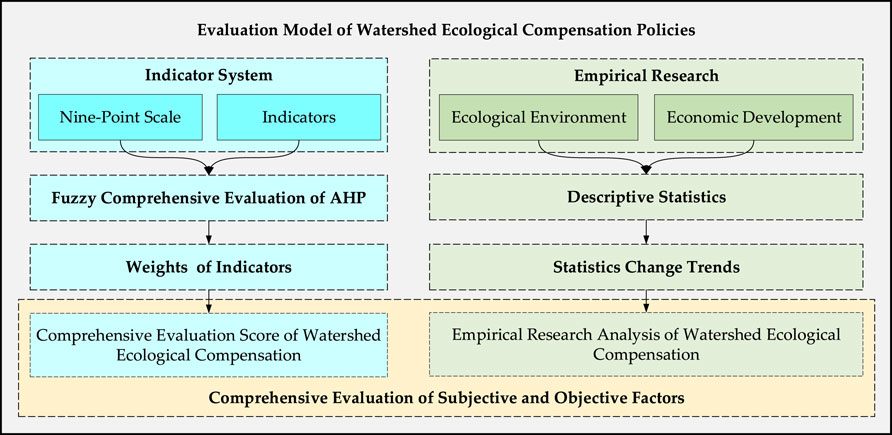
Figure 2. Evaluation model structure of the WEC policy.
2.2.1 Comprehensive evaluation system of WEC
Establishing the comprehensive evaluation system for WEC is based on the fuzzy comprehensive evaluation of AHP to establish indicators/elements and the weight of each indicator/element. Finally, a comprehensive score is calculated through consistency checks and element evaluation standards to evaluate the implementation effect of WEC. The fuzzy comprehensive evaluation of AHP is implemented online at SPSSAU, the website https://spssau.com/index.html.
• Establishment of a Comprehensive Evaluation System
Figure 3A shows the hierarchical structure diagram of the comprehensive evaluation system. Specifically, the comprehensive evaluation system is divided into three layers, including the objective, element, and indicator layers (Wang et al., 2021). The indicator layer further includes the two-dimensional alternatives of the ecological environment and economic development. The two-dimensional alternatives of the indicator layer in the hierarchy structure include the ecological environment and economic development, which are considered the most significant indicators that directly and indirectly affect the effectiveness of the WEC policy (Zhang J. et al., 2022). Subsequently, a refined evaluation is conducted under each dimensional alternative. However, the criterion of the element layer is crucial for the comprehensive evaluation system. For the ecological environment, the main criterion of indicators for evaluation is determined based on the ecological compensation documents of various provinces in the Huai River Basin, including the NH3-N and CODM (Zhang J. et al., 2022). Meanwhile, the implementation of the WEC policy can also improve the air quality in surrounding cities, making the AQCI an essential element for evaluating the effectiveness of policy implementation (Meng et al., 2019). For the criterion of economic development, the growth rate of regional gross domestic product is an important indicator for measuring the economic status and development level of a country or region (Wang et al., 2020). Therefore, it should be a criteria to consider. Besides, the growth rates of added value in the secondary and tertiary industries are used to evaluate the impact of policy implementation on these industries (Wang et al., 2020). Meanwhile, the growth rate of added value in agriculture can reflect the development status of industries closely related to the water environment (Meng et al., 2019). Based on the above, the criterion of economic development includes the growth rate of regional gross domestic product, the growth rates of added value in the secondary and tertiary industries, and the growth rate of added value in agriculture.
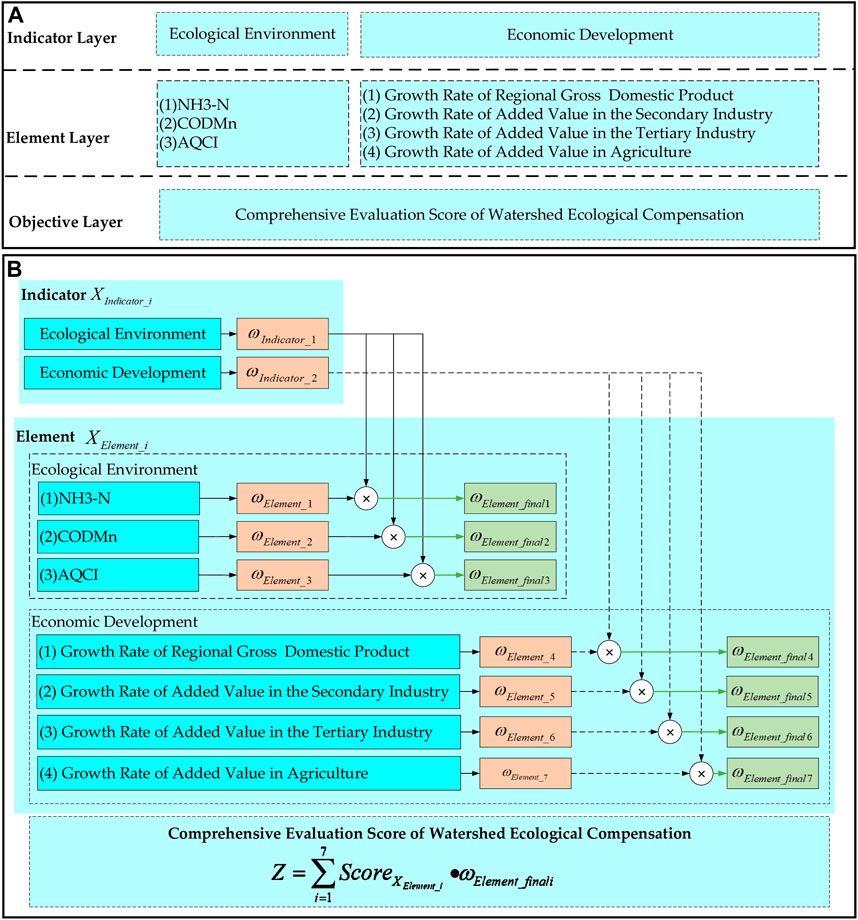
Figure 3. Hierarchical Structure Diagram of Comprehensive Evaluation System. (A) Comprehensive evaluation system of WEC; (B)Calculation process of comprehensive evaluation score for WEC.
Figure 3B shows that the final score calculation process of the comprehensive evaluation system is based on the hierarchical structure. Specifically, the judgment matrices of the indicators and elements should be constructed, respectively. Then, the weight of the indicators and elements (
The typical nine-point scale in AHP and questionnaire surveyed by experts in WEC are adopted to construct the following judgment matrices (Vargas, 1990). Table 5 reports the nine-point scale and its meaning in the fuzzy comprehensive evaluation of AHP. Specifically, the indicator score of the ecological environment and economic development are generated based on the typical nine-point scale and their questionnaire surveys. Then, the first judgment matrix of the indicator layer is constructed based on the indicator score of the ecological environment and economic development. Last, the weight of the ecological environment and economic development (
• Consistency Check and Sensitivity Analysis
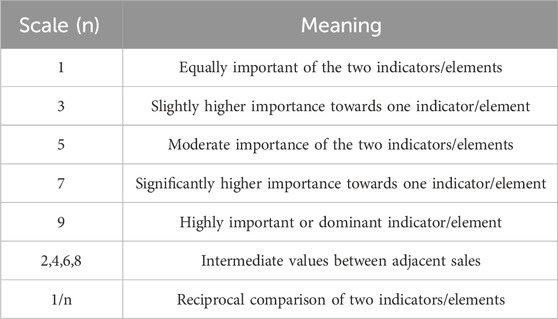
Table 5. Nine-point scale and its meaning in the fuzzy comprehensive evaluation of AHP.
To verify the rationality of the obtained weight distribution, the study calculates the maximum eigenvalue λmax of the these constructed judgment matrices, respectively. Consistency checks are performed using the consistency index CI (Eq. 1), random consistency index RI, and consistency ratio CR (Eq. 2) to ensure logical consistency in the judgment process (CSDN, 2023). Specifically, if CR < 0.1, the constructed judgment matrix is considered acceptable in terms of consistency. However, if CR ≥ 0.1, it indicates that the constructed judgment matrix is inconsistent, and adjustments need to be made to the indicators/elements’ importance until the criterion of CR < 0.1 is satisfied.
The weights of indicators and elements are used to further conduct sensitivity analysis on the indicator variables by Yaahp10.1 software to demonstrate how weight changes impact the overall evaluation results and enhance the understanding of the significance of each variable (indicator and element) in the comprehensive evaluation process of WEC.
• Calculation of the Comprehensive Score for Evaluation Elements
To comprehensively analyze the effects of WEC in different cities and years, this study standardized the raw data obtained in Tables 1–4. The evaluation level for NH3-N and CODMn is established based on the ‘Groundwater Environmental Quality Standards’, while the evaluation level for the AQCI is based on the ‘Technical Regulations for Environmental Air Quality Index (Trial Implementation) '. Since no fixed levels exist for the four elements of economic development indicators, this study used a linear transformation standardization method (Meng et al., 2019). Specifically, this method defined the raw data within a specific range using the maximum and minimum values of the element variables, thereby eliminating the influence of dimensions and scales. The advantage of this standardization method is its convenience in calculating and retaining the original relative ranking relationship. Each standardized element value
Specifically, the mathematical expression of the linear transformation standardization method is given by Eq. 3 as follows:
Where
According to the fuzzy comprehensive evaluation of AHP, the final weight of each element
Where
Finally, the comprehensive score of ecological compensation evaluation for each city is calculated by combining the final weight of each element
Where Z represents the comprehensive score of ecological compensation evaluation, i represents the seven elements,
2.2.2 Empirical research analysis of WEC
Empirical research on WEC uses descriptive statistics to visualize data in charts so that the researcher can intuitively feel the changes in the data.
• Descriptive Statistics of the Ecological Environment
This study initially collected and analyzed monitoring data from the monitoring section of the Huai River Basin using descriptive statistics methods (refer to Tables 1 and 2). To avoid biases caused by outliers and better reflect the data’s accuracy, the study chose to visualize the data using violin plots proposed by Hintze (Hintze and Nelson, 1998). The proportion of water quality categories further demonstrates the effectiveness of implementing the WEC policy on water environmental management. Therefore, bar charts were selected to visualize the data, providing a more intuitive analysis of the annual changes in water quality in the Huai River Basin.
Furthermore, to demonstrate the effectiveness of the policy implementation further, this study conducted a comparative analysis of the changes in air quality among cities along the mainstream of the Huai River. The environmental air quality is reflected by the AQCI, where a higher value indicates a higher level of pollution. According to the calculation method provided by the China Environmental Monitoring Station for the AQCI (CNEMC, 2023), the individual indices Ii for each pollutant i are calculated first, followed by the calculation of the Isum. Specifically, the Equations (7) and (8) are as follows:
Where i includes all six indicators (SO2, NO2, PM10, PM2.5, CO, and O3), Ci represents the concentration value of pollutant i. When i is SO2, NO2, PM10, and PM2.5, Ci represents the monthly average value. When i is CO and O3, Ci represents the concentration value at a specific percentile. Si represents the annual average secondary standard for pollutant i. For CO, it is the daily average secondary standard. Besides, for O3, it is the 8-h average secondary standard.
• Descriptive Statistics of Economic Development
To investigate the impact of the WEC policy on regional economic development, this study focused on four main cities located along the mainstream of the Huai River: Xinyang City in Henan Province, Huainan City, and Bengbu City in Anhui Province, and Huai’an City in Jiangsu Province. Data on the annual growth rate of regional gross domestic product and the proportion of secondary and tertiary industries from 2016 to 2022 were collected, referring to Table 4. Line charts were utilized to visually represent and compare the data for each year and city in the Results section (Figure 6).
3 Results
This section provides a detailed report on the experimental results of WEC’s comprehensive evaluation system and empirical research analysis, as well as the comparative results of this research method and other methods.
3.1 Analysis results of the comprehensive evaluation system for WEC
Table 6 reportss that the ecological environment has a higher total weight proportion than economic development. This indicates that the WEC policy places greater emphasis on ecological benefits. The combined final weight of the main pollution elements affecting water quality, such as NH3-N and CODMn, within the elements layer, is 0.485 (0.232 + 0.253), the highest value. This reflects that water quality improvement is the most important and closely monitored elements in implementing the WEC policy, followed by the AQCI. However, the final weights assigned to indicators reflecting economic development are relatively small. The final weights for elements such as regional gross domestic product, added value in the secondary industry, added value in the tertiary industry, and added value in agriculture growth rates are all less than 0.1. Overall, this indicates that implementing the WEC policy focuses more on improving ecological benefits. Currently, the policy design primarily aims to enhance water quality, focusing less on economic effects.
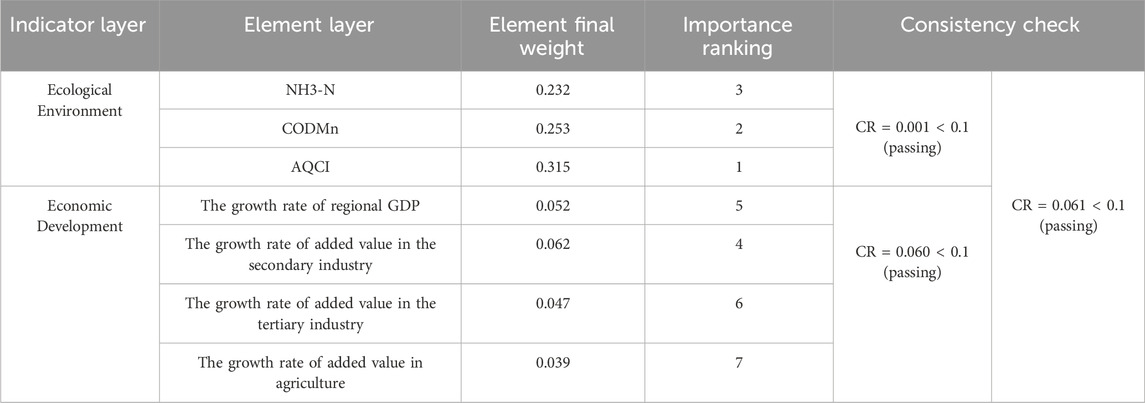
Table 6. Evaluation element weight of WEC.
Figure 4A visually shows that the weight values of indicators and elements in the comprehensive evaluation system of WEC, as well as the final weight values of elements are calculated based on Eq. 6. Figure 4B shows that the change point of the red vertical line is 0.404, indicating that changes in the weight of the ecological environment do not affect the evaluation results within the range of 0.404–1.000. The ecological environment is always more important than economic development for the evaluation of WEC. In Figure 4C, the change point of the red vertical line is 0.669, indicating that changes in the weight of economic development within the range of 0.669–1.000 do not affect the evaluation results. Therefore, the weight results of ecological environment indicators have a more stable impact on the evaluation results of WEC.
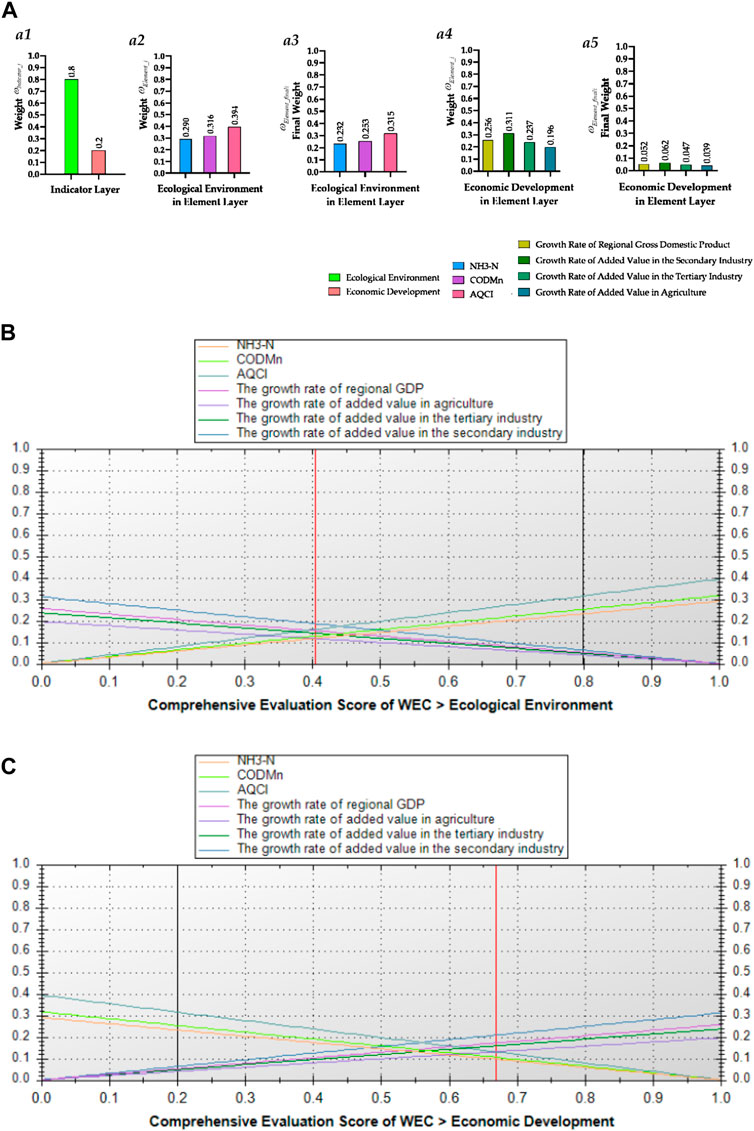
Figure 4. Graphic and Change Chart of Weight. (A) The weight values of indicators and elements in the comprehensive evaluation system of WEC: (a1) The weight value of indicators, (a2) The weight value of the ecological environment in element layer, (a3) The final weight value of ecological environment in element layer, (a4) The weight value of the economic development in element layer, (a5) The final weight value of economic development in element layer; (B) Changes in the weight of ecological environment indicators, (C) Changes in the weight of economic development indicators. In Figures b and c, the intersection of the black vertical line and the horizontal axis represents the indicator weight of the actual result; the intersection of the red vertical line and the horizontal axis is the point where the indicator weight changes, indicating that the evaluation result will not easily change within the range from this point to 1.0.
Table 7 reports the evaluation level for elements. In addition, Table 8 reports the comprehensive evaluation score for evaluating the implementation of the WEC policy for the four selected cities from 2016 to 2022. Due to the heterogeneity among cities, WEC scores vary. However, after the policy implementation year in 2018, with the effect year being 2019, the comprehensive evaluation scores for WEC gradually increased for each city. During this period, there may have been a lag in policy effects, resulting in relatively small changes in the scores. However, significant improvements were observed after 2020, with the comprehensive evaluation scores reaching around 3.8, indicating a relatively good evaluation of the implementation effectiveness of the WEC policy.
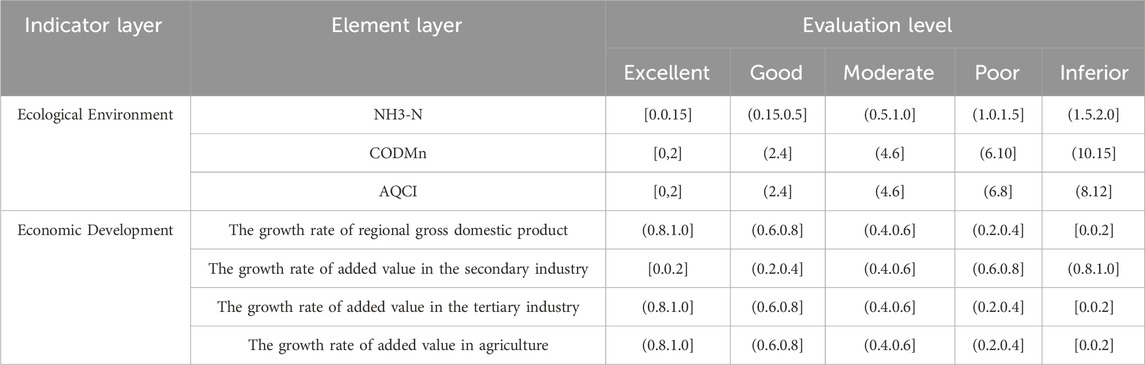
Table 7. Score range and evaluation level.
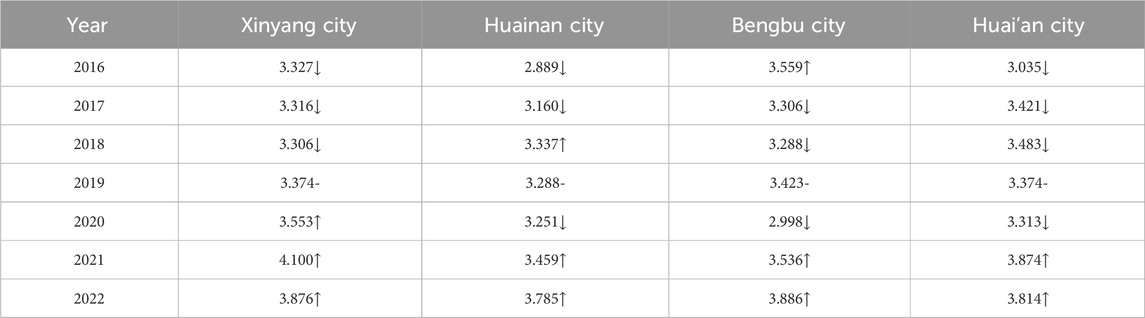
Table 8. Comprehensive evaluation score of WEC.
3.2 Descriptive Statistical Results of WEC
Based on the research data in Table 1–4, this section objectively examines the impact of implementing the WEC policy on the ecological environment and economic development. It addresses the subjective limitations of the conclusions obtained through the fuzzy comprehensive evaluation of AHP. Furthermore, it conducts in-depth research on the implementation effects of WEC.
3.2.1 Ecological environment
Figure 5 shows the trends in water quality indicator exceedances and proportions of water quality categories from 2016 to 2022, as well as the trends in AQCI for various cities from 2016 to 2022.
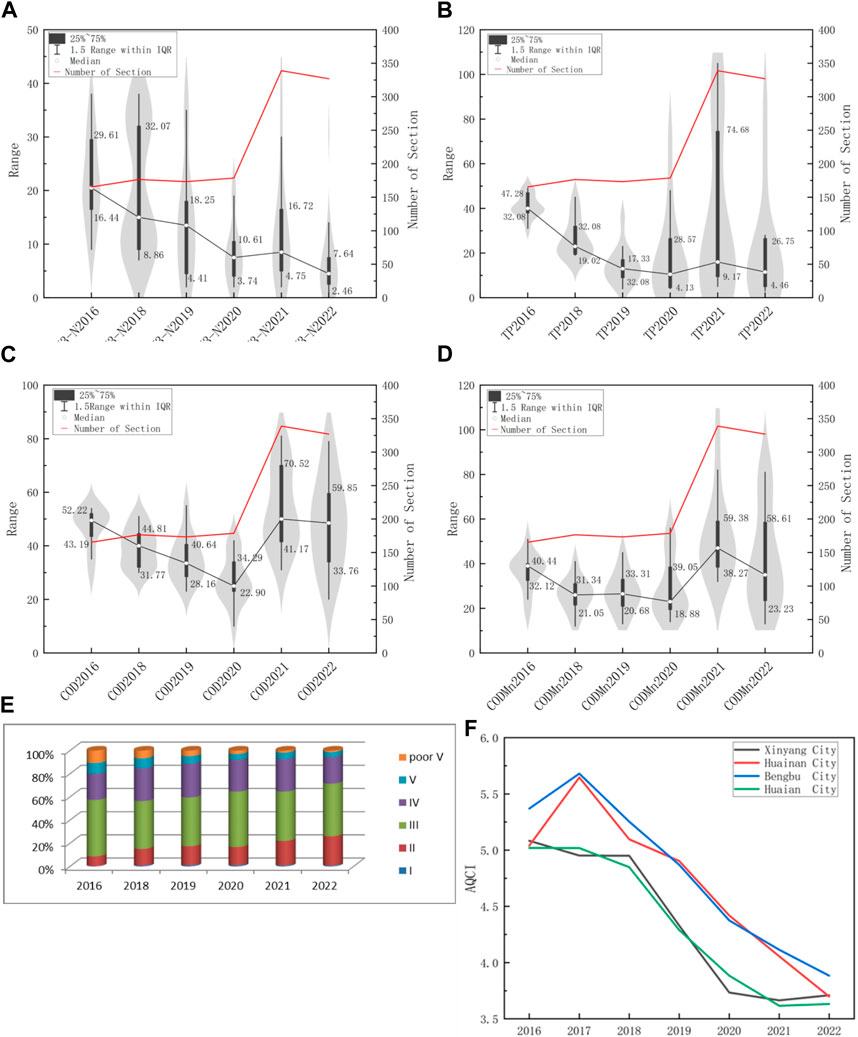
Figure 5. Statistics Result of Ecological Environment Elements. (A) Trends in the number of NH3-N exceedances; (B) Trends in the number of TP exceedances; (C) Trends in the number of NH3-N exceedances; (D) Trends in the number of NH3-N exceedances; (E) Trend in the proportions of water quality categories; (F) Trends in AQCI for various cities. In the violin plot, the white dots represent the median, the black boxes indicate the 25th to 75th quartile range, the black lines represent the minimum and maximum values, and the red line represents the number of monitoring sections in the Huai River Basin each year. Due to the increase in the number of monitoring sections in the Huai River Basin in 2021, the values of each pollution indicator have fluctuated.
Specifically, Figures 5A, B illustrate the annual trends of NH3-N and TP exceedances in water quality. These exceedances can lead to eutrophication and the death of aquatic organisms. A higher number of exceedances indicates a more severe water pollution level. The figures show a decreasing trend in the median and quartiles of NH3-N and TP from 2016 to 2022. The decrease in NH3-N is particularly significant, remaining below ten since 2020, indicating effective control of NH3-N in water quality. The median of TP exceedances also shows an overall decreasing trend, with the lower quartile dropping below single digits, suggesting effective control of TP in the Huai River water quality. In addition, Figures 5C, D depict the annual trends of COD and CODMn exceedances. COD is an important ecological indicator, with higher levels indicating more severe pollution. CODMn monitors the total amount of pollutants and is crucial for environmental recovery. A higher CODMn value indicates higher organic pollution in the water (Zhang Z. et al., 2022). From 2016 to 2020, the median and quartiles of COD and CODMn exhibit a general decreasing trend. Although the data for COD and CODMn fluctuated in 2021 due to the increase in monitoring sections, the median of COD still shows a clear downward trend, and there is overall improvement in CODMn.
Figure 5E displays the annual trends of proportions for different water quality categories. According to the ‘Surface Water Environmental Quality Standards of the People’s Republic of China’, Class I, II, and III waters are suitable for daily water supply, while Class IV, V, and inferior Class V waters are typically used for industrial and non-direct contact recreational purposes due to their lower water quality (MEE, 2023). From 2016 to 2018, Class I water was stable, with a slight increase in Class II water, a decrease in Class III water, and an increase in Class IV, V, and inferior Class V waters, with a slight decrease in inferior water quality. After 2018, the proportion of Class I water remained steady, while Class II and III waters gradually increased. In contrast, the proportions of Class IV, V, and inferior Class V waters decreased annually, indicating an improvement in water environmental quality in the Huai River Basin.
Figure 5F shows that the AQCI values for the four cities were relatively high from 2016 to 2018, indicating a high level of air pollution. However, starting in 2018, there was a significant downward trend in the AQCI values for all four cities, indicating that implementing WEC policies has substantially improved air quality.
3.2.2 Economic development
Based on the statistical data mentioned in Table 4, the following figures show the trends in gross domestic product growth rates and the proportion of secondary and tertiary industries in the four cities.
Figure 6A shows that the growth rates of regional GDP for various cities remained relatively stable from 2016 to 2018. From 2018 to 2020, there was a slight slowdown in the growth rates of regional GDP, and after 2020, different cities experienced fluctuations in the growth rates of regional GDP. This indicates that implementing WEC policies, which include reducing industrial pollution and promoting the green transformation of enterprises to protect the ecological environment, impacts local economic development. However, the economic performance of each city is influenced by factors such as geographical location, policy conditions, and cultural literacy, which contribute to heterogeneity. Therefore, the implementation of WEC policies does not show a close and direct correlation with the economic development of cities.
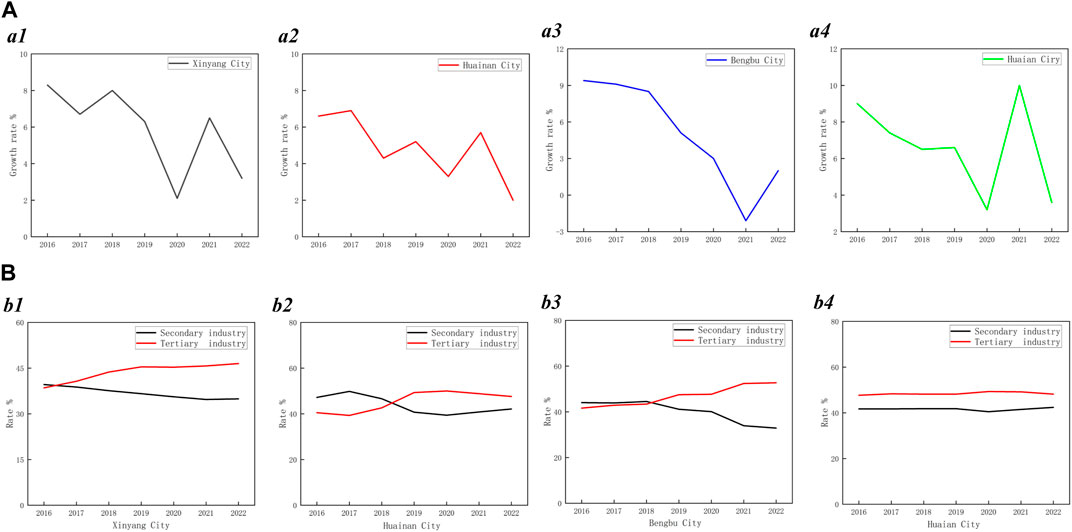
Figure 6. Trends in the Economic Development Elements for Various Cities. (A) Trends in the growth rate of regional GDP for various cities: (a1) Trends in the growth rate of regional GDP in Xinyang City, (a2) Trends in the growth rate of regional GDP in Huainan City, (a3) Trends in the growth rate of regional GDP in Bengbu City, (a4) Trends in the growth rate of regional GDP in Huaian City; (B) Trends in the Proportion of Secondary and Tertiary Industries for Various Cities: (b1) Trends in the Proportion of Secondary and Tertiary Industries in Xinyang City, (b2) Trends in the Proportion of Secondary and Tertiary Industries in Huainan City, (b3) Trends in the Proportion of Secondary and Tertiary Industries in Bengbu City, (b4) Trends in the Proportion of Secondary and Tertiary Industries in Huaian City.
Figure 6B demonstrates that there have been significant changes in the proportion of the secondary and tertiary industries for upstream city Xinyang and midstream cities Huainan and Bengbu since 2018, indicating a gradual transition towards the tertiary industry. A higher proportion of the tertiary industry reflects faster social progress and development. It also implies a significant reduction in pollution emissions caused by the primary and secondary industries, indirectly promoting and improving the watershed’s ecological environment. Conversely, for the downstream city Huai’an, there is minimal fluctuation in the proportion of the secondary and tertiary industries. This suggests that the impact of WEC policies on the industrial structure of downstream cities is relatively minor.
Table 9 compares the results of our proposed method with those of other previous methods. Furthermore, it fully demonstrates the superiority of our method over other previous methods. Among them, the AHP focuses on accurately calculating the weight, but it appears one-sided and highly subjective regarding target evaluation. Although the fuzzy comprehensive evaluation of AHP is an improvement on AHP and evaluates the target, there is still a certain degree of subjectivity. Descriptive statistics are based on objective data and provide an objective evaluation of policy effects but ignore the subjective perspective of policy implementation. On the other hand, although the combination of AHP and descriptive statistics combines subjective and objective evaluations, the AHP focuses on accurately calculating the weight, making AHP + descriptive statistics biased toward objectivity as a whole. The method we proposed reflects the actual effect of policy implementation more comprehensively and reliably through the cross-validation of the comprehensive score of the fuzzy comprehensive evaluation of AHP and empirical research on descriptive statistics.
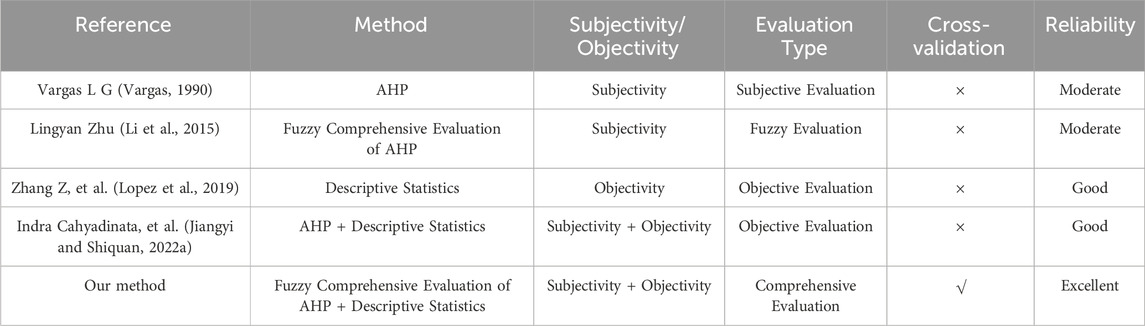
Table 9. Comparison of our proposed method with other methods.
4 Discussion
The WEC policy is different from other watershed management plans. It is a clear policy orientation that uses systems to manage and protect the ecological environment of the watershed. Compared to other methods, this paper presents a WEC policy effect evaluation model, aiming to evaluate the implementation effect of the policy systematically. Unlike previous evaluation methods that focus solely on a single perspective, this article thoroughly investigates the actual impact of the policy from both subjective and objective perspectives. Scientific rigor and objectivity are ensured by mutually confirming the research results.
The comprehensive evaluation results indicate that the WEC policy has yielded positive effects in numerous aspects. However, the implementation process has also revealed specific issues that need further attention and resolution. This article aims to provide valuable reference and guidance for future watershed management through in-depth analysis.
4.1 Positive effects of WEC policies
According to the results of the comprehensive evaluation system for WEC and experimental research, the positive effects brought about by the implementation of the policy include improving the overall ecological environment of the basin and promoting the green development of the regional industrial structure.
4.1.1 Improvement of the overall ecological environment in the watershed
China’s vast watersheds form a cohesive natural region from source to mouth. To manage, the region is artificially divided into upstream, midstream, and downstream areas, there has been independent decision-making, inconsistent pollution control measures, and shifting responsibilities among local governments regarding economic development and environmental governance. As a result, the ecological environment in the watershed has not been effectively improved (Lopez et al., 2019).
However, the implementation of the WEC policy has shown positive outcomes. Figure 5 demonstrate that key pollution indicators, including NH3-N, TP, COD, and CODMn, have significantly decreased during the policy’s implementation. Moreover, the proportion of Class I water quality to Class III water has gradually increased, indicating an overall improvement in the watershed’s water quality. And the AQCI index decreased. This indicates that the WEC policy takes a holistic approach to governing the watershed, overcoming the contradiction between administrative divisions and geographical divisions, and effectively enhancing the overall ecological environment of the watershed. Meanwhile, the WEC policy also offers an alternative approach to addressing water conflicts in transnational basins (Wang and Nuppenau, 2021; Yuan et al., 2023). This policy effectively promotes the collaborative protection of the ecological environment in transnational basins.
4.1.2 Promotion of green development in regional industrial structure
Pollution resulting from primary industry agriculture and secondary industry significantly impacts water quality. To address the water resource contamination caused by agriculture and industry, He et al. (He et al., 2023) and Zhang et al. (Zhang et al., 2023) have proposed specific solutions that offer valuable insights for the concrete implementation of WEC policies. The increase in the proportion of the tertiary industry, a green service-oriented industry, signifies faster social progress and development. It also indicates a decrease in pollution emissions from the primary and secondary industries, such as agriculture and industry, thereby promoting improving the ecological environment in the watershed. Figure 6B demonstrates that after the implementation of the policy, the proportion of the secondary industry in Xinyang decreased from 37.6% in 2018 to 34.9% in 2022, while the proportion of the tertiary industry increased from 43.7% in 2018 to 46.5% in 2022. Similar trends were observed in Huainan and Bengbu. It is evident that the implementation of the WEC policies, focusing on water pollution control, primarily aims to reduce agricultural and industrial wastewater discharge from the primary and secondary industries. This, in turn, promotes the green development of the regional industrial structure, facilitates the transition from pollution-intensive enterprises to environmentally friendly ones, and achieves the green development of industries (Guo et al., 2021a).
This study shows that the WEC policy not only relies on technical means to reduce pollution emissions and control environmental pollution (Meng et al., 2019; Huang, 2023; Liu et al., 2023) but can also comprehensively optimize the watershed by promoting the green transformation of polluting enterprises and standardizing the management of agricultural pollution behaviors. These findings can provide valuable experience and an essential reference for other regions when implementing WEC policies.
4.2 New issues and countermeasures in the implementation of WEC policies
Based on the results of the comprehensive evaluation system for WEC and experimental research, the implementation process of the WEC policy also uncovers new problems that require urgent solutions. For this reason, this article proposes corresponding suggestions.
4.2.1 The “free-riding” phenomenon in downstream cities
The “free-riding” phenomenon is when an activity generates externalities. Externalities are non-market effects caused by the economic activities of an entity on others and society (Gui et al., 2022). In WEC, the “free-riding” phenomenon specifically refers to upstream cities sacrificing the environment for economic development, resulting in river pollution that affects the ecological environment of downstream cities without incurring any costs. It can also occur when upstream cities achieve significant pollution control, and downstream cities enjoy the remediation benefits without incurring any costs. Although the WEC policies provide financial compensation to downstream cities for the pollution control efforts of upstream cities, the approach should be based on a watershed unit with coordinated governance between upstream and downstream and shared responsibilities. While upstream cities should take responsibility for pollution control, downstream cities should also fulfill their obligations to protect the ecological environment of the watershed rather than shifting the responsibility solely to upstream cities.
Figure 6B indicates that mid- and upper-stream cities have adjusted their urban industrial structure to reduce pollution and improve watershed ecology since the policy was implemented. Huai’an City, downstream, has not made similar adjustments and seeks maximum environmental benefits at minimum cost. This “free-riding” harms collective interests and reduces other cities’ governance enthusiasm, leading to a decline in WEC’s overall efficiency.
Therefore, to effectively implement WEC policies in watersheds, it is crucial to promote collaborative governance between the upstream and downstream areas. The WEC policy requires coordination of environmental governance activities based on the watershed rather than simply transferring responsibilities and obligations to the midstream and upstream cities through financial compensation (Zheng et al., 2021b). Watershed governance should focus on enhancing the awareness of environmental responsibility among all entities involved while also considering each city’s specific development situations and regional differences. To achieve this, it is recommended that compensation be increased and the self-development capacity of the upstream area be improved (Yu and Chen, 2020). Doing so can establish a fair, reasonable, and sustainable ecological compensation mechanism for the watersheds (Huang et al., 2022). In addition, the “free-riding” behavior in WEC has not received sufficient attention in research on other watershed areas (Yu and Chen, 2020; Guo et al., 2021a; Zhou et al., 2022; Huang, 2023; Liu and Yuan, 2023). This article reveals this issue through in-depth research to provide specific guidance and references for implementing WEC policies in other watershed areas.
4.2.2 Lack of focus on regional gross domestic product in the policy
According to Table 6, the fuzzy comprehensive evaluation of AHP reveals that regional gross domestic product is given relatively less weight in the WEC policy. Additionally, empirical research presented in Figure 6A indicates that the policy’s implementation has a limited impact on the regional gross domestic product, both upstream and downstream. Regional gross domestic product is a critical factor in measuring regional economic development, suggesting a lack of emphasis on economic development in the policy. However, focusing solely on improving the ecological environment of the watershed without considering economic development can result in unclear definitions of compensation standards and excessive financial burdens on upstream cities (Liu and Yuan, 2023). This, in turn, can reduce the motivation for effective watershed governance, which contradicts the original intention of the policy. As a result, the WEC policy becomes a mere formality, and the contradiction between environmental protection and economic development will deepen.
Therefore, it is crucial to clarify the contradictory relationship between environmental environment and economic development and strive for a balance between the two. When implementing WEC policies in any region, attention should be given to improving the watershed’s ecological environment and the local economic development conditions. This will ensure better policy implementation. The central and local governments should strengthen the ecological transfer payments between the upstream and economically underdeveloped regions to stimulate and enhance the motivation for local watershed water and environmental governance (Guo et al., 2021b). On the other hand, local governments should transform and upgrade high-pollution and high-emission enterprises or facilitate the transition from pollution-intensive enterprises to environmentally friendly ones. They should also increase investment in green industries and develop green agriculture, tourism, and other environmentally friendly industries (Quan et al., 2023). In summary, it is necessary to continuously optimize the industrial structure to promote the development of green industries. This approach ensures the green development of the economy while addressing environmental pollution and achieving harmony between the ecological environment and economic development.
4.2.3 Lack of robust legal safeguards in the policy
Since 2012, China has launched several crucial ecological compensation deployments, showing its commitment to environmental conservation and economic growth. These measures have been implemented in many Chinese provinces. As ecological compensation programs are explored, legal construction delays have caused policy implementation challenges. China has yet to establish dedicated laws and regulations for ecological compensation, so the current regulations are scattered across normative documents issued by various provinces, resulting in a lack of uniformity and an incomplete legal structure (Deng et al., 2023). Despite other provinces’ attempts, the Huai River Basin ecological compensation policy is less hierarchical and less enforceable. Assume WEC regulations are policy-level without strong legal safeguards. It will hinder WEC implementation and sustainability.
Therefore, it is recommended that the legal system for ecological compensation be improved and that a long-term operating mechanism for WEC be established. Firstly, at the legislative level, efforts should be made to draft the “Ecological Compensation Law” to clarify ecological compensation standards, methods, and related rights and obligations in different regions. Alternatively, an update and amendment to the “Environmental Protection Law” could include specific provisions for ecological compensation. Local regulations and rules should also specify the obligations and responsibilities of ecological compensation entities in each province or city, providing legal guarantees for the standardized operation of ecological compensation. Secondly, at the institutional level, further refinement of legal provisions is needed. National and local ecological compensation rules and implementation details should be developed based on the development conditions of different regions, gradually forming a legal system for ecological compensation (Jiangyi and Shiquan, 2022b). The aim is to eliminate the problem of a lack of clear guidance in the practical operation of WEC (Wang et al., 2020; Huang, 2023).
4.3 Limitations
First, study data has limitations. The 2017 water quality data on the China Environmental Monitoring Station website was unavailable during data collection for the Huai River Basin. This affects the qualitative study of policy effects before and after adoption. Second, the fuzzy comprehensive evaluation of AHP has limits. This study used the fuzzy comprehensive evaluation of the AHP method to evaluate WEC policies and assigned values using a questionnaire for experts. However, in situations where obtaining reliable data is challenging, decision-makers may have to rely on subjective judgment based on their experience, potentially impacting the scientific and objective nature of the research outcomes and needing further objective confirmation. Finally, descriptive statistics and empirical research have limitations. Personal knowledge limits lead to overlooking some impacting elements and other possibilities. Some figures and tables in this study needed further improvement due to visual tool limitations.
5 Conclusion
This study evaluated the implementation effects of WEC policies in the Huai River Basin by constructing an evaluation model. The evaluation was conducted from both subjective and objective perspectives. Firstly, the subjective aspect of the evaluation model employed the fuzzy comprehensive evaluation of AHP to calculate comprehensive evaluation scores for each city after policy implementation. The obtained scores were generally above the moderate evaluation level (Table 8), indicating a positive overall evaluation of the ecological compensation policy’s results in the Huai River Basin. Secondly, in the objective aspect of the evaluation model, empirical research using descriptive statistical methods demonstrated that the WEC policy had a significant positive impact on water quality, air quality, and the greening of industries. However, its influence on regional economic development was relatively limited. Therefore, both subjective and objective perspectives confirm that the implementation of the ecological compensation policy in the Huai River Basin has had a positive effect on protecting the regional ecological environment. However, there are still challenges in the policy implementation process, such as downstream cities engaging in “free-riding” neglecting economic development considerations, and lacking robust legal safeguards. Based on these findings, this study recommends that policy implementation should prioritize promoting coordinated governance between upstream and downstream regions, striking a balance between environmental environment and economic development, and establishing a robust legal system for WEC. These recommendations aim to advance the WEC mechanism in China further and globally, contributing to preserving Earth’s watershed ecosystems for sustainability.
Data availability statement
The original contributions presented in the study are included in the article/Supplementary Material, further inquiries can be directed to the corresponding author.
Ethics statement
Ethical review and approval was not required for the study on human participants in accordance with the local legislation and institutional requirements. Written informed consent from the (patients/ participants or patients/participants legal guardian/next of kin) was not required to participate in this study in accordance with the national legislation and the institutional requirements.
Author contributions
KX: Investigation, Methodology, Resources, Software, Validation, Writing–review and editing, Formal Analysis, Writing–original draft. YY: Conceptualization, Data curation, Funding acquisition, Investigation, Methodology, Project administration, Resources, Software, Supervision, Validation, Visualization, Writing–review and editing. ZH: Formal Analysis, Software, Validation, Visualization, Writing–review and editing.
Funding
The author(s) declare that no financial support was received for the research, authorship, and/or publication of this article.
Conflict of interest
Author YY was employed by Shenzhen Lanmage Medical Technology Co., Ltd.
The remaining authors declare that the research was conducted in the absence of any commercial or financial relationships that could be construed as a potential conflict of interest.
Publisher’s note
All claims expressed in this article are solely those of the authors and do not necessarily represent those of their affiliated organizations, or those of the publisher, the editors and the reviewers. Any product that may be evaluated in this article, or claim that may be made by its manufacturer, is not guaranteed or endorsed by the publisher.
Supplementary material
The Supplementary Material for this article can be found online at: https://www.frontiersin.org/articles/10.3389/fenvs.2024.1344942/full#supplementary-material
References
Ahjj Aufe (2020). Suggestions for accelerating the construction of the ecological compensation mechanism in the Huai River Basin. Available at: http://ahjj.aufe.edu.cn/2020/1216/c11831a162869/page.htm (Accessed on August 3, 2023).
CNEMC (2023). China environmental monitoring center. Available at: http://www.cnemc.cn/jcbg/kqzlzkbg/201711/P020181010529633156640.pdf (Accessed on August 10, 2023).
CSDN (2023). Analytic hierarchy process. Available at: https://blog.csdn.net/qq_40675416/article/details/100013276 (Accessed on August 5, 2023).
Deng, M. H., He, Z. E., Chenge, S. C., and Zheng, H. B. (2023). Evaluation effect of watershed ecological compensation based on improved SobolSSA-ANP in the Taihu basin. South-to-North Water Transfers Water Sci. Technol. 21 (1), 148–159. [in Chinese]. doi:10.13476/j.cnki.nsbdqk.2023.0016
Gao, X., Shen, J., He, W., Sun, F., Zhang, Z., Zhang, X., et al. (2019). Changes in ecosystem services value and establishment of watershed ecological compensation standards. Int. J. Environ. Res. Public Health 16 (16), 2951–51. doi:10.3390/ijerph16162951
Gouyon, A. (2003) “Rewarding the upland poor for environmental services: a review of initiatives from developed countries,”. Bogor Indonesia: Southeast Asia Regional Office: Word Agroforestry Centre ICRAF.
Guan, X., Liu, W., and Chen, M. (2016). Study on the ecological compensation standard for river basin water environment based on total pollutants control. Ecol. Indic. 69 (10), 446–452. doi:10.1016/j.ecolind.2016.05.011
Gui, H., Xue, J., Li, Y., and Chen, L. (2022). Research on carbon emissions reduction strategy considering government subsidy and free riding behavior. Environ. Eng. Sci. 39 (4), 329–341. doi:10.1089/ees.2021.0192
Guo, W. B., Chen, R. X., and Zhang, S. R. (2023). Analysis of the modernization level of beijing-tianjin metropolitan dairy farming industry based on analytic hierarchy process (AHP). Chin. Livest. Poult. Breed. Industry 19 (05), 53–60. doi:10.3969/j.issn.1673-4556.2023.05.0112
Guo, K., Li, S., Wang, Z., Shi, J., Bai, J., and Cheng, J. (2021a). Impact of regional green development strategy on environmental total factor productivity: evidence from the Yangtze River economic belt, China. Int. J. Environ. Res. Public Health 18 (5), 2496. doi:10.3390/ijerph18052496
Guo, K., Li, S., Wang, Z., Shi, J., Bai, J., and Cheng, J. (2021b). Impact of regional green development strategy on environmental total factor productivity: evidence from the Yangtze River economic belt, China. Int. J. Environ. Res. Public Health 18 (5), 2496. doi:10.3390/ijerph18052496
He, W., Zhang, Ke, Kong, Y., Yuan, L., Peng, Q., Mulugeta Degefu, D., et al. (2023). Reduction pathways identification of agricultural water pollution in Hubei Province, China. Ecol. Indic. 153, 110464. doi:10.1016/j.ecolind.2023.110464
Hintze, J. L., and Nelson, R. D. (1998). Violin plots: a box plot-density trace synergism. Stat 52 (2), 181–184. doi:10.2307/2685478
Huang, X. (2023). Transboundary watershed pollution control analysis for pollution abatement and ecological compensation. Environ. Sci. Pollut. Res. Int. 30 (15), 44025–44042. doi:10.1007/s11356-023-25177-4
Huang, X., Qiu, W., Dai, X., and Hua, W. (2022). Evaluation of the synergy degree of watershed collaborative governance: a case study of taihu basin, China. Water 14 (19), 2981. doi:10.3390/w14192981
Jiangyi, L., and Shiquan, D. (2022a). Eco-compensation in China: achievement, experience, and improvement. Environ. Sci. Pollut. Res. Int. 29 (40), 60867–60884. doi:10.1007/s11356-022-20181-6
Jiangyi, L., and Shiquan, D. (2022b). Eco-compensation in China: achievement, experience, and improvement. Environ. Sci. Pollut. Res. Int. 29 (40), 60867–60884. doi:10.1007/s11356-022-20181-6
Jones, L., Reis, S., Hutchins, M., Miller, J., He, B., Seifert-Dähnn, I., et al. (2022). Airsheds, watersheds and more – the flows that drive intra-extra-urban connections, and their implications for nature-based solutions (NBS). Nature-based solutions 2 (0), 100040. doi:10.1016/j.nbsj.2022.100040
Jost, F., and Gentes, I. (2014). “Payment schemes for environmental services: challenges and pitfalls with respect to effectiveness, efficiency and equity,” in Forests and rural development (Berlin: Springer), 241–263. doi:10.1007/978-3-642-41404-6_9
Kang, S., Kroeger, T., Shemie, D., Echavarria, M., Montalvo, T., Bremer, L. L., et al. (2023). Investing in nature-based solutions: cost profiles of collective-action watershed investment programs. Ecosyst. Serv. 59, 101507. doi:10.1016/j.ecoser.2022.101507
Li, S., Shen, J., Sun, F., Jia, Y., and Han, H. (2022). Quantitative evaluation of ecological compensation policies for the watershed in China: based on the improved Policy Modeling Consistency Index. Environ. Sci. Pollut. Res. Int. 29 (44), 66659–66674. doi:10.1007/s11356-022-20503-8
Li, Y., Wang, W., Liu, B. X., and Zhou, X. (2015). Research on oil spill risk of port tank zone based on fuzzy comprehensive evaluation. Aquat. Procedia 3, 216–223. doi:10.1016/j.aqpro.2015.02.214
Liu, L., Chen, J., Wang, C., and Wang, Q. (2023). Quantitative evaluation of China's basin ecological compensation policies based on the PMC index model. Environ. Sci. Pollut. Res. Int. 30 (7), 17532–17545. doi:10.1007/s11356-022-23354-5
Liu, Y., and Yuan, L. (2023). Study on the influencing factors and profitability of horizontal ecological compensation mechanism in Yellow River Basin of China. Environ. Sci. Pollut. Res. Int. 30 (37), 87353–87367. doi:10.1007/s11356-023-28243-z
Lopez, P. G., Stringer, L. C., and Quinn, C. H. (2019). Corruption and conflicts as barriers to adaptive governance: Water governance in dryland systems in the Rio del Carmen watershed. Sci. Total Environ. 660, 519–530. doi:10.1016/j.scitotenv.2019.01.030
Maryati, S. (2018). Identification of flood prone areas for natural disaster mitigation using geospatial approach (A case study in bone bolango regency, gorontalo province). IOP Conf. Ser. 145, 012080. doi:10.1088/1755-1315/145/1/012080
Maryati, S., Suly Eraku, S., and Kasim, M. (2018). Conservation management of agriculture land using geospatial approach (A case study in the bone watershed, gorontalo province, Indonesia). E3S web Conf. 0 (0), 08009–8010. doi:10.1051/e3sconf/20183108009
Mcdermott, M., Mahanty, S., and Schreckenberg, K. (2013). Examining equity: a multidimensional framework for assessing equity in payments for ecosystem services. Environ. Sci. Policy 33, 416–427. doi:10.1016/j.envsci.2012.10.006
MEE (2023). Environmental quality standards for surface water. Available at: https://www.mee.gov.cn/ywgz/fgbz/bz/bzwb/shjbh/shjzlbz/200206/t20020601_66497.shtml (Accessed on August 21, 2023).
Meng, Y., Liu, M., Guan, X., and Liu, W. (2019). Comprehensive evaluation of ecological compensation effect in the Xiaohong River Basin, China. Environ. Sci. Pollut. Res. Int. 26 (8), 7793–7803. doi:10.1007/s11356-019-04208-z
Murray, B. C., and Abt, R. C. (2001). Estimating price compensation requirements for eco-certified forestry. Ecol. Econ. 36 (1), 149–163. doi:10.1016/S0921-8009(00)00224-X
Patode, R. S., Pande, C. B., Nagdeve, M. B., Moharir, K. N., and Wankhade, R. M. (2017). Planning of conservation measures for watershed management and development by using geospatial technology – a case study of patur watershed in akola district of Maharashtra. Curr. World Environ. 12 (3), 706–714. doi:10.12944/cwe.12.3.22
Quan, T., Zhang, H., Li, J., and Lu, B. (2023). Horizontal ecological compensation mechanism and green low-carbon development in river basins: evidence from Xin’an River basin. Environ. Sci. Pollut. Res. Int. 30 (38), 88463–88480. doi:10.1007/s11356-023-28679-3
Riedl, C., Böhmann, T., Rosemann, M., and Krcmar, H. (2009). Quality management in service ecosystems. Inf. Syst. E-Bus Manage. 7, 199–221. doi:10.1007/s10257-008-0080-6
Vargas, L. G. (1990). An overview of the analytic hierarchy process and its applications. Eur. J. Operational Res. 48 (1), 2–8. doi:10.1016/0377-2217(90)90056-H
Wang, H. J., Bi, F. F., and Dong, Z. F. (2020). Evaluation of ecological compensation policy for xin’an River Basin based on AHP-fuzzy comprehensive method. Acta Ecol. Sin. 40 (20), 7493–7506. [in Chinese]. doi:10.5846/stxb201907311613
Wang, Q., Shi, N. N., Han, Y., and Xiao, N. W. (2021). Establishment of an indicator system for comprehensive assessment on terrestrial biodiversity in China. Ying Yong Sheng Tai Xue Bao 32 (8), 2773–2782. doi:10.13287/j.1001-9332.202108.004
Wang, X., and Nuppenau, E.-A. (2021). Modelling payments for ecosystem services for solving future water conflicts at spatial scales: the Okavango River Basin example. Ecol. Econ. 184 (0), 106982. doi:10.1016/j.ecolecon.2021.106982
Yang, Y., Yao, C., and Xu, D. (2020). Ecological compensation standards of national scenic spots in western China: a case study of Taibai Mountain. Tour. Manag. 76 (2), 103950–104017. doi:10.1016/j.tourman.2019.103950
Yeow Law, Ji, Long, L. A., Kaleita, A. L., Helmers, M., Brendel, C., van der Woude, K., et al. (2022). Stacked conservation practices reduce nitrogen loss: a paired watershed study. J. Environ. Manag. 302 (0), 114053. doi:10.1016/j.jenvman.2021.114053
Yu, B., and Chen, L. (2020). Interventional impacts of watershed ecological compensation on regional economic differences: evidence from Xin’an River, China. Int. J. Environ. Res. Public Health 17 (17), 6389. doi:10.3390/ijerph17176389
Yuan, L., Liu, C., Wu, X., He, W., Kong, Y., Degefu, D. M., et al. (2023). A set pair analysis method for assessing and forecasting water conflict risk in transboundary River basins. Water Resour. Manage 38 (2), 775–791. doi:10.1007/s11269-023-03698-4
Zhang, J., Sun, Y., and Zhu, M. M. (2022b). Policy effects evaluation of ecological compensation of wei river stream. Resour. Industries 24 (02), 64–75. [in Chinese ]. doi:10.13776/j.cnki.resourcesindustries.20210903.002
Zhang, Y., Fan, X., and Zhang, B. (2023). Can raising environmental tax reduce industrial water pollution? Firm-level evidence from China. Environ. Impact Assess. Rev. 101, 107155. doi:10.1016/j.eiar.2023.107155
Zhang, Z., Xiong, C., Yang, Y., Liang, C., and Jiang, S. (2022a). What makes the river chief system in China viable? Examples from the huaihe River Basin. Sustainability 14 (10), 6329. doi:10.3390/su14106329
Zhao, Y., Wu, F. P., Li, F., Chen, X. n., Xu, X., and Shao, Z. y. (2021). Ecological compensation standard of trans-boundary River Basin based on ecological spillover value: a case study for the lancang-mekong River Basin. Int. J. Environ. Res. Public Health 18 (3), 1251. doi:10.3390/ijerph18031251
Zheng, Q., Wan, L., Wang, S., Wang, C., and Fang, W. (2021a). Does ecological compensation have a spillover effect on industrial structure upgrading? Evidence from China based on a multi-stage dynamic DID approach. J. Environ. Manage 294, 112934. doi:10.1016/j.jenvman.2021.112934
Zheng, Q., Wan, L., Wang, S., Wang, C., and Fang, W. (2021b). Does ecological compensation have a spillover effect on industrial structure upgrading? Evidence from China based on a multi-stage dynamic DID approach. J. Environ. Manage 294, 112934. doi:10.1016/j.jenvman.2021.112934
Zhou, Z., Sun, X., Zhang, X., and Wang, Y. (2022). Inter-regional ecological compensation in the Yellow River Basin based on the value of ecosystem services. J. Environ. Manage 322, 116073. doi:10.1016/j.jenvman.2022.116073
Keywords: watershed ecological compensation, sustainability, evaluation model, analytic hierarchy process, empirical research, huai river basin
Citation: Xue K, Yang Y and Huang Z (2024) Implementation effectiveness evaluation of watershed ecological compensation policy for sustainability based on the Huai river Basin in China. Front. Environ. Sci. 12:1344942. doi: 10.3389/fenvs.2024.1344942
Received: 27 November 2023; Accepted: 13 May 2024;
Published: 30 May 2024.
Edited by:
Athanasios Angelis-Dimakis, University of Huddersfield, United KingdomReviewed by:
Liang Yuan, China Three Gorges University, ChinaWeijun He, China Three Gorges University, China
Chuloh Jung, Prince Mohammad bin Fahd University, Saudi Arabia
Copyright © 2024 Xue, Yang and Huang. This is an open-access article distributed under the terms of the Creative Commons Attribution License (CC BY). The use, distribution or reproduction in other forums is permitted, provided the original author(s) and the copyright owner(s) are credited and that the original publication in this journal is cited, in accordance with accepted academic practice. No use, distribution or reproduction is permitted which does not comply with these terms.
*Correspondence: Yingjian Yang, eWluZ2ppYW4ueWFuZ0BsYW5tYWdlLmNvbQ==